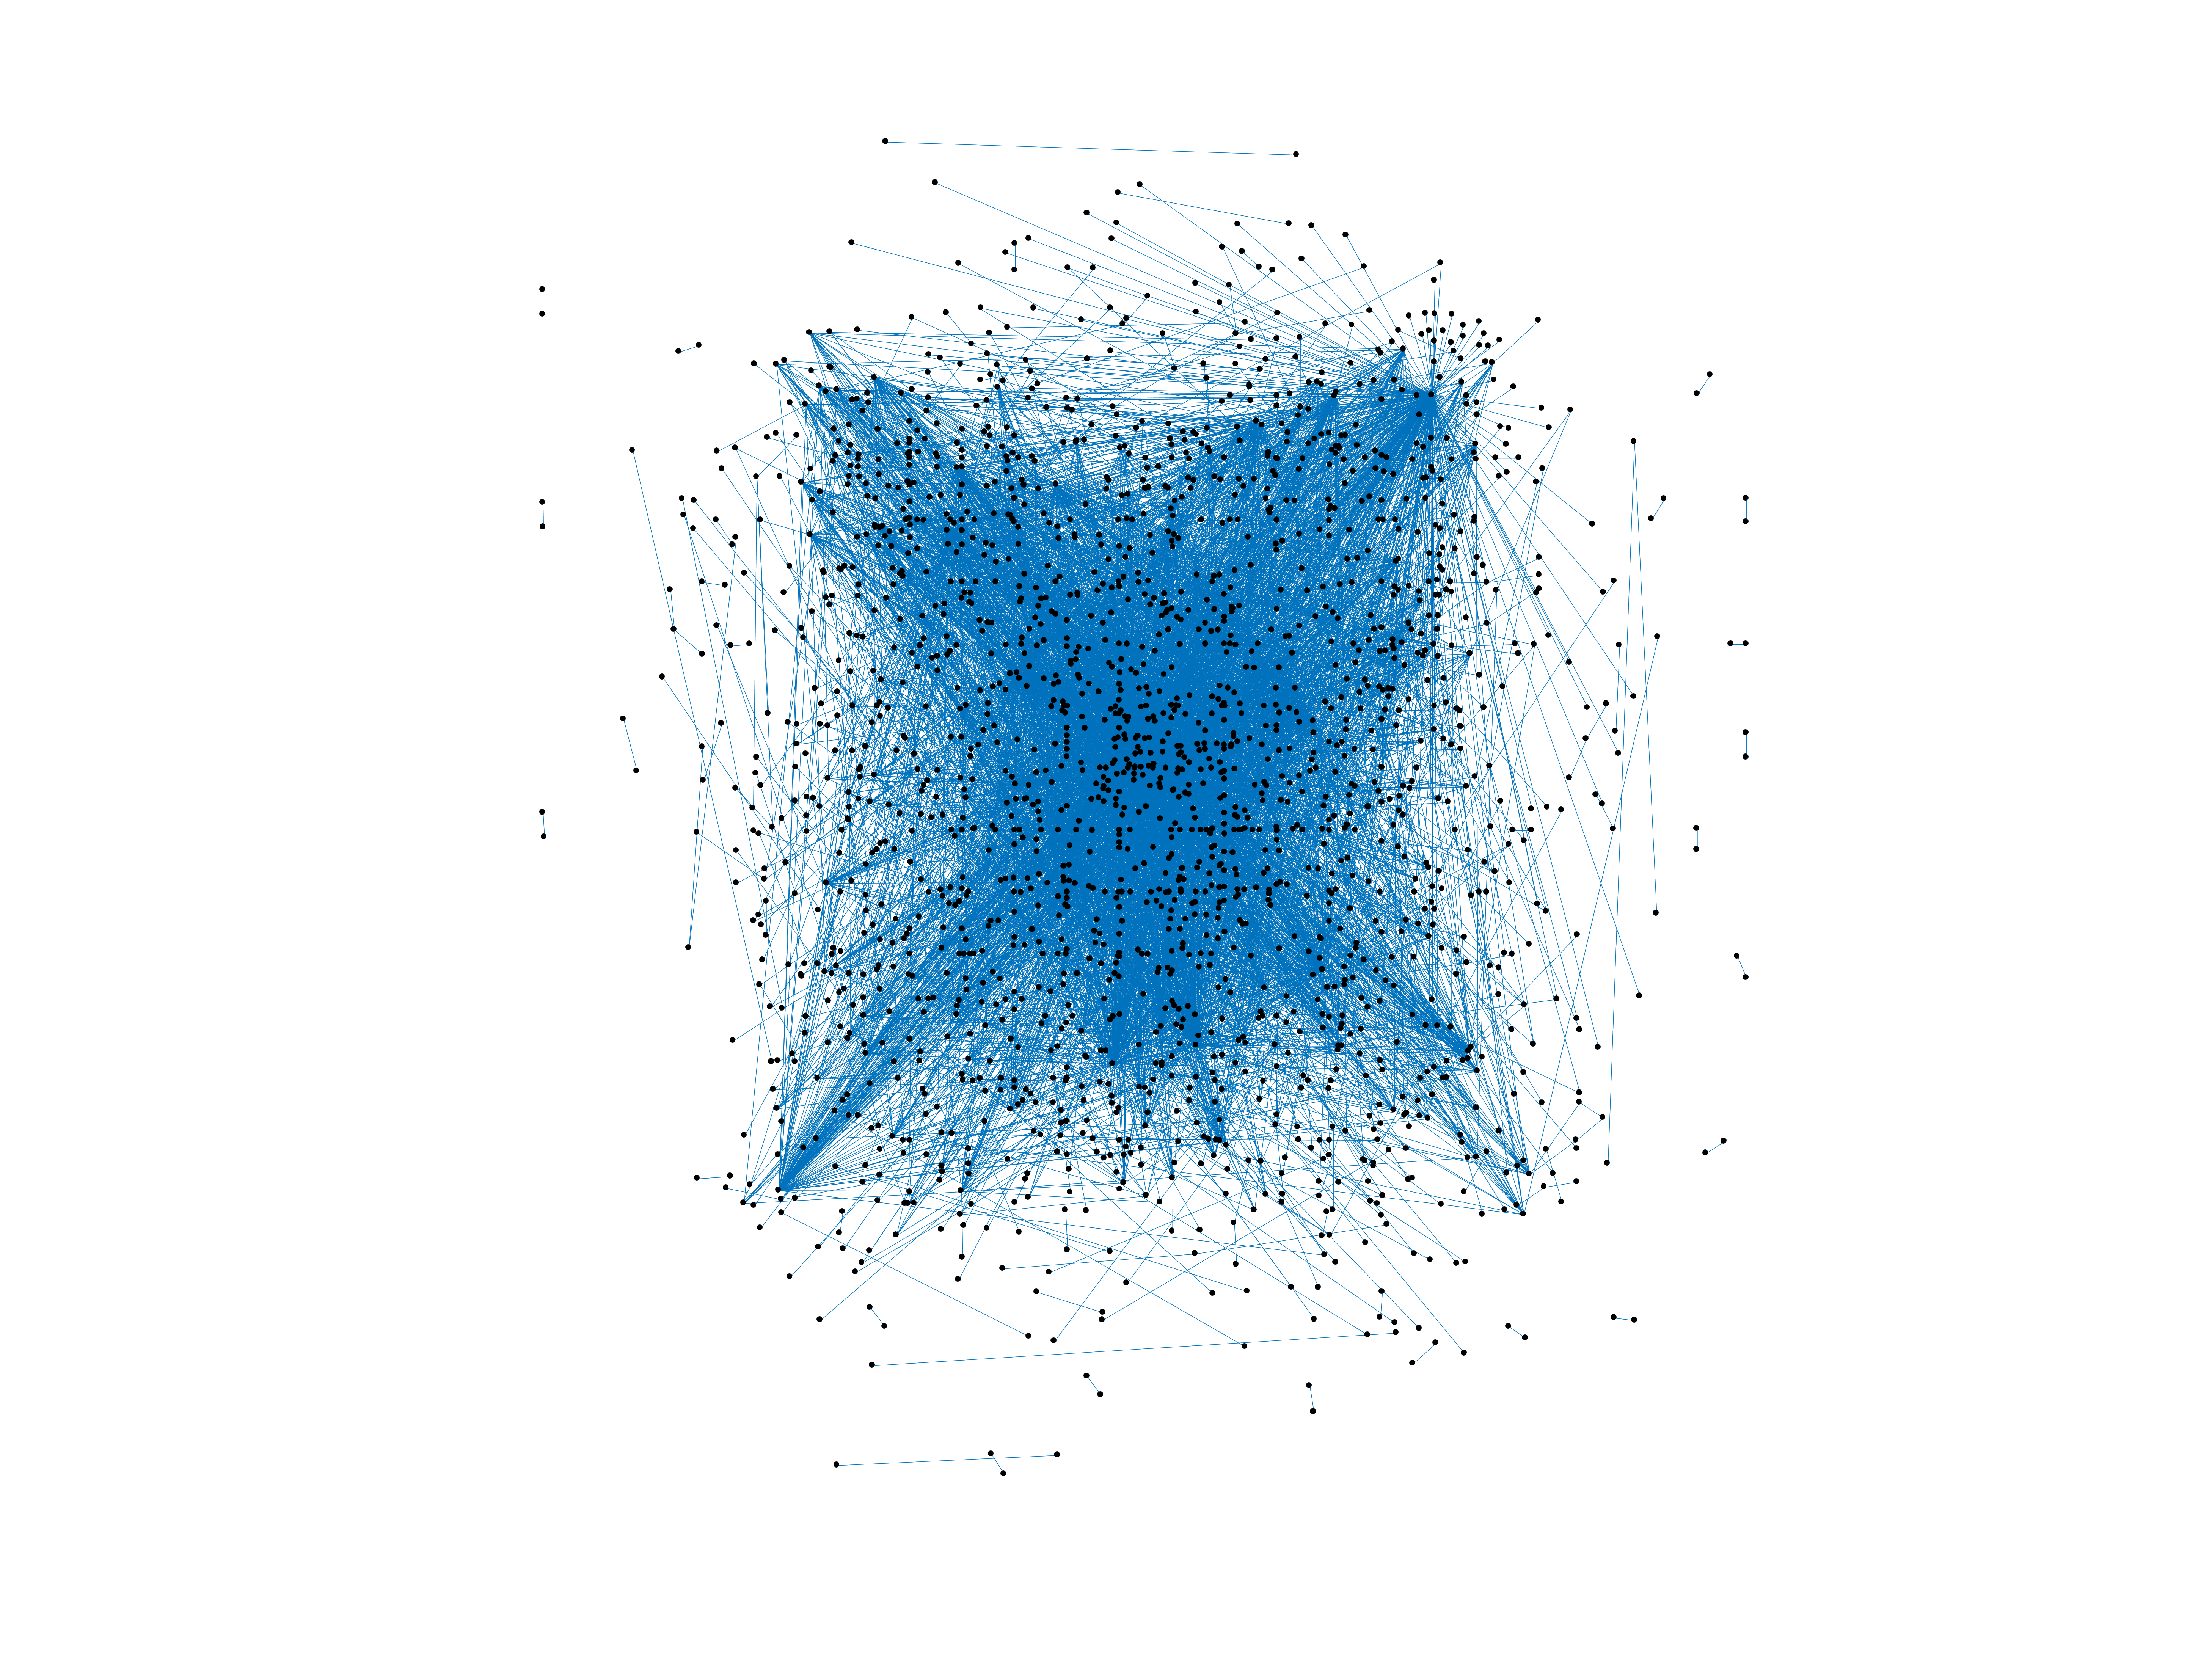
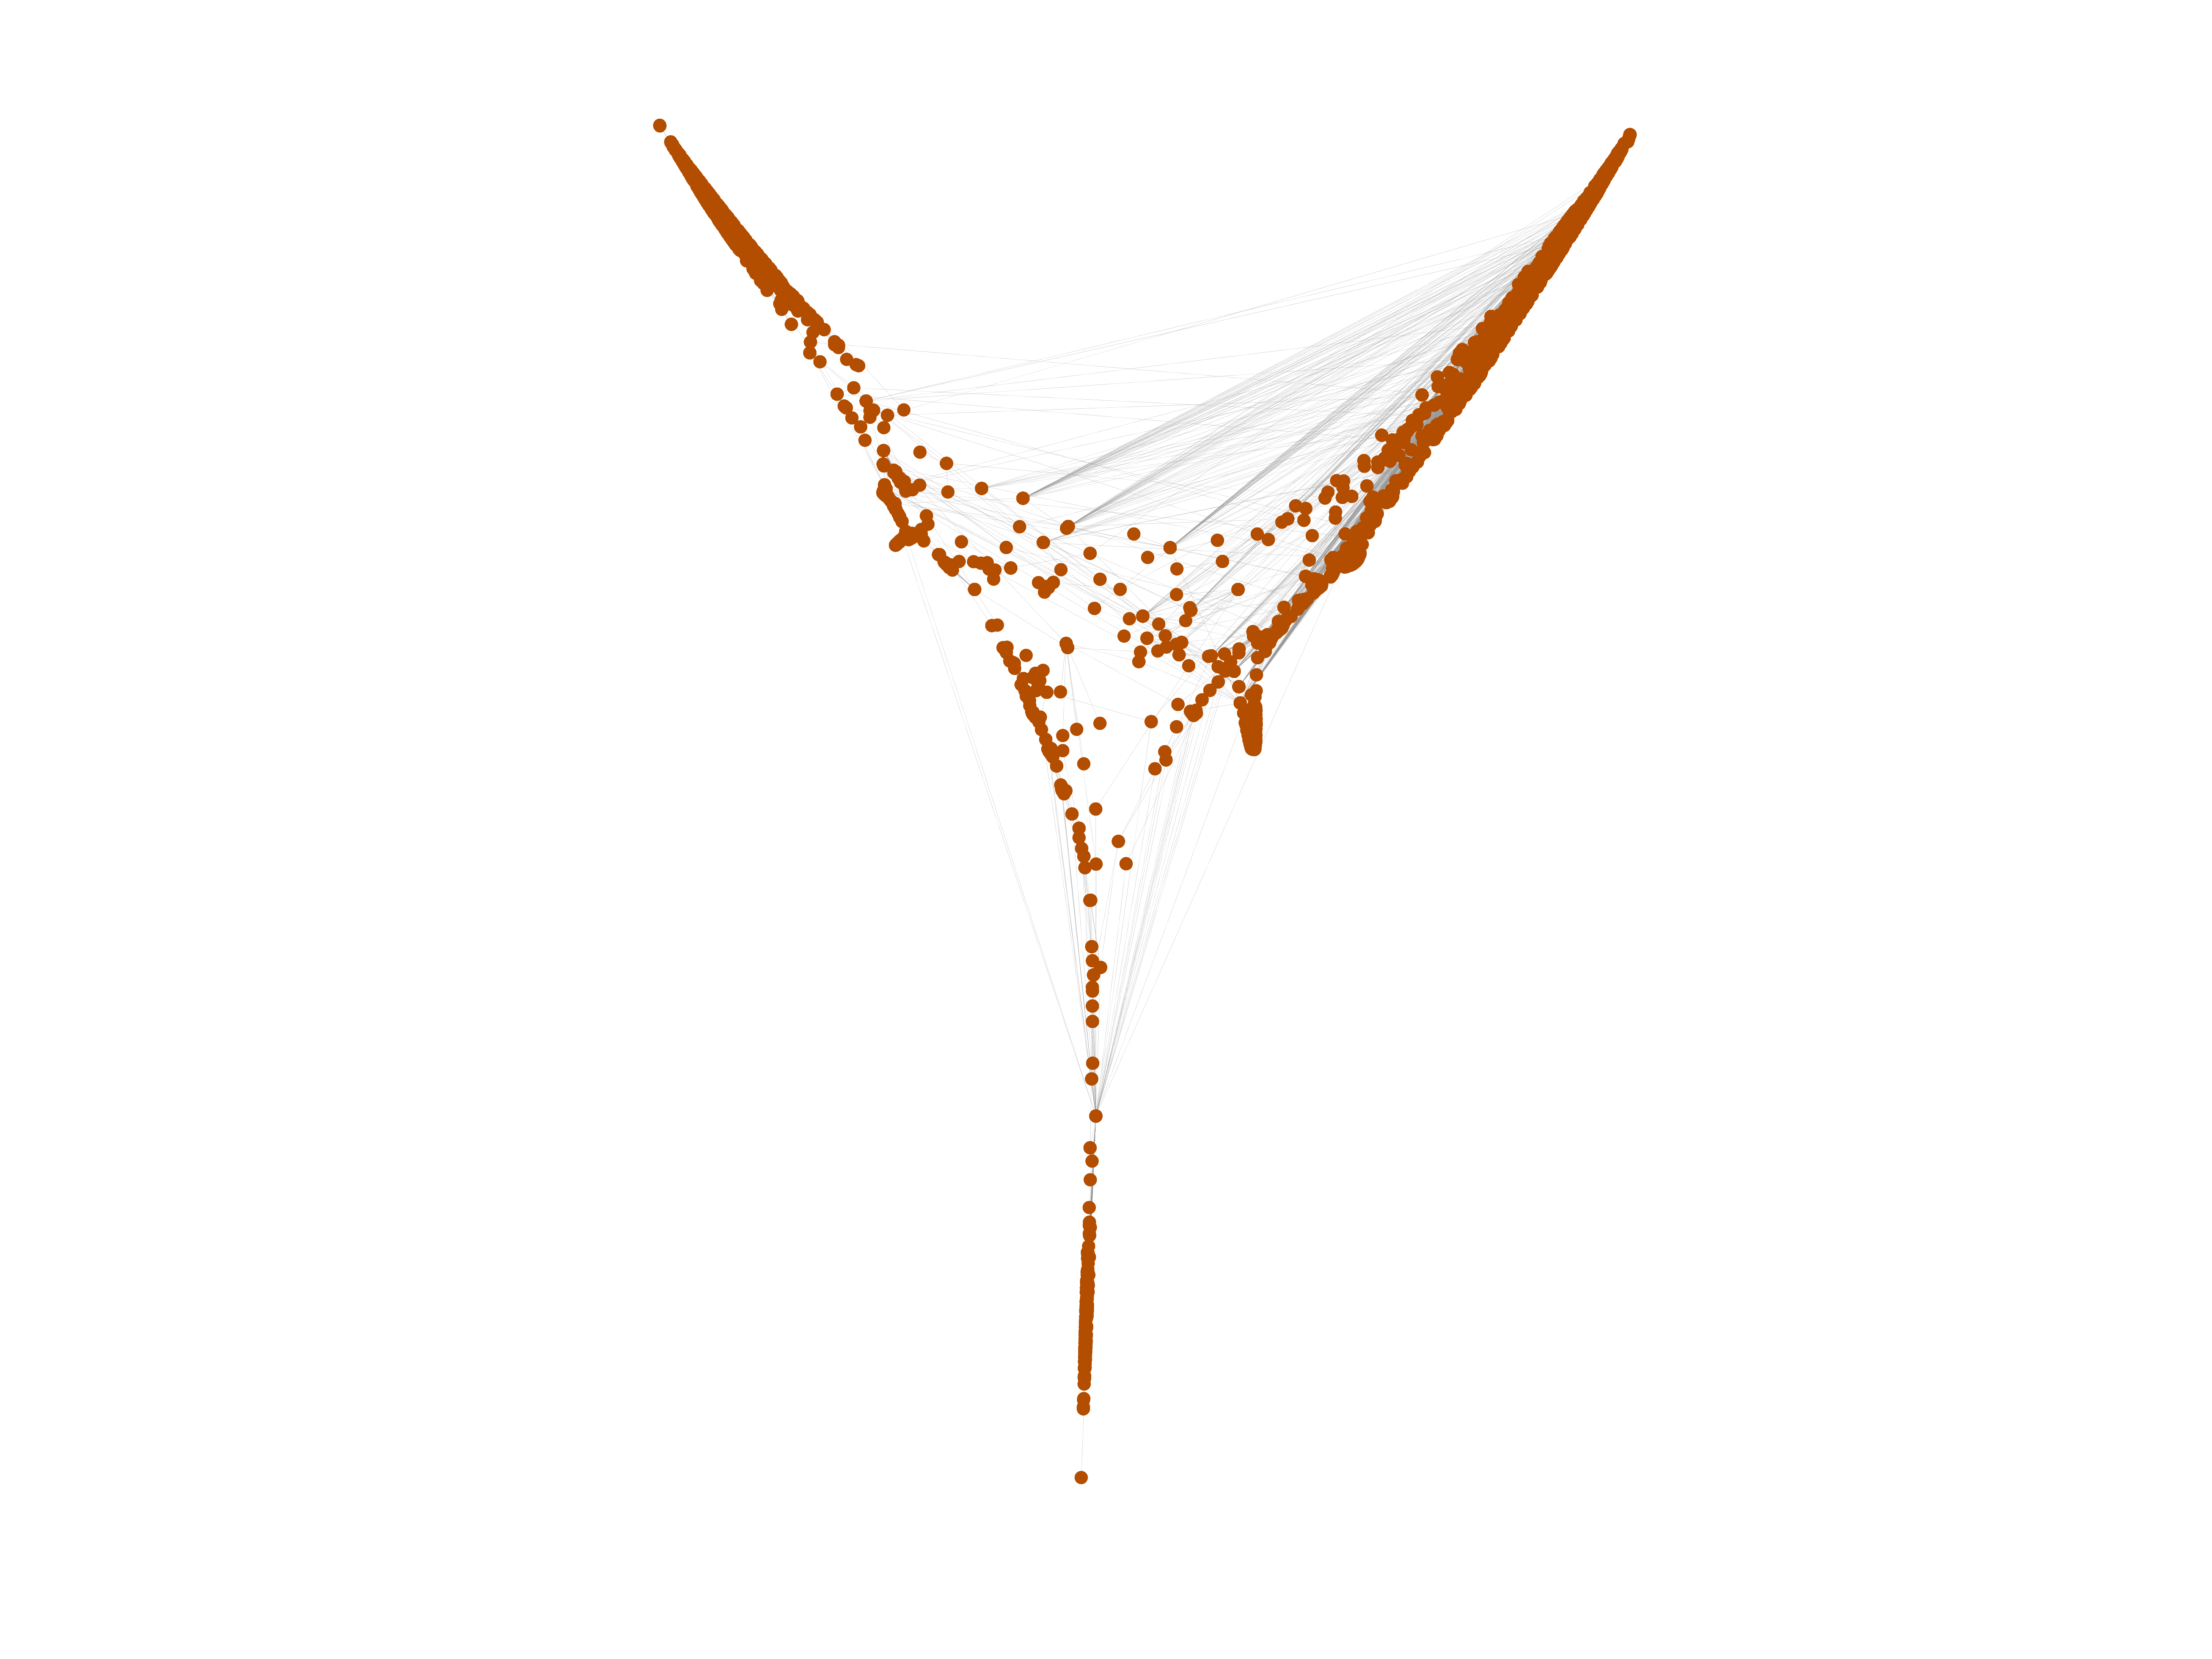
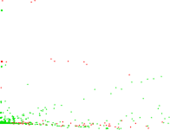
Wikipedia edits (sg)
This is the bipartite edit network of the Sango Wikipedia. It contains users
and pages from the Sango Wikipedia, connected by edit events. Each edge
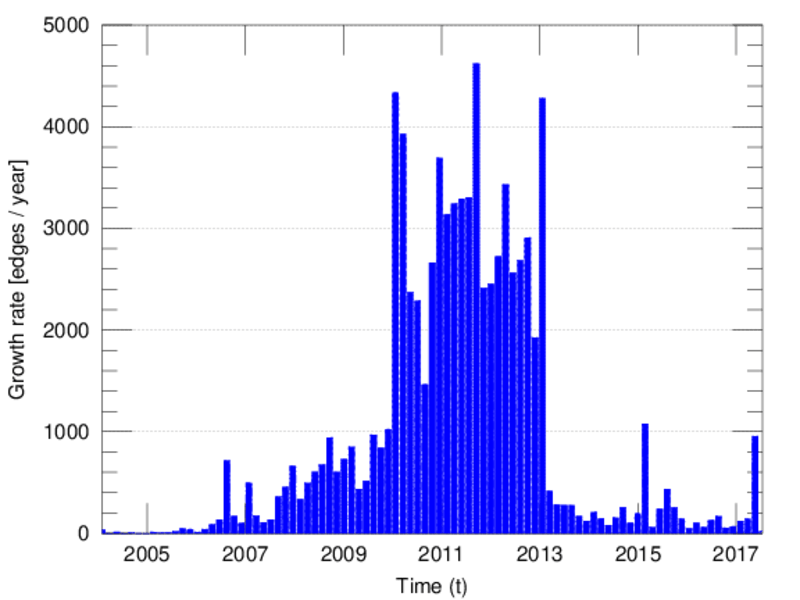
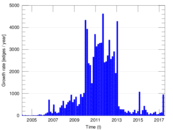
represents an edit. The dataset includes the timestamp of each edit.
Metadata
Statistics
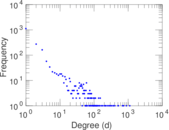
| Size | n = | 2,105
|
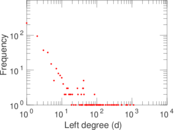
| Left size | n1 = | 533
|
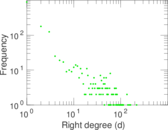
| Right size | n2 = | 1,572
|
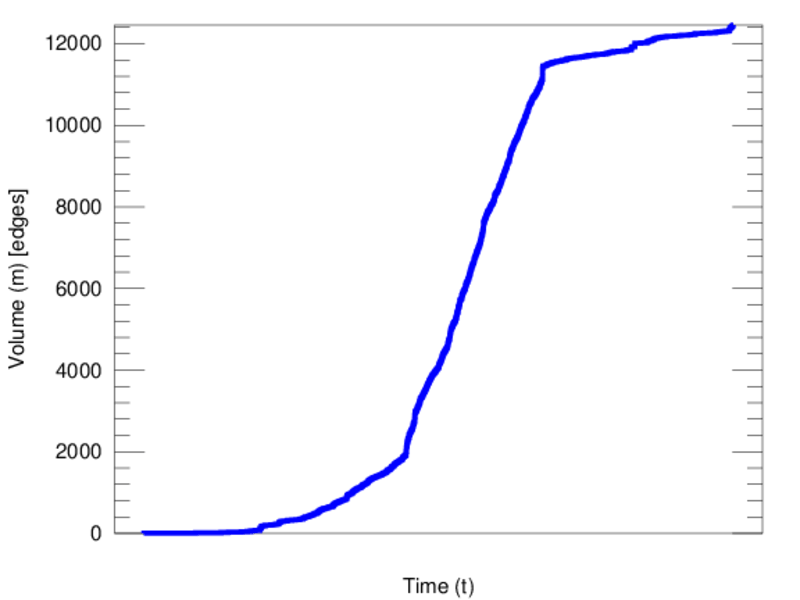
| Volume | m = | 12,456
|
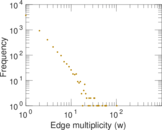
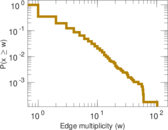
| Unique edge count | m̿ = | 5,805
|
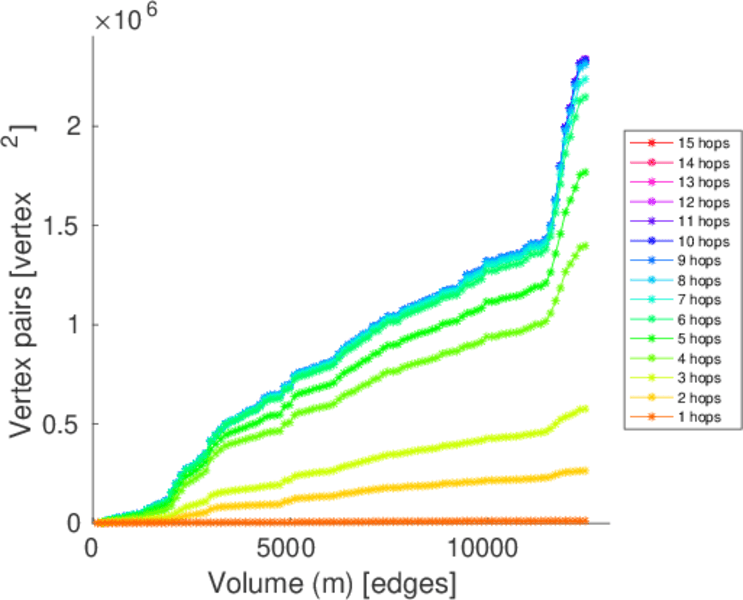
| Wedge count | s = | 329,512
|
| Claw count | z = | 17,013,776
|
| Cross count | x = | 907,290,070
|
| Square count | q = | 800,852
|
| 4-Tour count | T4 = | 7,737,834
|
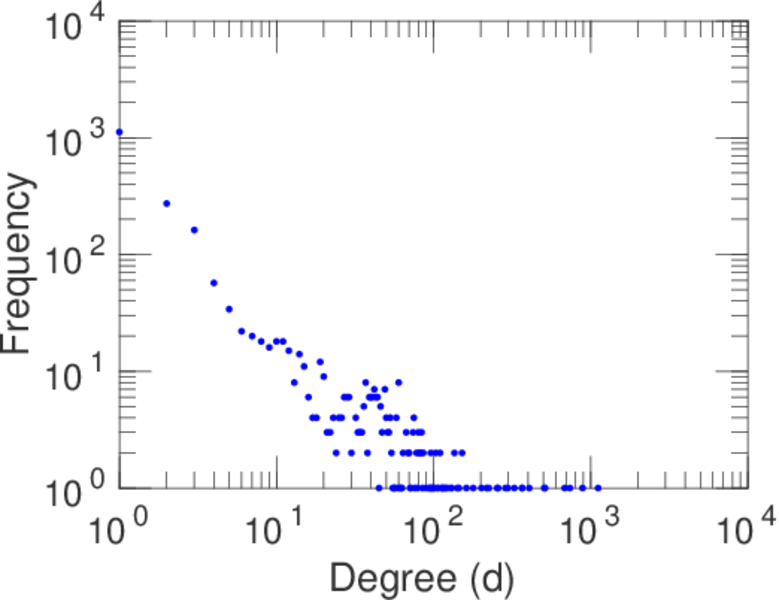
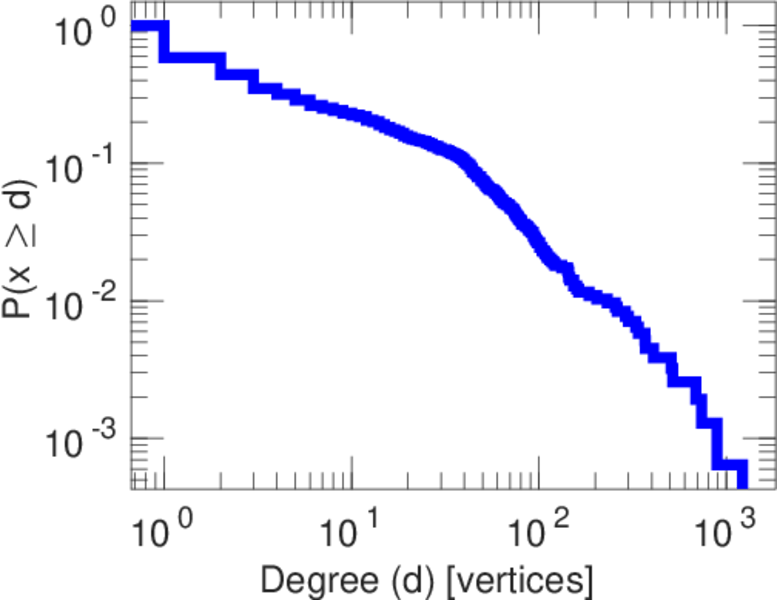
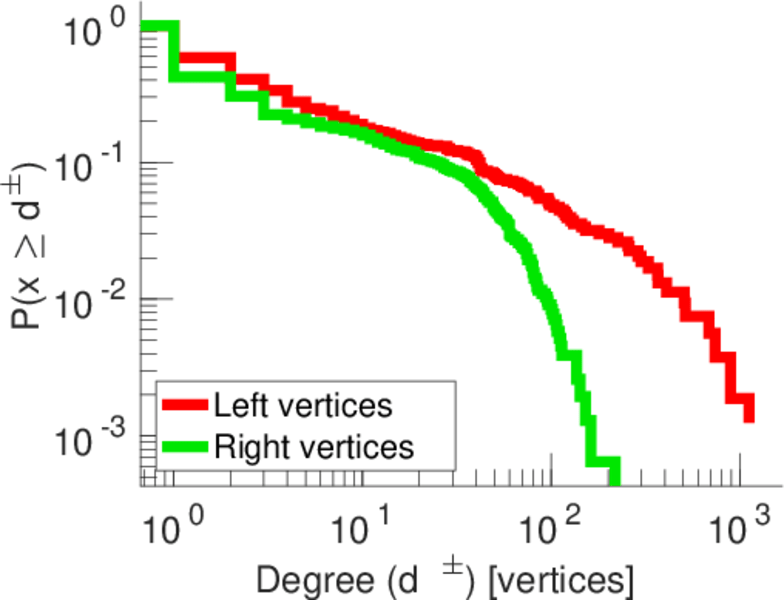
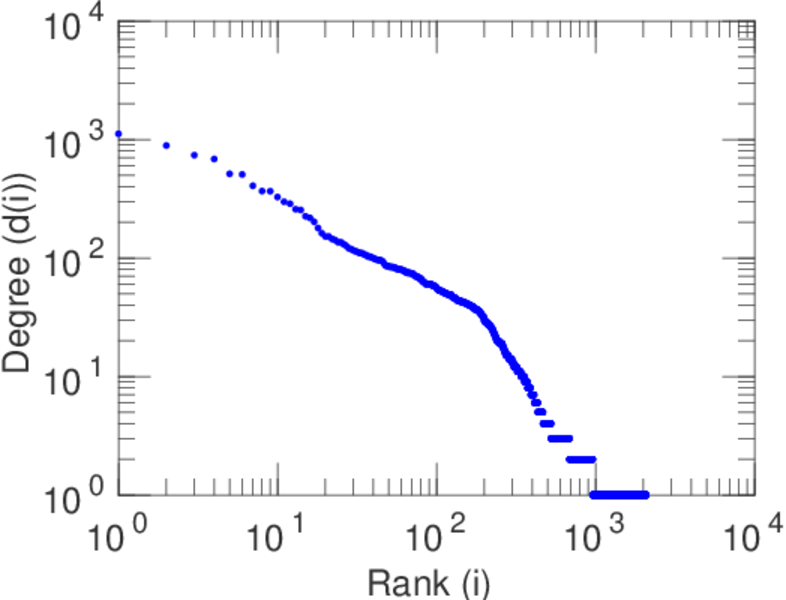
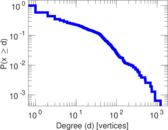
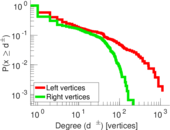
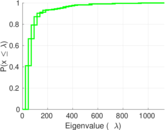
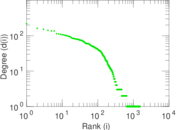
| Maximum degree | dmax = | 1,117
|
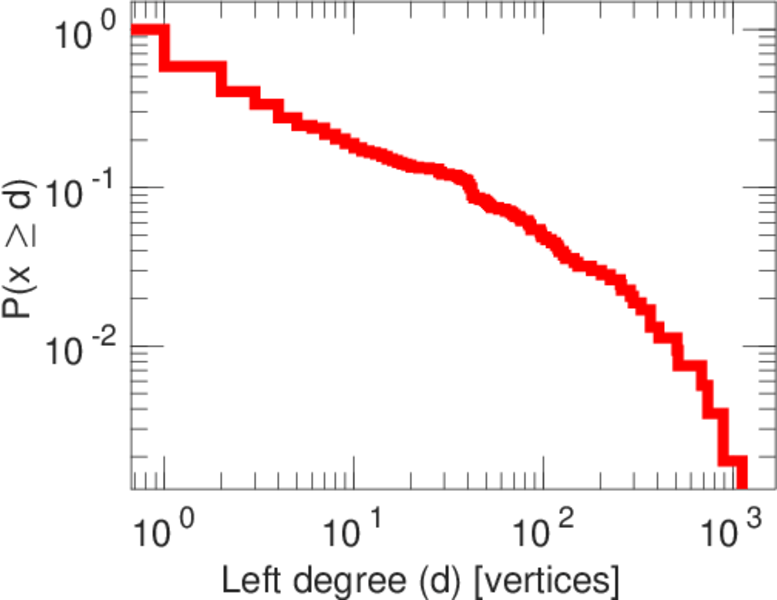
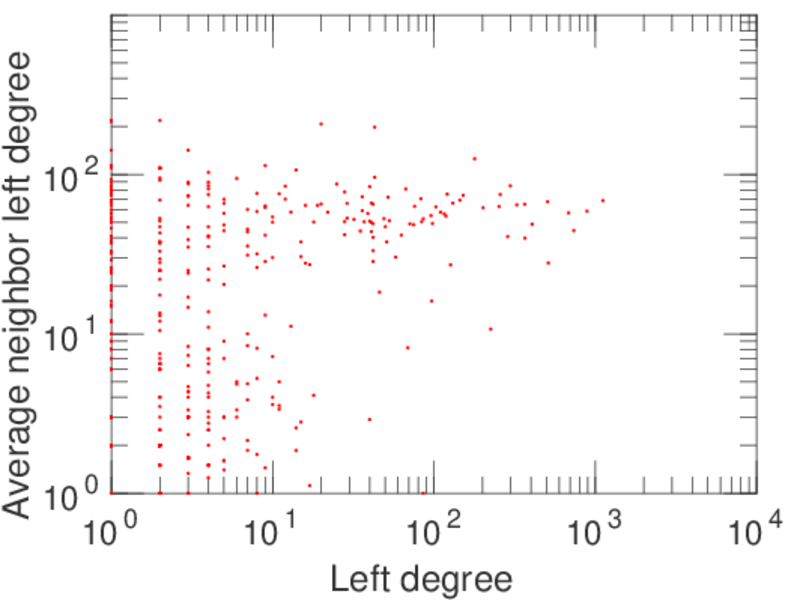
| Maximum left degree | d1max = | 1,117
|
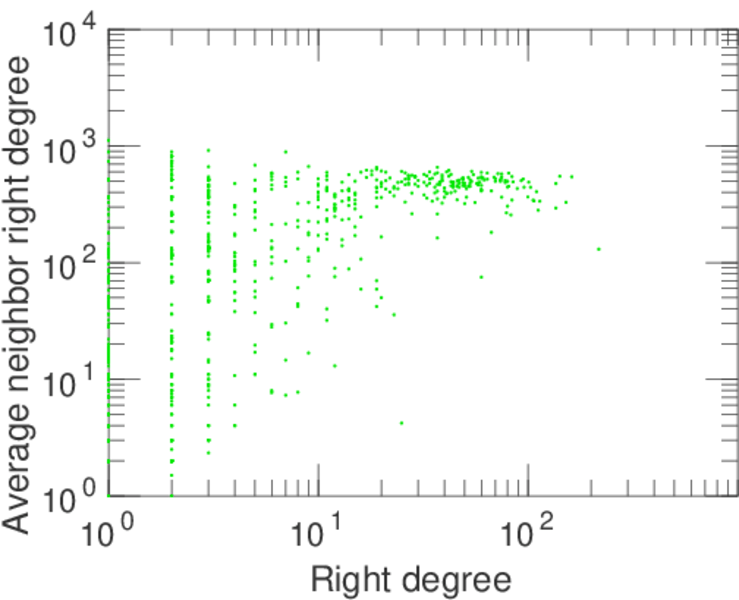
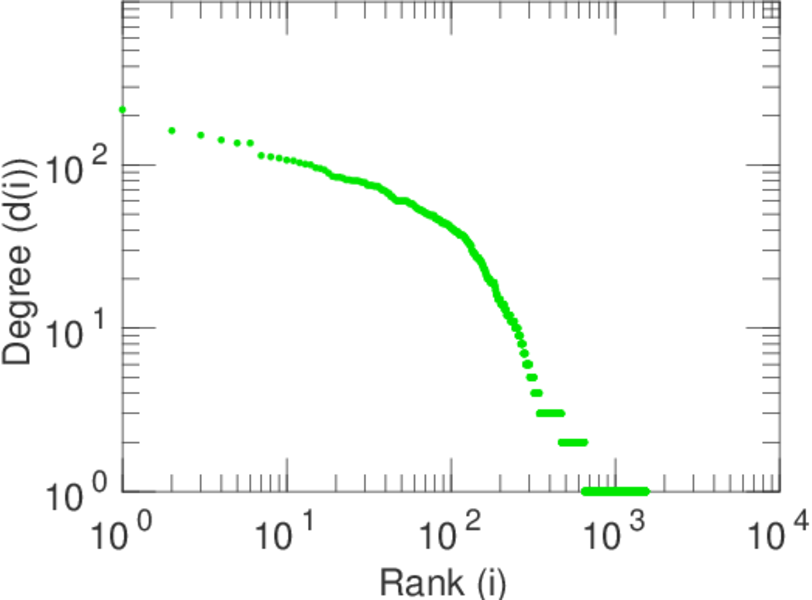
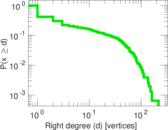
| Maximum right degree | d2max = | 218
|
| Average degree | d = | 11.834 7
|
| Average left degree | d1 = | 23.369 6
|
| Average right degree | d2 = | 7.923 66
|
| Fill | p = | 0.006 928 23
|
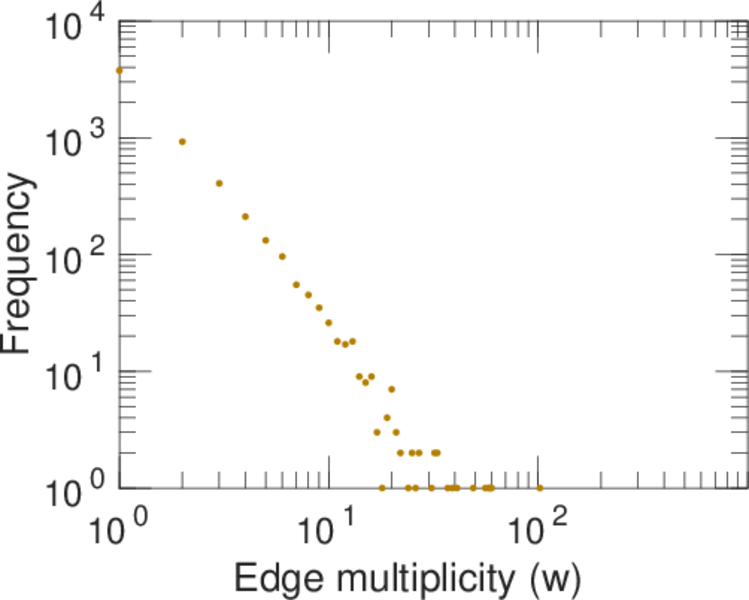
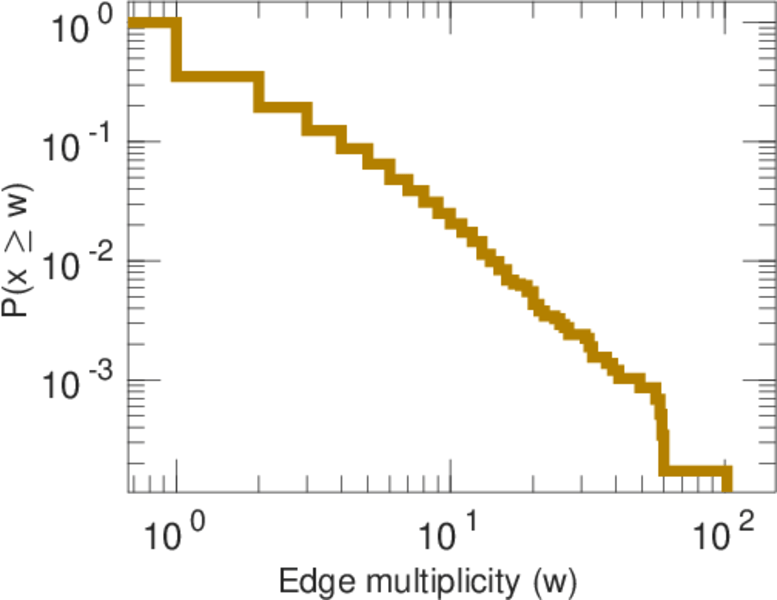
| Average edge multiplicity | m̃ = | 2.145 74
|
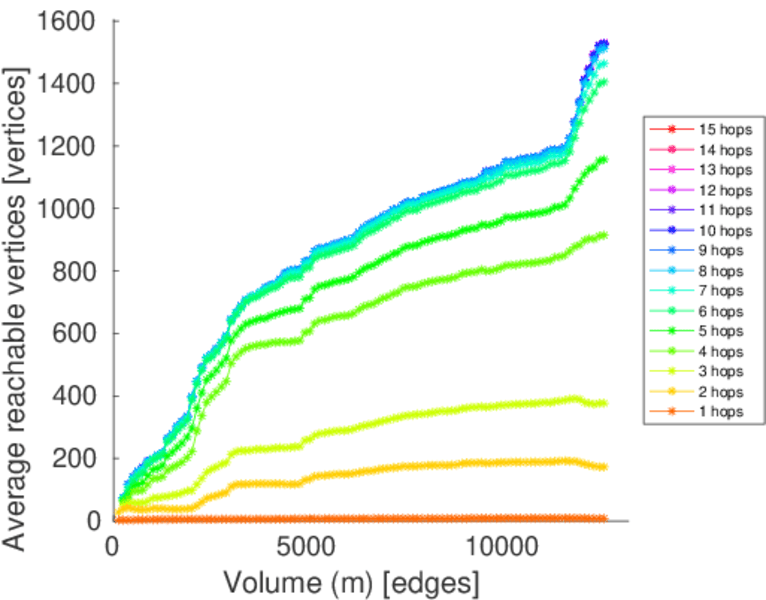
| Size of LCC | N = | 1,527
|
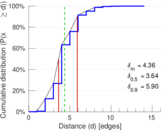
| Diameter | δ = | 14
|
| 50-Percentile effective diameter | δ0.5 = | 3.635 16
|
| 90-Percentile effective diameter | δ0.9 = | 5.904 69
|
| Median distance | δM = | 4
|
| Mean distance | δm = | 4.360 71
|
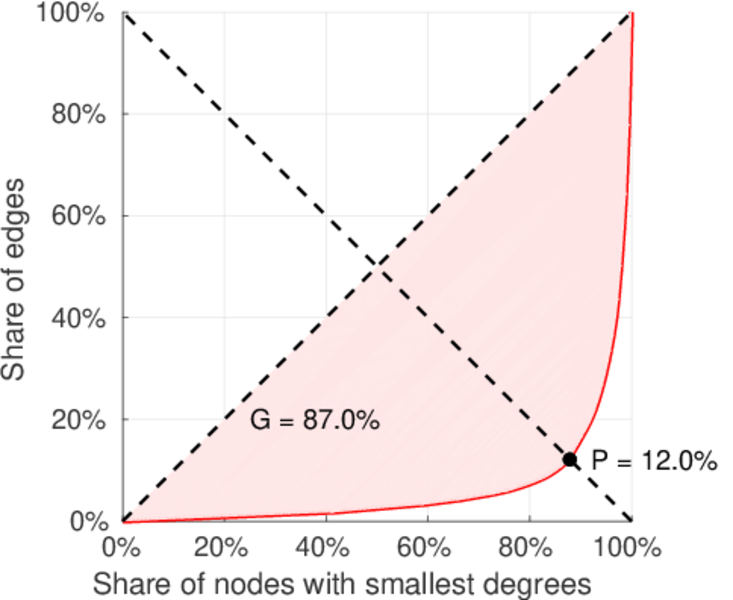
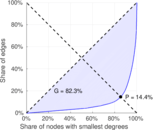
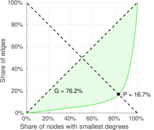
| Gini coefficient | G = | 0.811 384
|
| Balanced inequality ratio | P = | 0.160 083
|
| Left balanced inequality ratio | P1 = | 0.119 782
|
| Right balanced inequality ratio | P2 = | 0.167 469
|
| Relative edge distribution entropy | Her = | 0.822 948
|
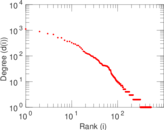
| Power law exponent | γ = | 2.516 53
|
| Tail power law exponent | γt = | 2.661 00
|
| Tail power law exponent with p | γ3 = | 2.661 00
|
| p-value | p = | 0.227 000
|
| Left tail power law exponent with p | γ3,1 = | 1.701 00
|
| Left p-value | p1 = | 0.070 000 0
|
| Right tail power law exponent with p | γ3,2 = | 6.581 00
|
| Right p-value | p2 = | 0.335 000
|
| Degree assortativity | ρ = | −0.049 059 1
|
| Degree assortativity p-value | pρ = | 0.000 184 546
|
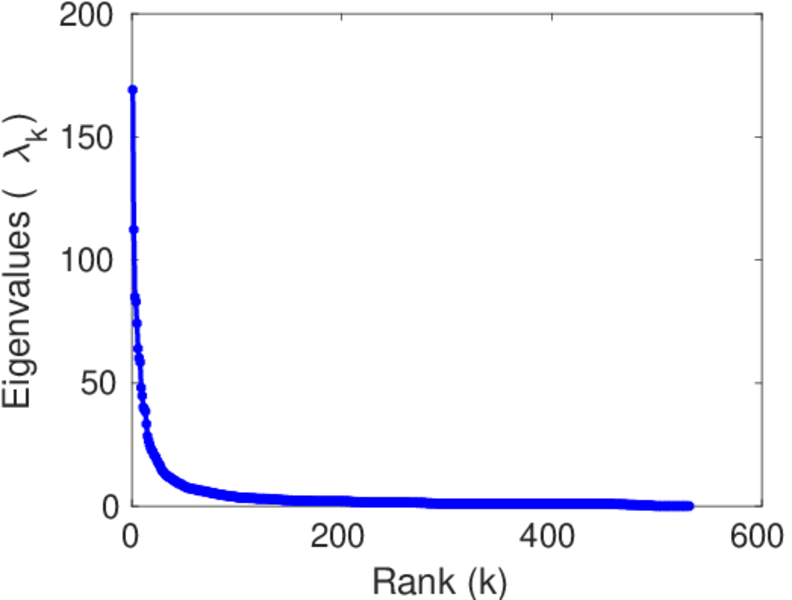
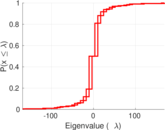
| Spectral norm | α = | 169.061
|
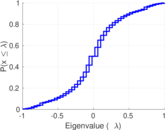
| Algebraic connectivity | a = | 0.023 830 1
|
| Spectral separation | |λ1[A] / λ2[A]| = | 1.506 04
|
| Controllability | C = | 1,083
|
| Relative controllability | Cr = | 0.521 425
|
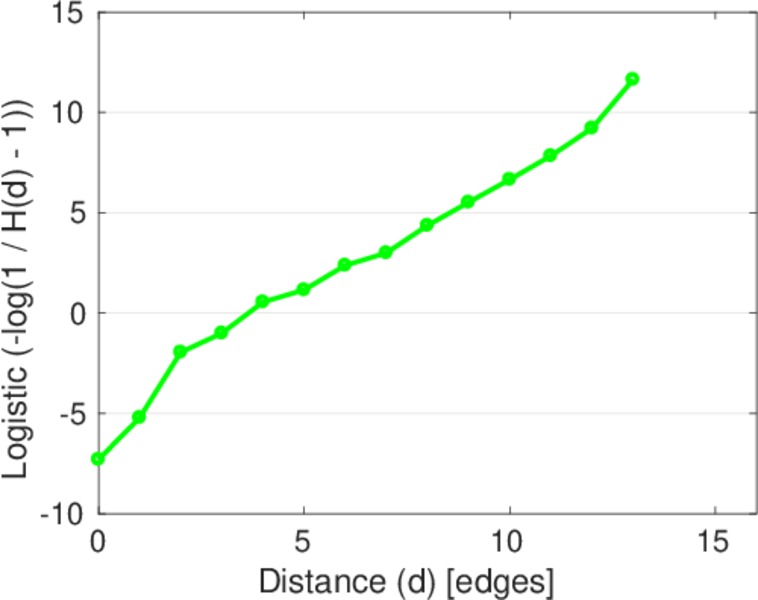
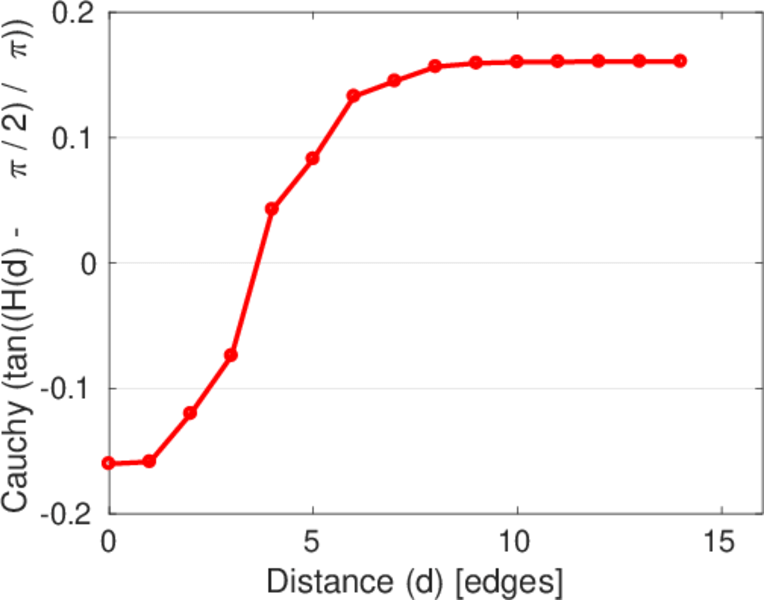
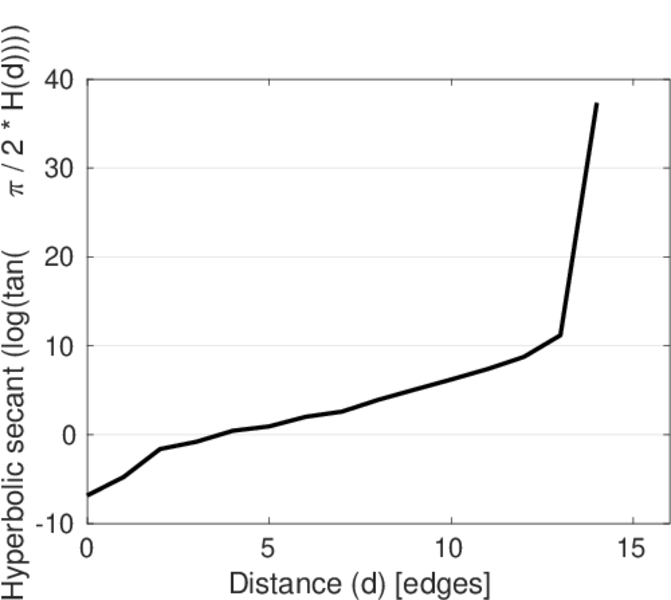
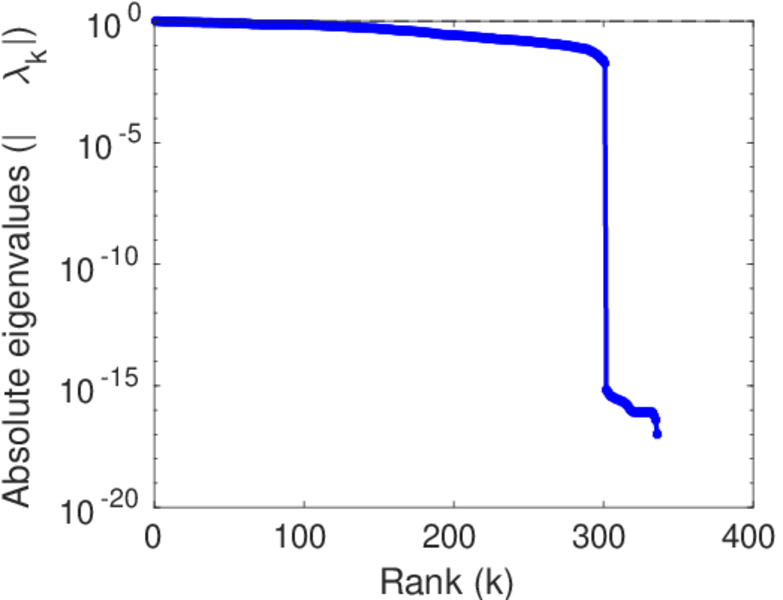
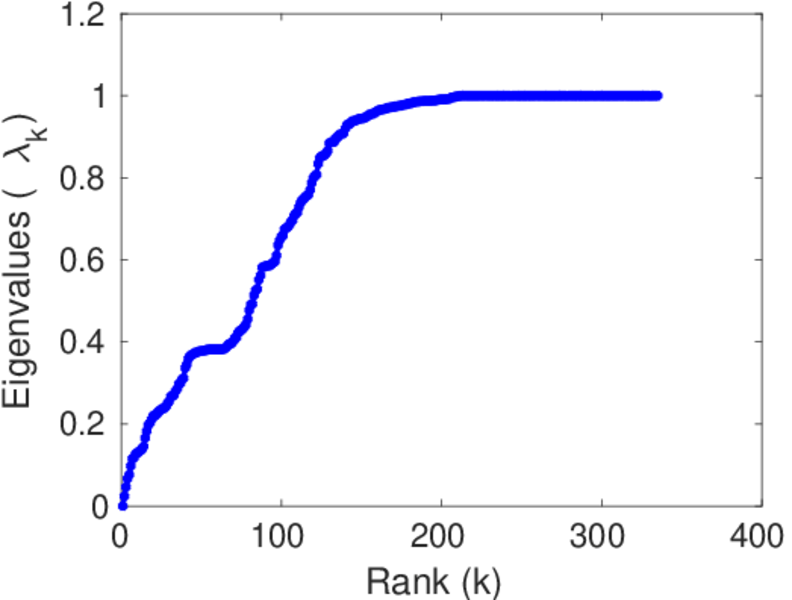
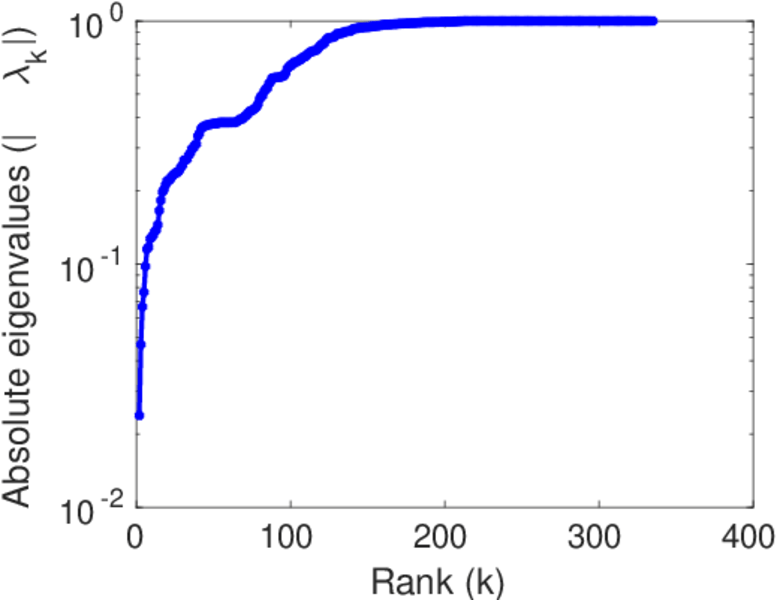
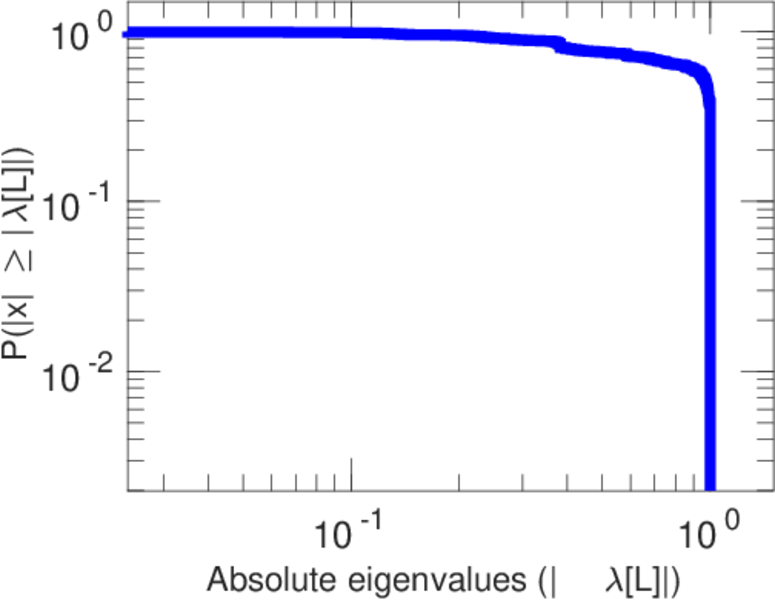
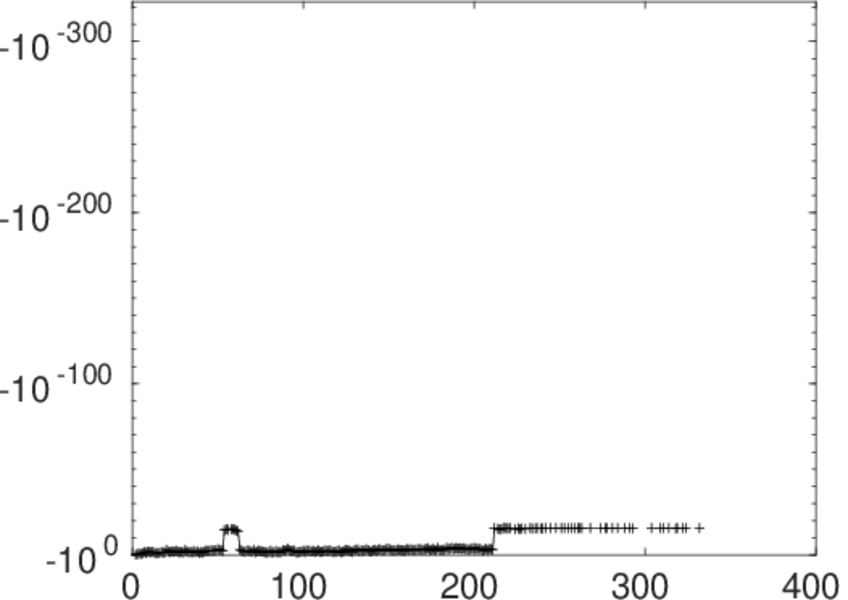
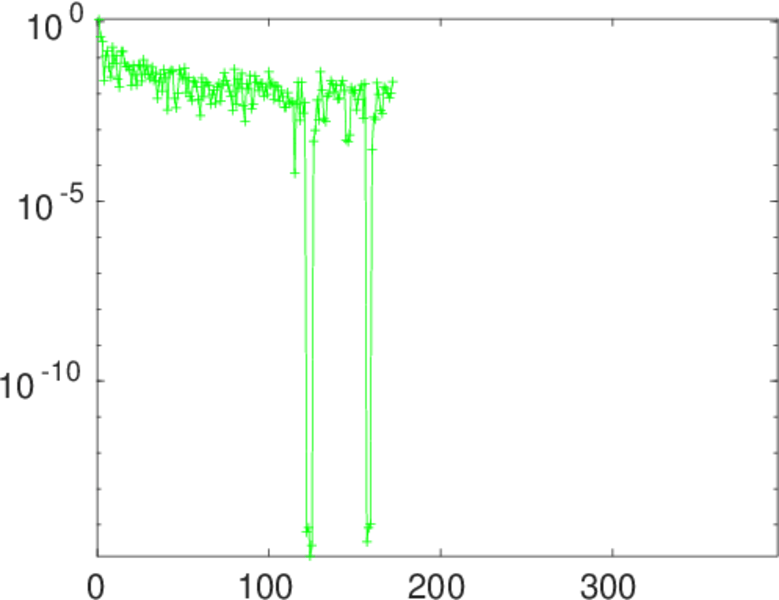
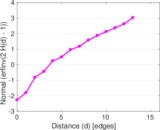
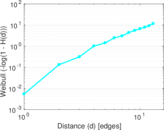
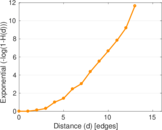
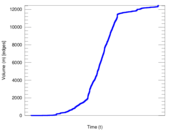
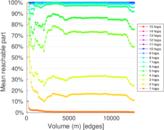
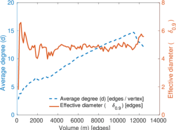
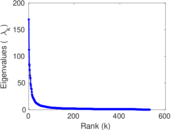
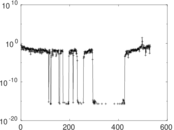
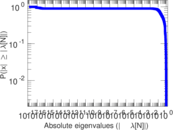
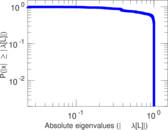
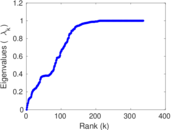
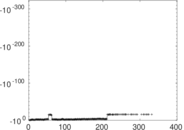
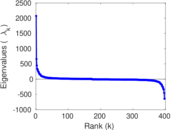
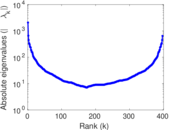
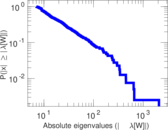
Plots


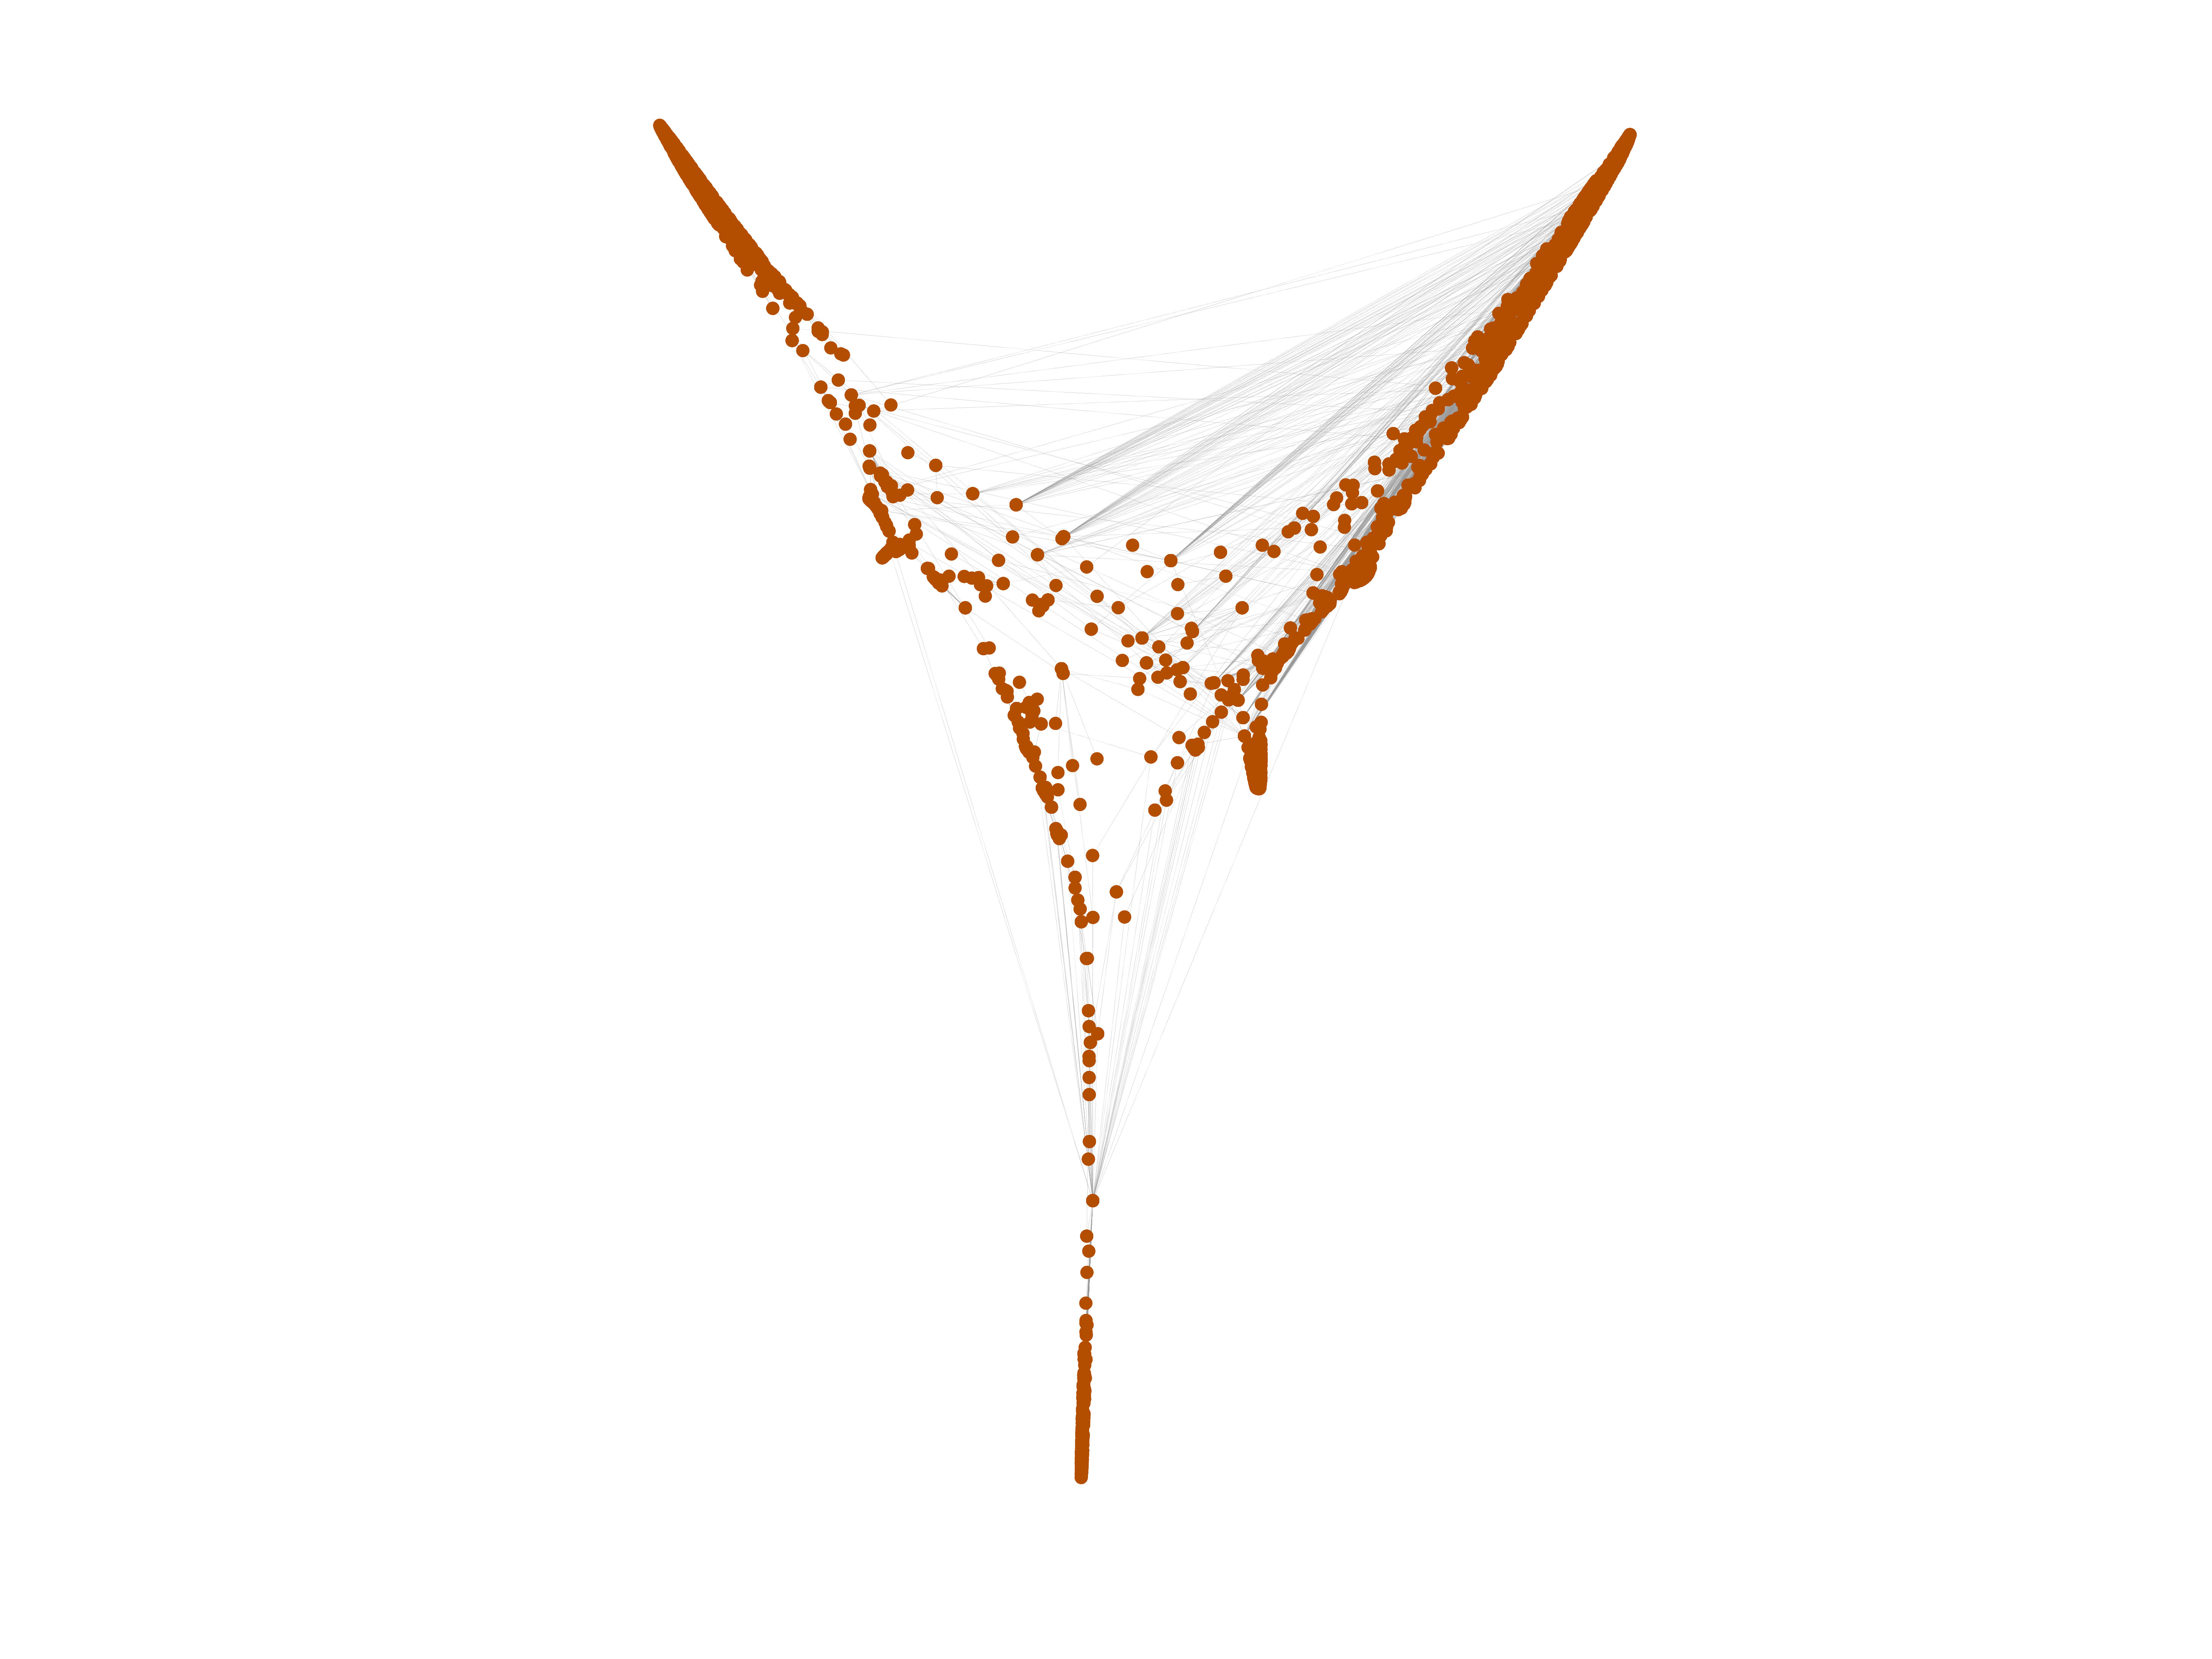
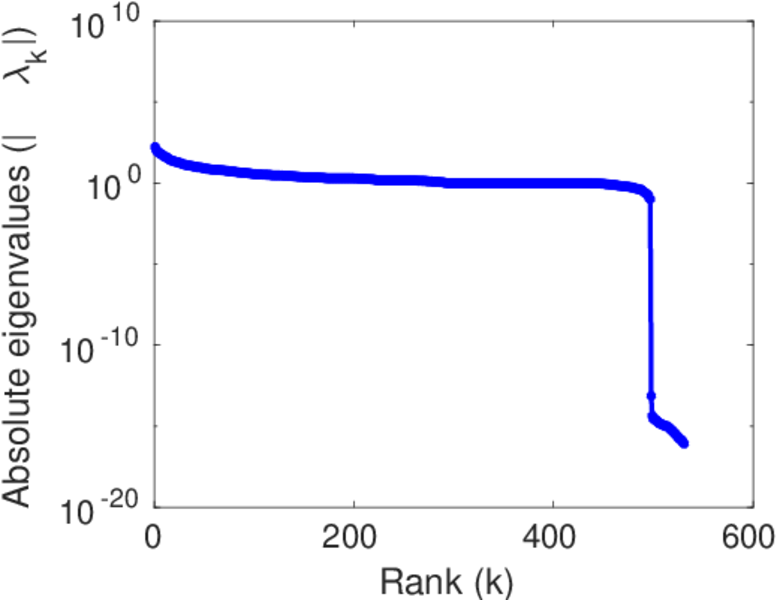
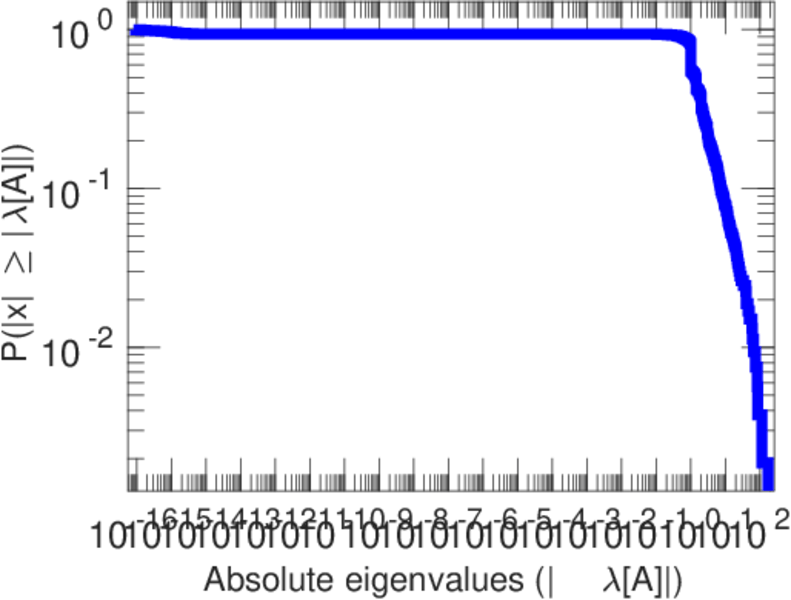
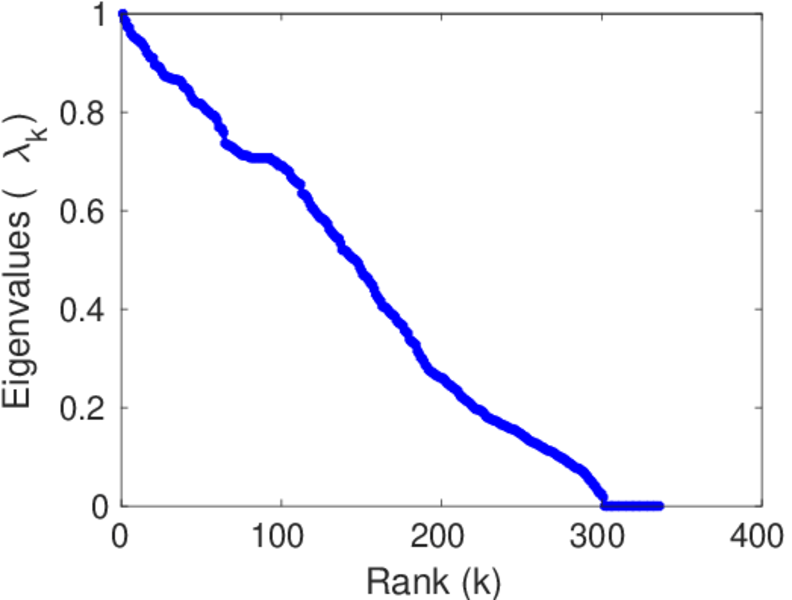
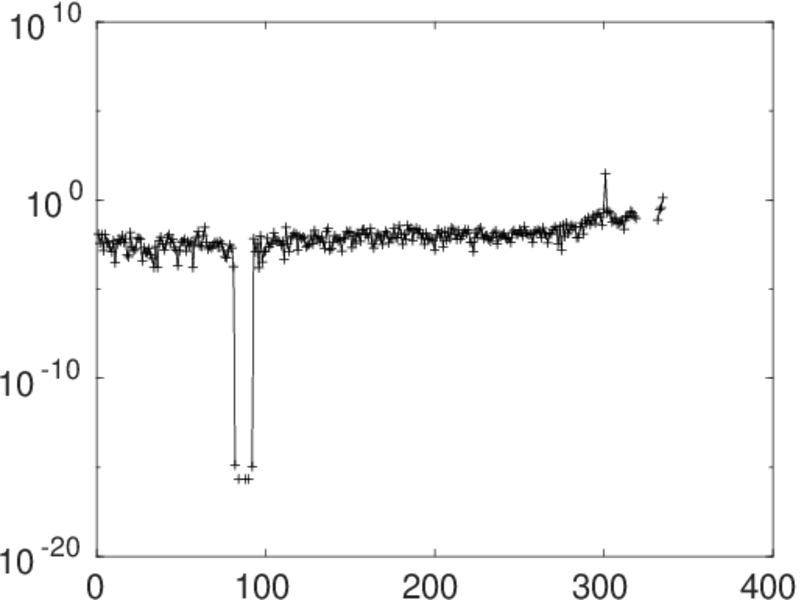
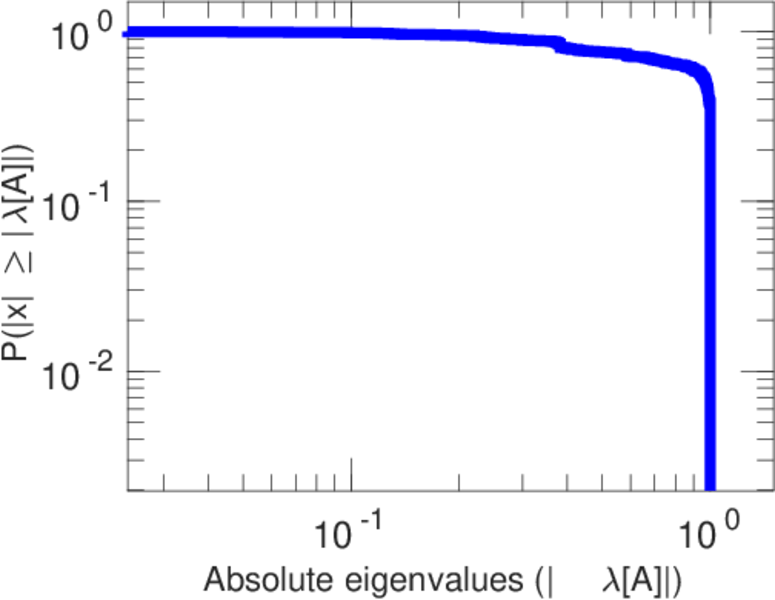
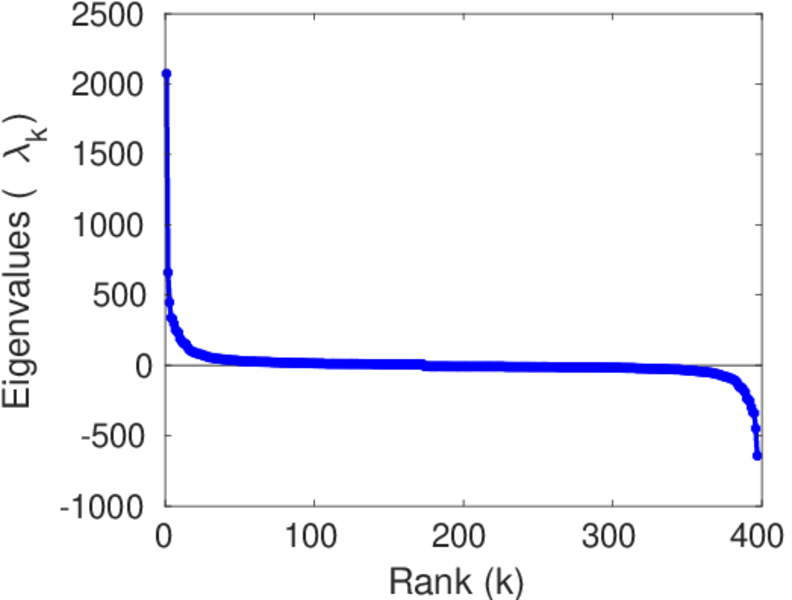
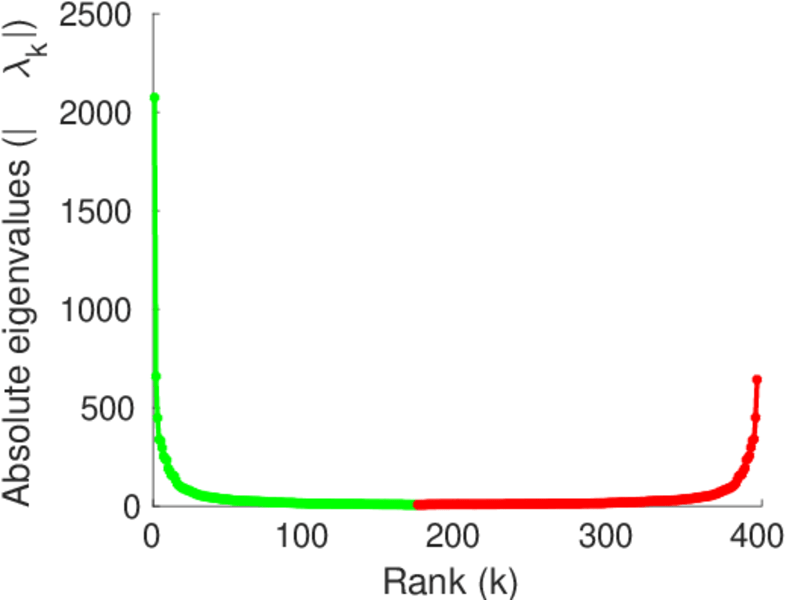
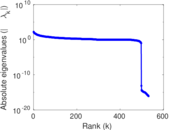
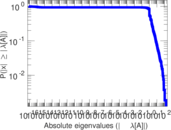
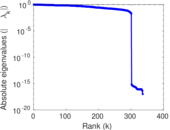
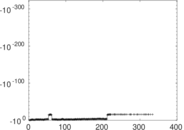
Matrix decompositions plots


Downloads
References
|
[1]
|
Jérôme Kunegis.
KONECT – The Koblenz Network Collection.
In Proc. Int. Conf. on World Wide Web Companion, pages
1343–1350, 2013.
[ http ]
|
|
[2]
|
Wikimedia Foundation.
Wikimedia downloads.
http://dumps.wikimedia.org/, January 2010.
|
 KONECT ‣ Networks ‣
Buy Me a Coffee
KONECT ‣ Networks ‣
Buy Me a Coffee