Wiktionary edits (sh)
This is the bipartite edit network of the Serbo-Croatian Wiktionary. It
contains users and pages from the Serbo-Croatian Wiktionary, connected by edit
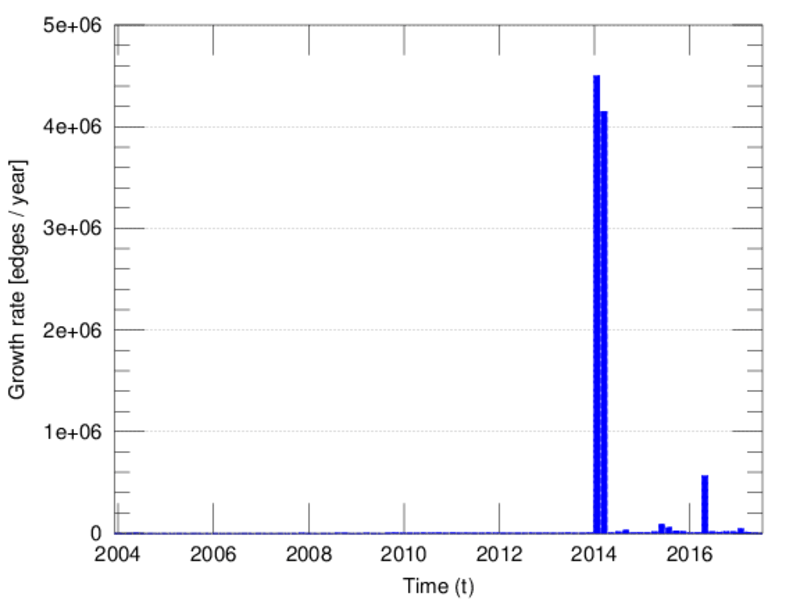
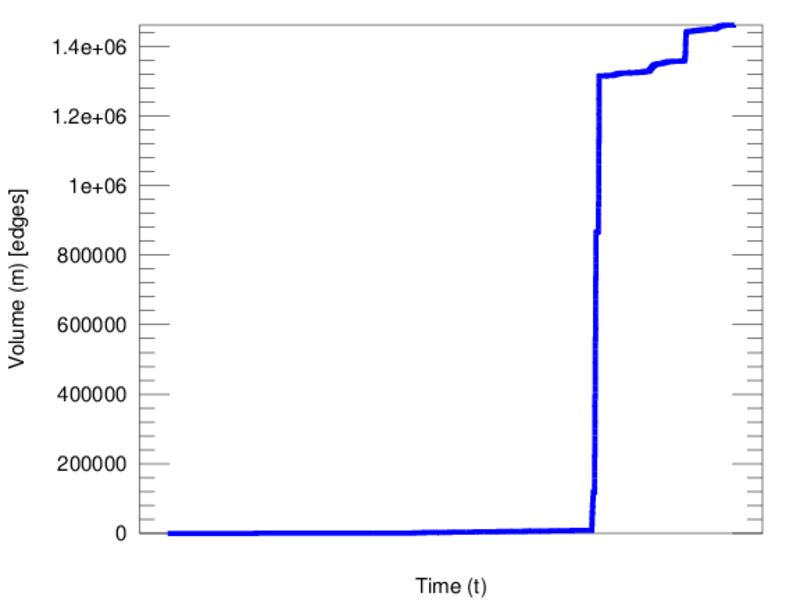
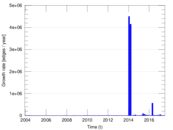
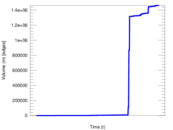
events. Each edge represents an edit. The dataset includes the timestamp of
each edit.
Metadata
Statistics
| Size | n = | 916,627
|
| Left size | n1 = | 286
|
| Right size | n2 = | 916,341
|
| Volume | m = | 1,462,476
|
| Unique edge count | m̿ = | 1,396,590
|
| Wedge count | s = | 446,160,844,605
|
| Claw count | z = | 112,694,297,439,437,648
|
| Cross count | x = | 2.258 06 × 1022
|
| Square count | q = | 84,401,540,080
|
| 4-Tour count | T4 = | 2,459,858,492,556
|
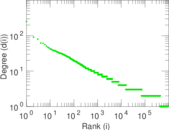
| Maximum degree | dmax = | 853,616
|
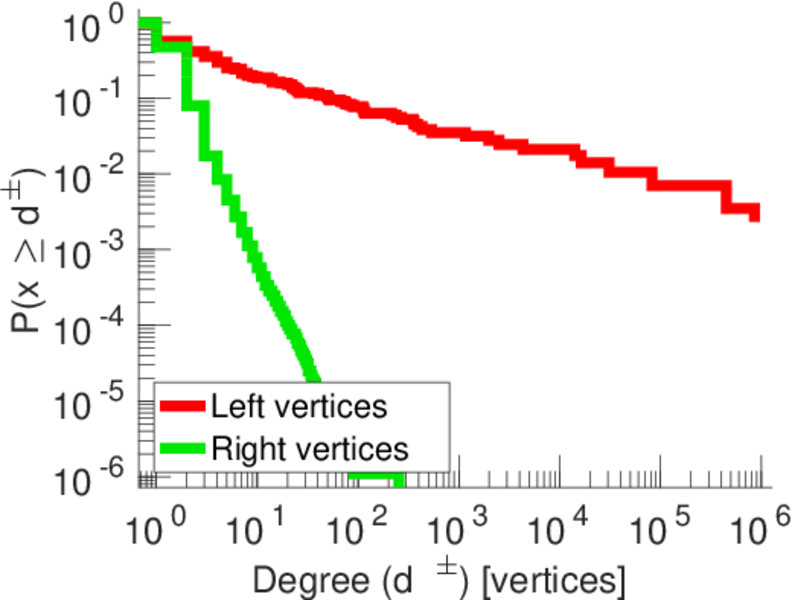
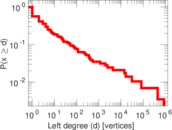
| Maximum left degree | d1max = | 853,616
|
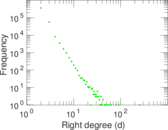
| Maximum right degree | d2max = | 253
|
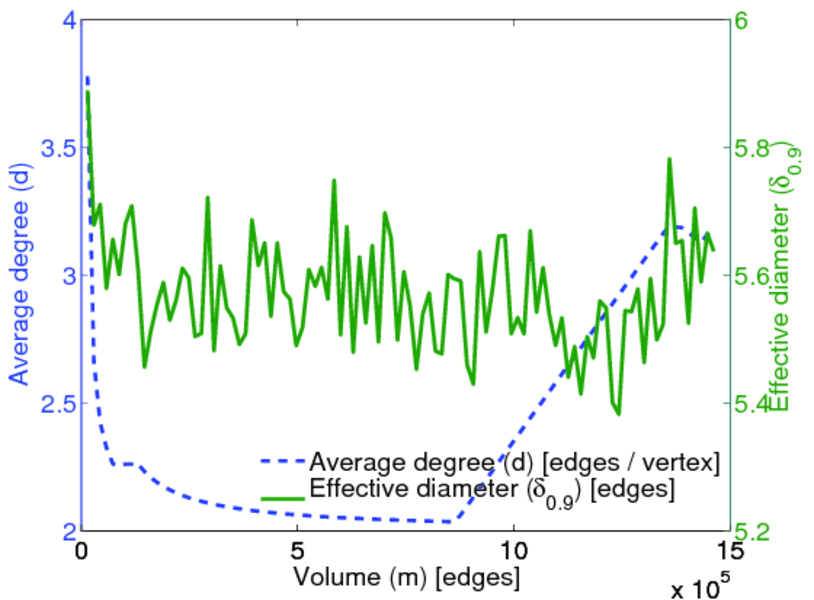
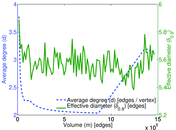
| Average degree | d = | 3.190 99
|
| Average left degree | d1 = | 5,113.55
|
| Average right degree | d2 = | 1.596 00
|
| Fill | p = | 0.005 329 00
|
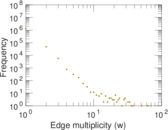
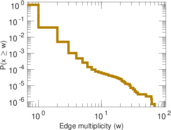
| Average edge multiplicity | m̃ = | 1.047 18
|
| Size of LCC | N = | 916,397
|
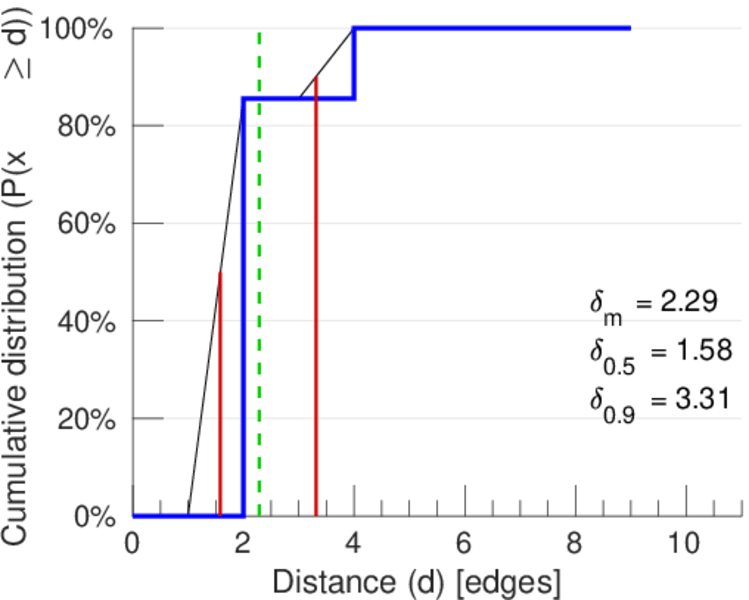
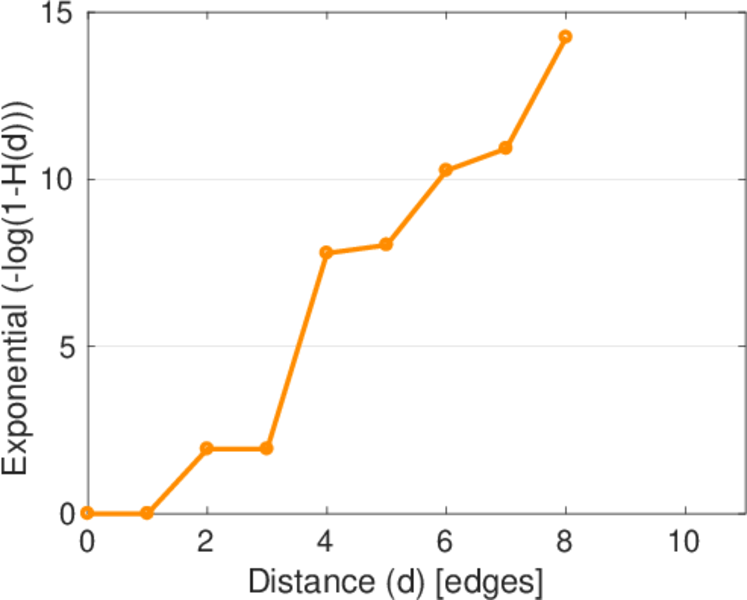
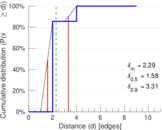
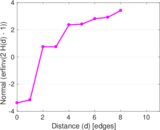
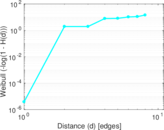
| Diameter | δ = | 11
|
| 50-Percentile effective diameter | δ0.5 = | 1.584 69
|
| 90-Percentile effective diameter | δ0.9 = | 3.309 94
|
| Median distance | δM = | 2
|
| Mean distance | δm = | 2.290 36
|
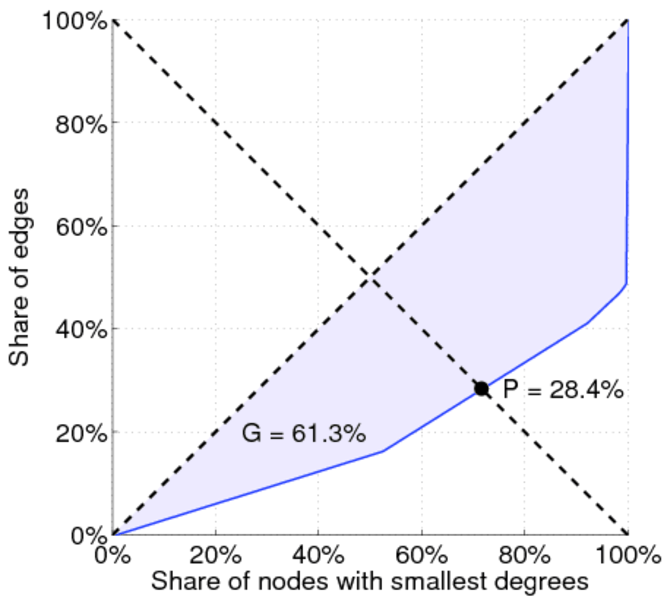
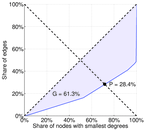
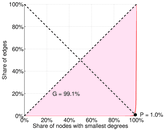
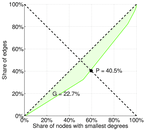
| Gini coefficient | G = | 0.613 574
|
| Balanced inequality ratio | P = | 0.283 876
|
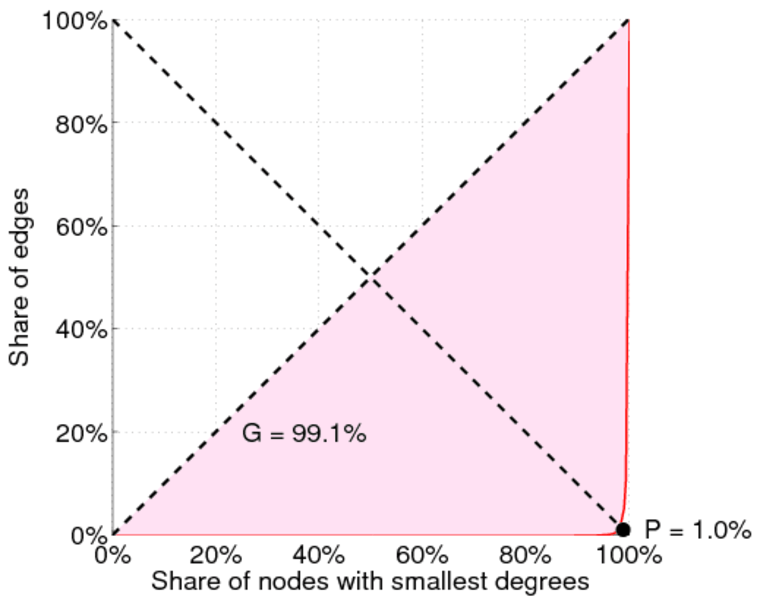
| Left balanced inequality ratio | P1 = | 0.010 142 4
|
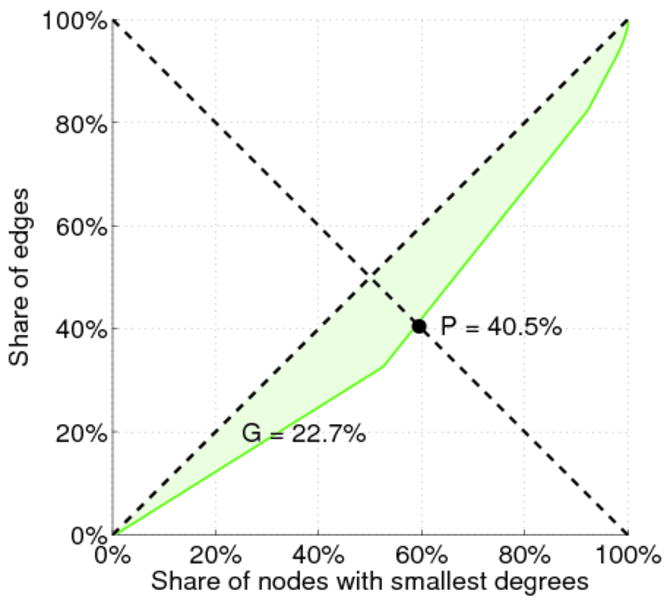
| Right balanced inequality ratio | P2 = | 0.404 736
|
| Relative edge distribution entropy | Her = | 0.585 393
|
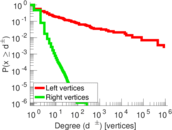
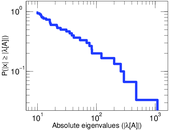
| Power law exponent | γ = | 3.884 77
|
| Tail power law exponent | γt = | 6.401 00
|
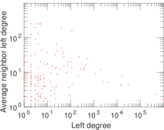
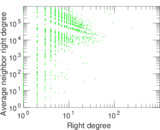
| Degree assortativity | ρ = | −0.366 779
|
| Degree assortativity p-value | pρ = | 0.000 00
|
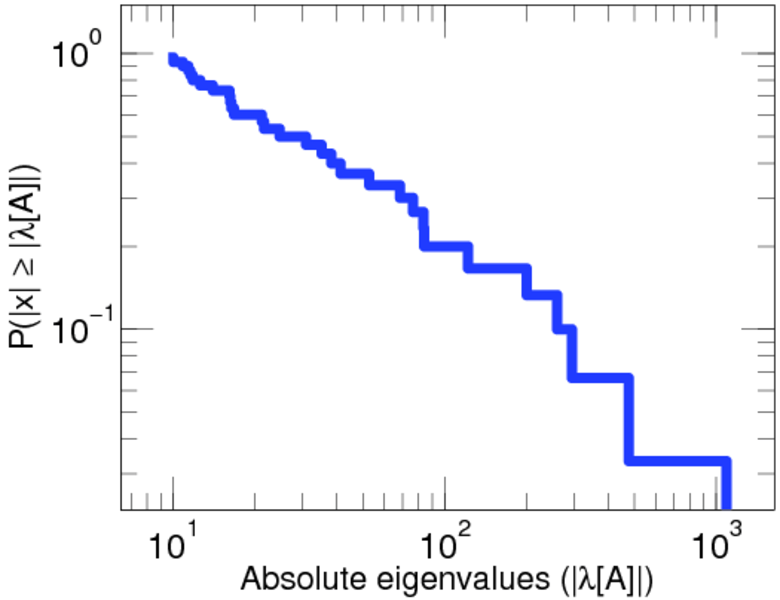
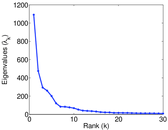
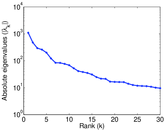
| Spectral norm | α = | 1,091.37
|
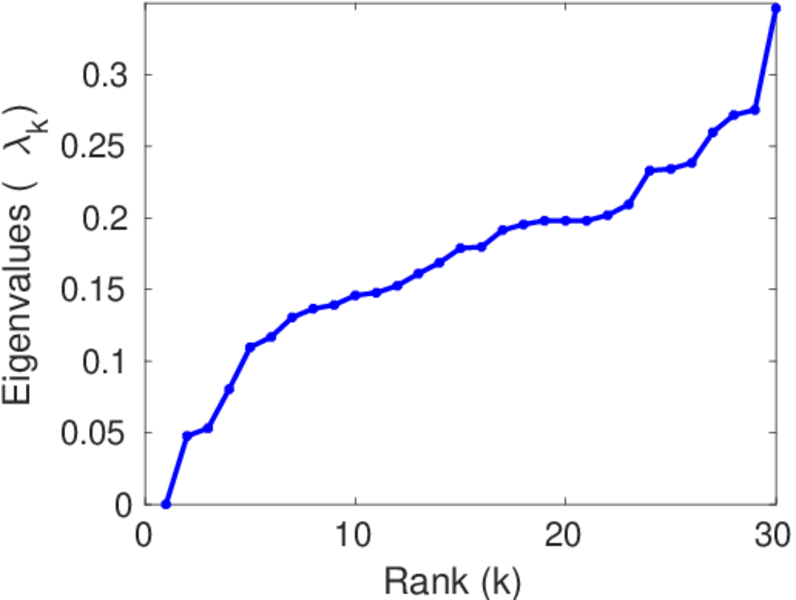
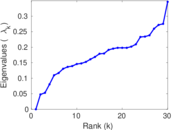
| Algebraic connectivity | a = | 0.047 737 8
|
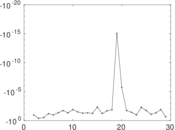
| Spectral separation | |λ1[A] / λ2[A]| = | 2.294 27
|
| Controllability | C = | 916,080
|
| Relative controllability | Cr = | 0.999 417
|
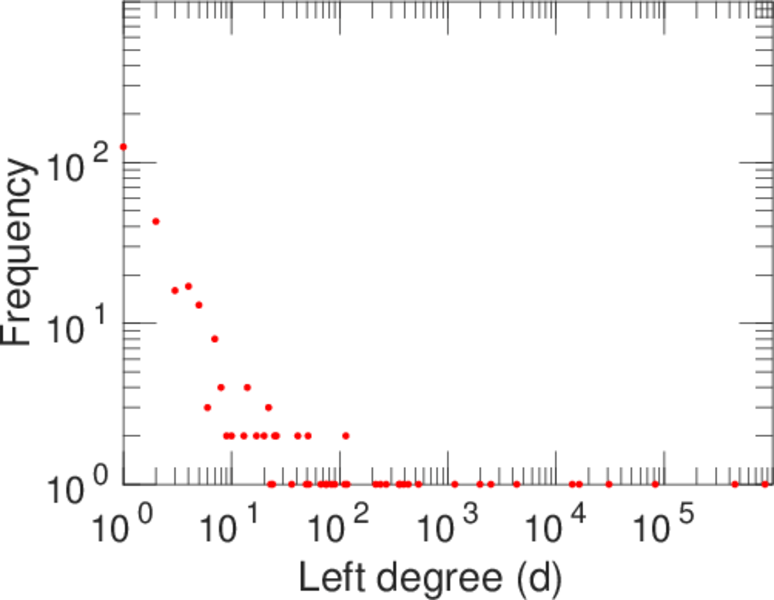
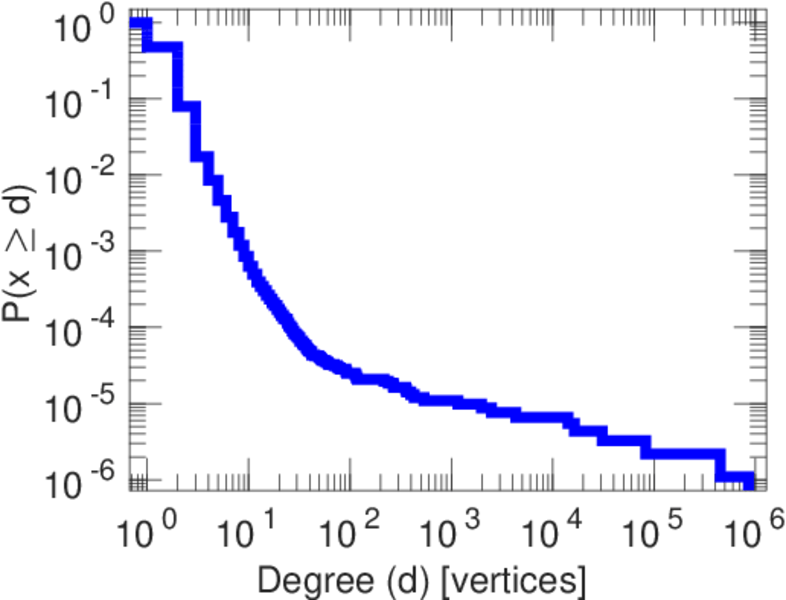
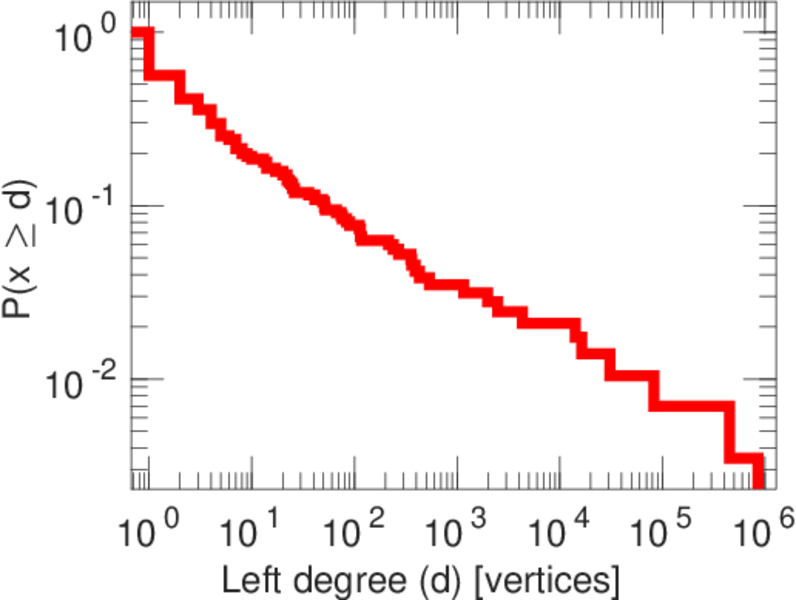
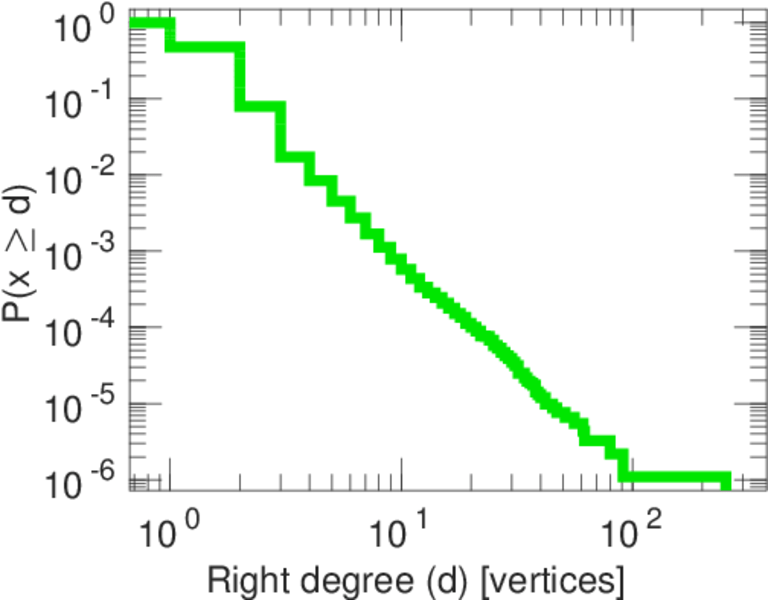
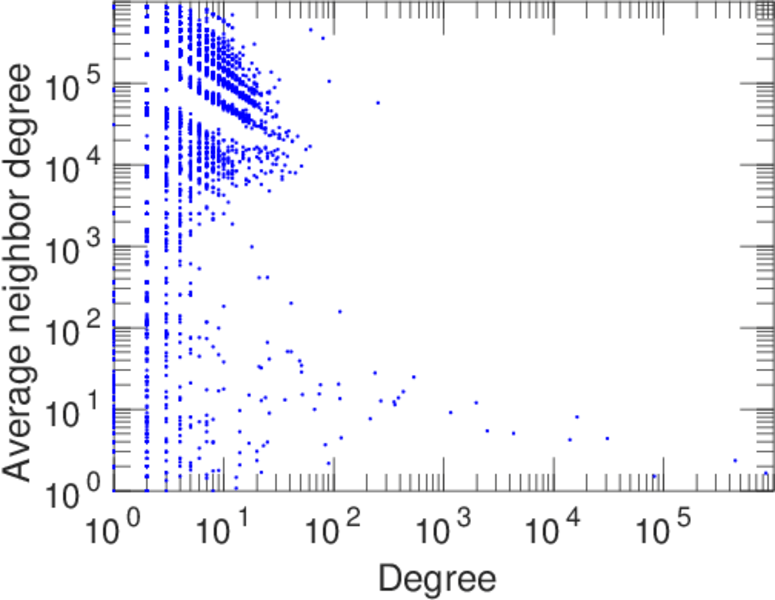
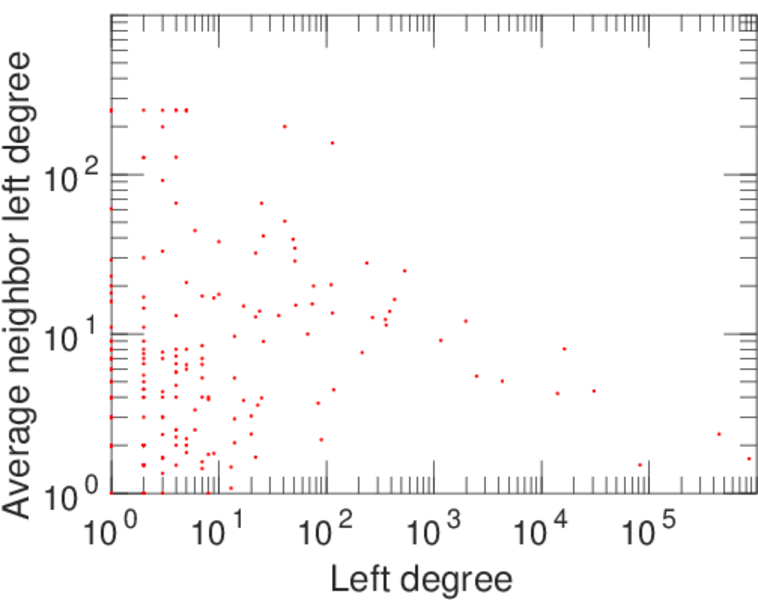
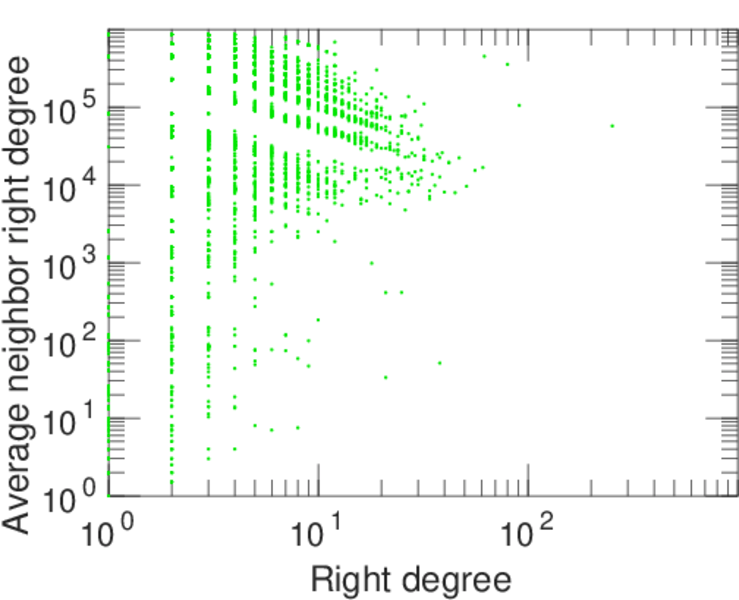
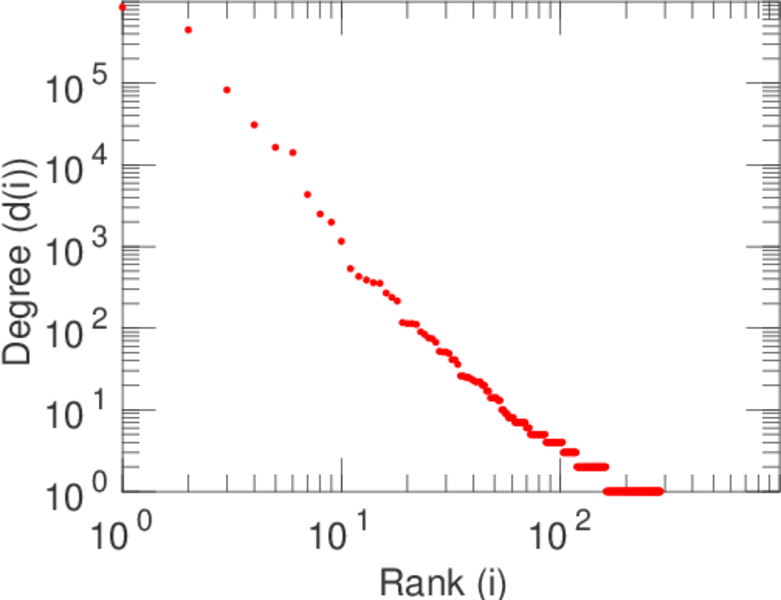
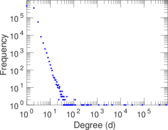
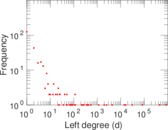
Plots


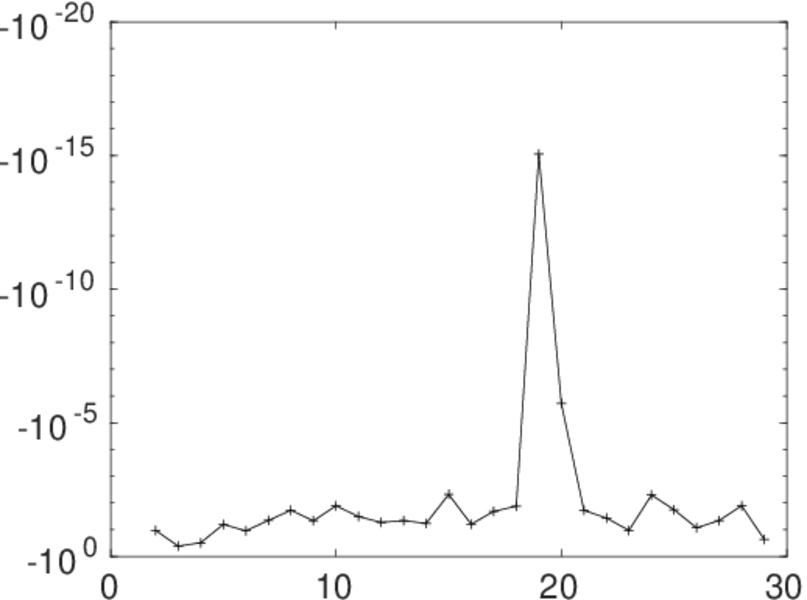
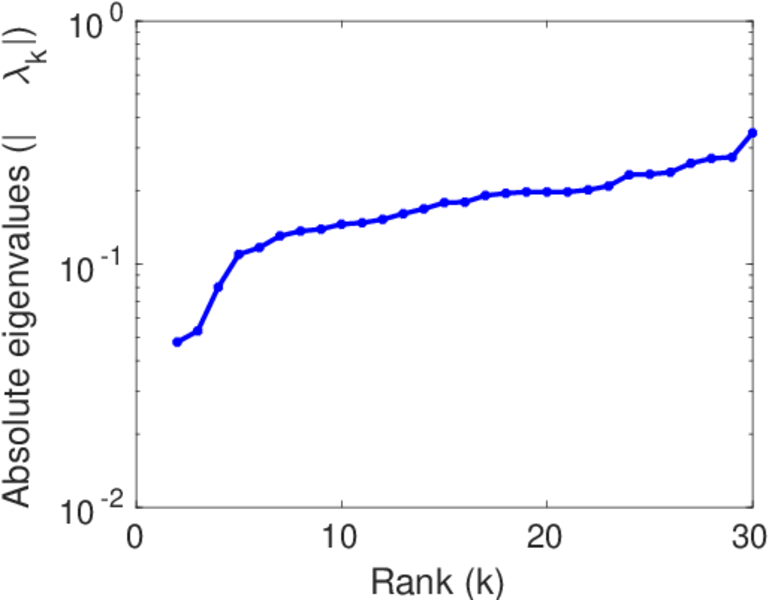
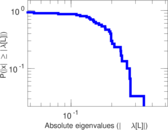
Matrix decompositions plots


Downloads
References
|
[1]
|
Jérôme Kunegis.
KONECT – The Koblenz Network Collection.
In Proc. Int. Conf. on World Wide Web Companion, pages
1343–1350, 2013.
[ http ]
|
|
[2]
|
Wikimedia Foundation.
Wikimedia downloads.
http://dumps.wikimedia.org/, January 2010.
|
 KONECT ‣ Networks ‣
Buy Me a Coffee
KONECT ‣ Networks ‣
Buy Me a Coffee