Wikipedia edits (si)
This is the bipartite edit network of the Sinhala Wikipedia. It contains users
and pages from the Sinhala Wikipedia, connected by edit events. Each edge
represents an edit. The dataset includes the timestamp of each edit.
Metadata
Statistics
| Size | n = | 66,095
|
| Left size | n1 = | 3,945
|
| Right size | n2 = | 62,150
|
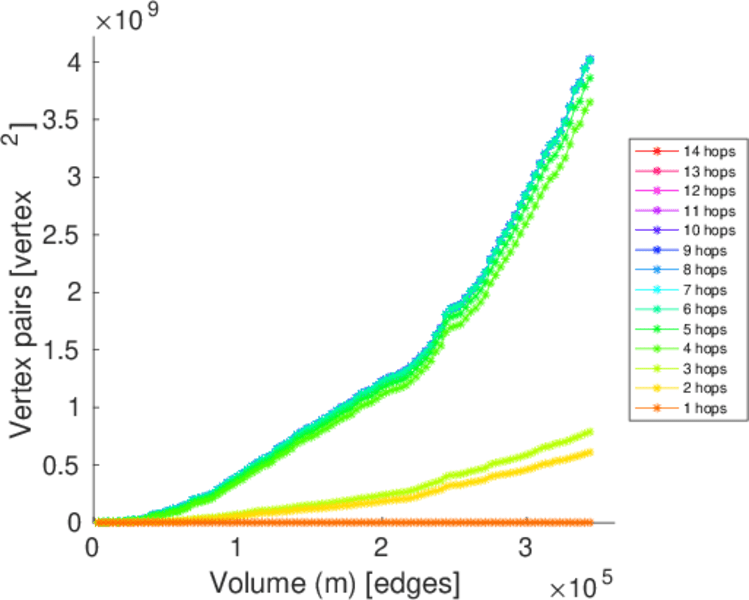
| Volume | m = | 343,632
|
| Unique edge count | m̿ = | 140,689
|
| Wedge count | s = | 341,159,414
|
| Claw count | z = | 1,173,658,924,192
|
| Square count | q = | 62,994,873
|
| 4-Tour count | T4 = | 1,868,909,542
|
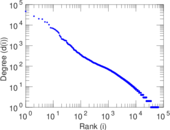
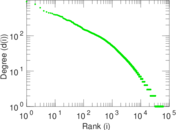
| Maximum degree | dmax = | 46,782
|
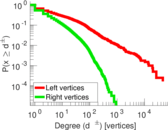
| Maximum left degree | d1max = | 46,782
|
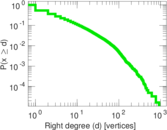
| Maximum right degree | d2max = | 921
|
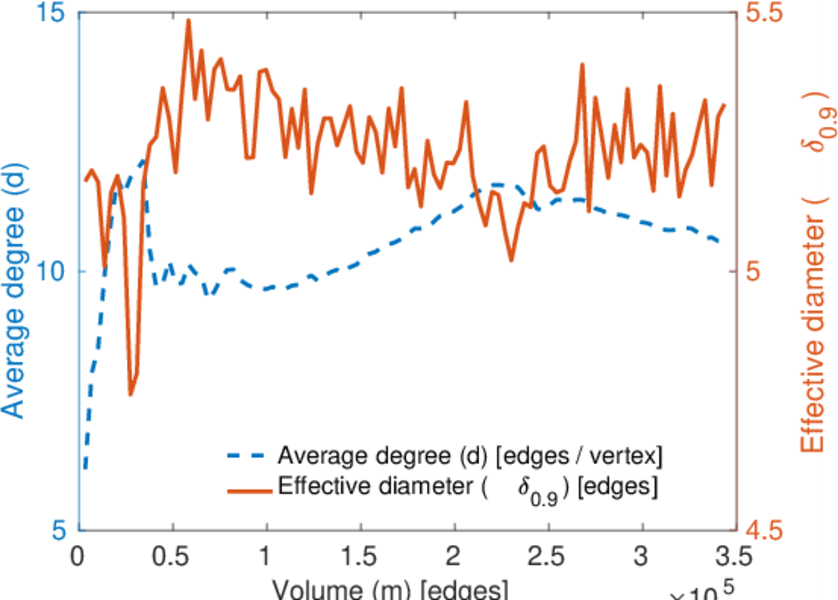
| Average degree | d = | 10.398 1
|
| Average left degree | d1 = | 87.105 7
|
| Average right degree | d2 = | 5.529 07
|
| Fill | p = | 0.000 573 815
|
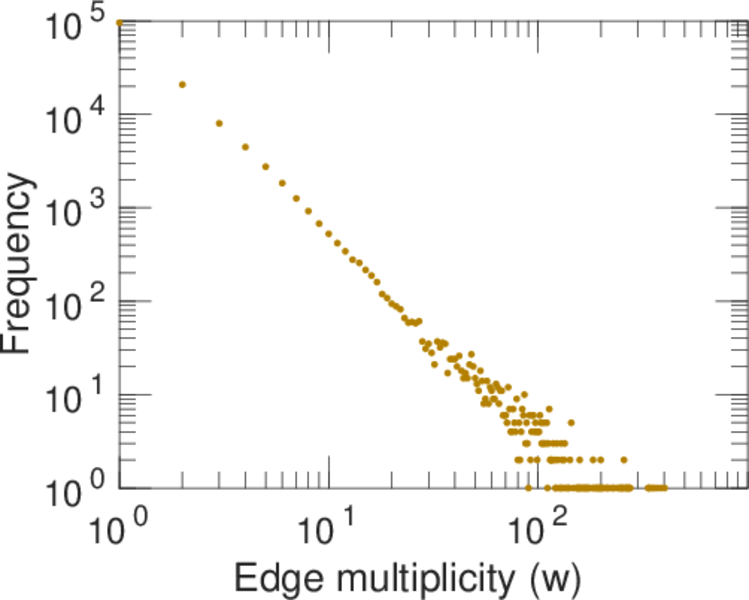
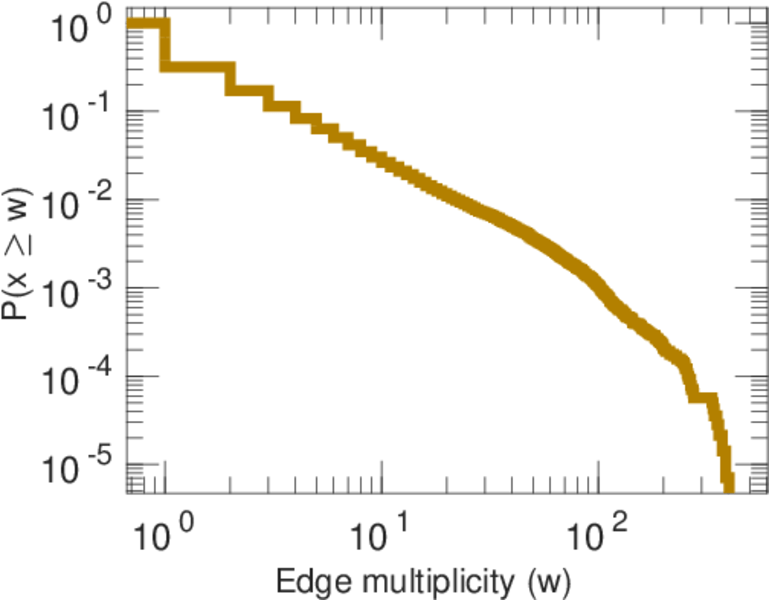
| Average edge multiplicity | m̃ = | 2.442 49
|
| Size of LCC | N = | 63,414
|
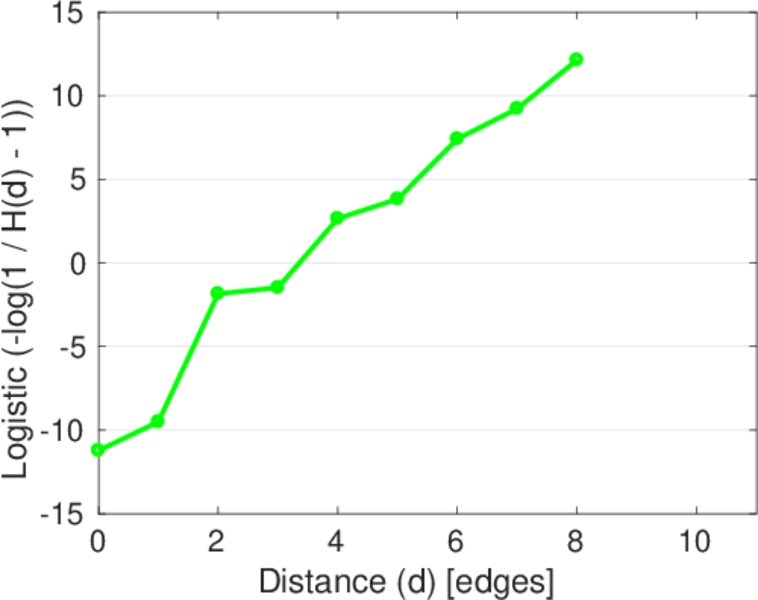
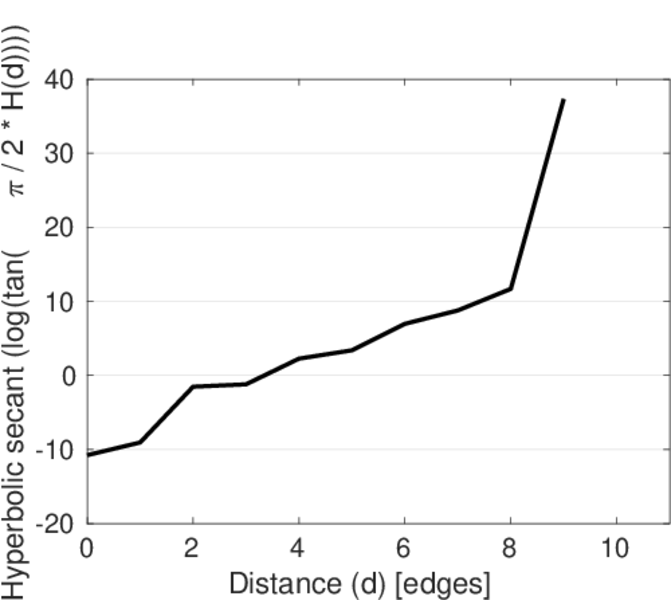
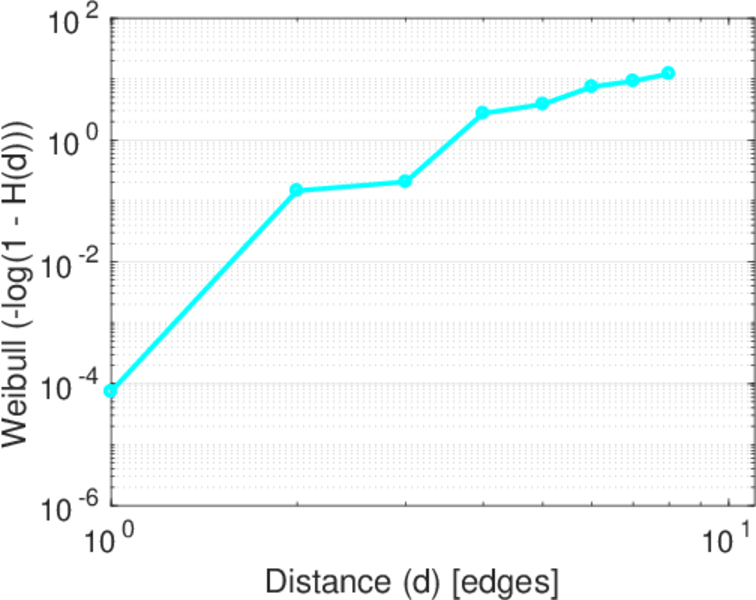
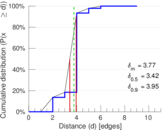
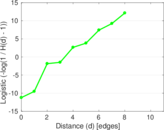
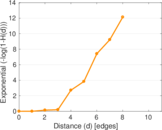
| Diameter | δ = | 11
|
| 50-Percentile effective diameter | δ0.5 = | 3.420 70
|
| 90-Percentile effective diameter | δ0.9 = | 3.954 77
|
| Median distance | δM = | 4
|
| Mean distance | δm = | 3.767 40
|
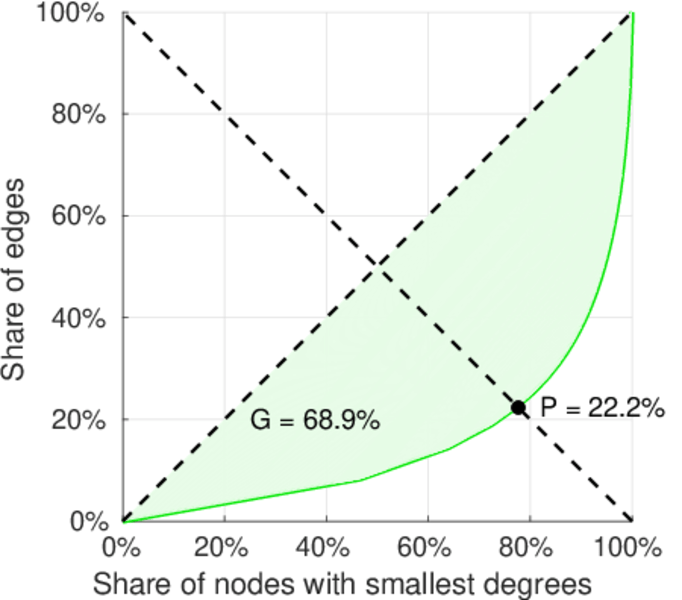
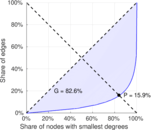
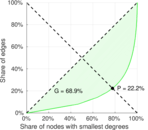
| Gini coefficient | G = | 0.830 322
|
| Balanced inequality ratio | P = | 0.156 970
|
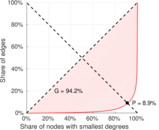
| Left balanced inequality ratio | P1 = | 0.088 984 7
|
| Right balanced inequality ratio | P2 = | 0.221 737
|
| Relative edge distribution entropy | Her = | 0.741 494
|
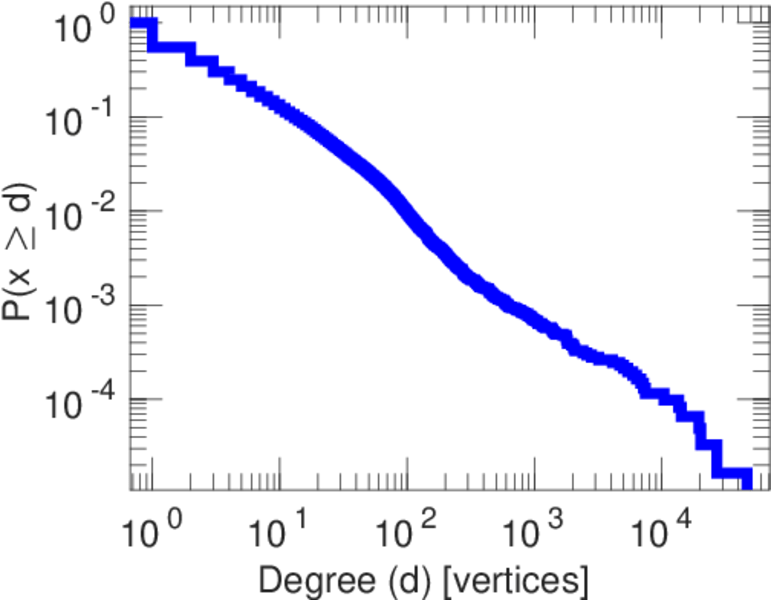
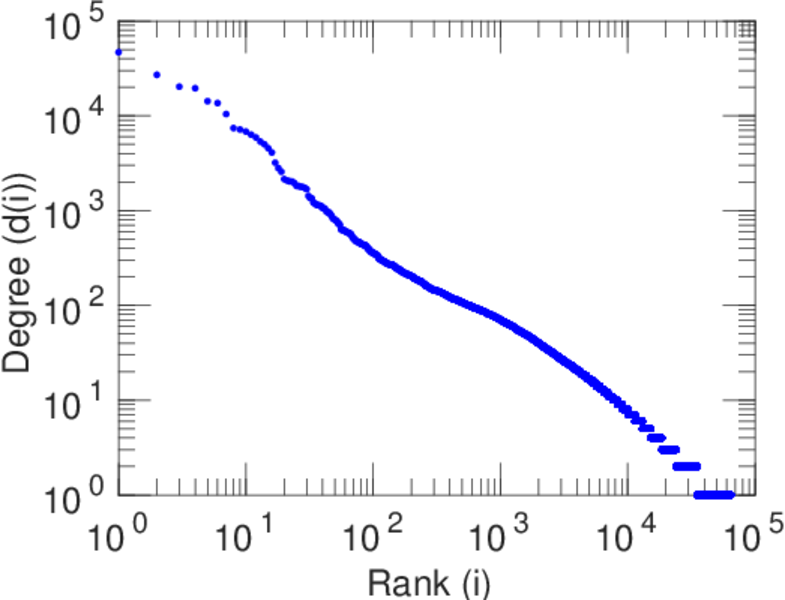
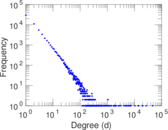
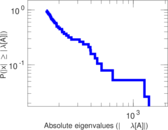
| Power law exponent | γ = | 3.045 41
|
| Tail power law exponent | γt = | 2.381 00
|
| Tail power law exponent with p | γ3 = | 2.381 00
|
| p-value | p = | 0.000 00
|
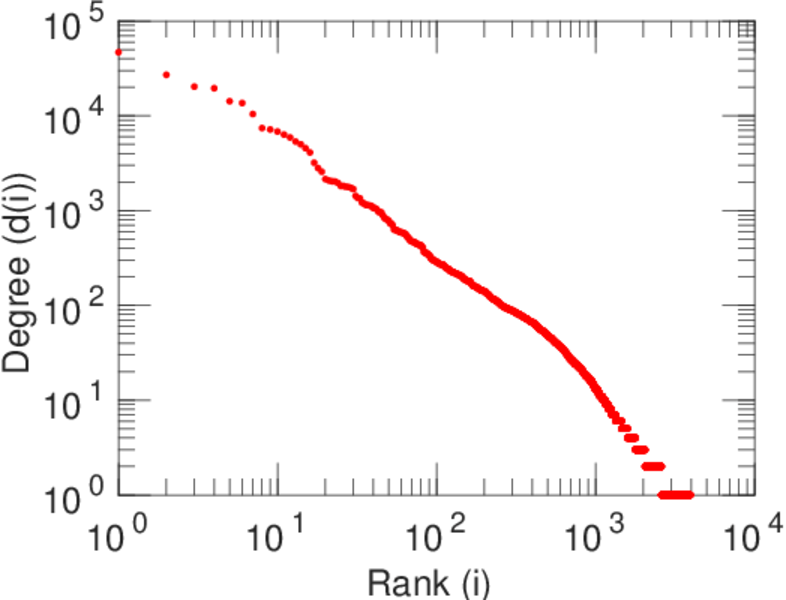
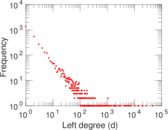
| Left tail power law exponent with p | γ3,1 = | 1.791 00
|
| Left p-value | p1 = | 0.000 00
|
| Right tail power law exponent with p | γ3,2 = | 2.461 00
|
| Right p-value | p2 = | 0.000 00
|
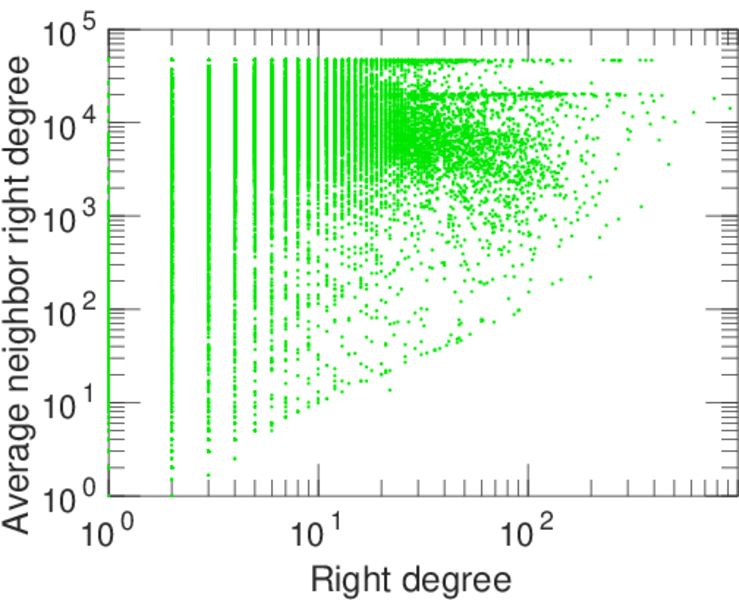
| Degree assortativity | ρ = | −0.291 275
|
| Degree assortativity p-value | pρ = | 0.000 00
|
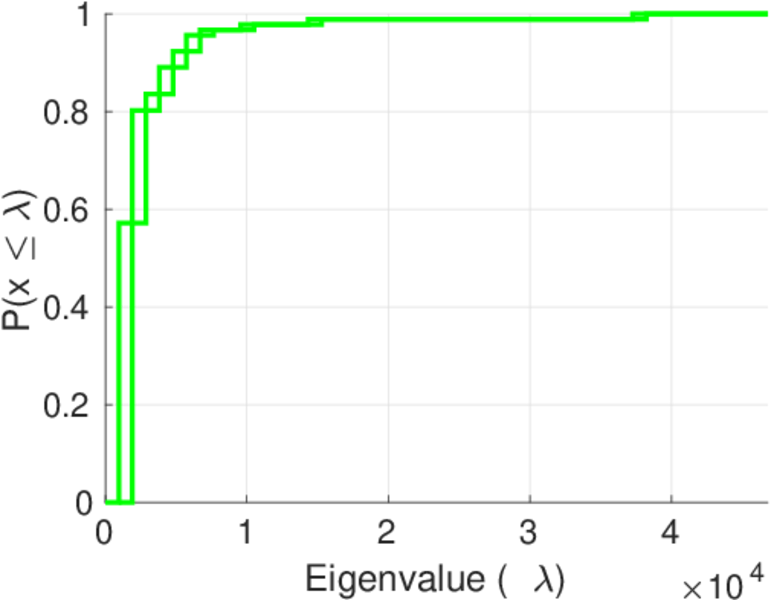
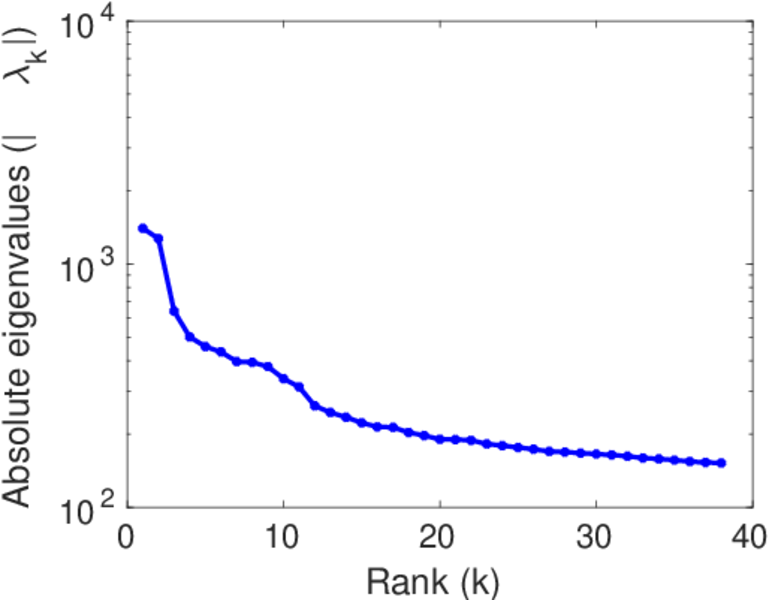
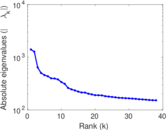
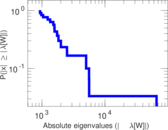
| Spectral norm | α = | 1,404.23
|
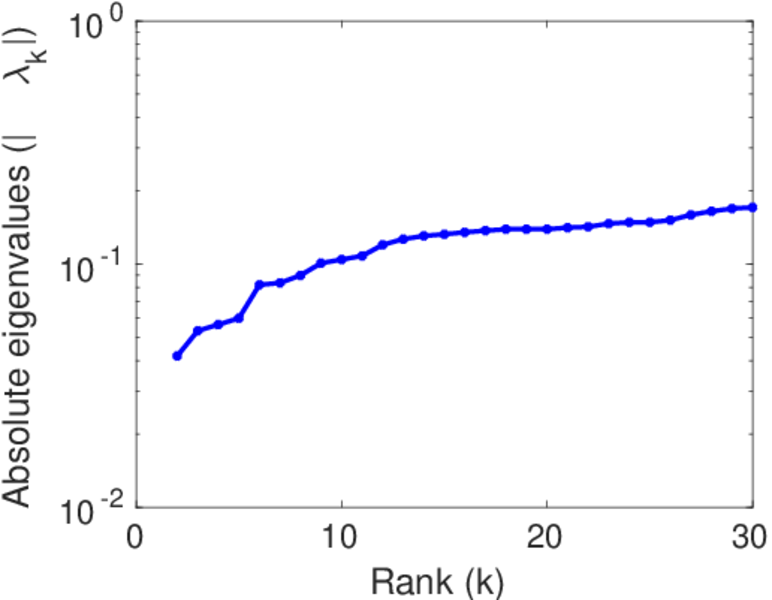
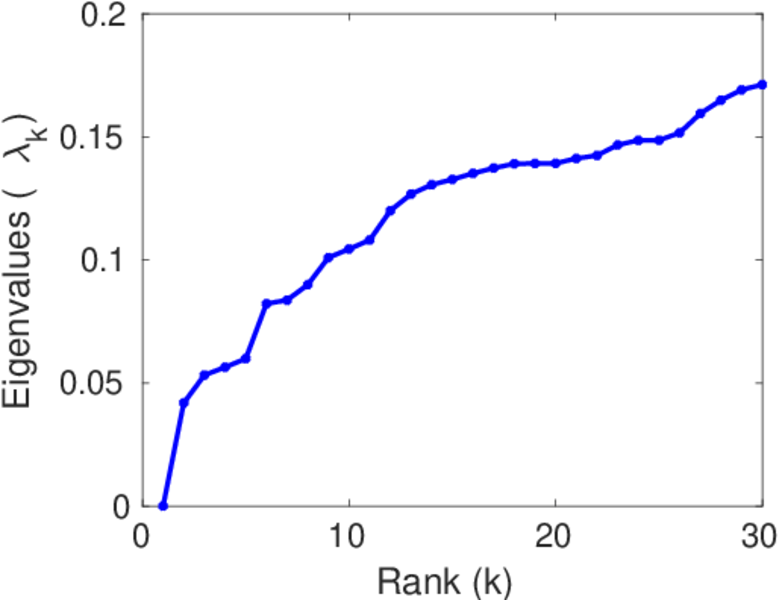
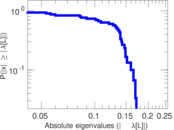
| Algebraic connectivity | a = | 0.041 882 9
|
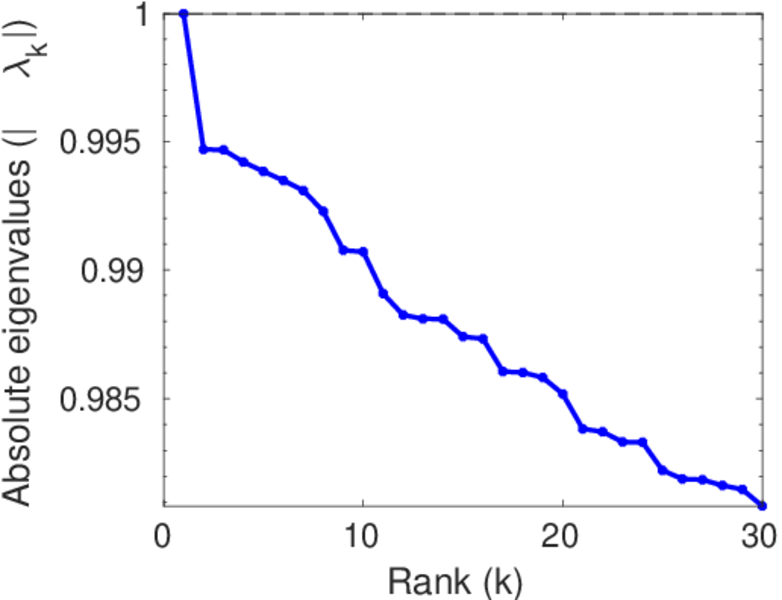
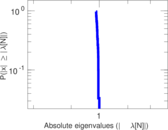
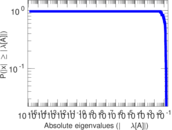
| Spectral separation | |λ1[A] / λ2[A]| = | 1.103 34
|
| Controllability | C = | 57,660
|
| Relative controllability | Cr = | 0.887 664
|
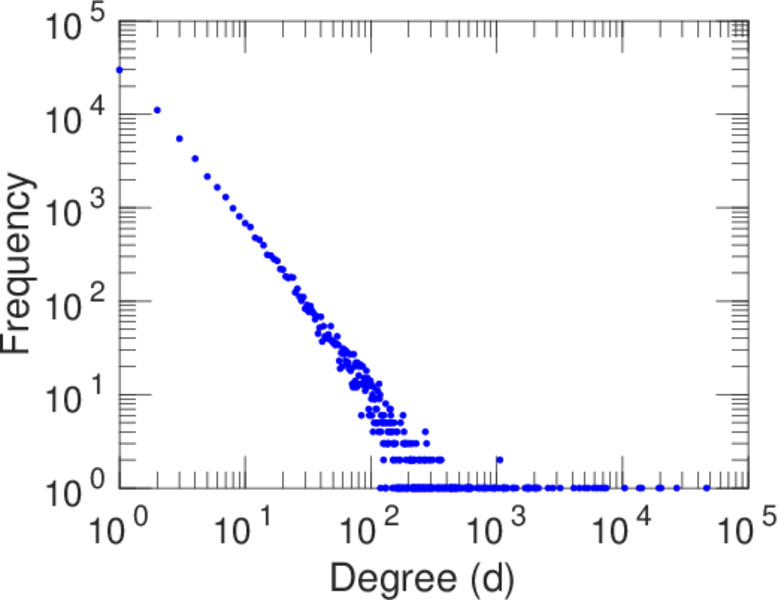
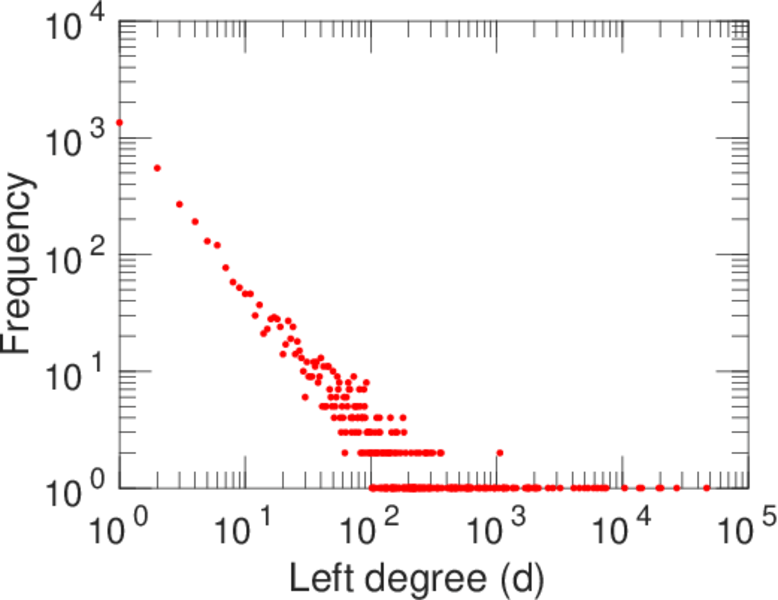
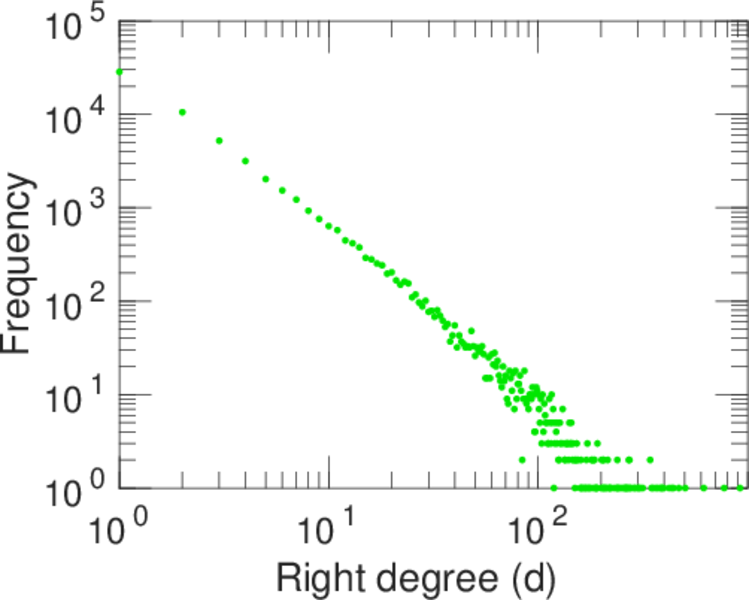
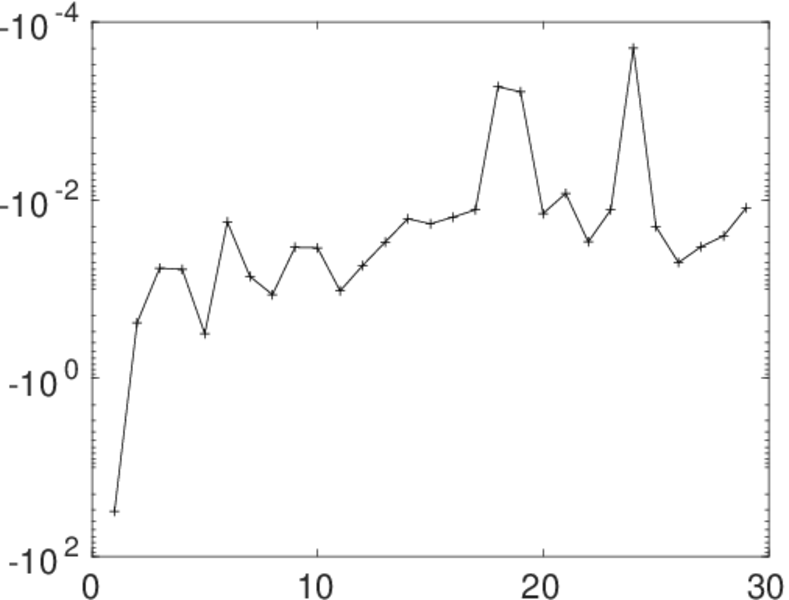
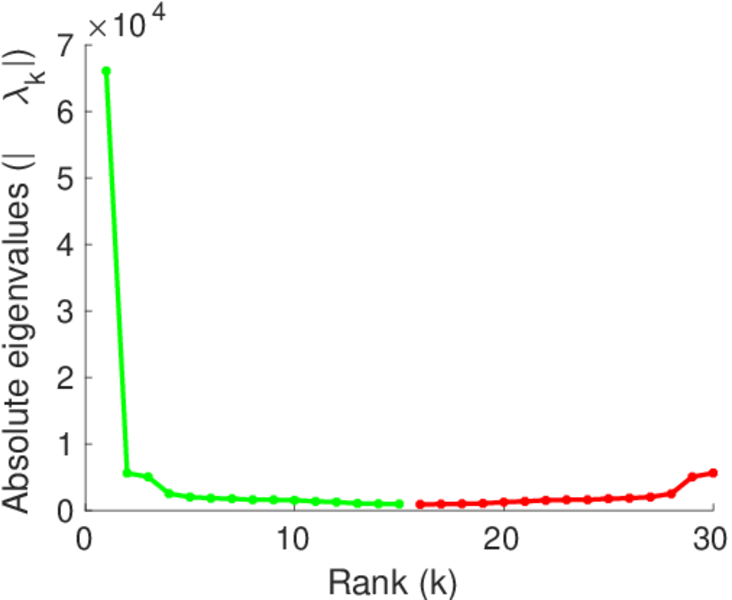
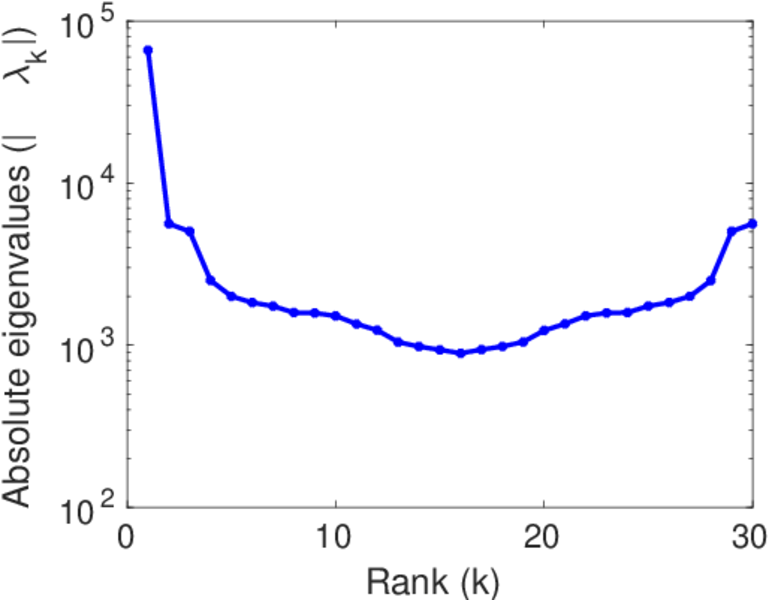
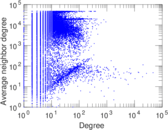
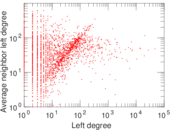
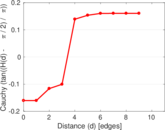
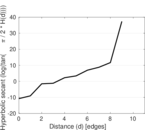
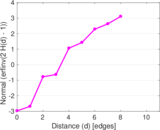
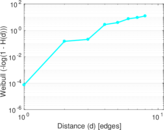
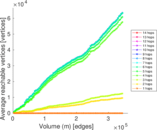
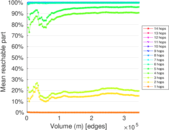
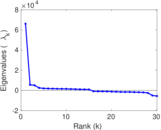
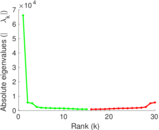
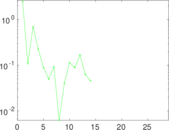
Plots


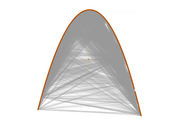
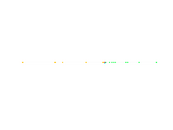

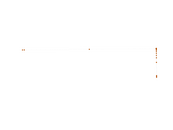


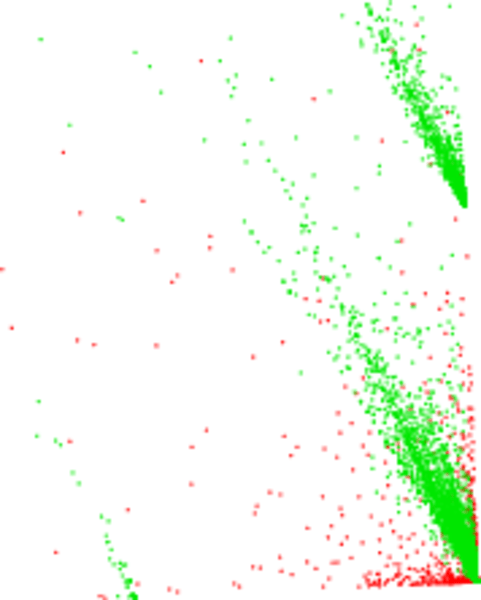
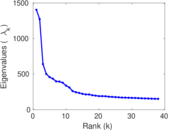
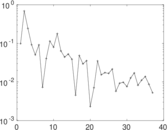
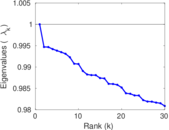
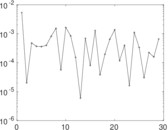
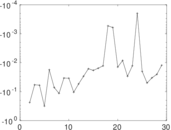
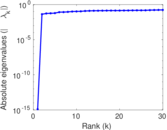
Matrix decompositions plots


Downloads
References
|
[1]
|
Jérôme Kunegis.
KONECT – The Koblenz Network Collection.
In Proc. Int. Conf. on World Wide Web Companion, pages
1343–1350, 2013.
[ http ]
|
|
[2]
|
Wikimedia Foundation.
Wikimedia downloads.
http://dumps.wikimedia.org/, January 2010.
|
 KONECT ‣ Networks ‣
Buy Me a Coffee
KONECT ‣ Networks ‣
Buy Me a Coffee