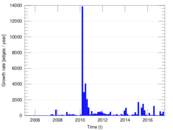
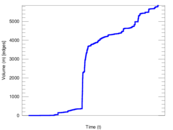
Wikibooks edits (si)
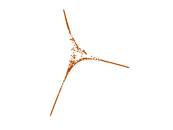
This is the bipartite edit network of the Sinhala Wikibooks. It contains users
and pages from the Sinhala Wikibooks, connected by edit events. Each edge
represents an edit. The dataset includes the timestamp of each edit.
Metadata
Statistics
| Size | n = | 3,427
|
| Left size | n1 = | 219
|
| Right size | n2 = | 3,208
|
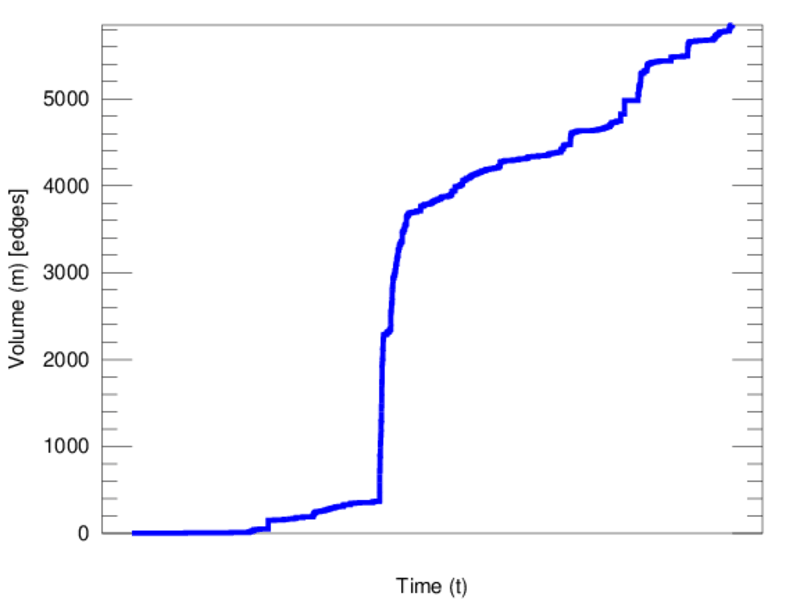
| Volume | m = | 5,850
|
| Unique edge count | m̿ = | 3,288
|
| Wedge count | s = | 1,039,610
|
| Claw count | z = | 368,713,927
|
| Cross count | x = | 105,725,355,173
|
| Square count | q = | 5,599
|
| 4-Tour count | T4 = | 4,209,872
|
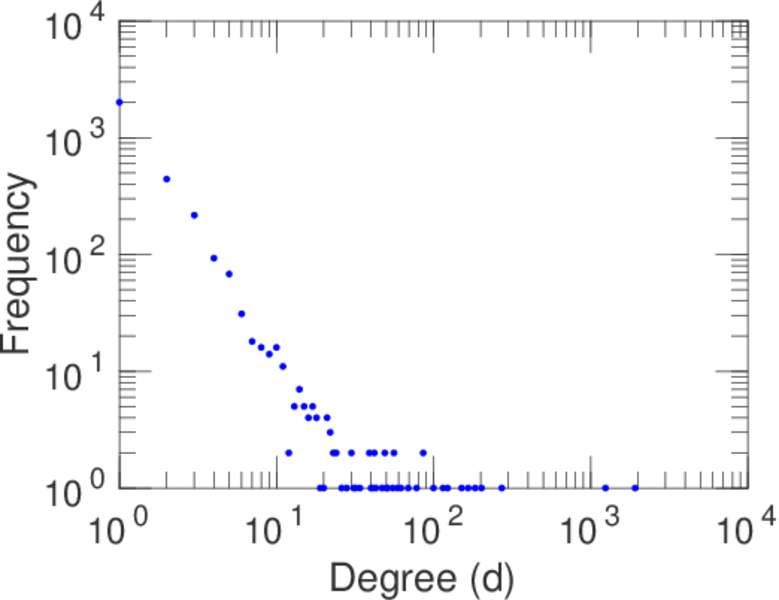
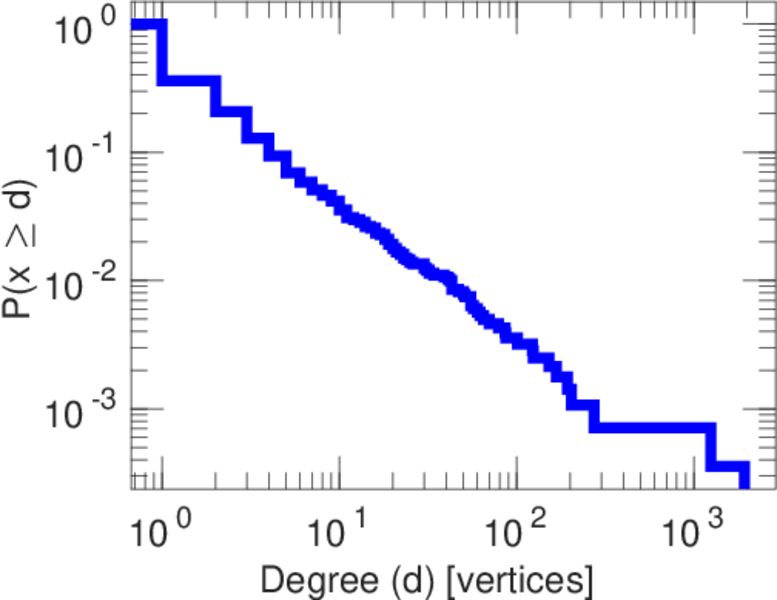
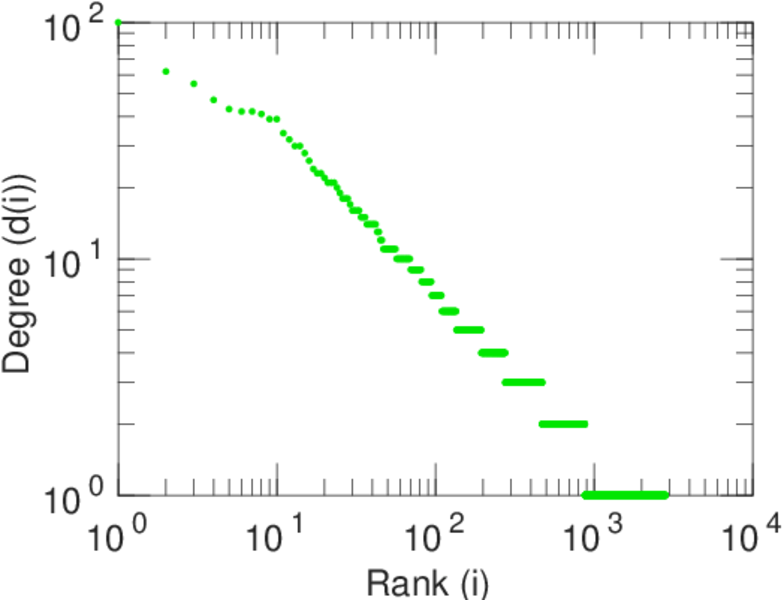
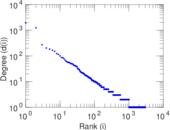
| Maximum degree | dmax = | 1,922
|
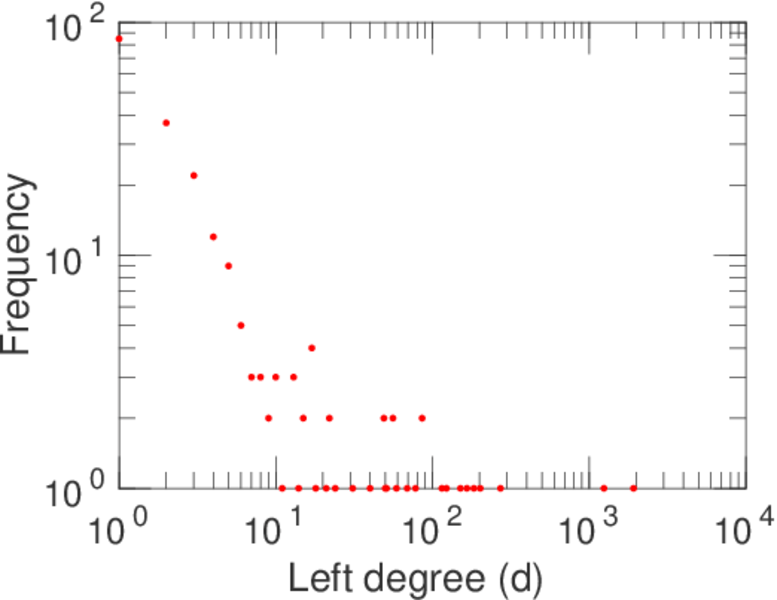
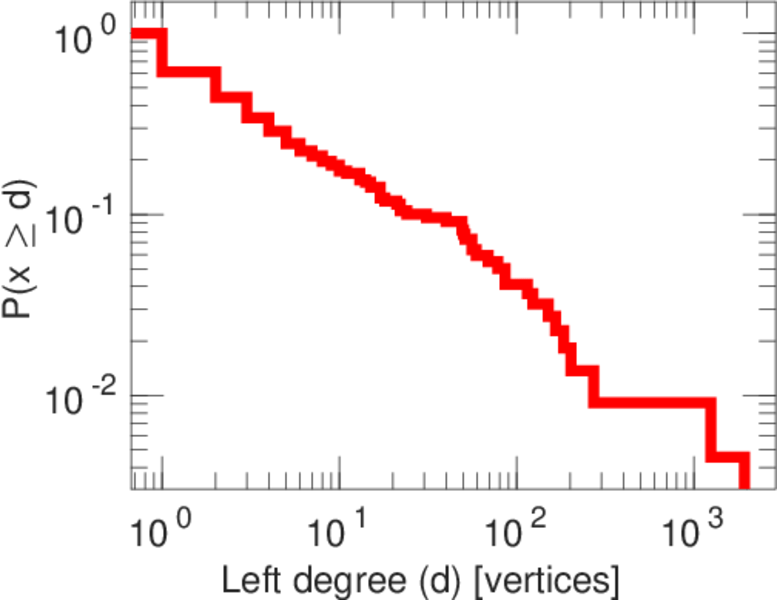
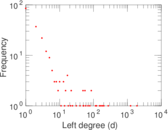
| Maximum left degree | d1max = | 1,922
|
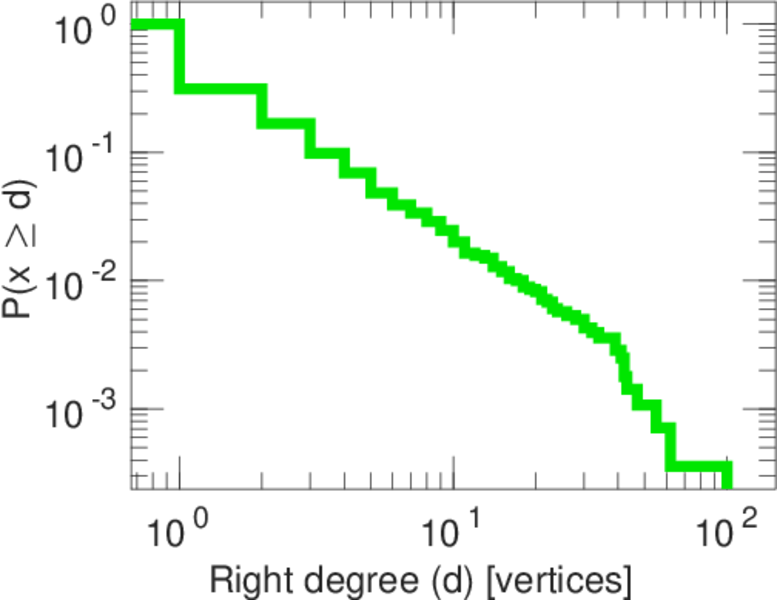
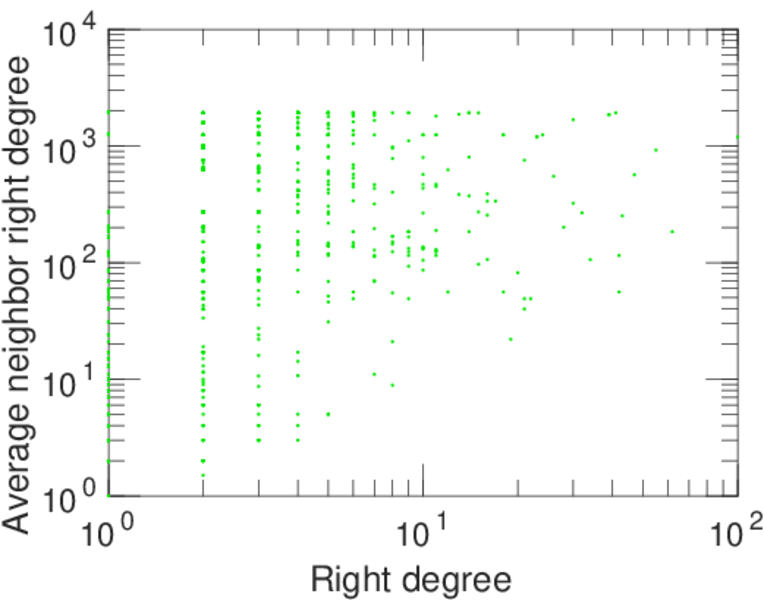
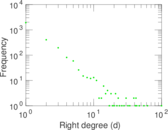
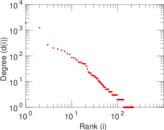
| Maximum right degree | d2max = | 100
|
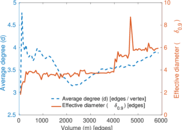
| Average degree | d = | 3.414 06
|
| Average left degree | d1 = | 26.712 3
|
| Average right degree | d2 = | 1.823 57
|
| Fill | p = | 0.004 680 08
|
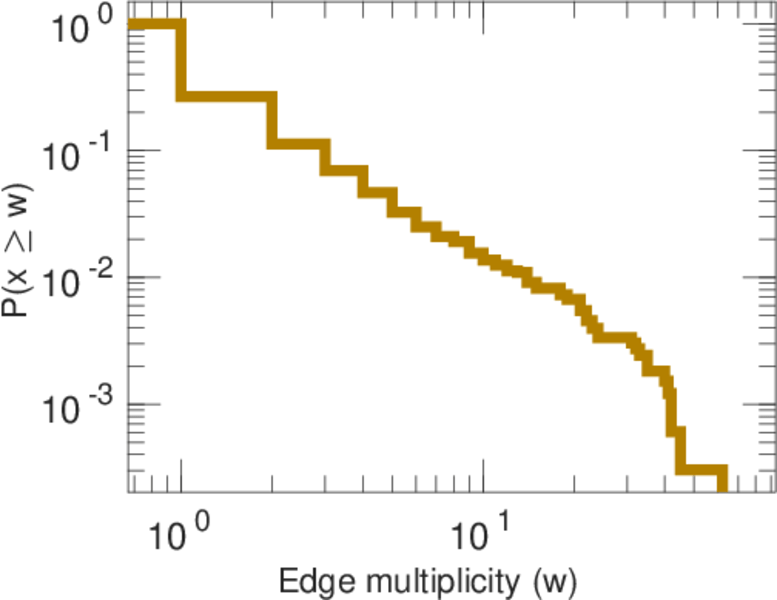
| Average edge multiplicity | m̃ = | 1.779 20
|
| Size of LCC | N = | 2,666
|
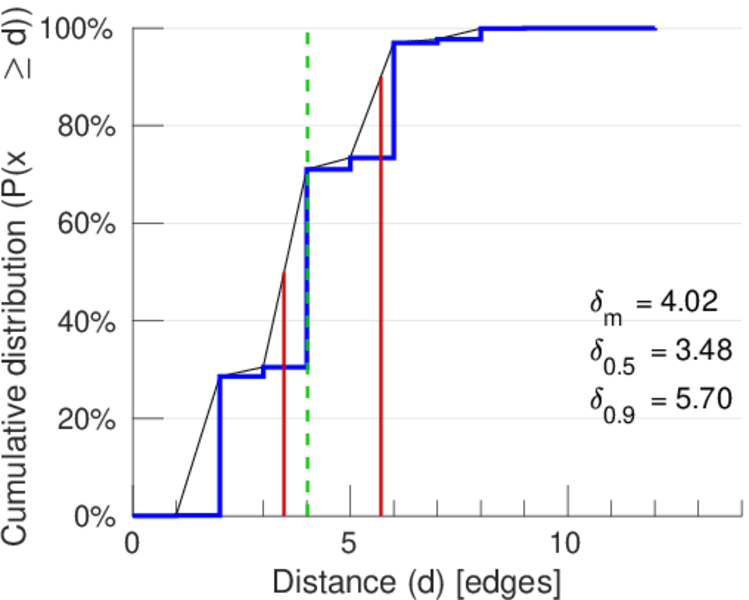
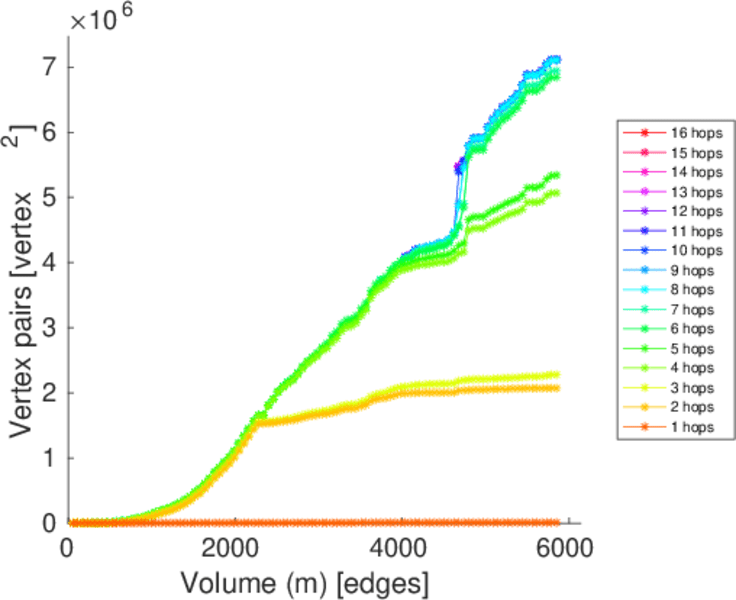
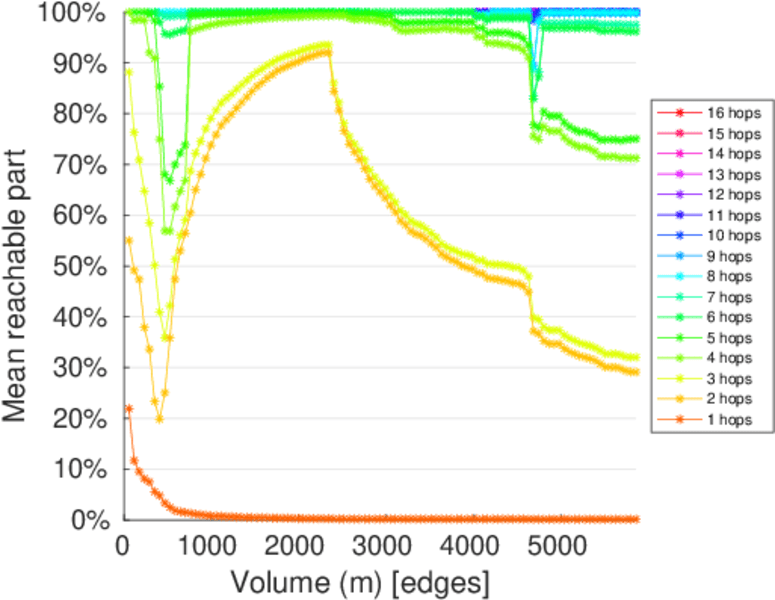
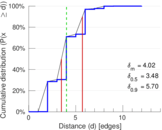
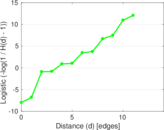
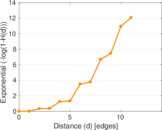
| Diameter | δ = | 13
|
| 50-Percentile effective diameter | δ0.5 = | 3.481 21
|
| 90-Percentile effective diameter | δ0.9 = | 5.704 72
|
| Median distance | δM = | 4
|
| Mean distance | δm = | 4.018 98
|
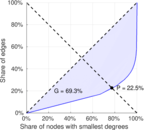
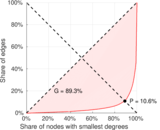
| Gini coefficient | G = | 0.704 927
|
| Balanced inequality ratio | P = | 0.219 060
|
| Left balanced inequality ratio | P1 = | 0.106 154
|
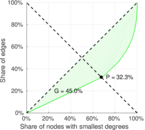
| Right balanced inequality ratio | P2 = | 0.323 077
|
| Relative edge distribution entropy | Her = | 0.746 968
|
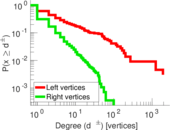
| Power law exponent | γ = | 7.389 44
|
| Tail power law exponent | γt = | 3.051 00
|
| Tail power law exponent with p | γ3 = | 3.051 00
|
| p-value | p = | 0.001 000 00
|
| Left tail power law exponent with p | γ3,1 = | 1.771 00
|
| Left p-value | p1 = | 0.557 000
|
| Right tail power law exponent with p | γ3,2 = | 3.471 00
|
| Right p-value | p2 = | 0.000 00
|
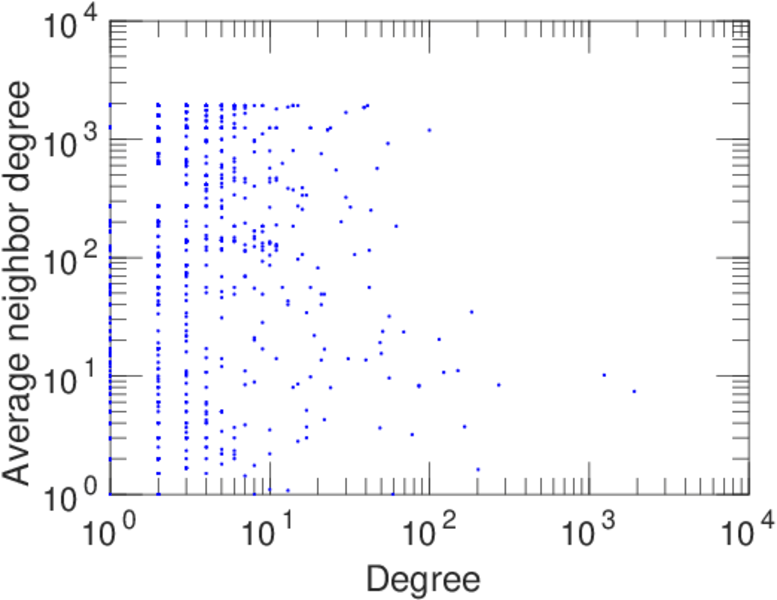
| Degree assortativity | ρ = | −0.277 010
|
| Degree assortativity p-value | pρ = | 5.385 55 × 10−59
|
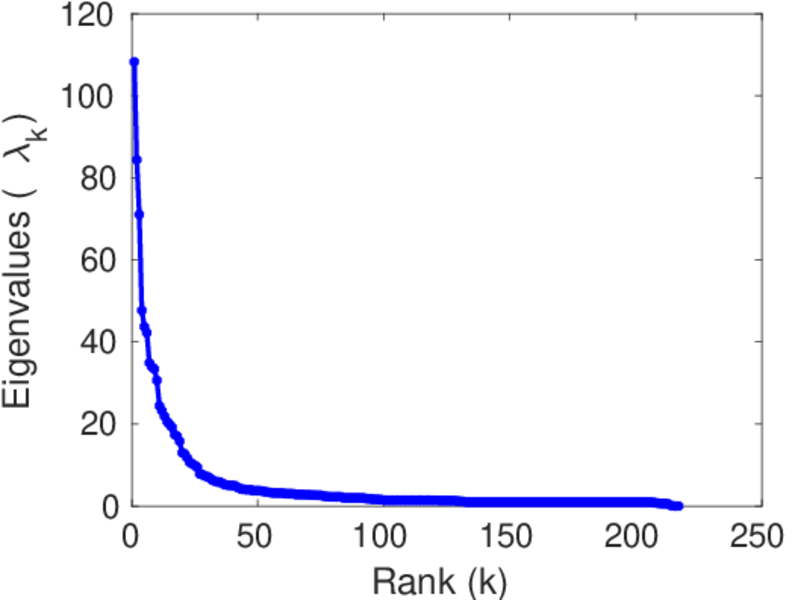
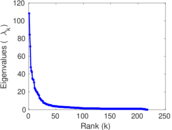
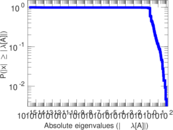
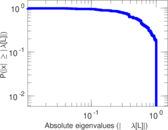
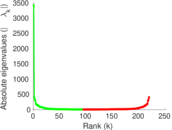
| Spectral norm | α = | 108.246
|
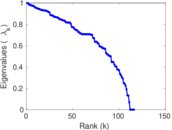
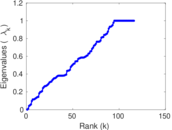
| Algebraic connectivity | a = | 0.010 500 3
|
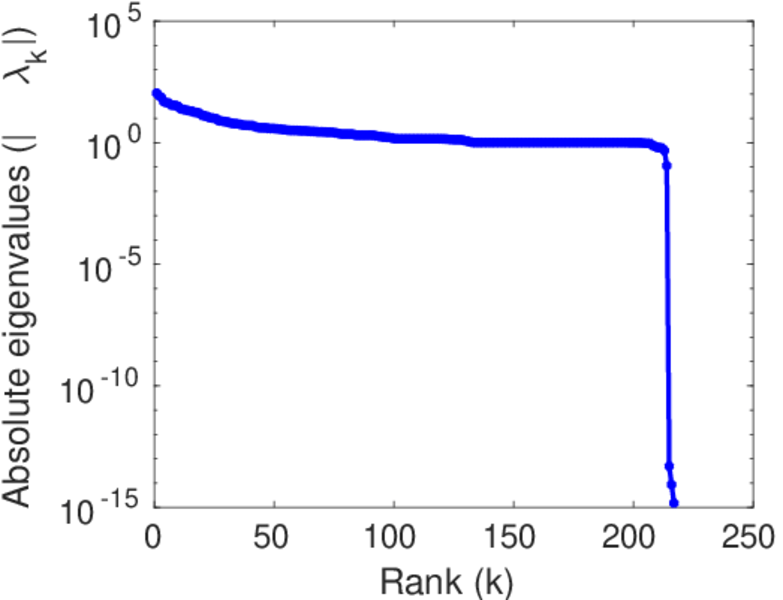
| Spectral separation | |λ1[A] / λ2[A]| = | 1.282 75
|
| Controllability | C = | 2,591
|
| Relative controllability | Cr = | 0.858 231
|
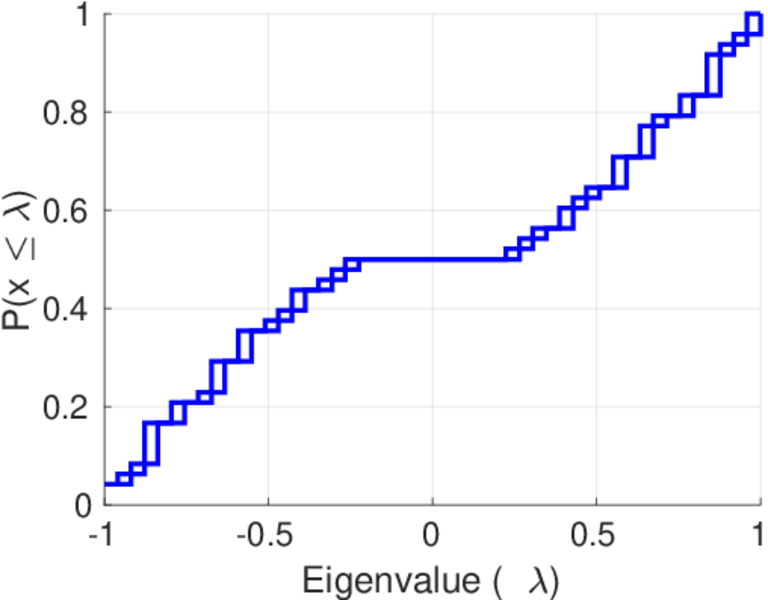
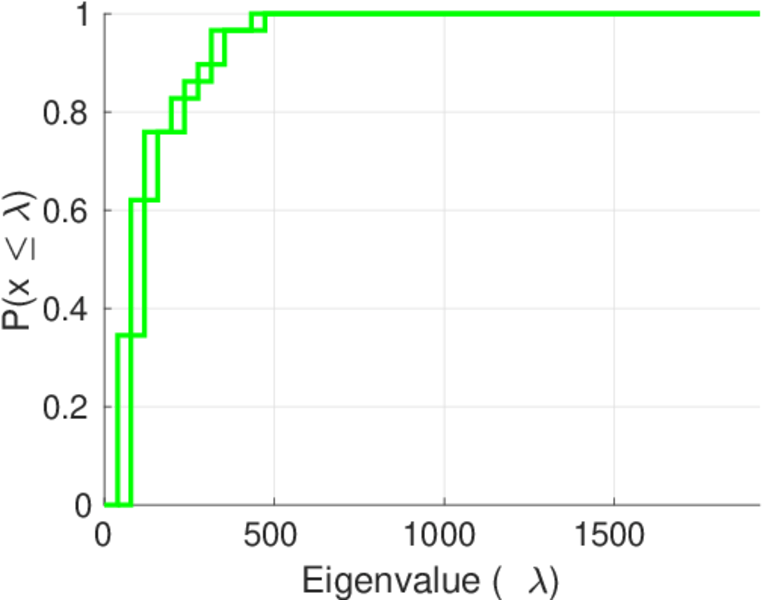
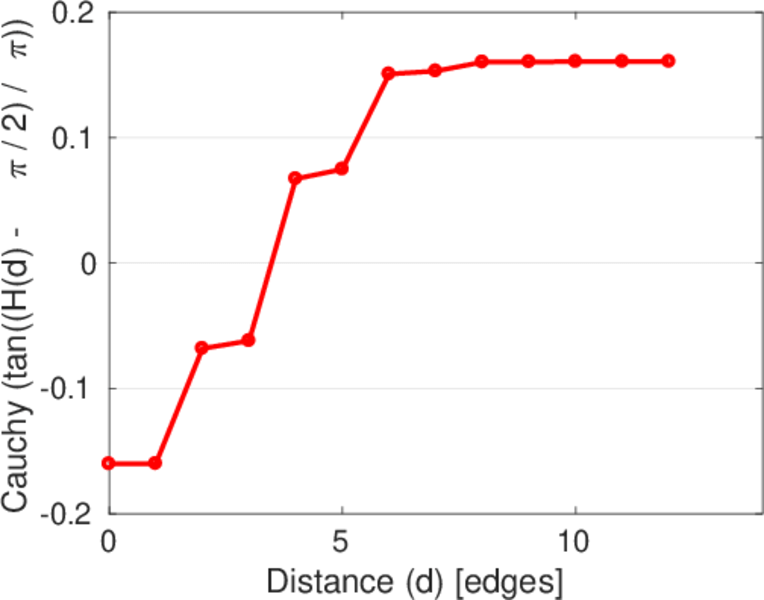
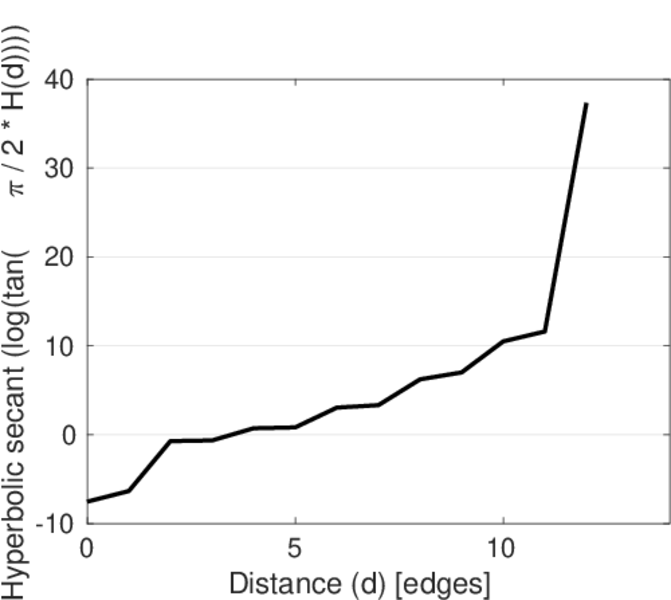
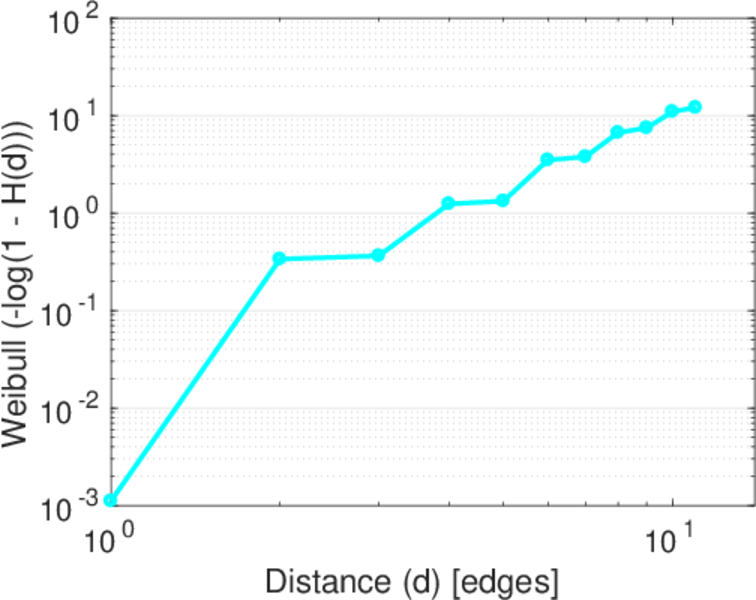
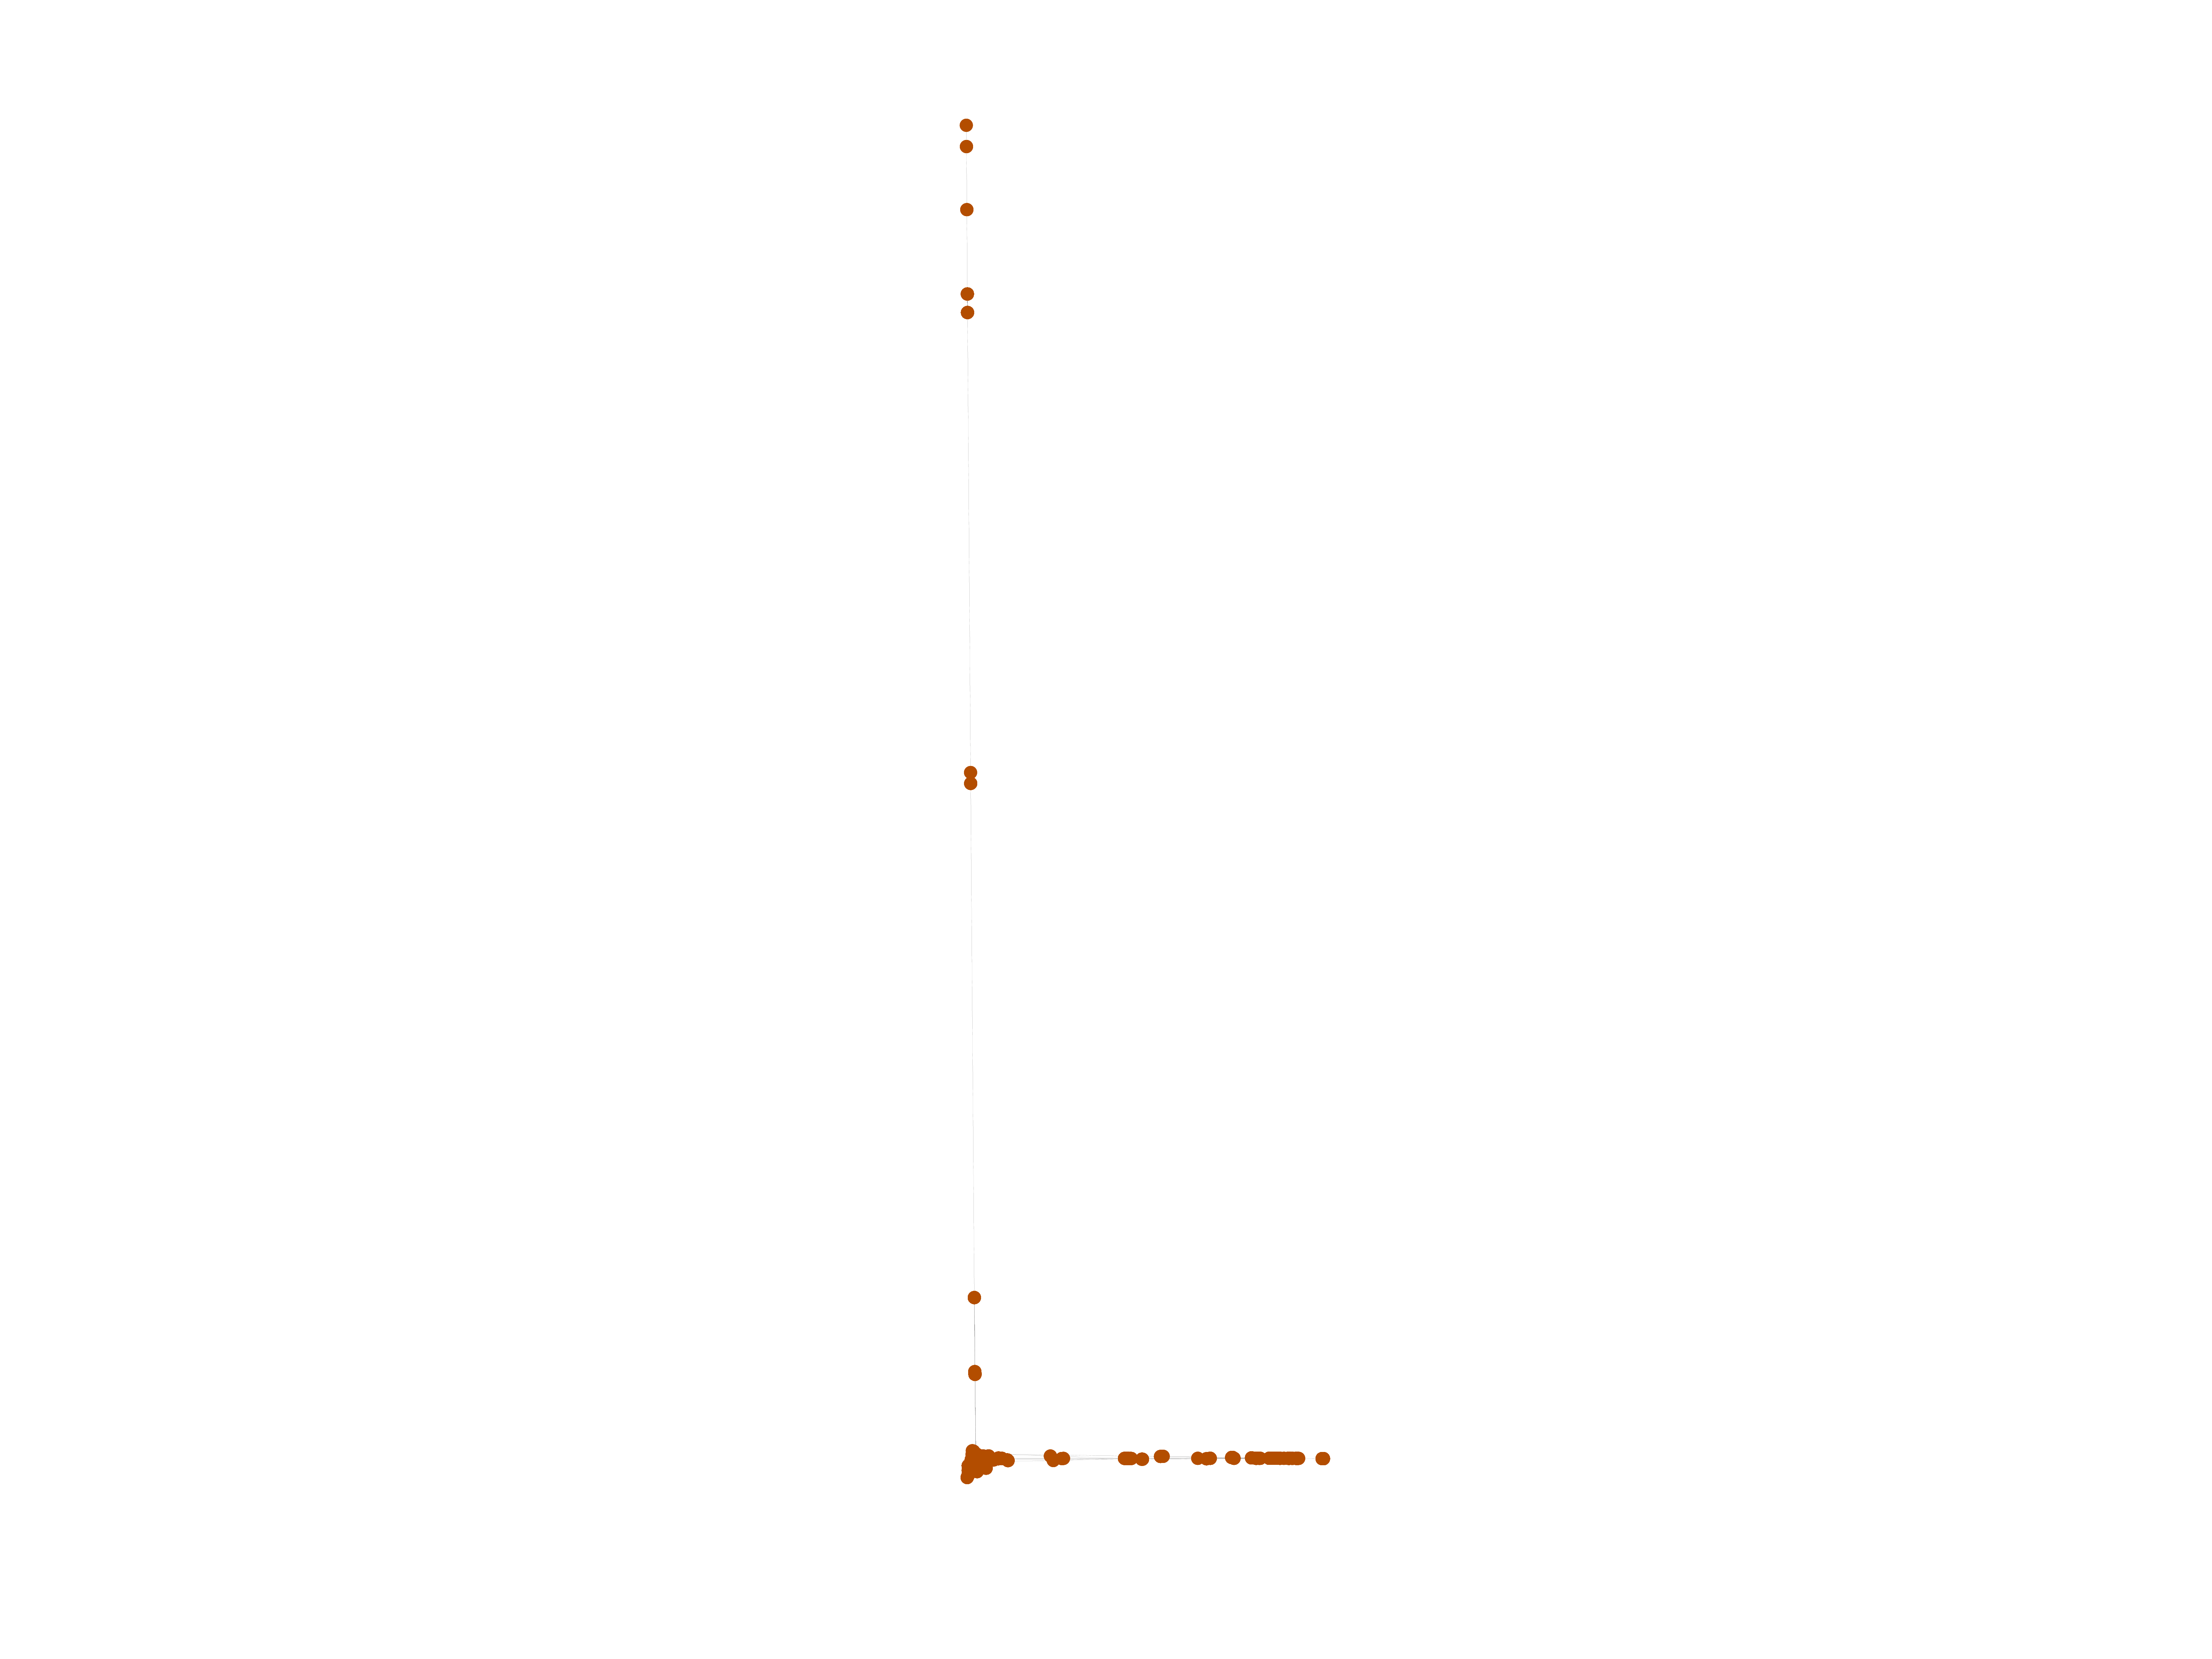
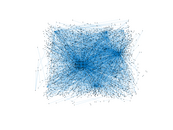
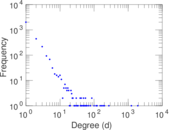
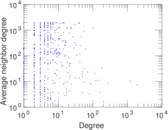
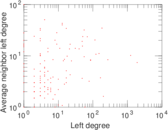
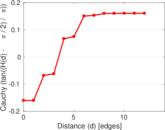
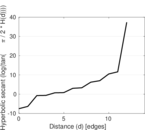
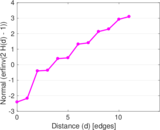
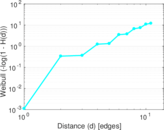
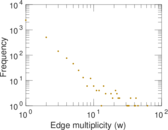
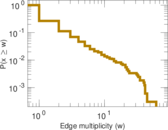
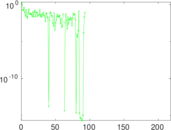
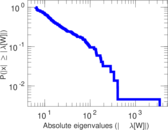
Plots


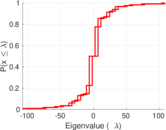
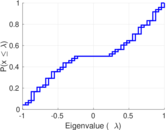


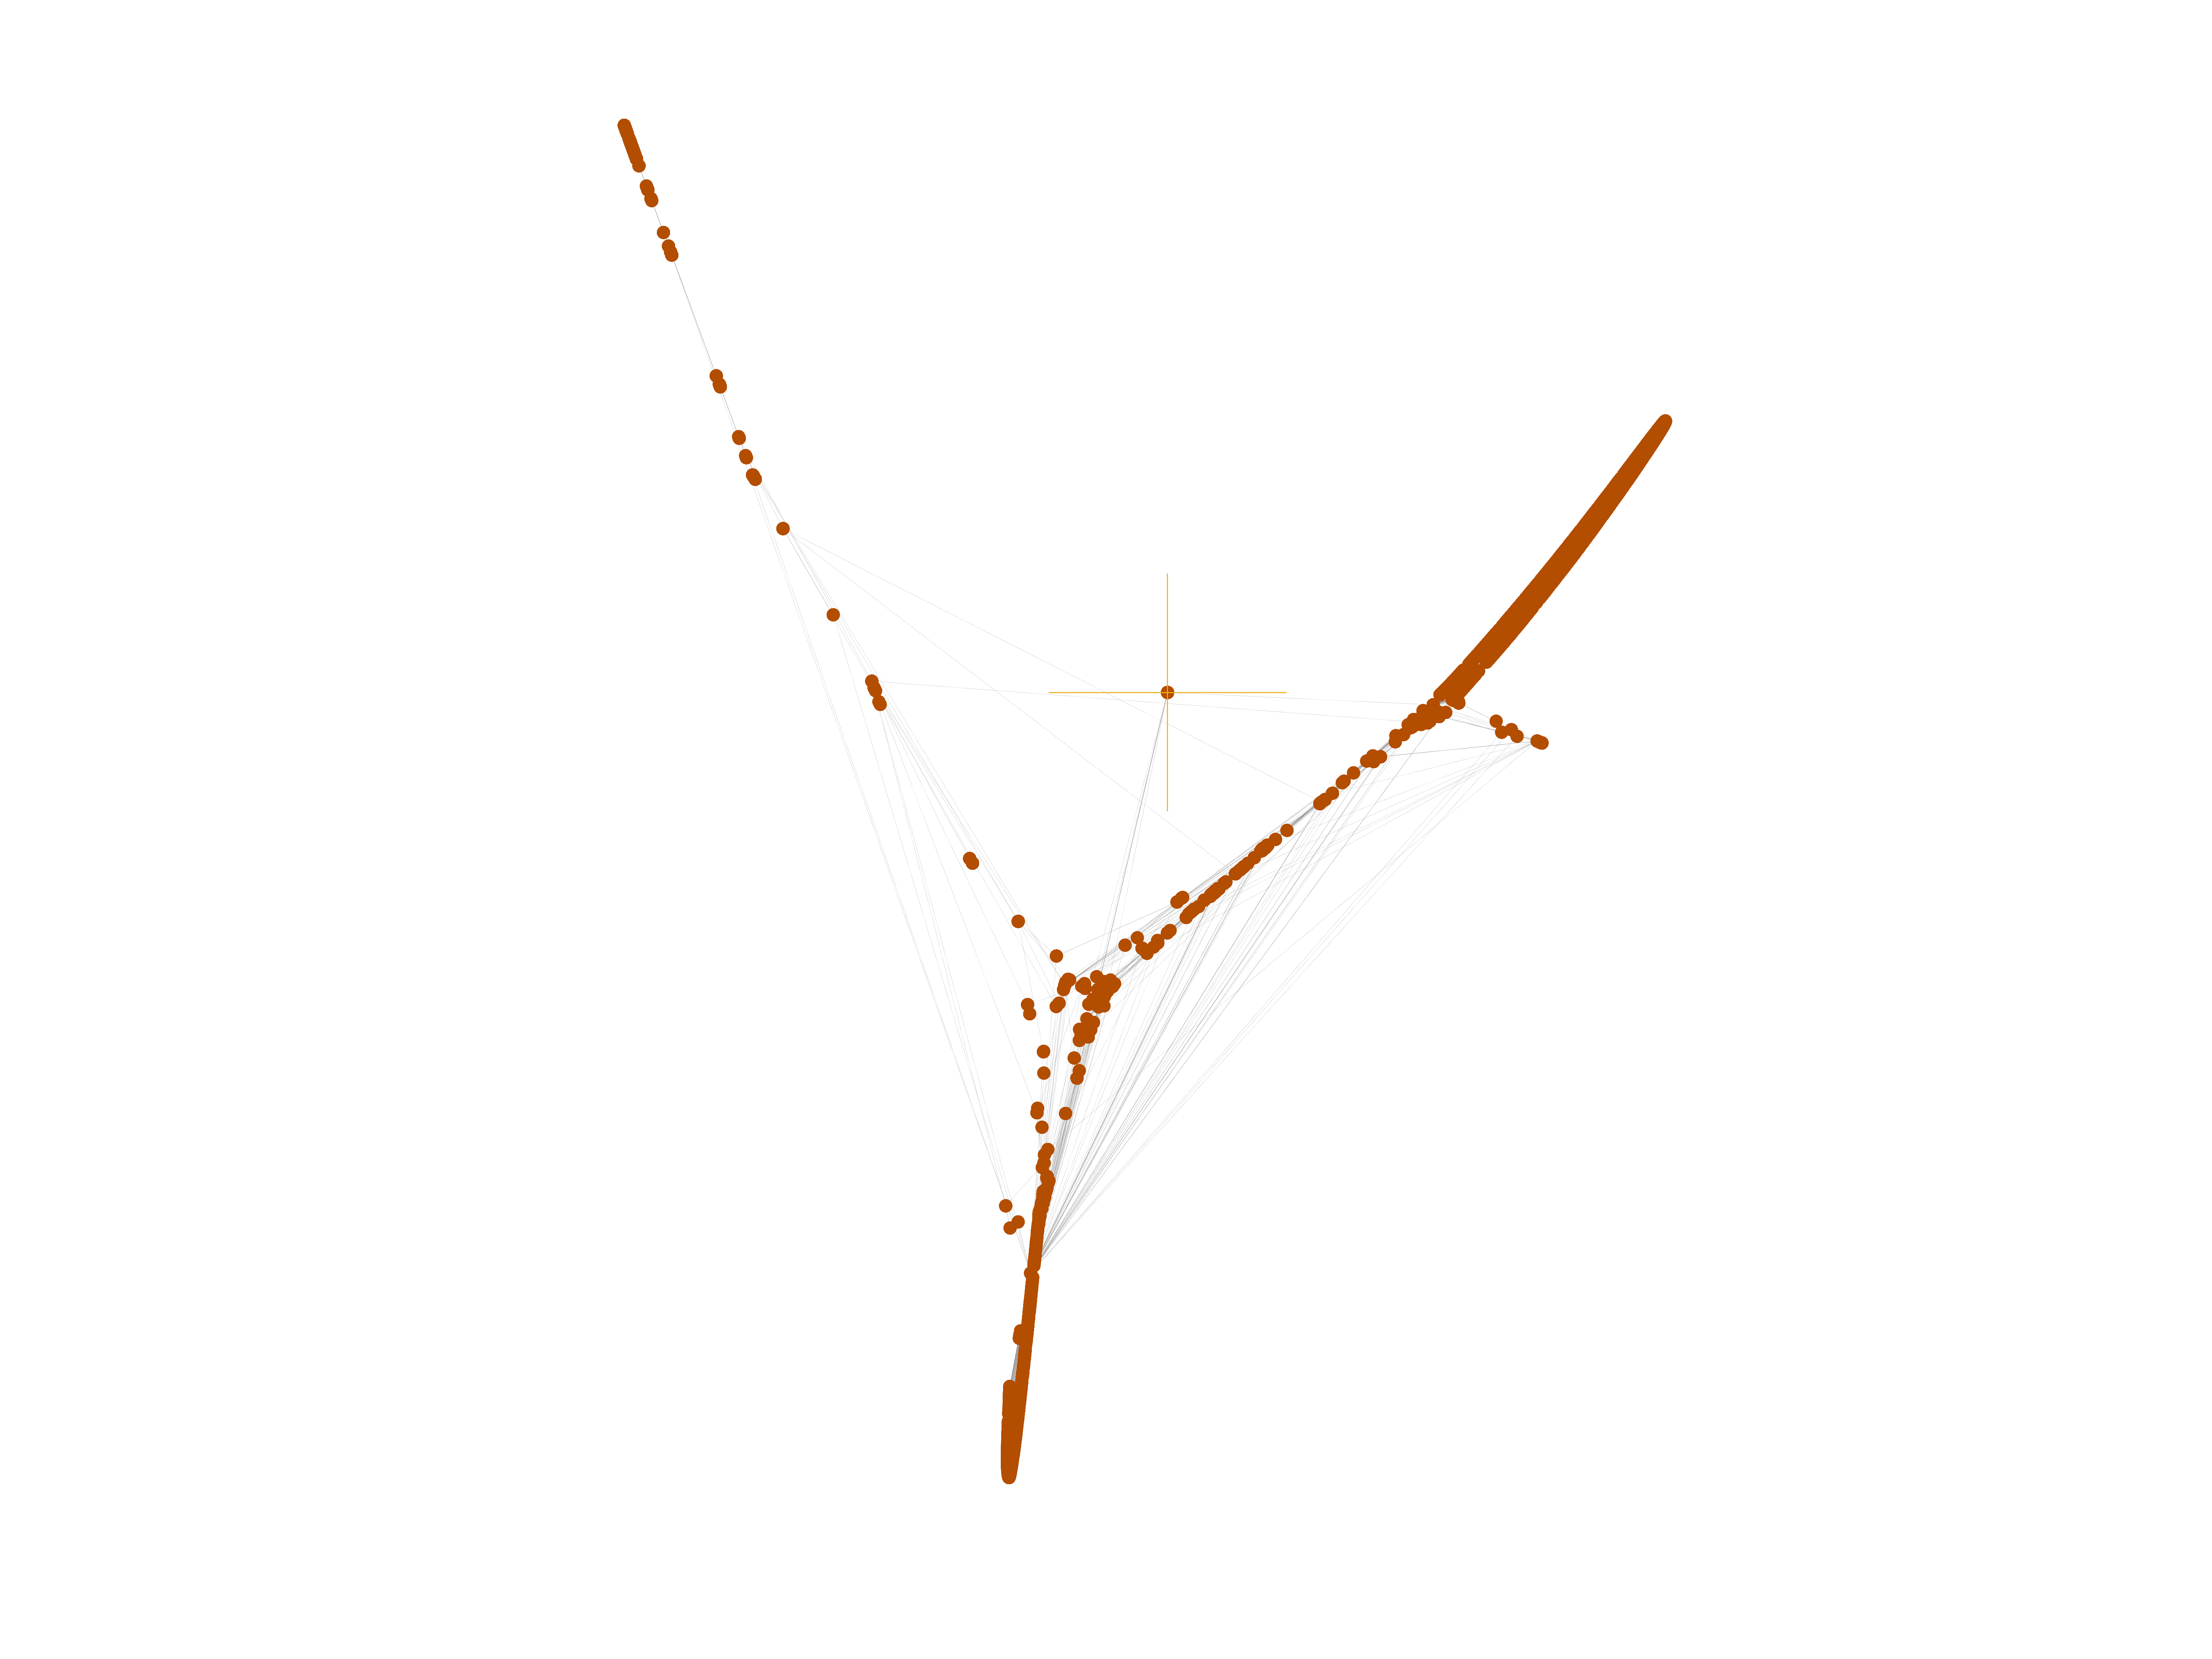
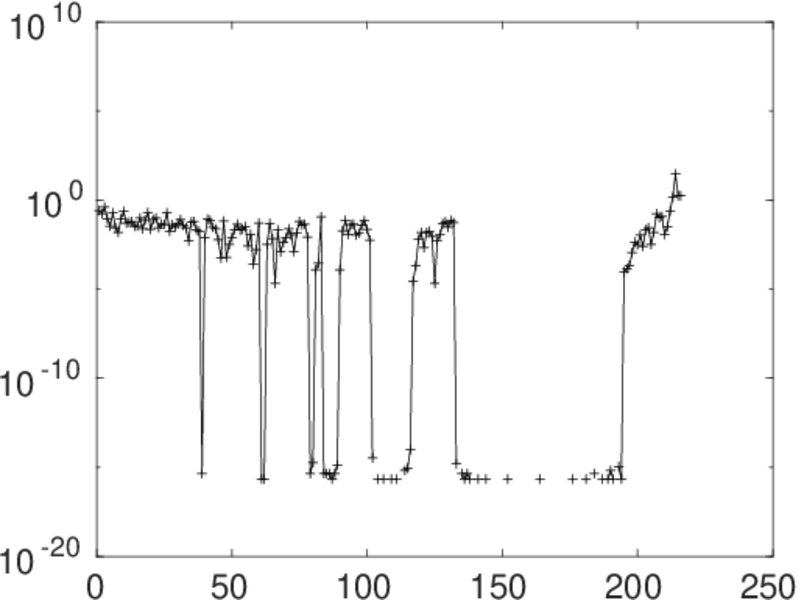
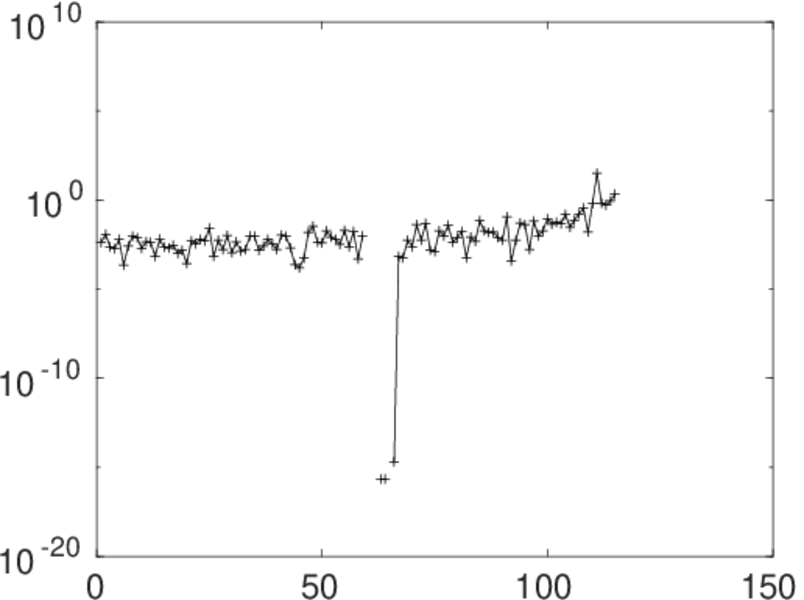
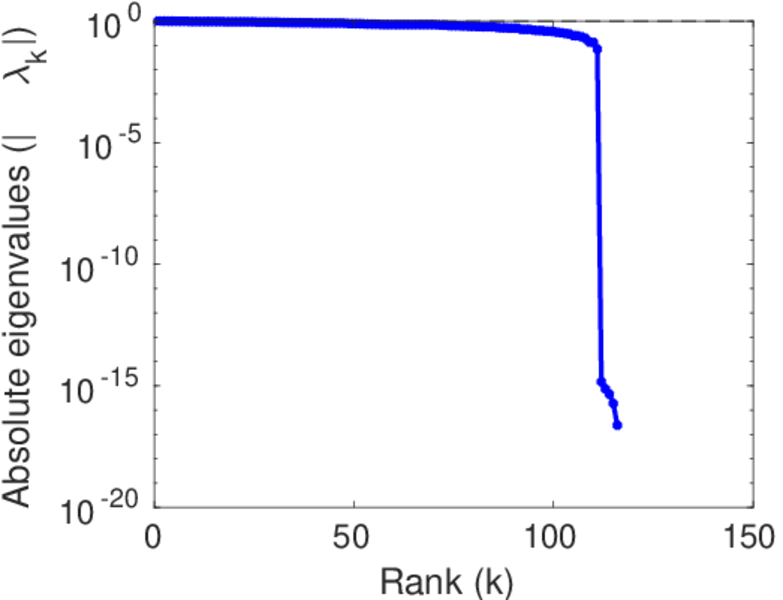
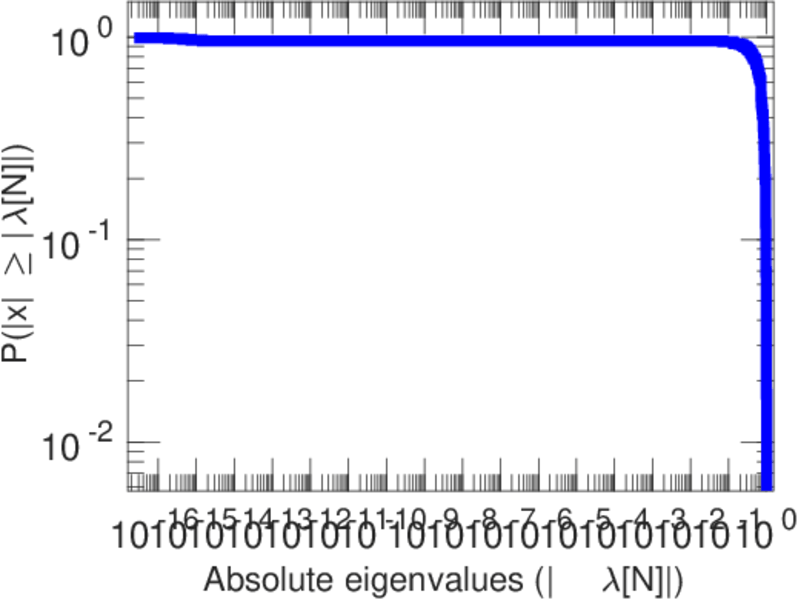
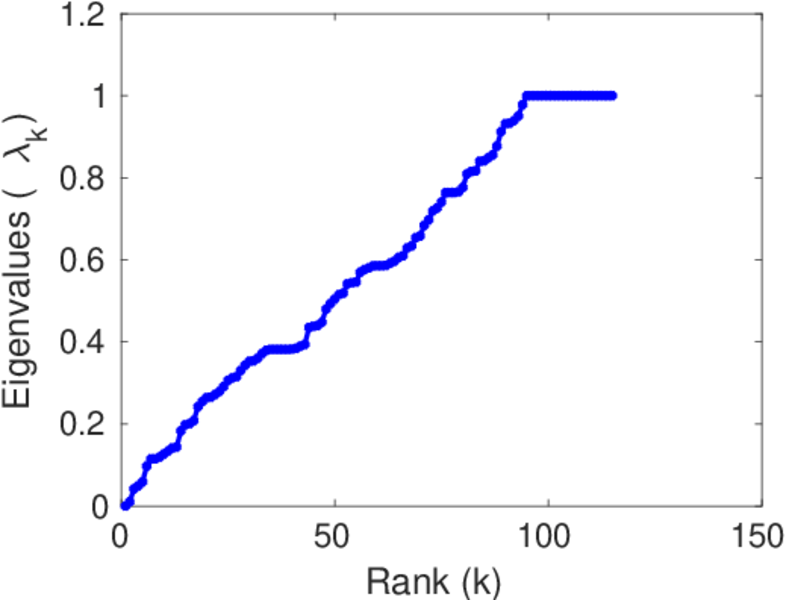
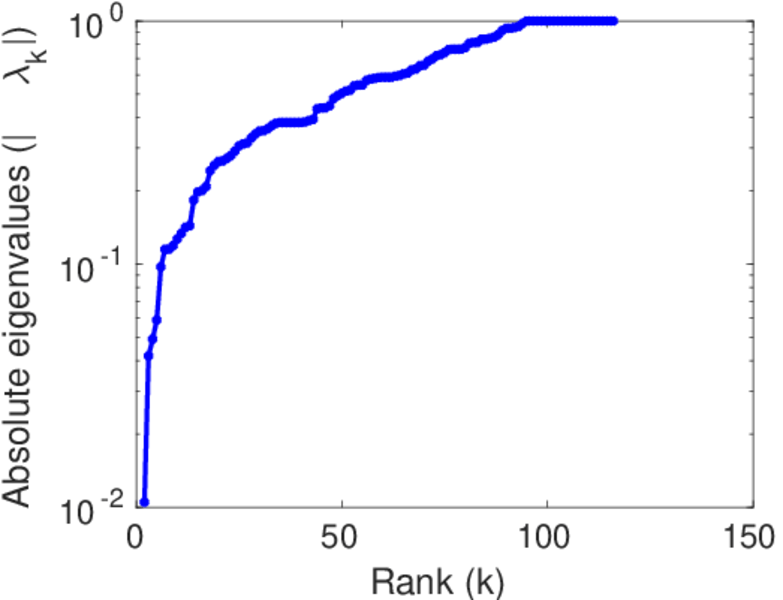
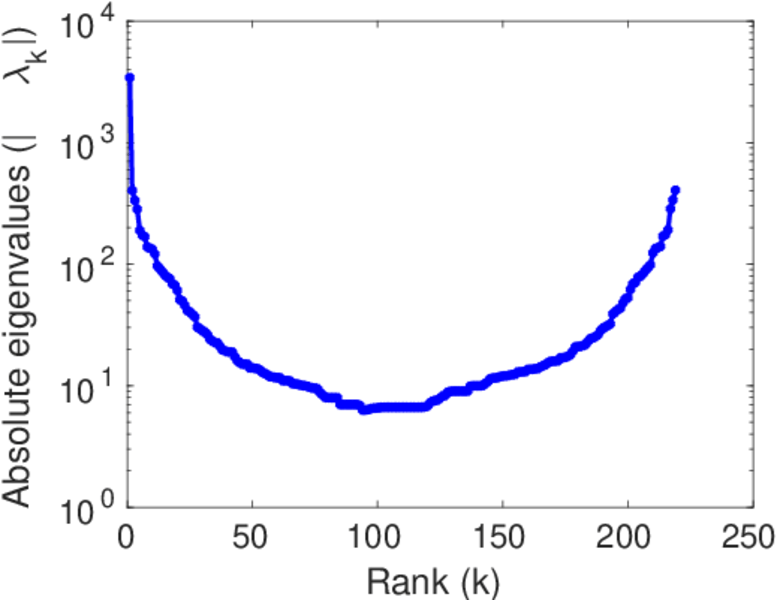
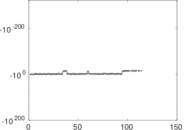
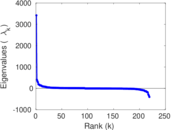
Matrix decompositions plots


Downloads
References
|
[1]
|
Jérôme Kunegis.
KONECT – The Koblenz Network Collection.
In Proc. Int. Conf. on World Wide Web Companion, pages
1343–1350, 2013.
[ http ]
|
|
[2]
|
Wikimedia Foundation.
Wikimedia downloads.
http://dumps.wikimedia.org/, January 2010.
|
 KONECT ‣ Networks ‣
Buy Me a Coffee
KONECT ‣ Networks ‣
Buy Me a Coffee