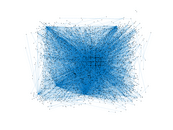
Wiktionary edits (si)
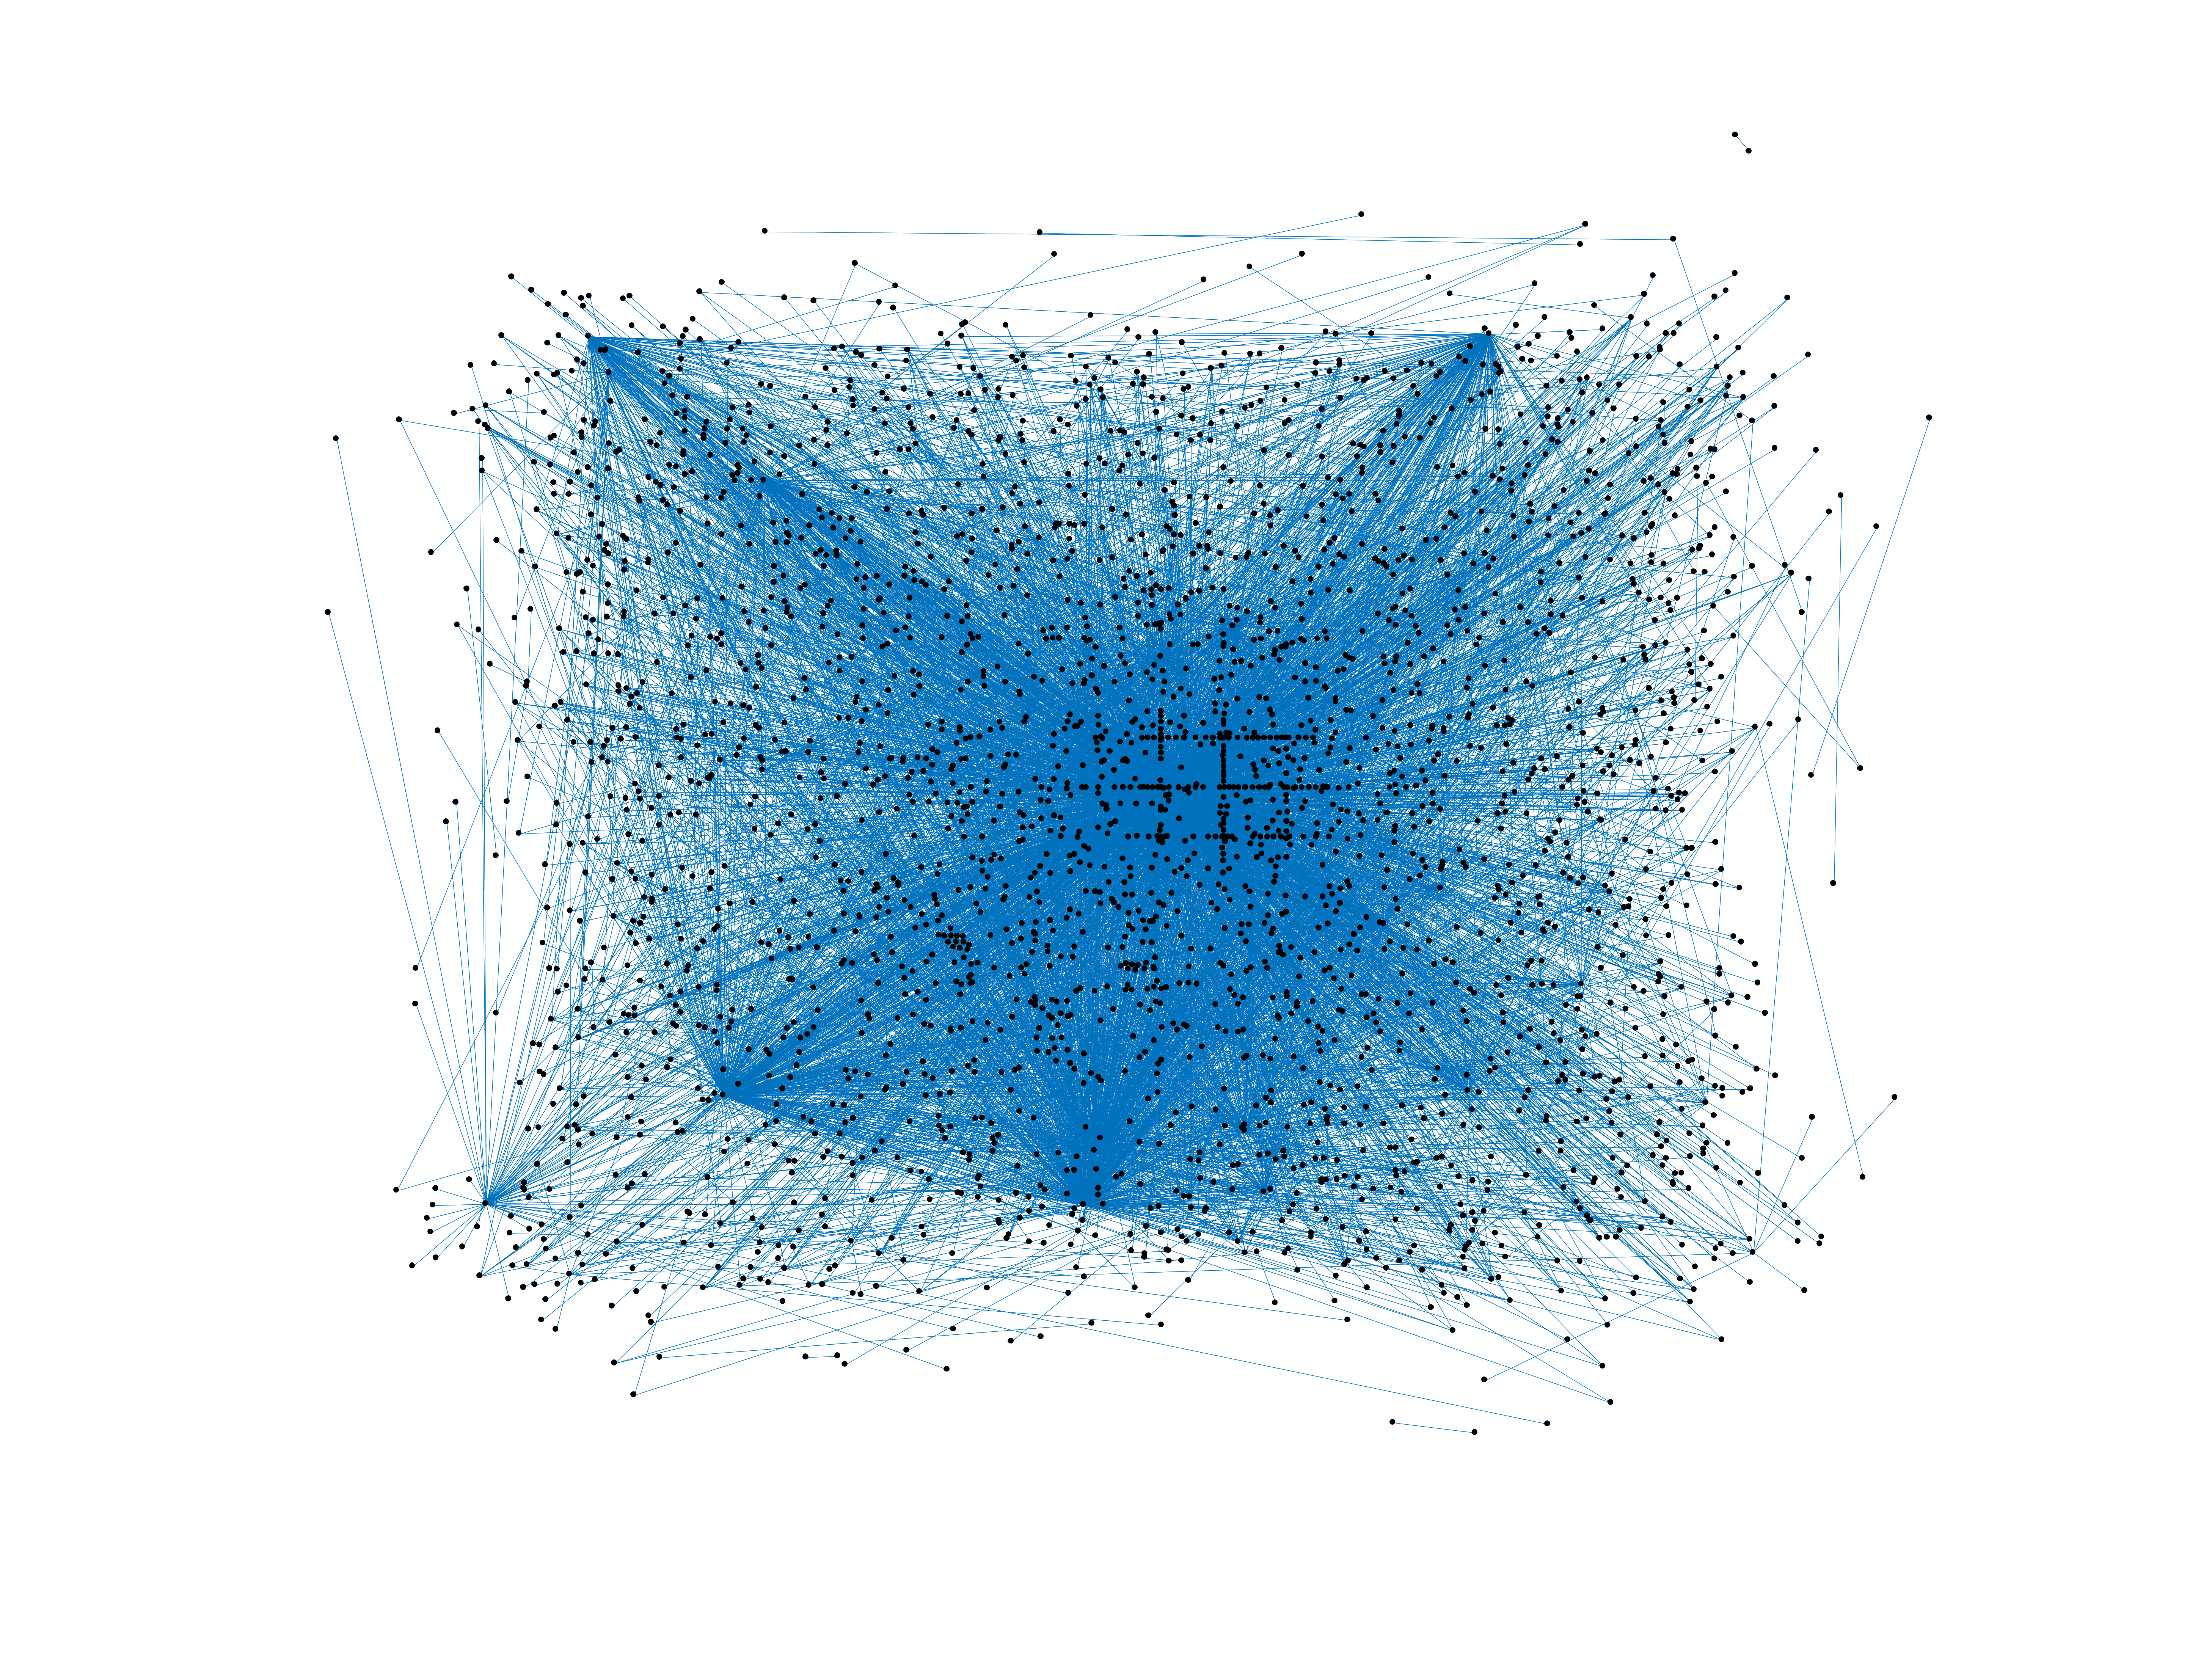
This is the bipartite edit network of the Sinhala Wiktionary. It contains users
and pages from the Sinhala Wiktionary, connected by edit events. Each edge
represents an edit. The dataset includes the timestamp of each edit.
Metadata
Statistics
| Size | n = | 3,016
|
| Left size | n1 = | 232
|
| Right size | n2 = | 2,784
|
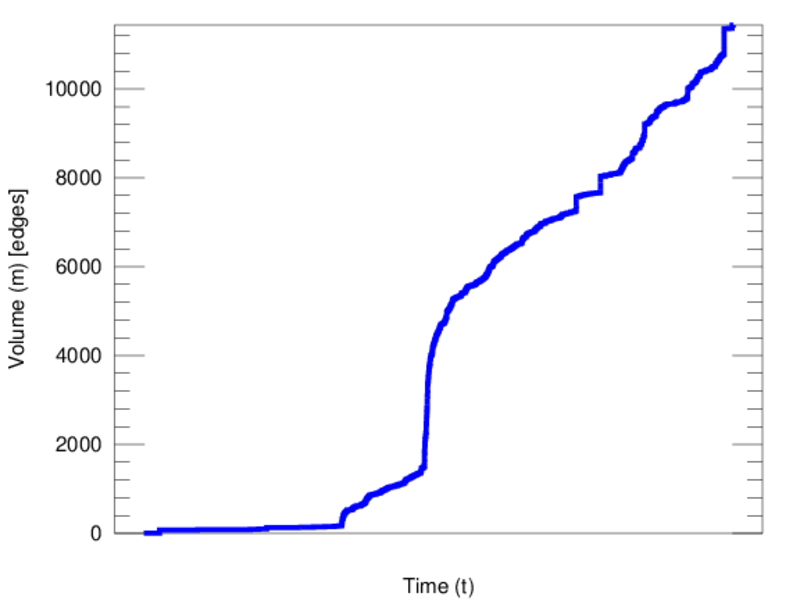
| Volume | m = | 11,439
|
| Unique edge count | m̿ = | 6,263
|
| Wedge count | s = | 1,923,427
|
| Claw count | z = | 778,859,448
|
| Cross count | x = | 287,658,336,183
|
| Square count | q = | 766,073
|
| 4-Tour count | T4 = | 13,835,126
|
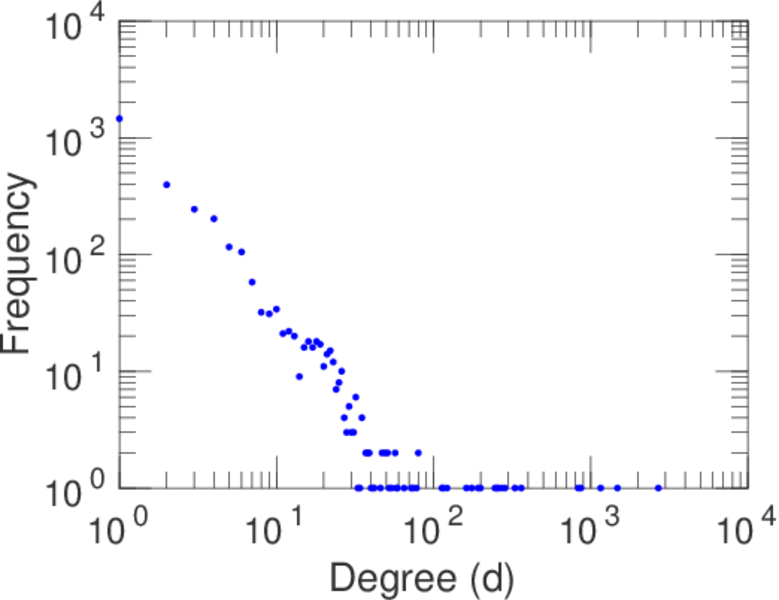
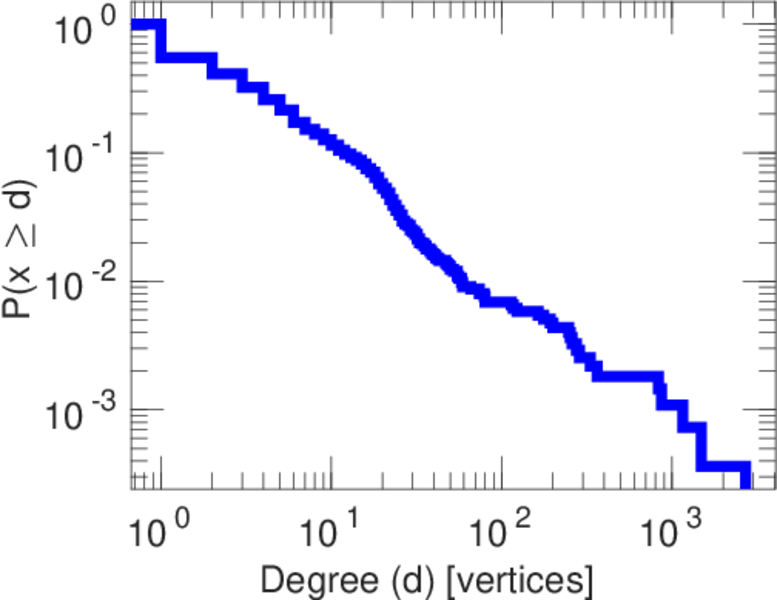
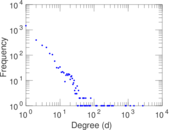
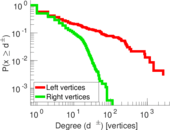
| Maximum degree | dmax = | 2,700
|
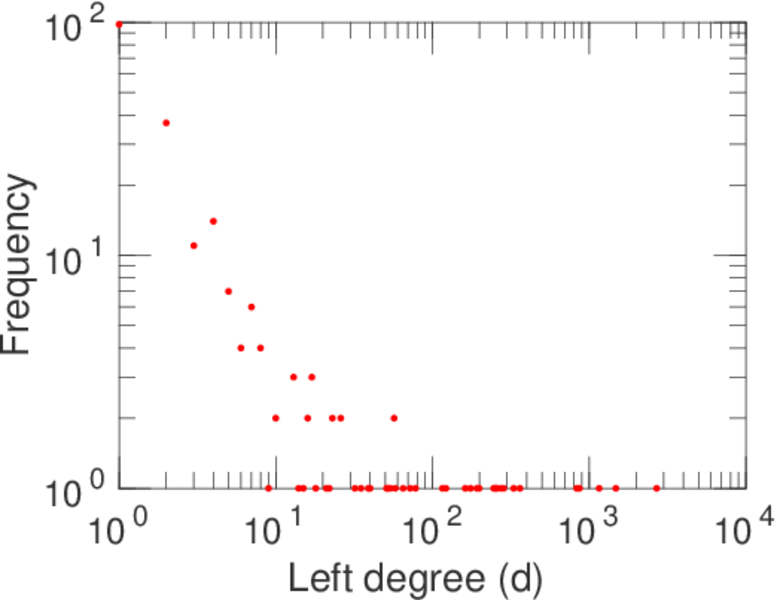
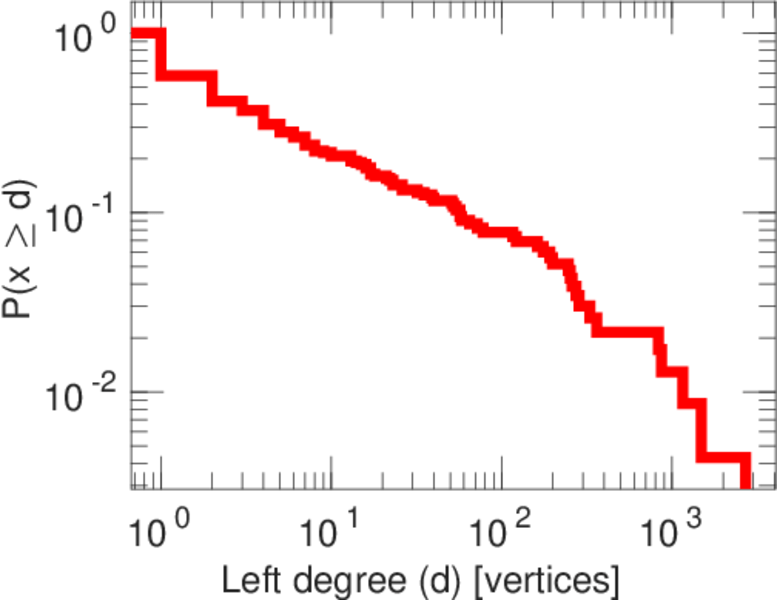
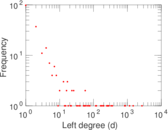
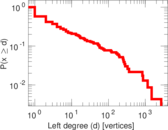
| Maximum left degree | d1max = | 2,700
|
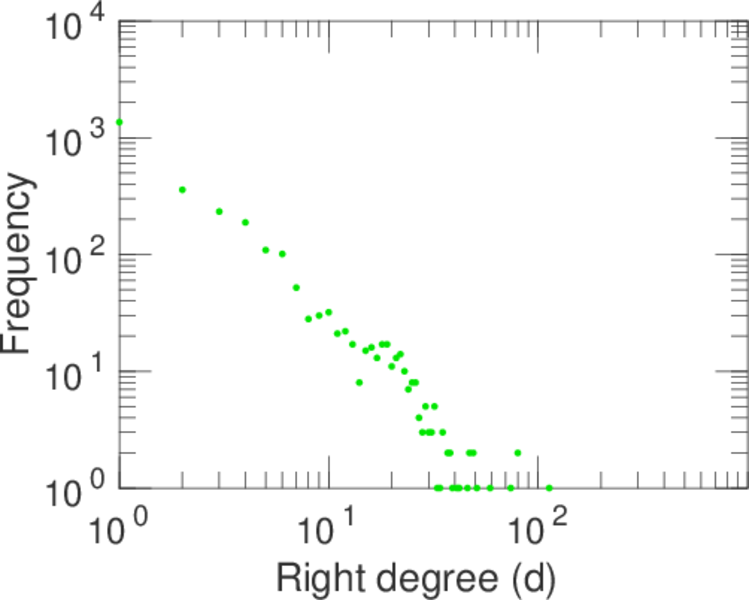
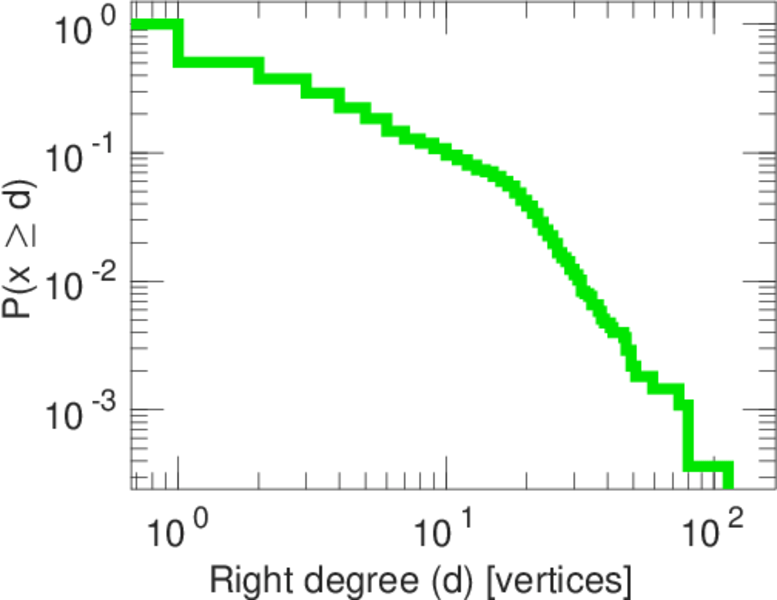
| Maximum right degree | d2max = | 113
|
| Average degree | d = | 7.585 54
|
| Average left degree | d1 = | 49.306 0
|
| Average right degree | d2 = | 4.108 84
|
| Fill | p = | 0.009 696 73
|
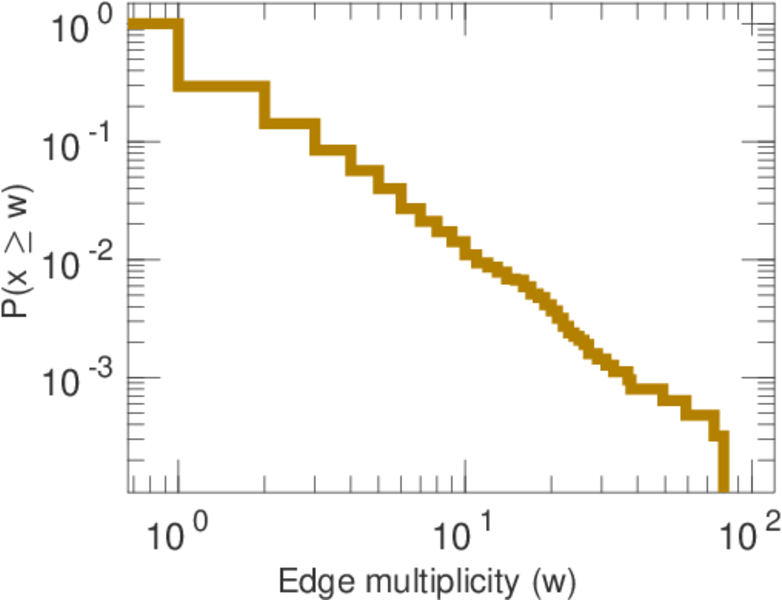
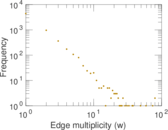
| Average edge multiplicity | m̃ = | 1.826 44
|
| Size of LCC | N = | 2,673
|
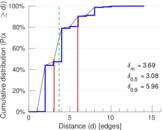
| Diameter | δ = | 16
|
| 50-Percentile effective diameter | δ0.5 = | 3.084 60
|
| 90-Percentile effective diameter | δ0.9 = | 5.959 90
|
| Median distance | δM = | 4
|
| Mean distance | δm = | 3.693 98
|
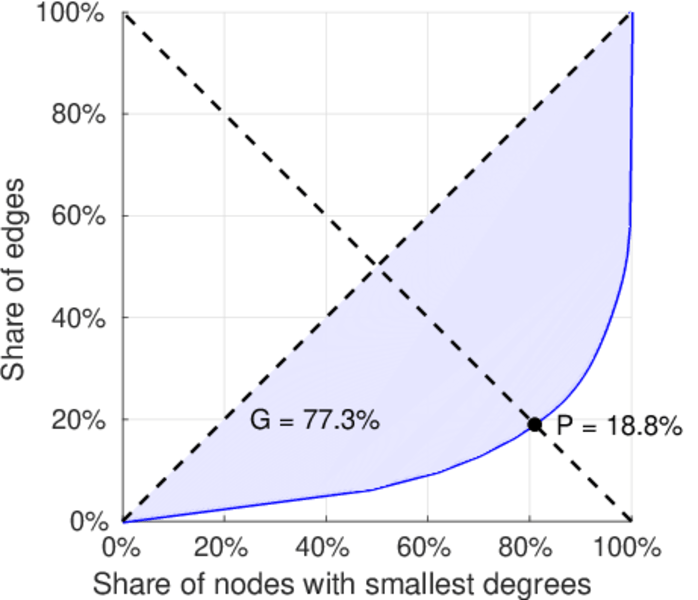
| Gini coefficient | G = | 0.773 615
|
| Balanced inequality ratio | P = | 0.190 795
|
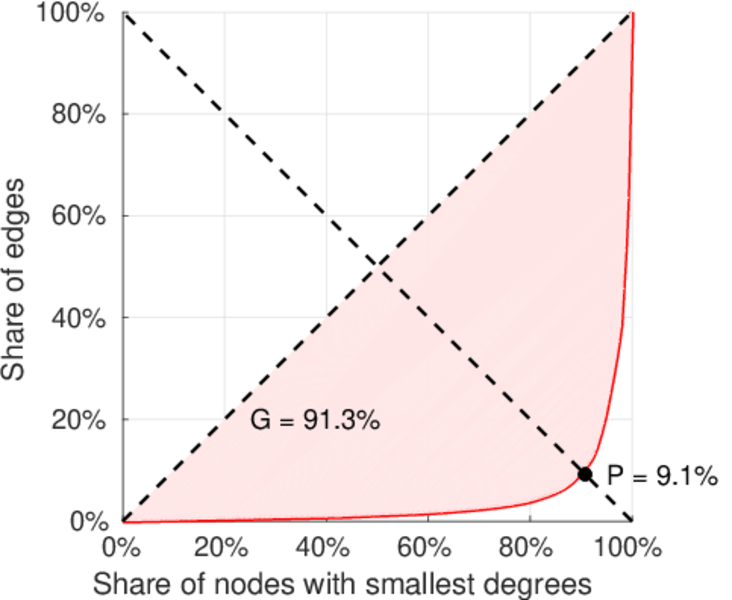
| Left balanced inequality ratio | P1 = | 0.090 567 4
|
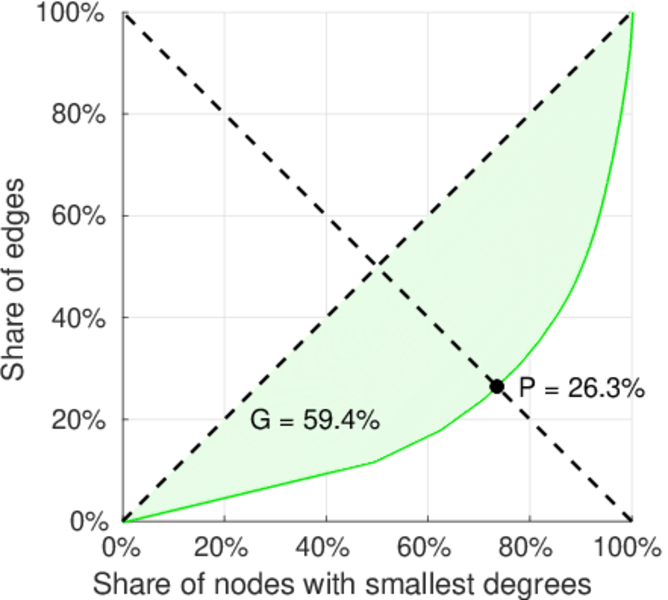
| Right balanced inequality ratio | P2 = | 0.263 047
|
| Relative edge distribution entropy | Her = | 0.757 608
|
| Power law exponent | γ = | 2.791 03
|
| Tail power law exponent | γt = | 2.011 00
|
| Tail power law exponent with p | γ3 = | 2.011 00
|
| p-value | p = | 0.000 00
|
| Left tail power law exponent with p | γ3,1 = | 1.641 00
|
| Left p-value | p1 = | 0.031 000 0
|
| Right tail power law exponent with p | γ3,2 = | 2.071 00
|
| Right p-value | p2 = | 0.000 00
|
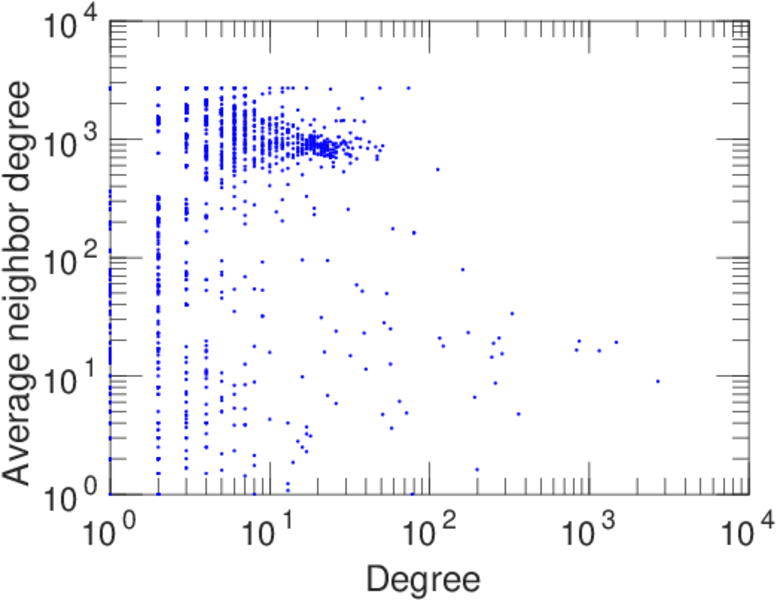
| Degree assortativity | ρ = | −0.323 530
|
| Degree assortativity p-value | pρ = | 1.492 42 × 10−152
|
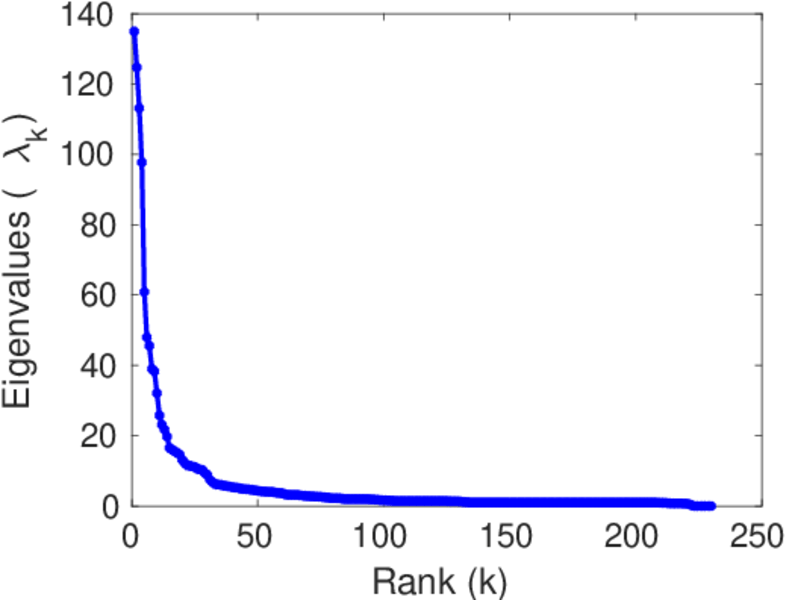
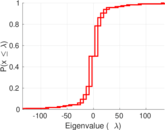
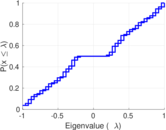
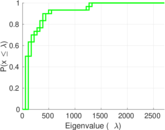
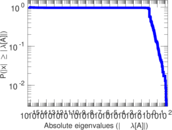
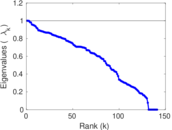
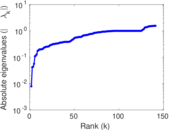
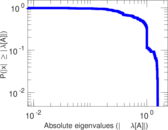
| Spectral norm | α = | 134.970
|
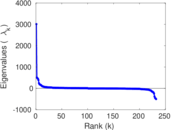
| Algebraic connectivity | a = | 0.007 856 83
|
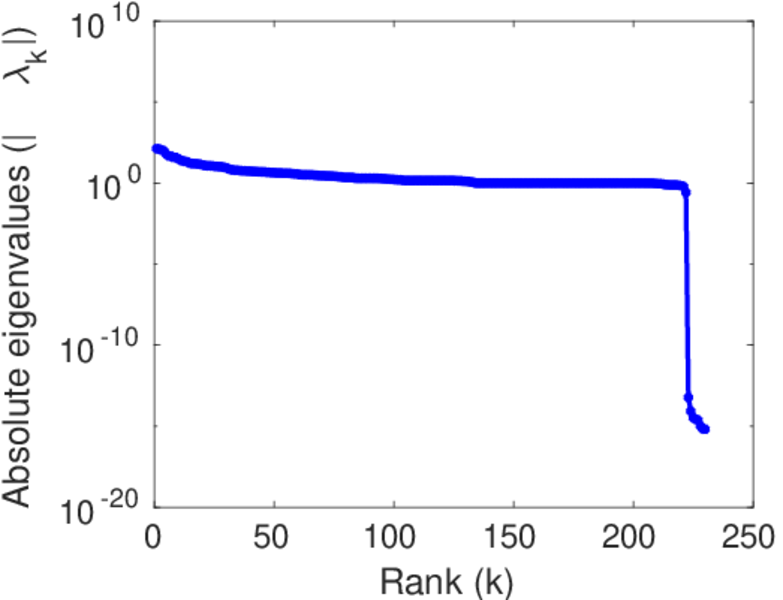
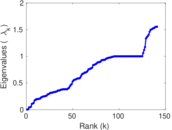
| Spectral separation | |λ1[A] / λ2[A]| = | 1.082 23
|
| Controllability | C = | 2,540
|
| Relative controllability | Cr = | 0.851 206
|
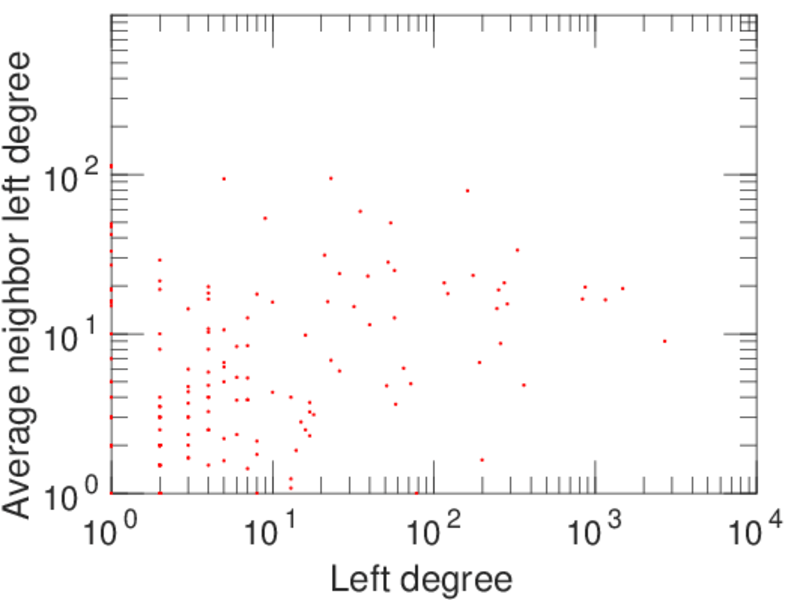
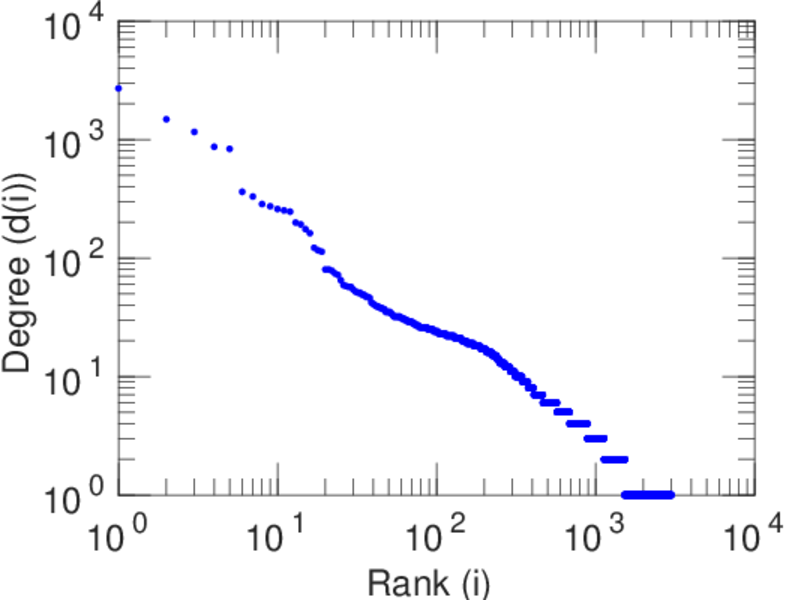
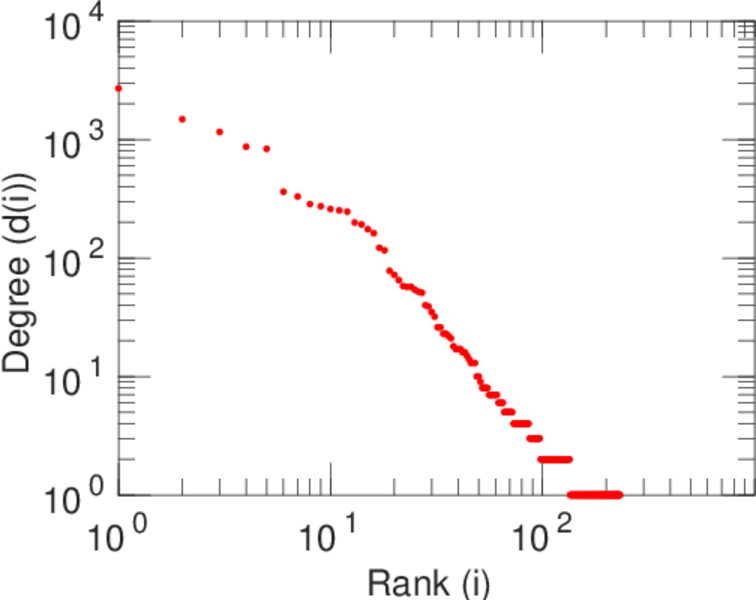
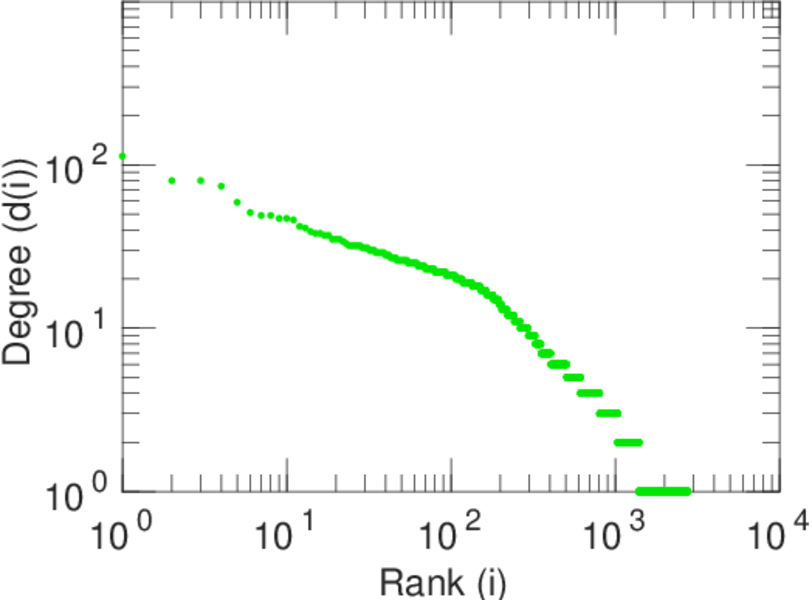
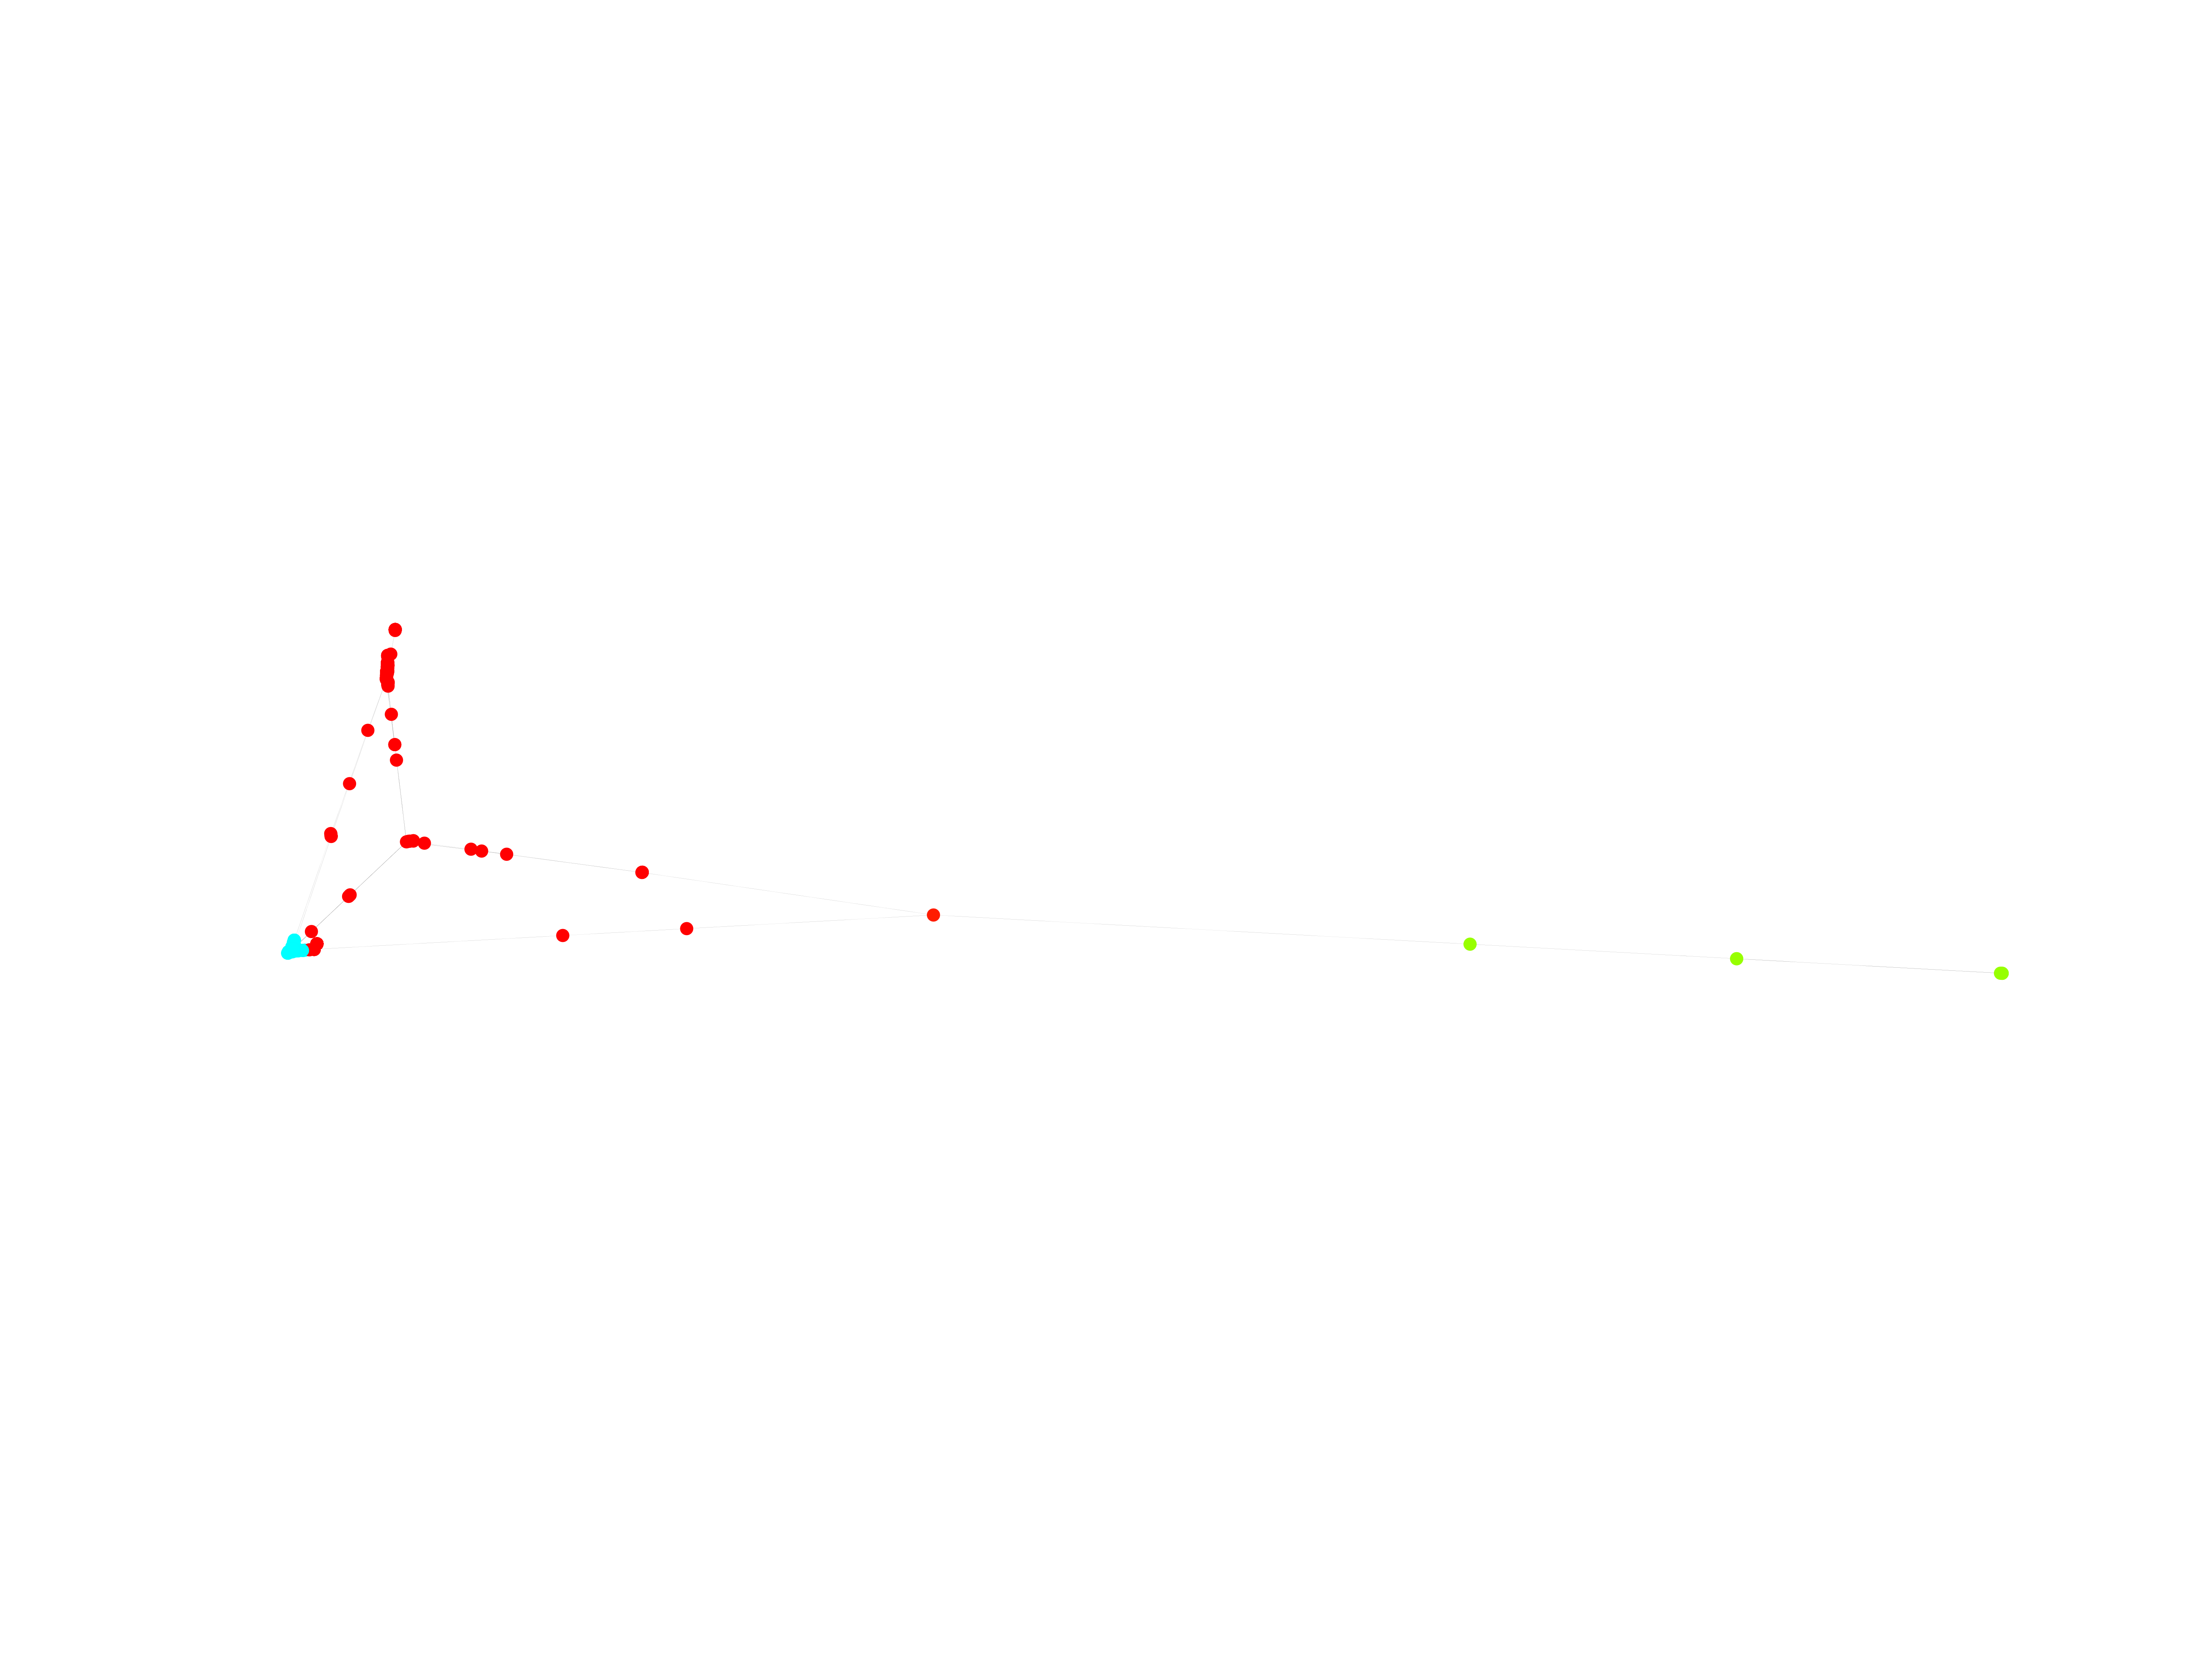
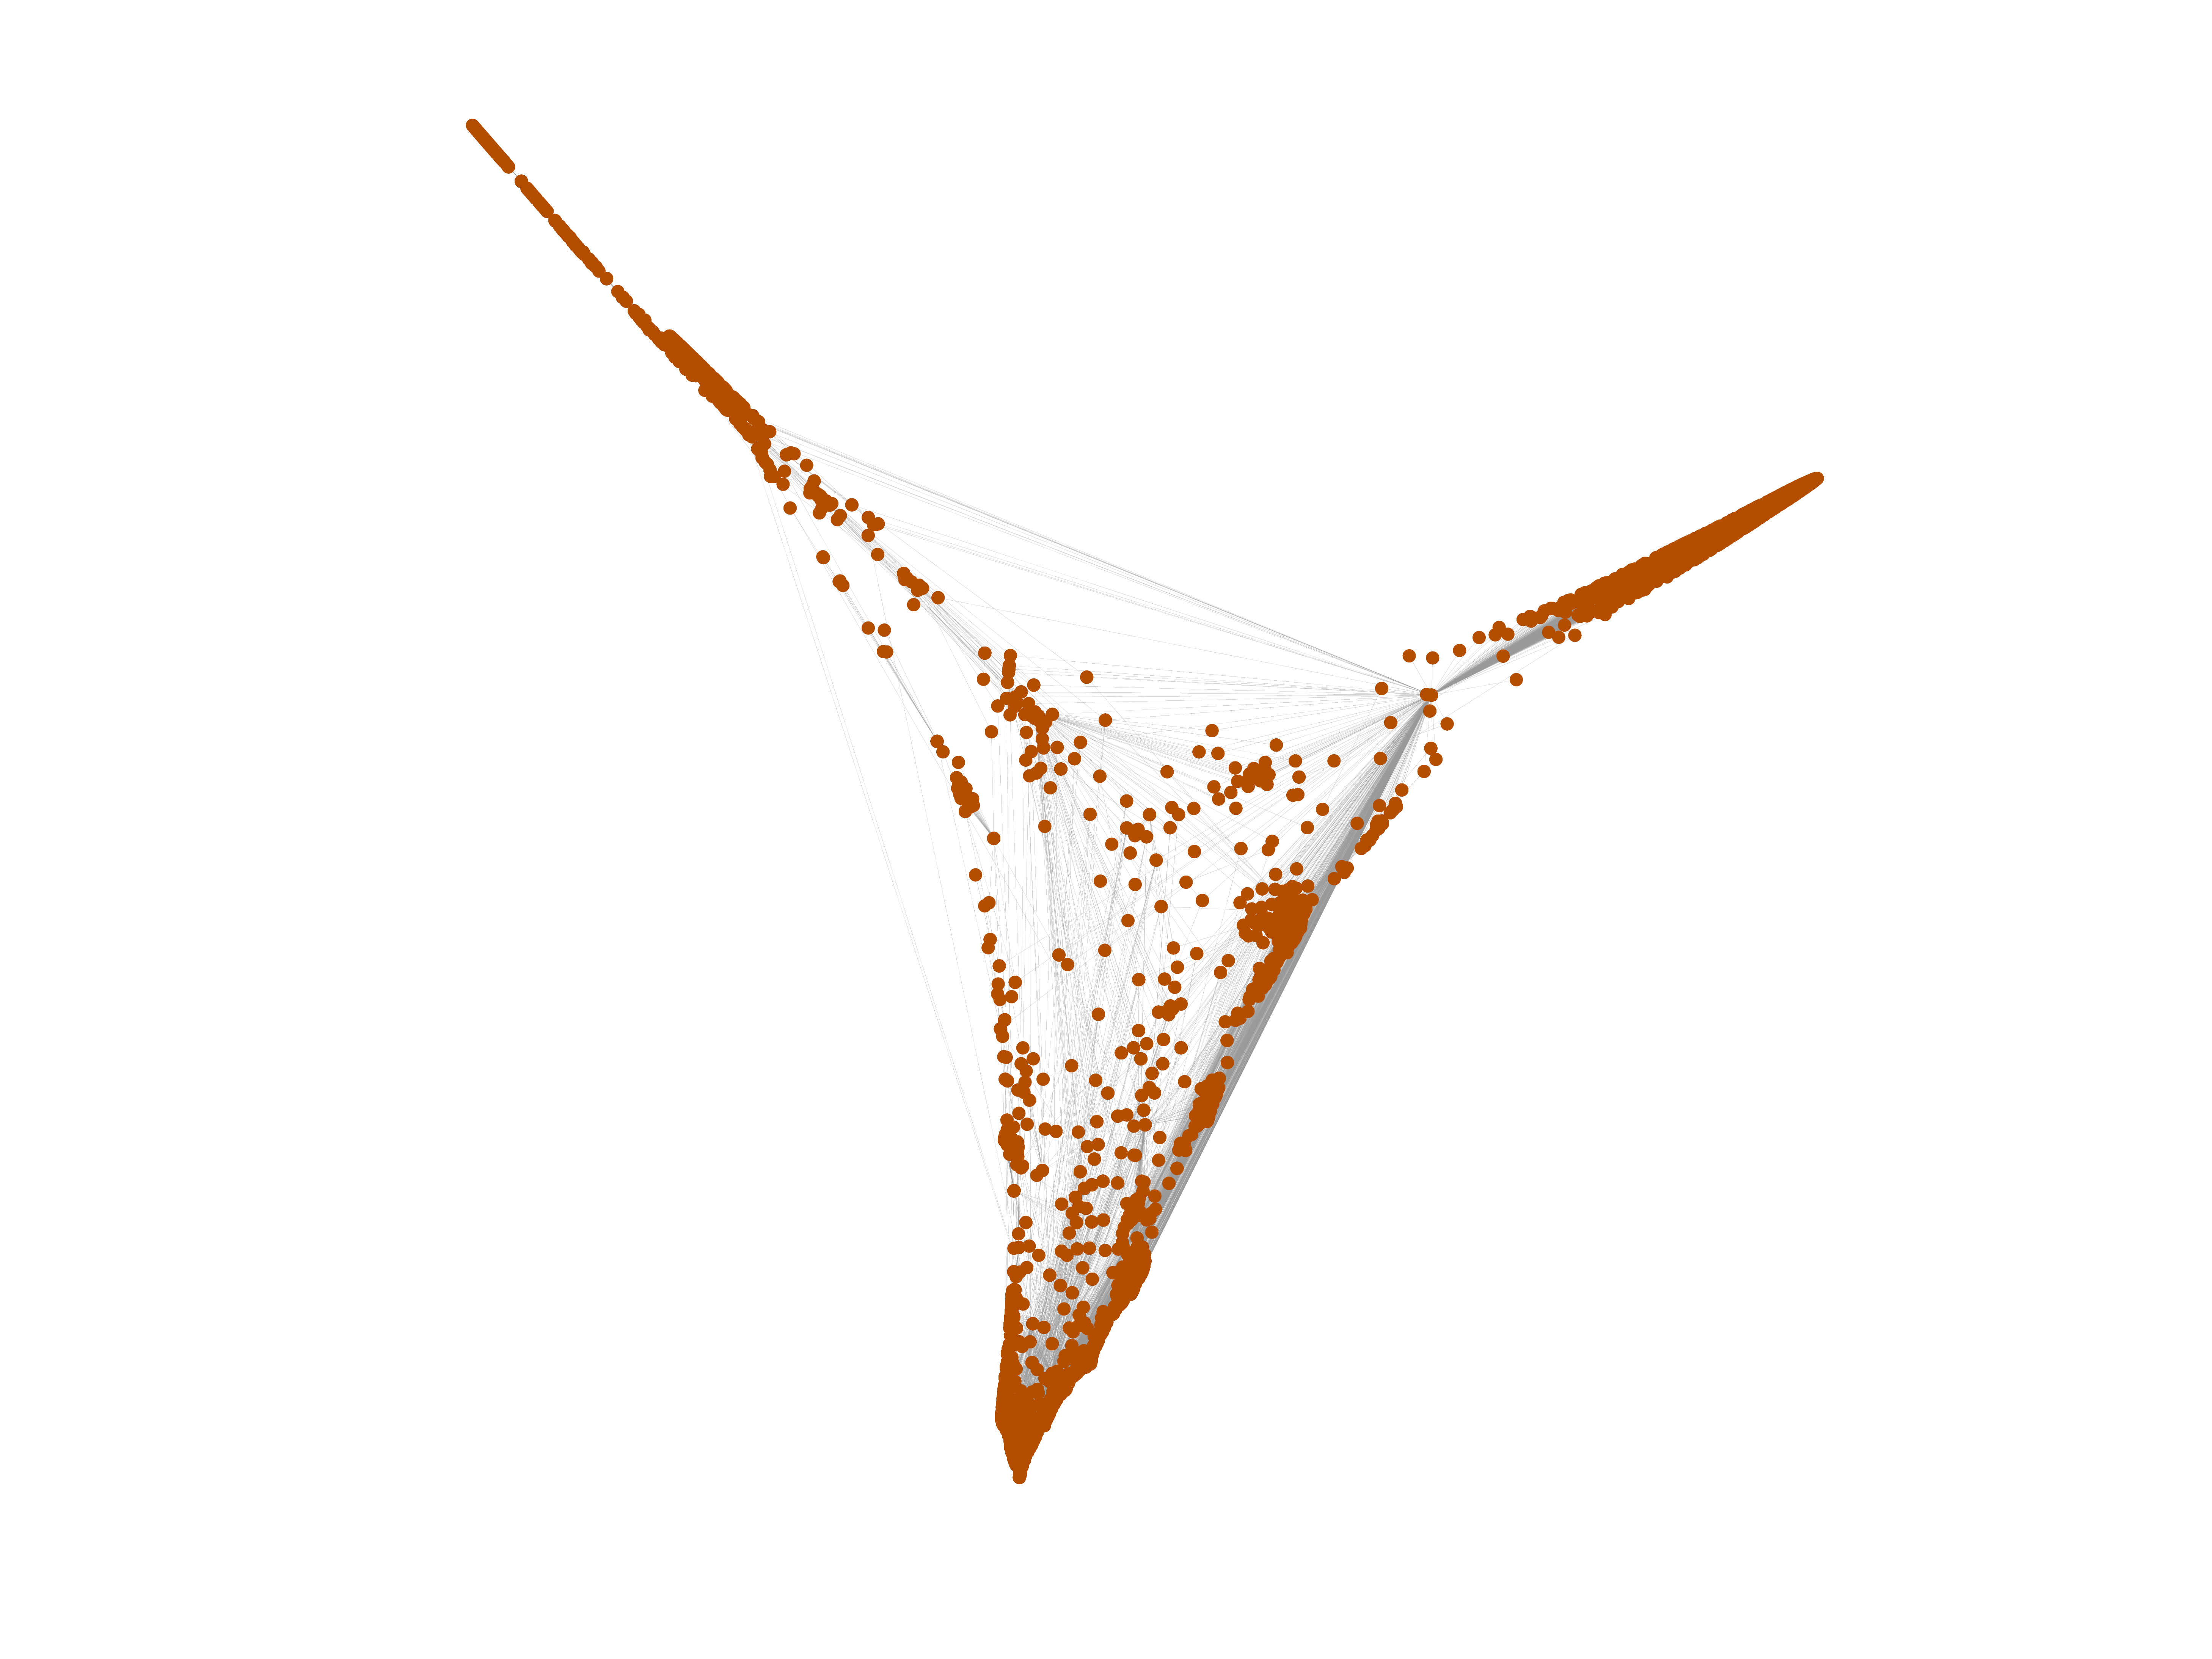
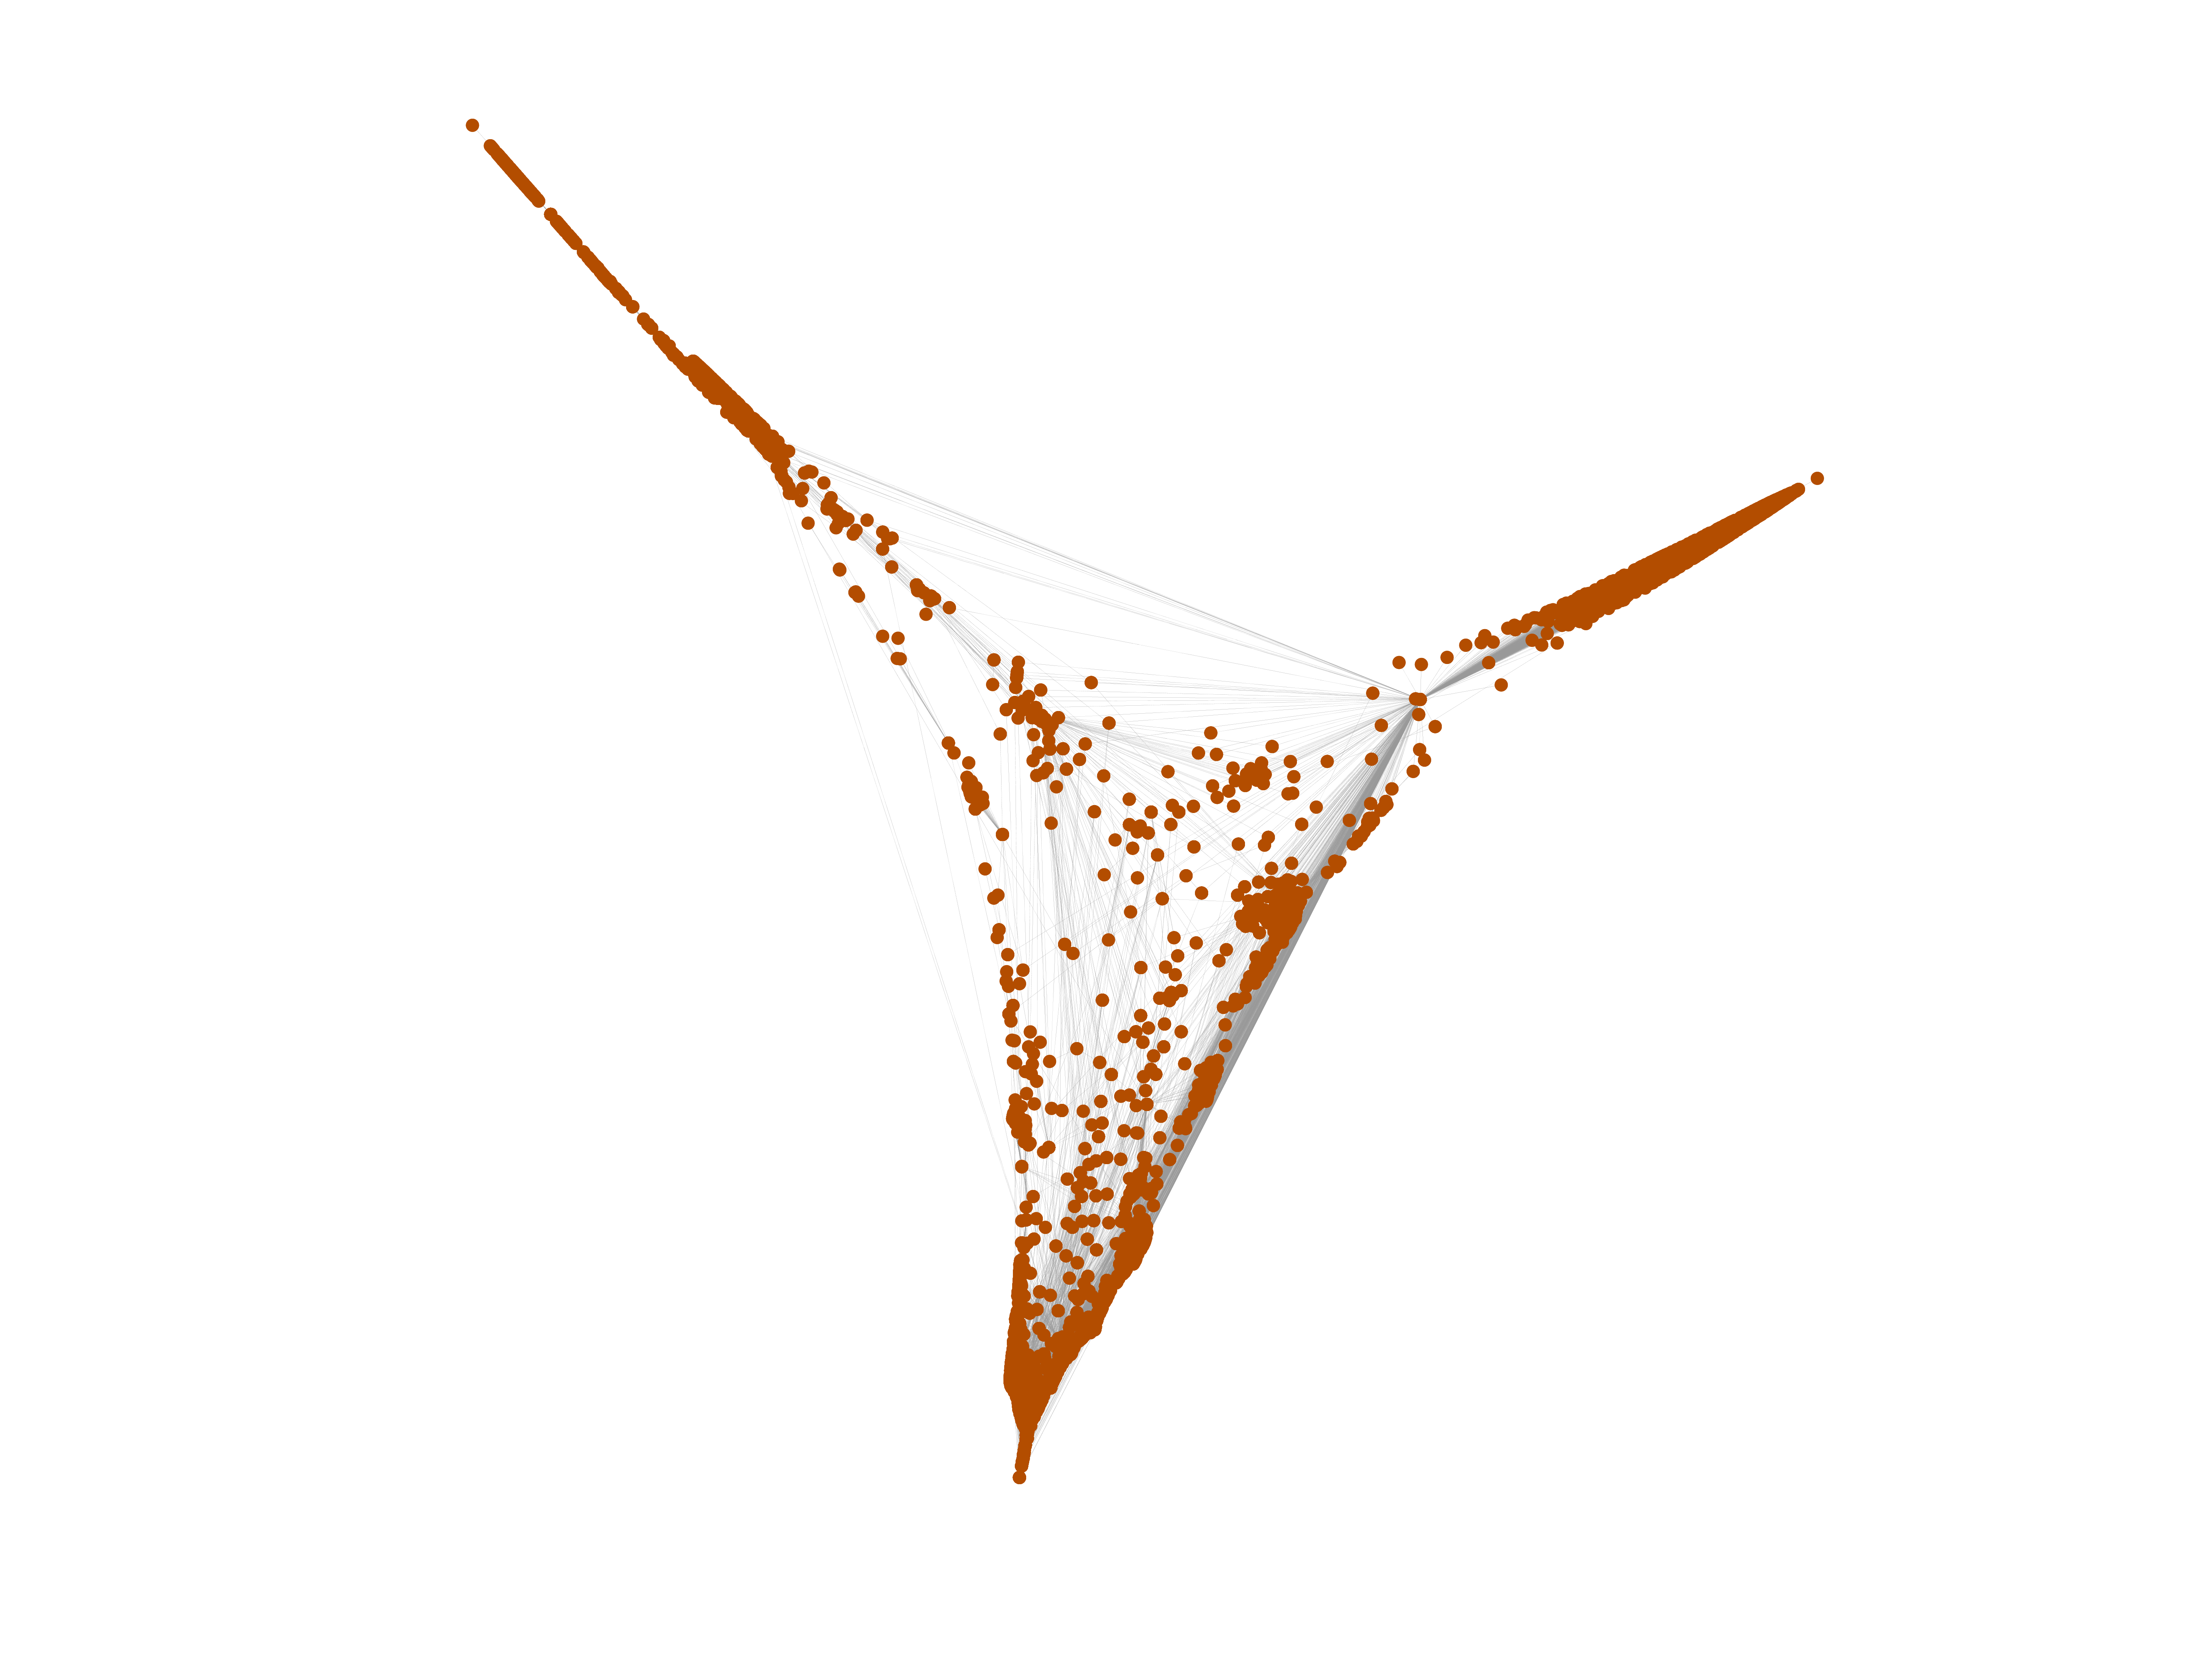
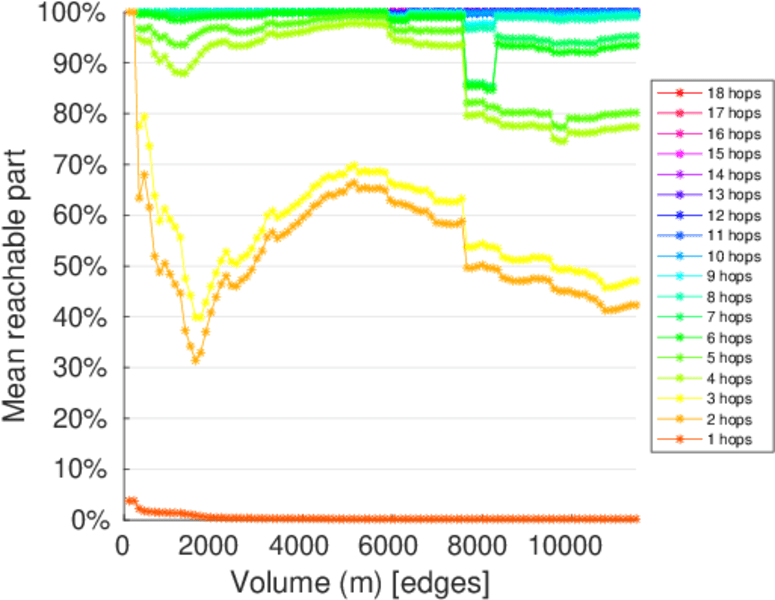
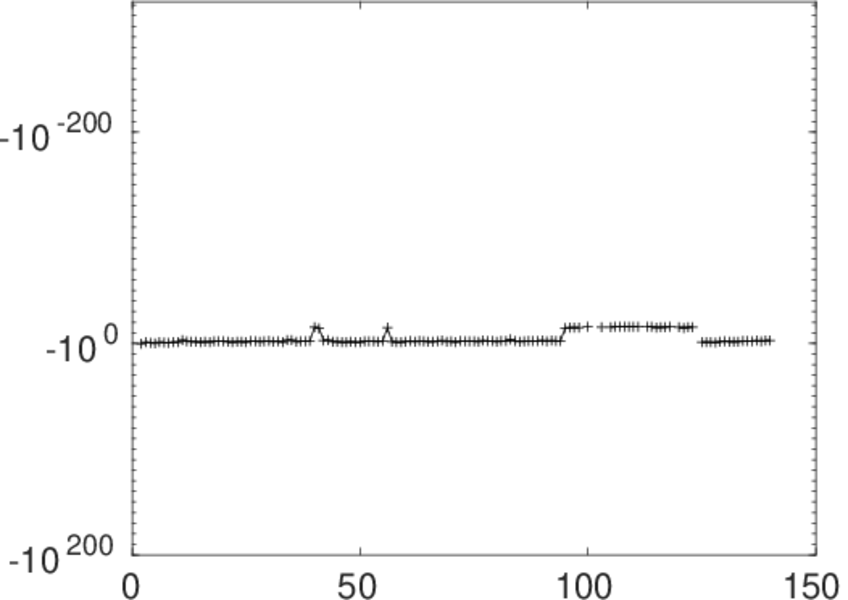
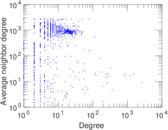
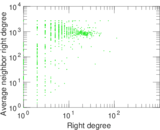
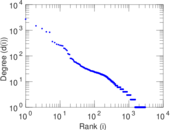
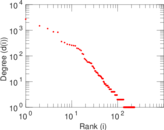
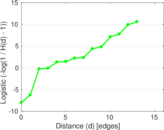
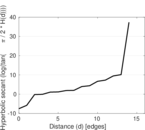
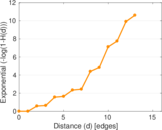
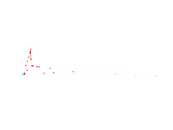
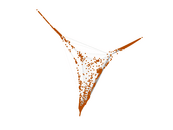
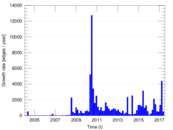
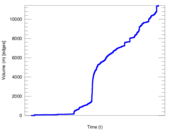
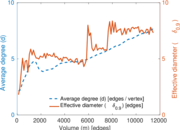
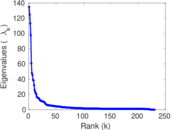
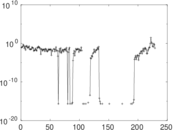
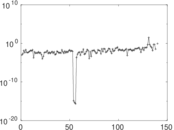
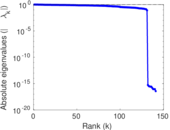
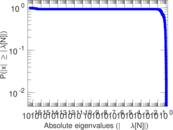
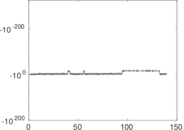
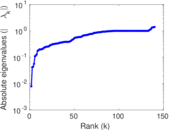
Plots


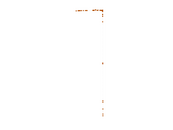


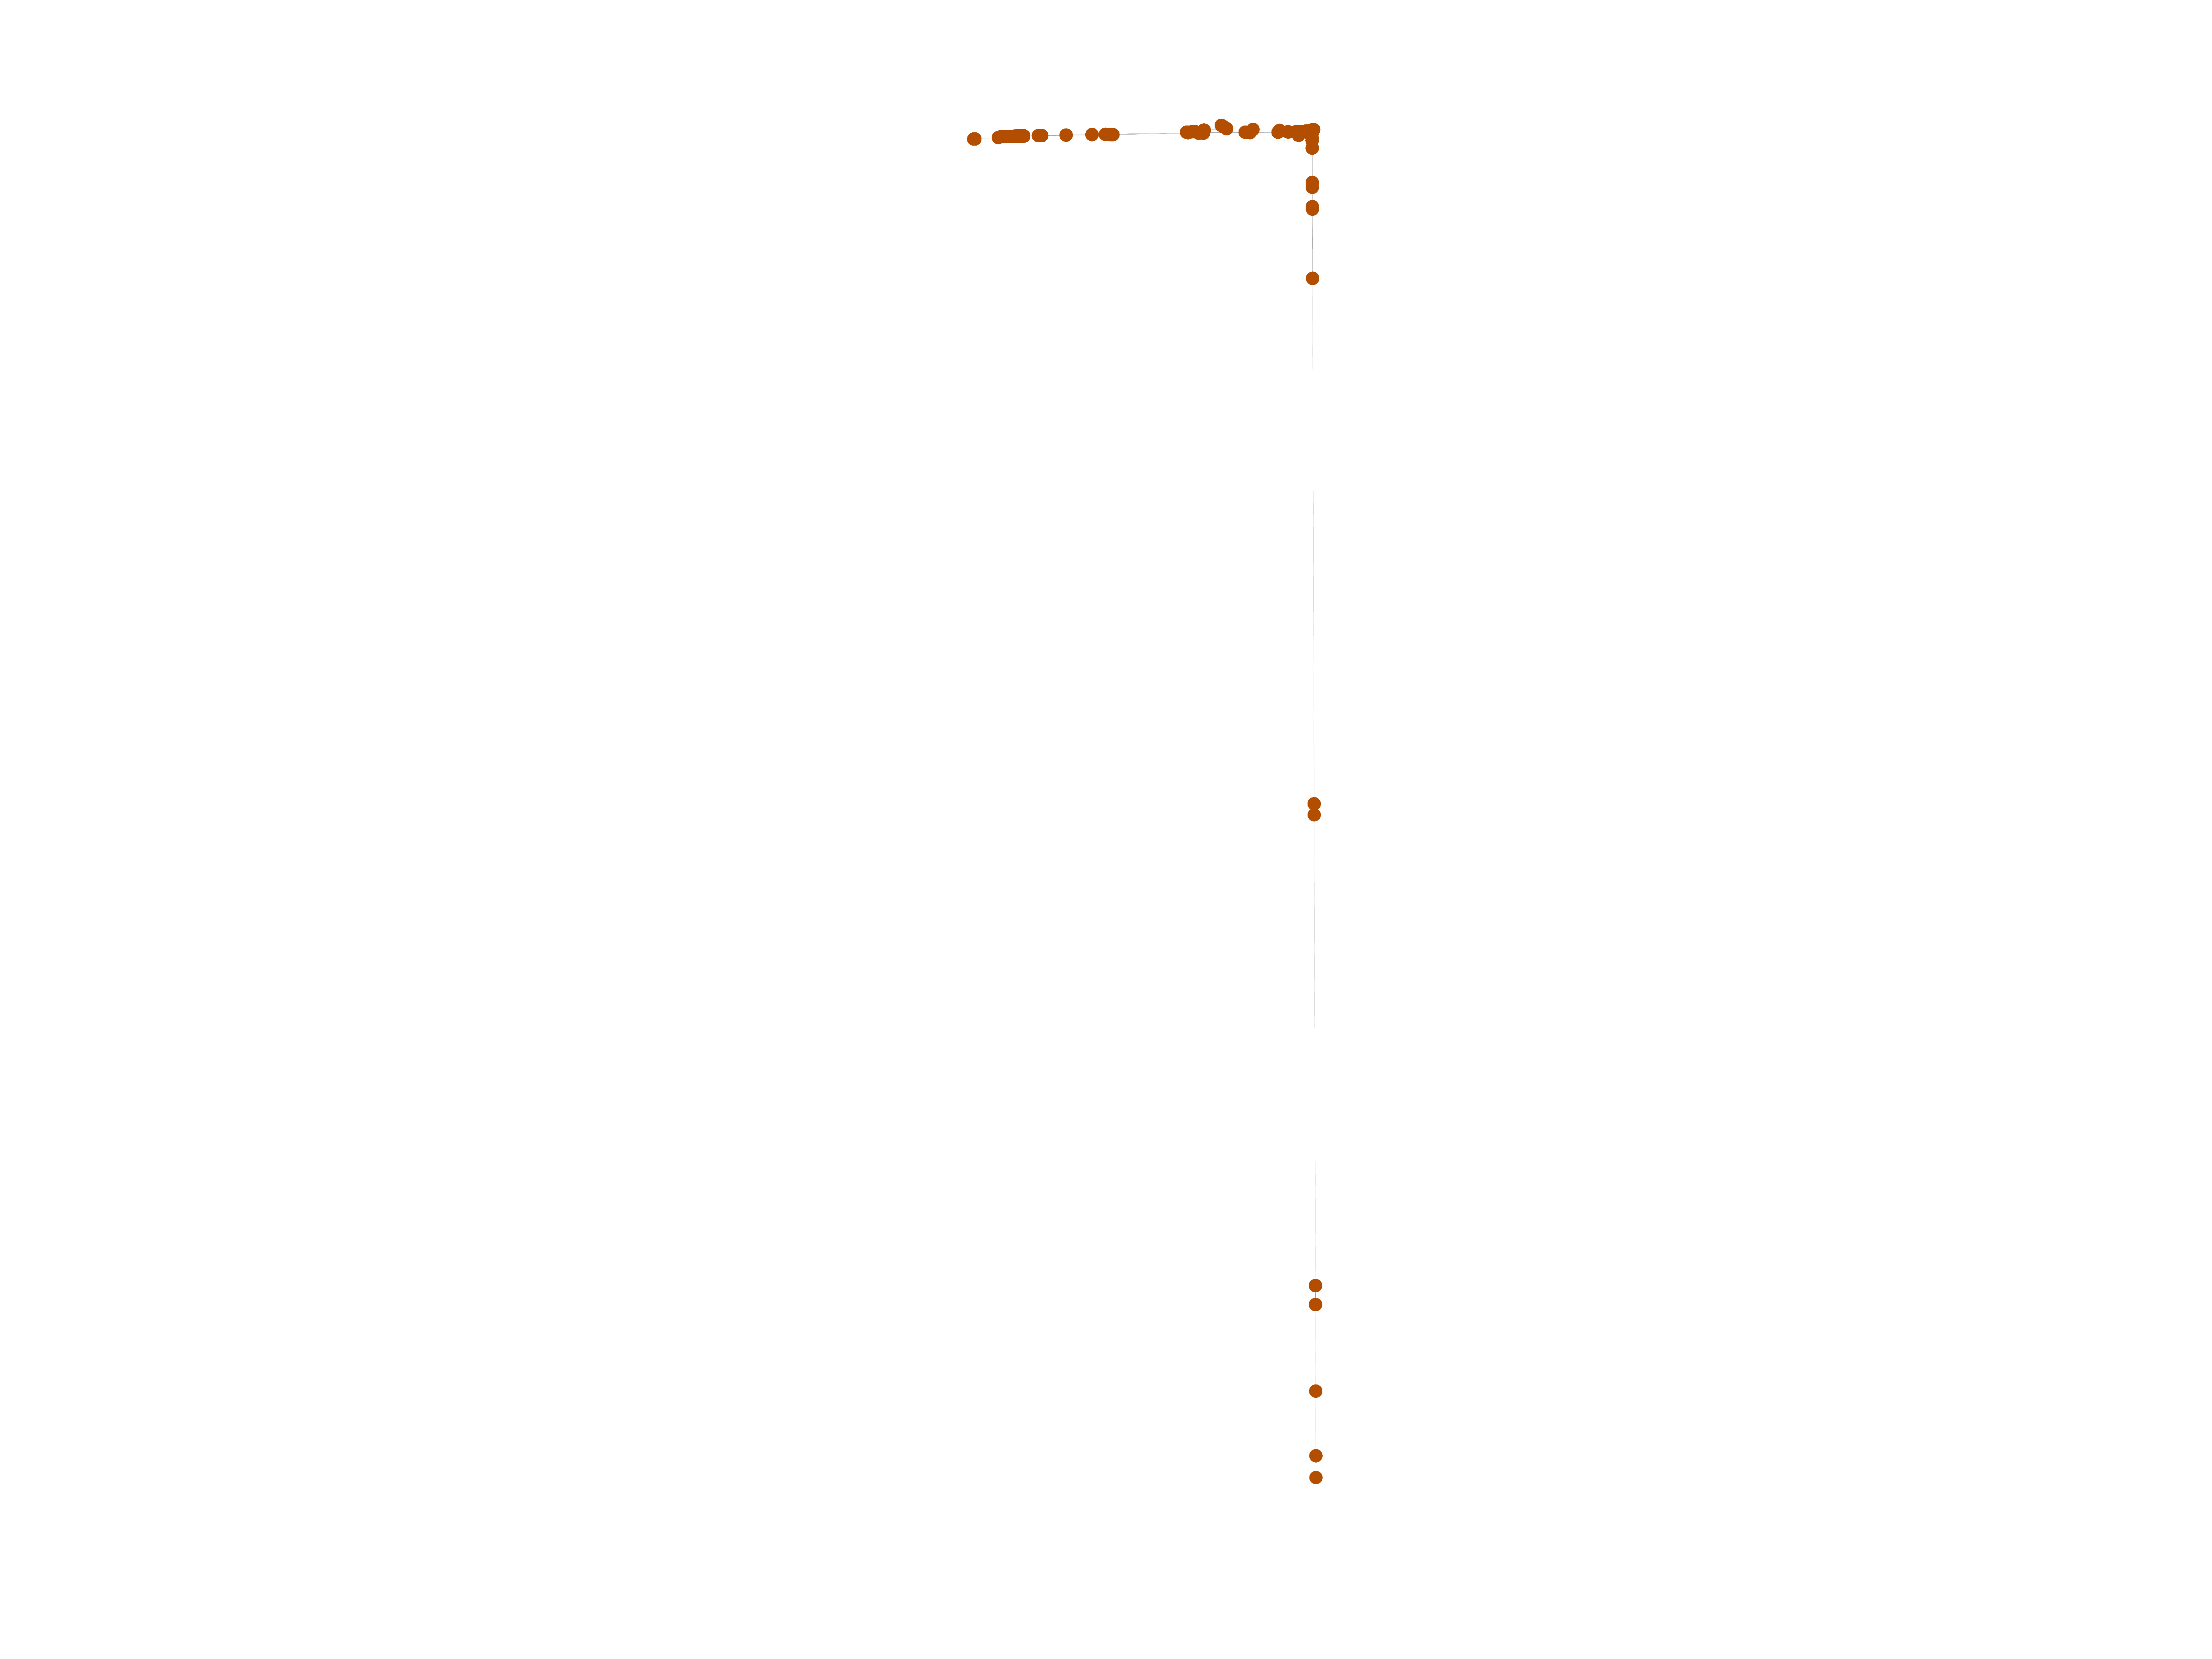
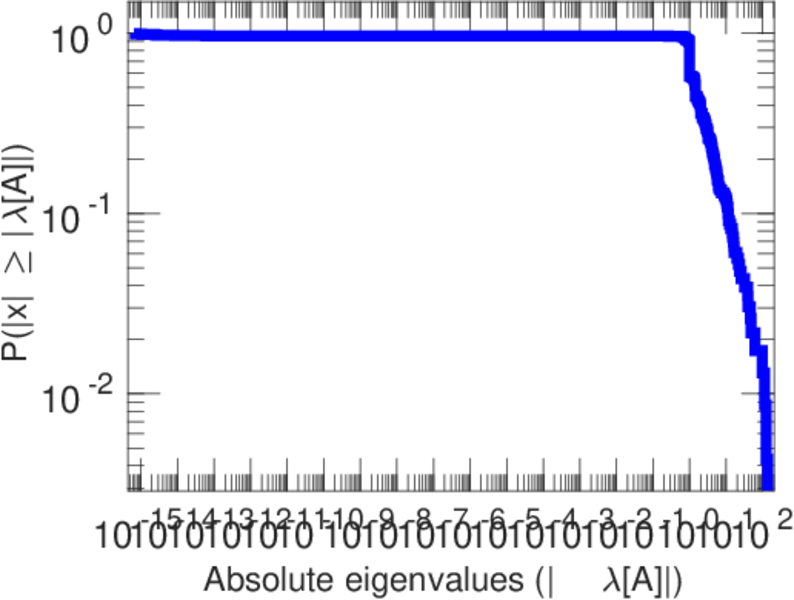
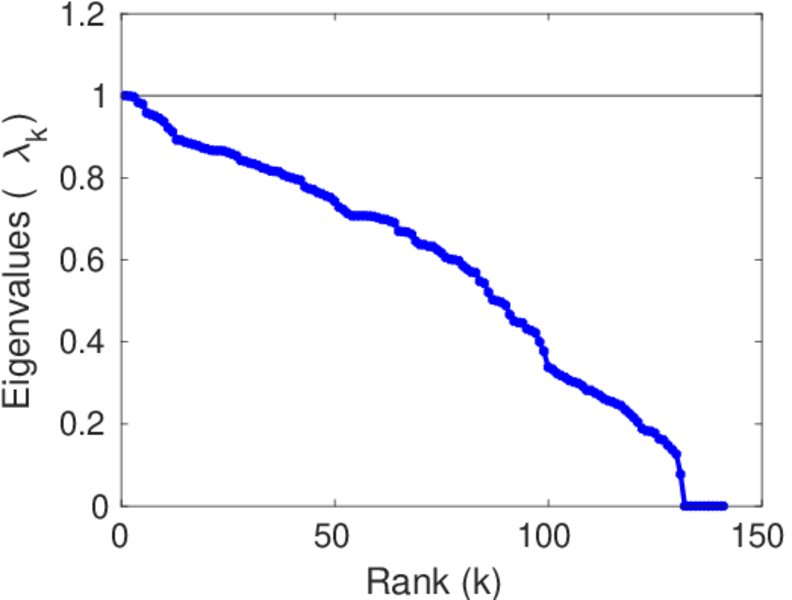
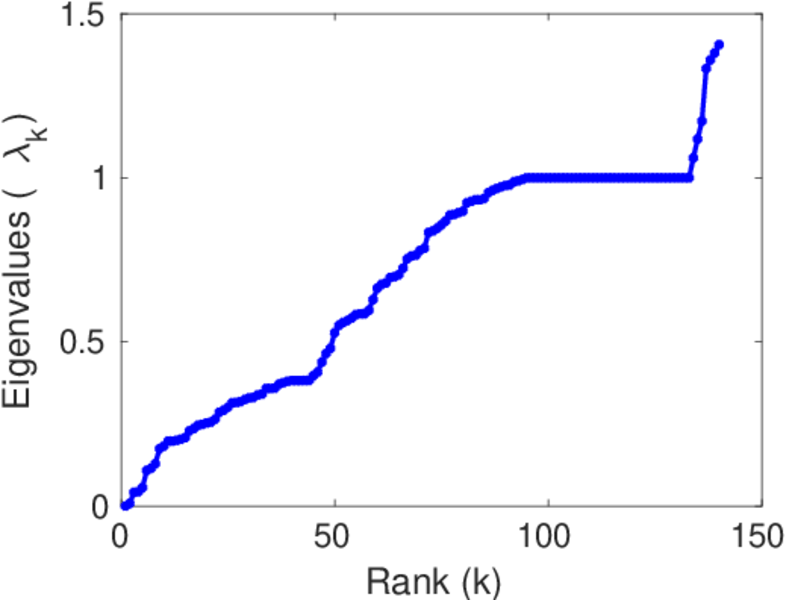
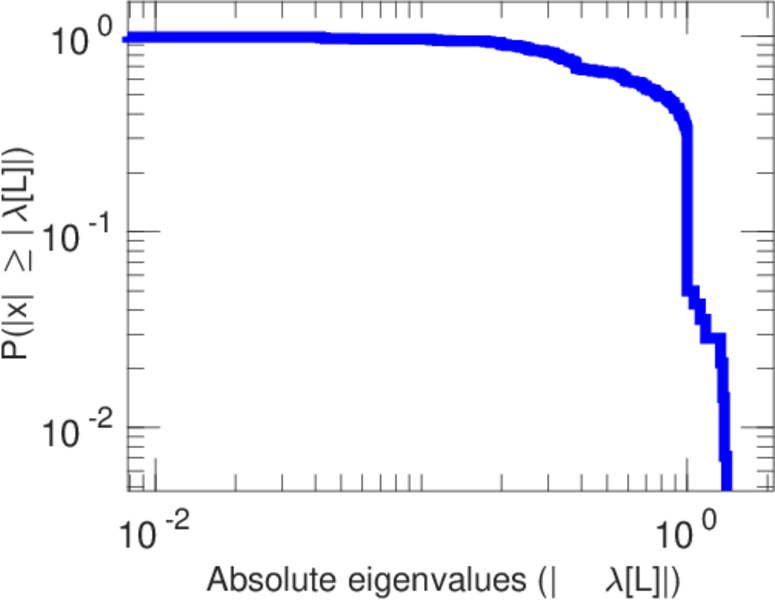
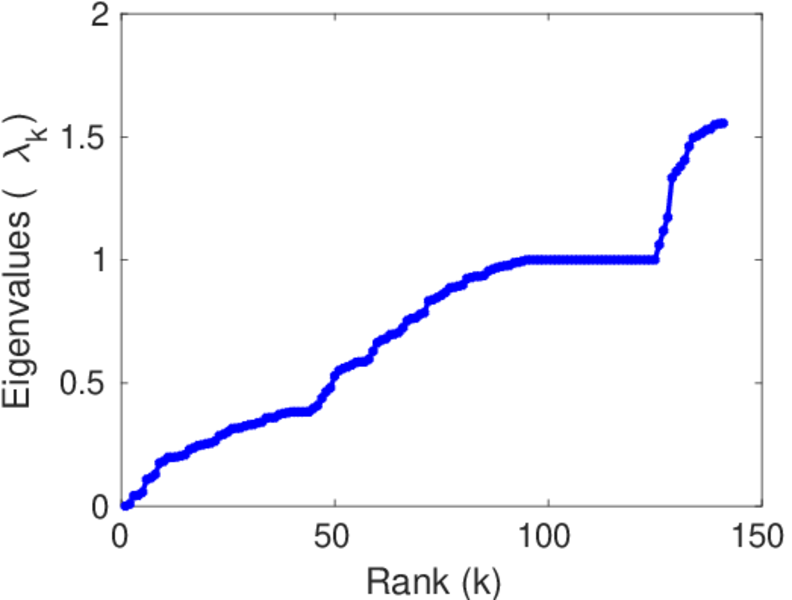
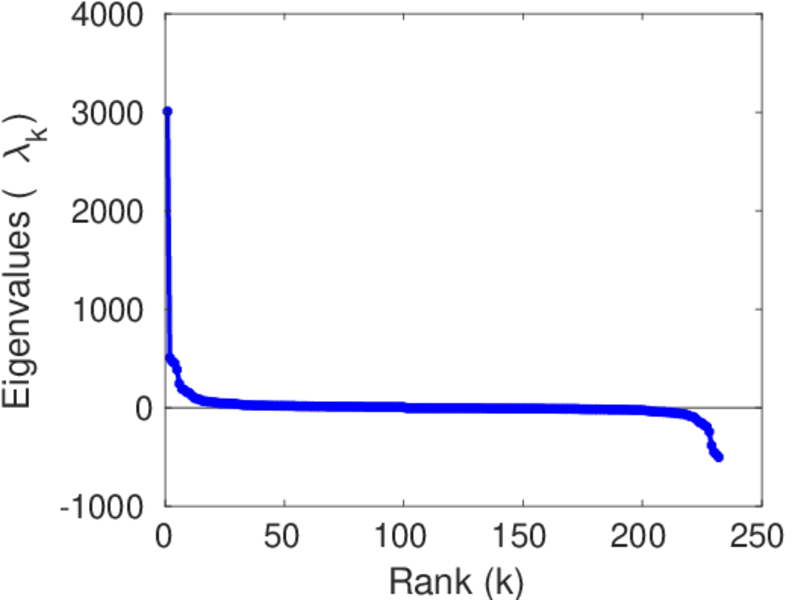
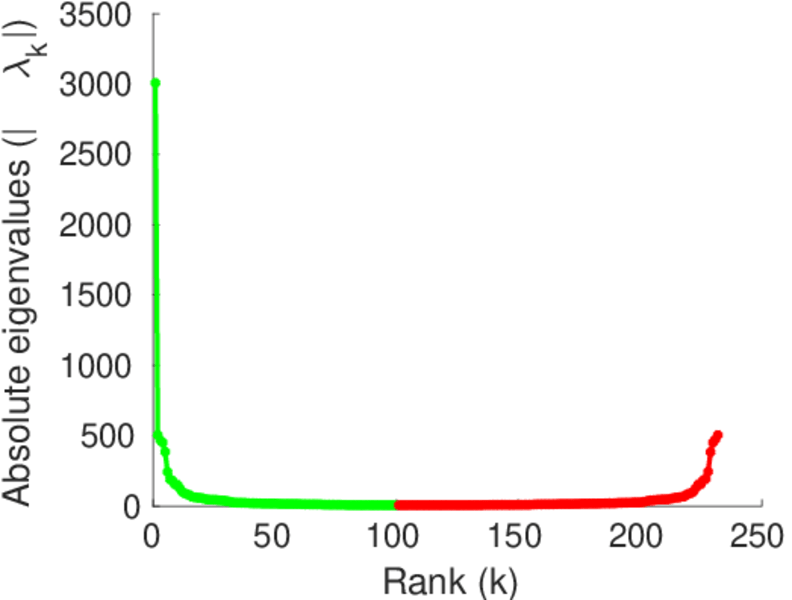
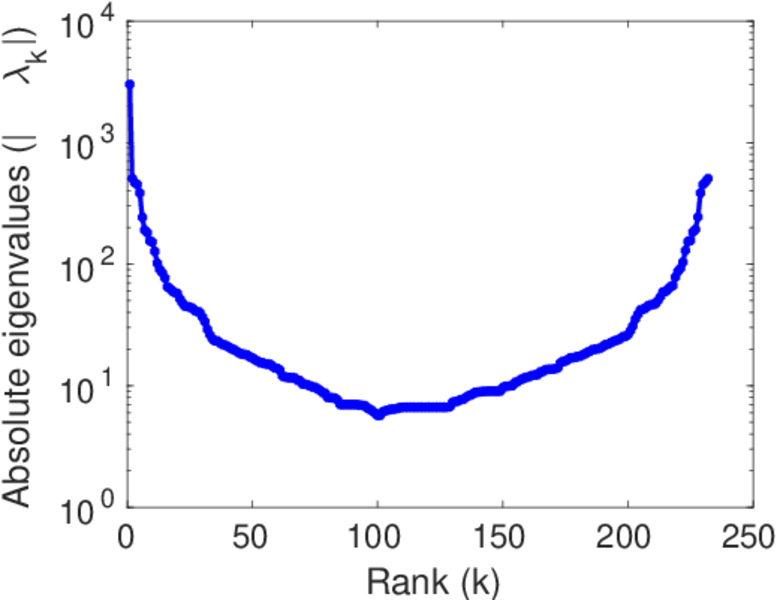
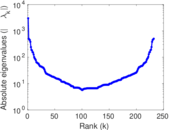
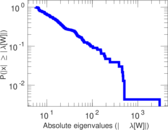
Matrix decompositions plots


Downloads
References
|
[1]
|
Jérôme Kunegis.
KONECT – The Koblenz Network Collection.
In Proc. Int. Conf. on World Wide Web Companion, pages
1343–1350, 2013.
[ http ]
|
|
[2]
|
Wikimedia Foundation.
Wikimedia downloads.
http://dumps.wikimedia.org/, January 2010.
|
 KONECT ‣ Networks ‣
Buy Me a Coffee
KONECT ‣ Networks ‣
Buy Me a Coffee