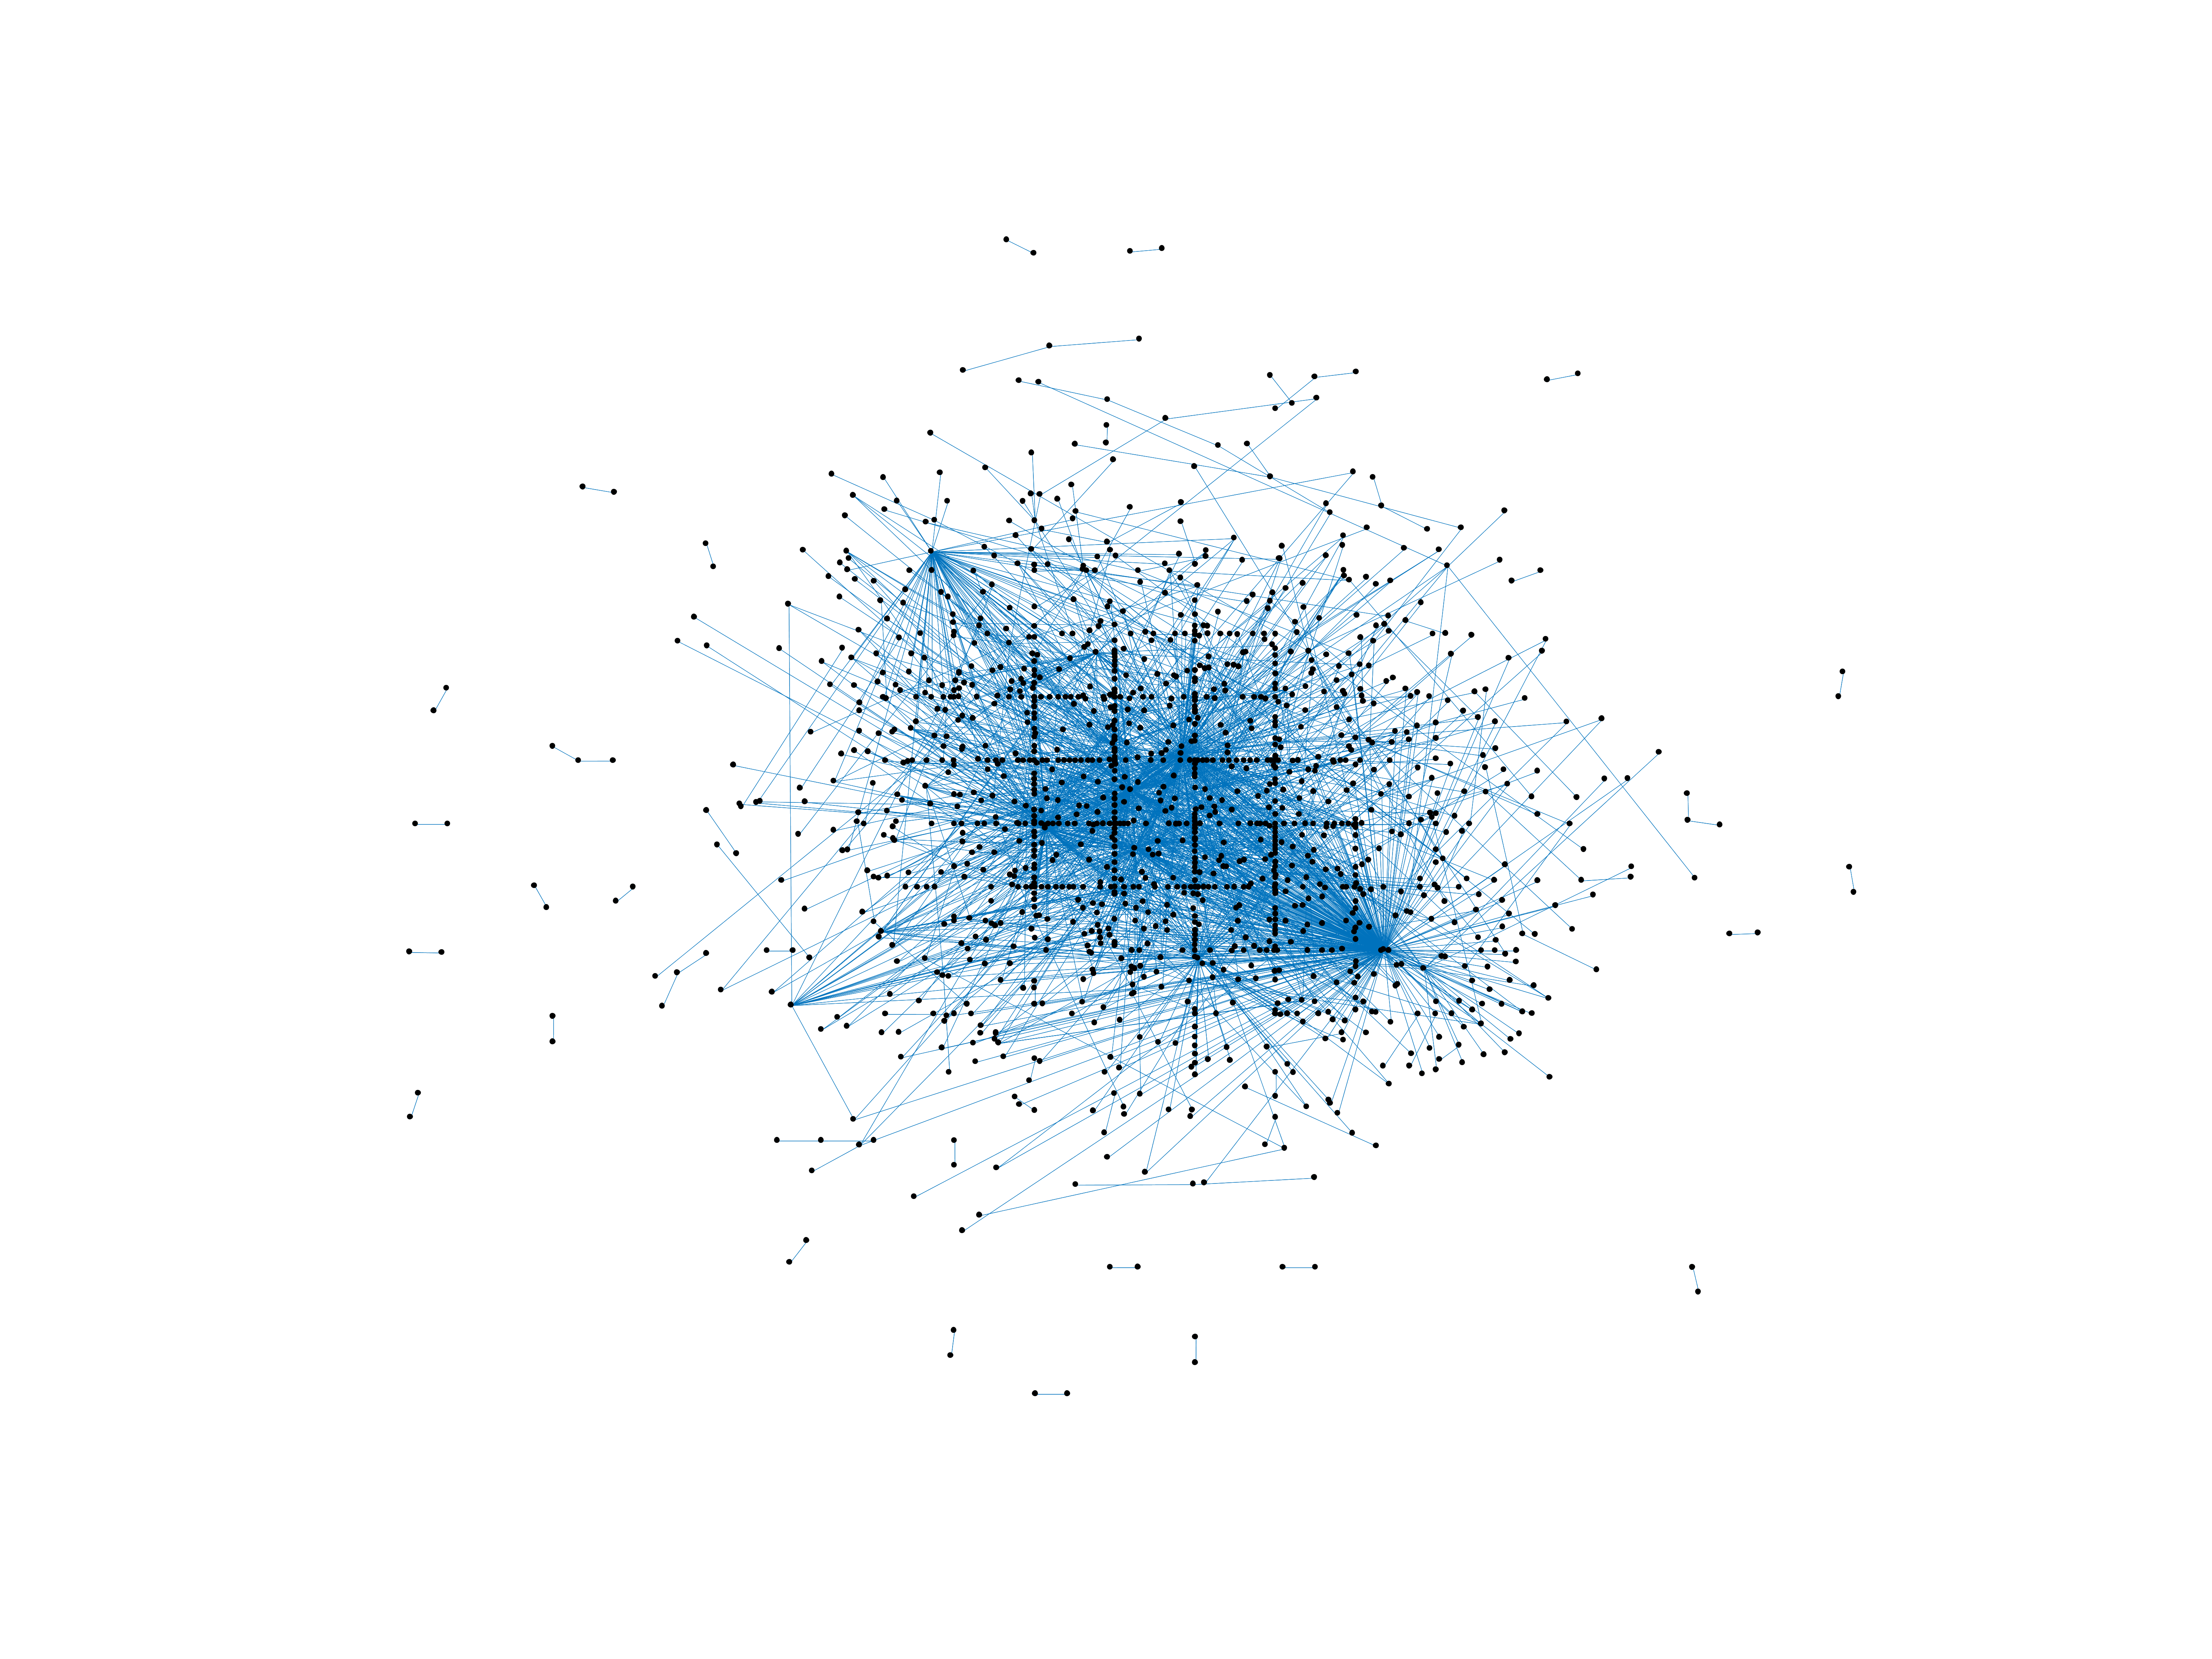
Wikiquote edits (sk)
This is the bipartite edit network of the Slovak Wikisource. It contains users
and pages from the Slovak Wikisource, connected by edit events. Each edge
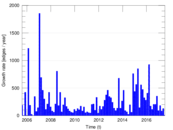
represents an edit. The dataset includes the timestamp of each edit.
Metadata
Statistics
| Size | n = | 1,403
|
| Left size | n1 = | 260
|
| Right size | n2 = | 1,143
|
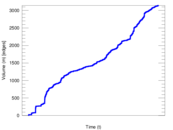
| Volume | m = | 3,143
|
| Unique edge count | m̿ = | 2,072
|
| Wedge count | s = | 135,267
|
| Claw count | z = | 11,210,656
|
| Cross count | x = | 827,275,393
|
| Square count | q = | 18,988
|
| 4-Tour count | T4 = | 699,548
|
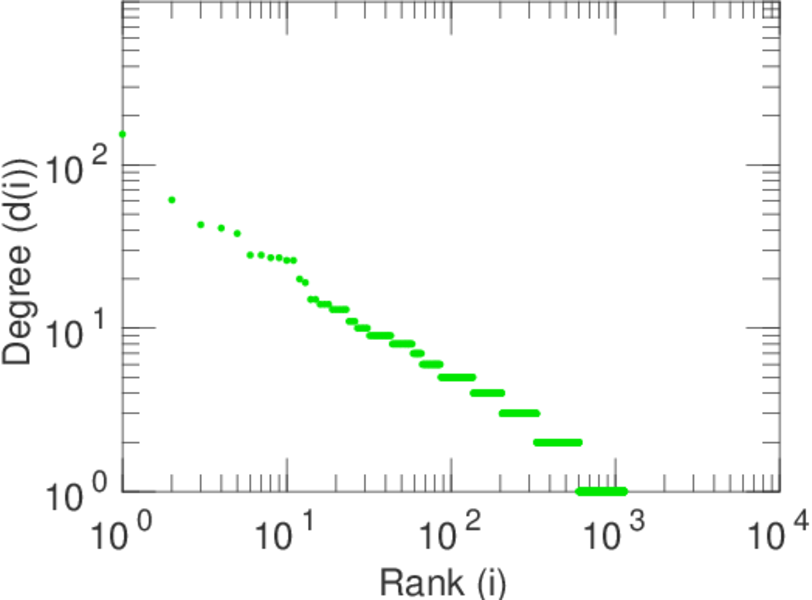
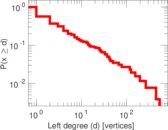
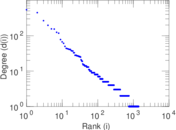
| Maximum degree | dmax = | 542
|
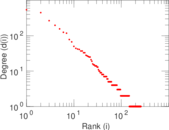
| Maximum left degree | d1max = | 542
|
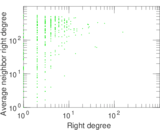
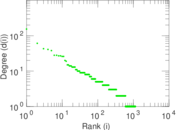
| Maximum right degree | d2max = | 154
|
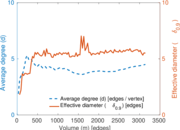
| Average degree | d = | 4.480 40
|
| Average left degree | d1 = | 12.088 5
|
| Average right degree | d2 = | 2.749 78
|
| Fill | p = | 0.006 972 21
|
| Average edge multiplicity | m̃ = | 1.516 89
|
| Size of LCC | N = | 1,225
|
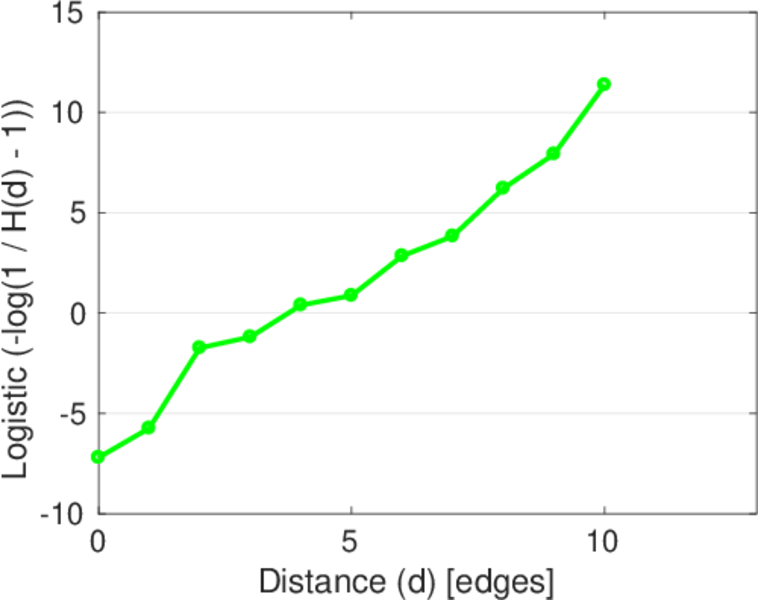
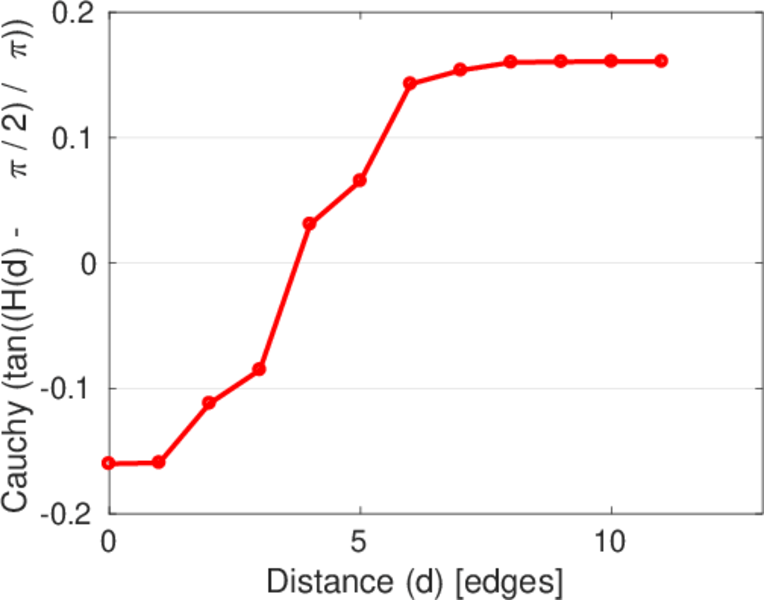
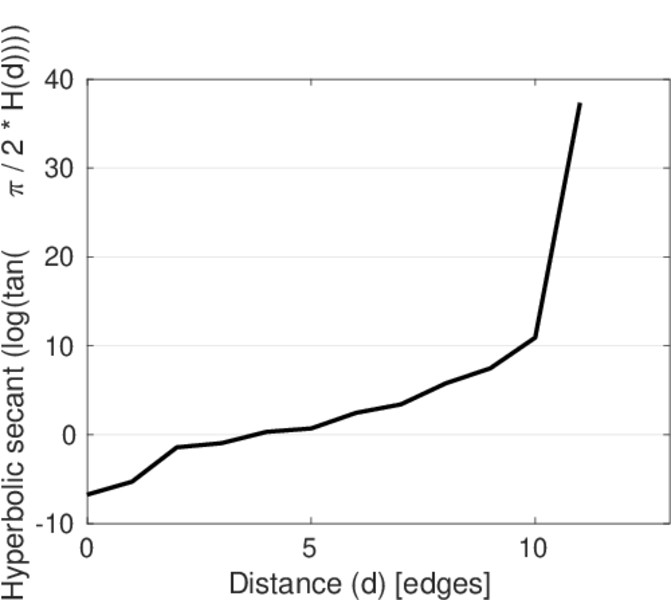
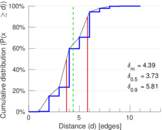
| Diameter | δ = | 12
|
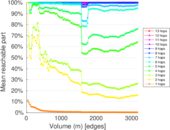
| 50-Percentile effective diameter | δ0.5 = | 3.734 50
|
| 90-Percentile effective diameter | δ0.9 = | 5.811 96
|
| Median distance | δM = | 4
|
| Mean distance | δm = | 4.391 12
|
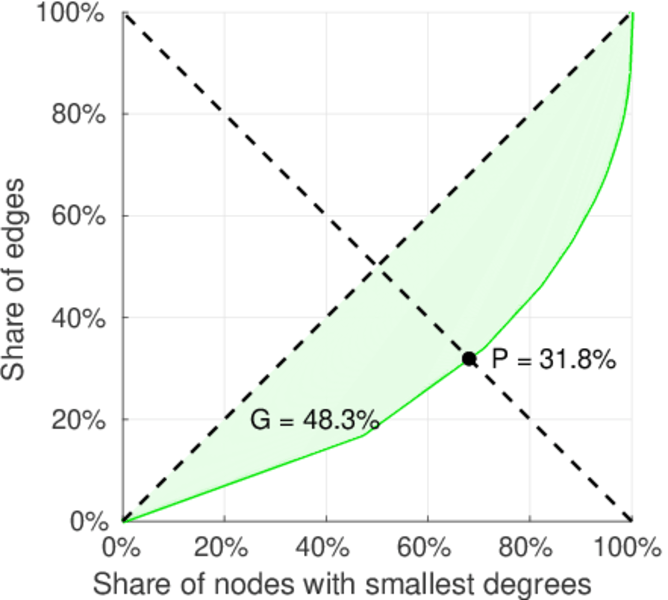
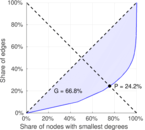
| Gini coefficient | G = | 0.698 092
|
| Balanced inequality ratio | P = | 0.225 899
|
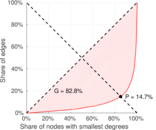
| Left balanced inequality ratio | P1 = | 0.146 675
|
| Right balanced inequality ratio | P2 = | 0.317 849
|
| Relative edge distribution entropy | Her = | 0.826 154
|
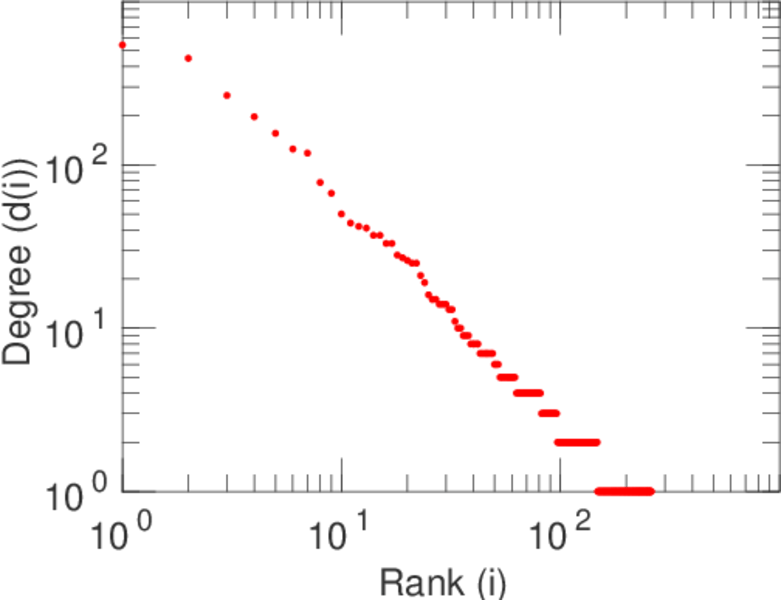
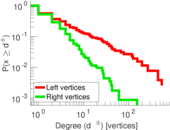
| Power law exponent | γ = | 3.061 35
|
| Tail power law exponent | γt = | 2.681 00
|
| Tail power law exponent with p | γ3 = | 2.681 00
|
| p-value | p = | 0.002 000 00
|
| Left tail power law exponent with p | γ3,1 = | 1.831 00
|
| Left p-value | p1 = | 0.470 000
|
| Right tail power law exponent with p | γ3,2 = | 3.681 00
|
| Right p-value | p2 = | 0.123 000
|
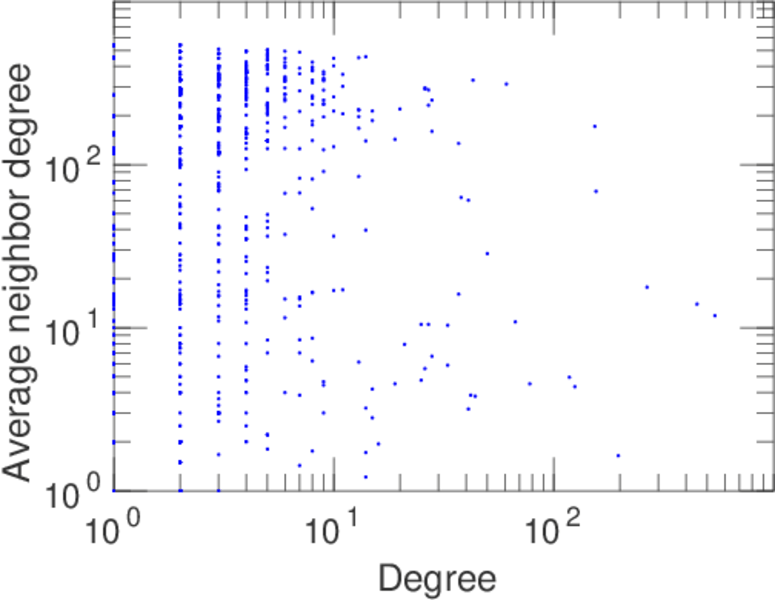
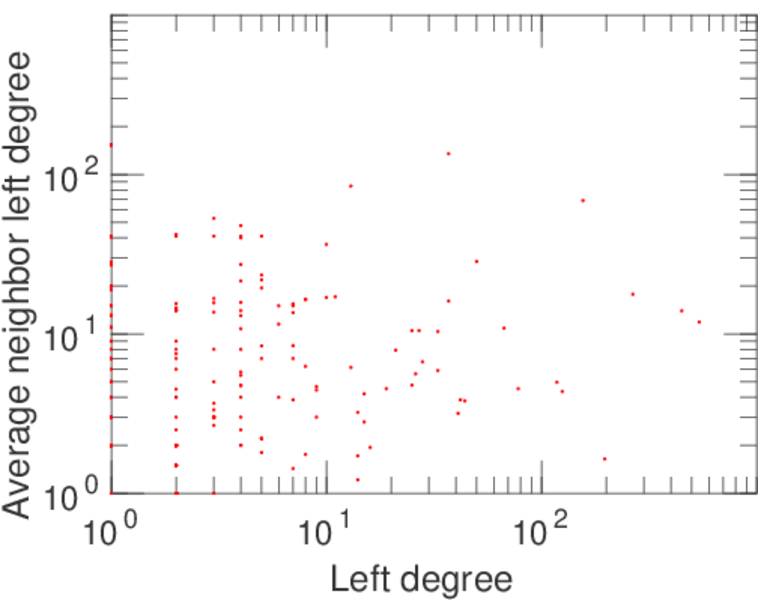
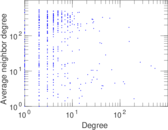
| Degree assortativity | ρ = | −0.134 090
|
| Degree assortativity p-value | pρ = | 8.917 51 × 10−10
|
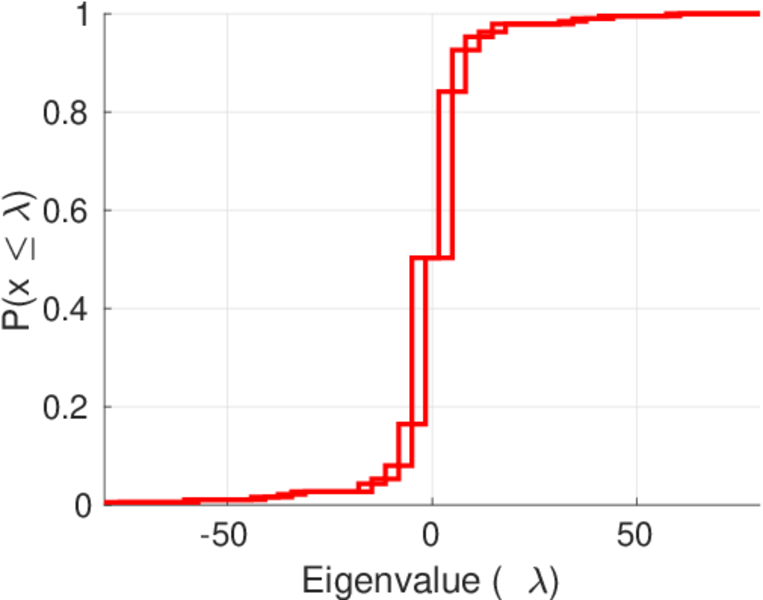
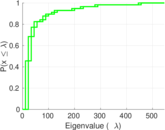
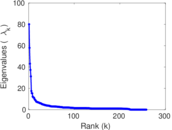
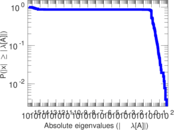
| Spectral norm | α = | 80.035 6
|
| Algebraic connectivity | a = | 0.031 283 2
|
| Spectral separation | |λ1[A] / λ2[A]| = | 1.380 04
|
| Controllability | C = | 952
|
| Relative controllability | Cr = | 0.680 973
|
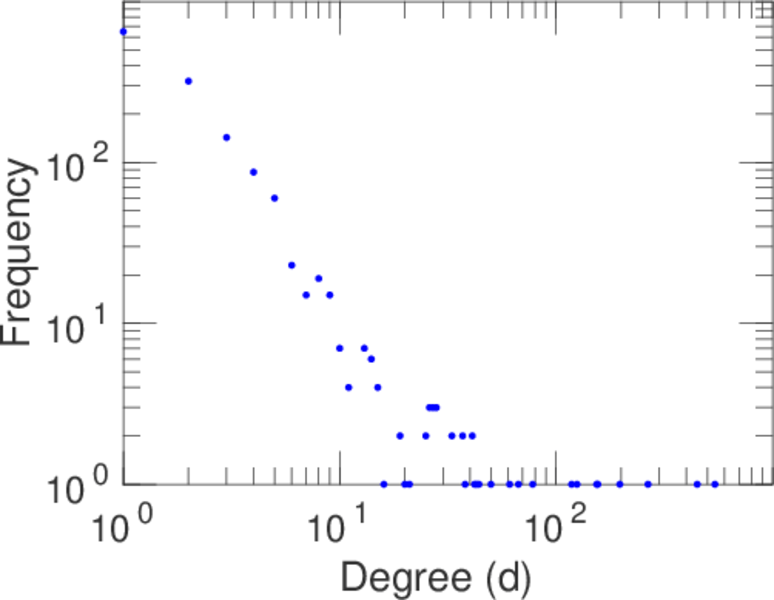
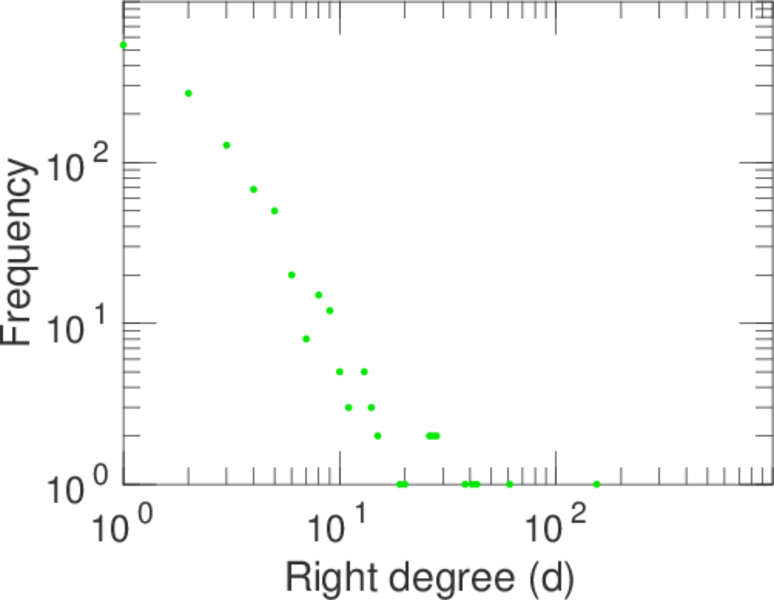
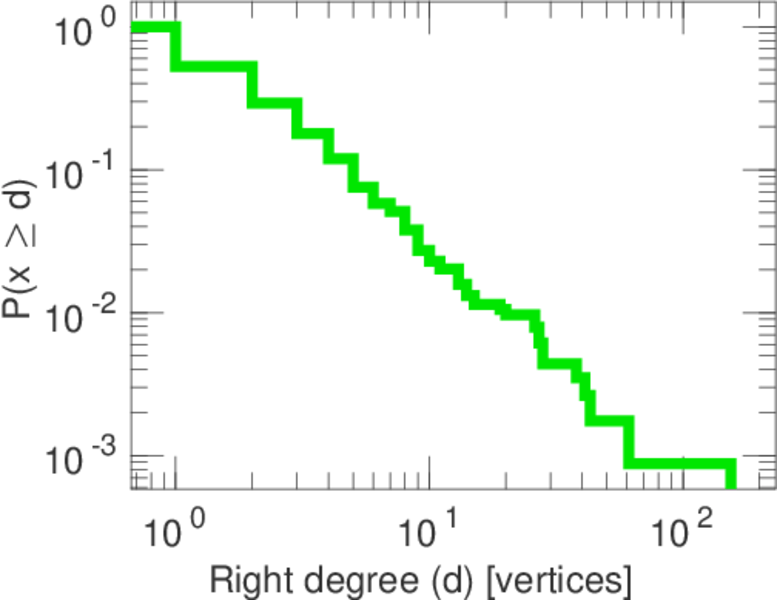
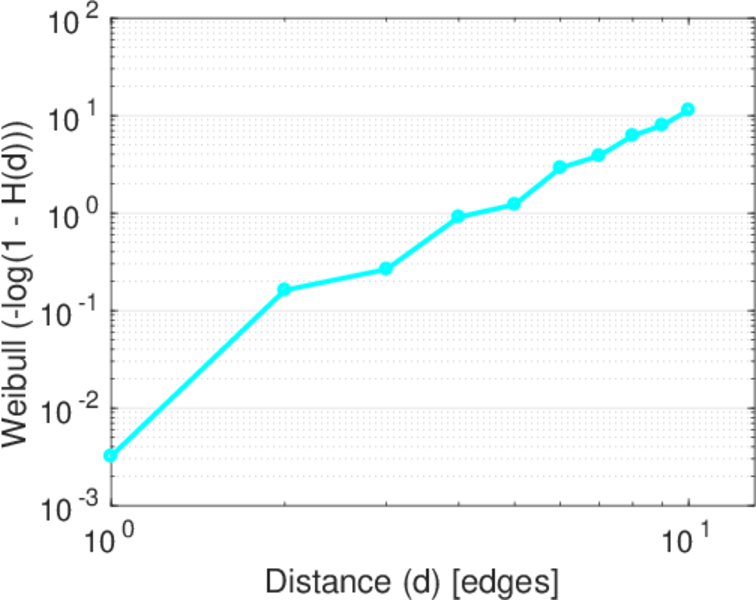
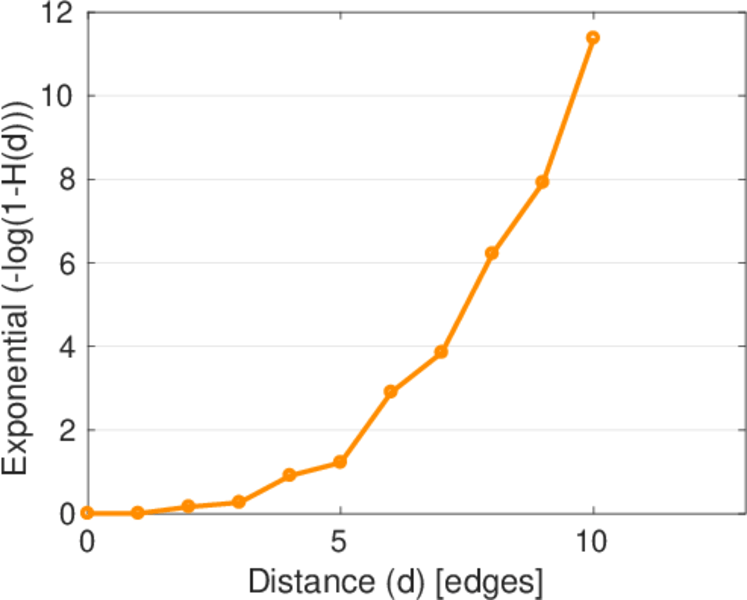
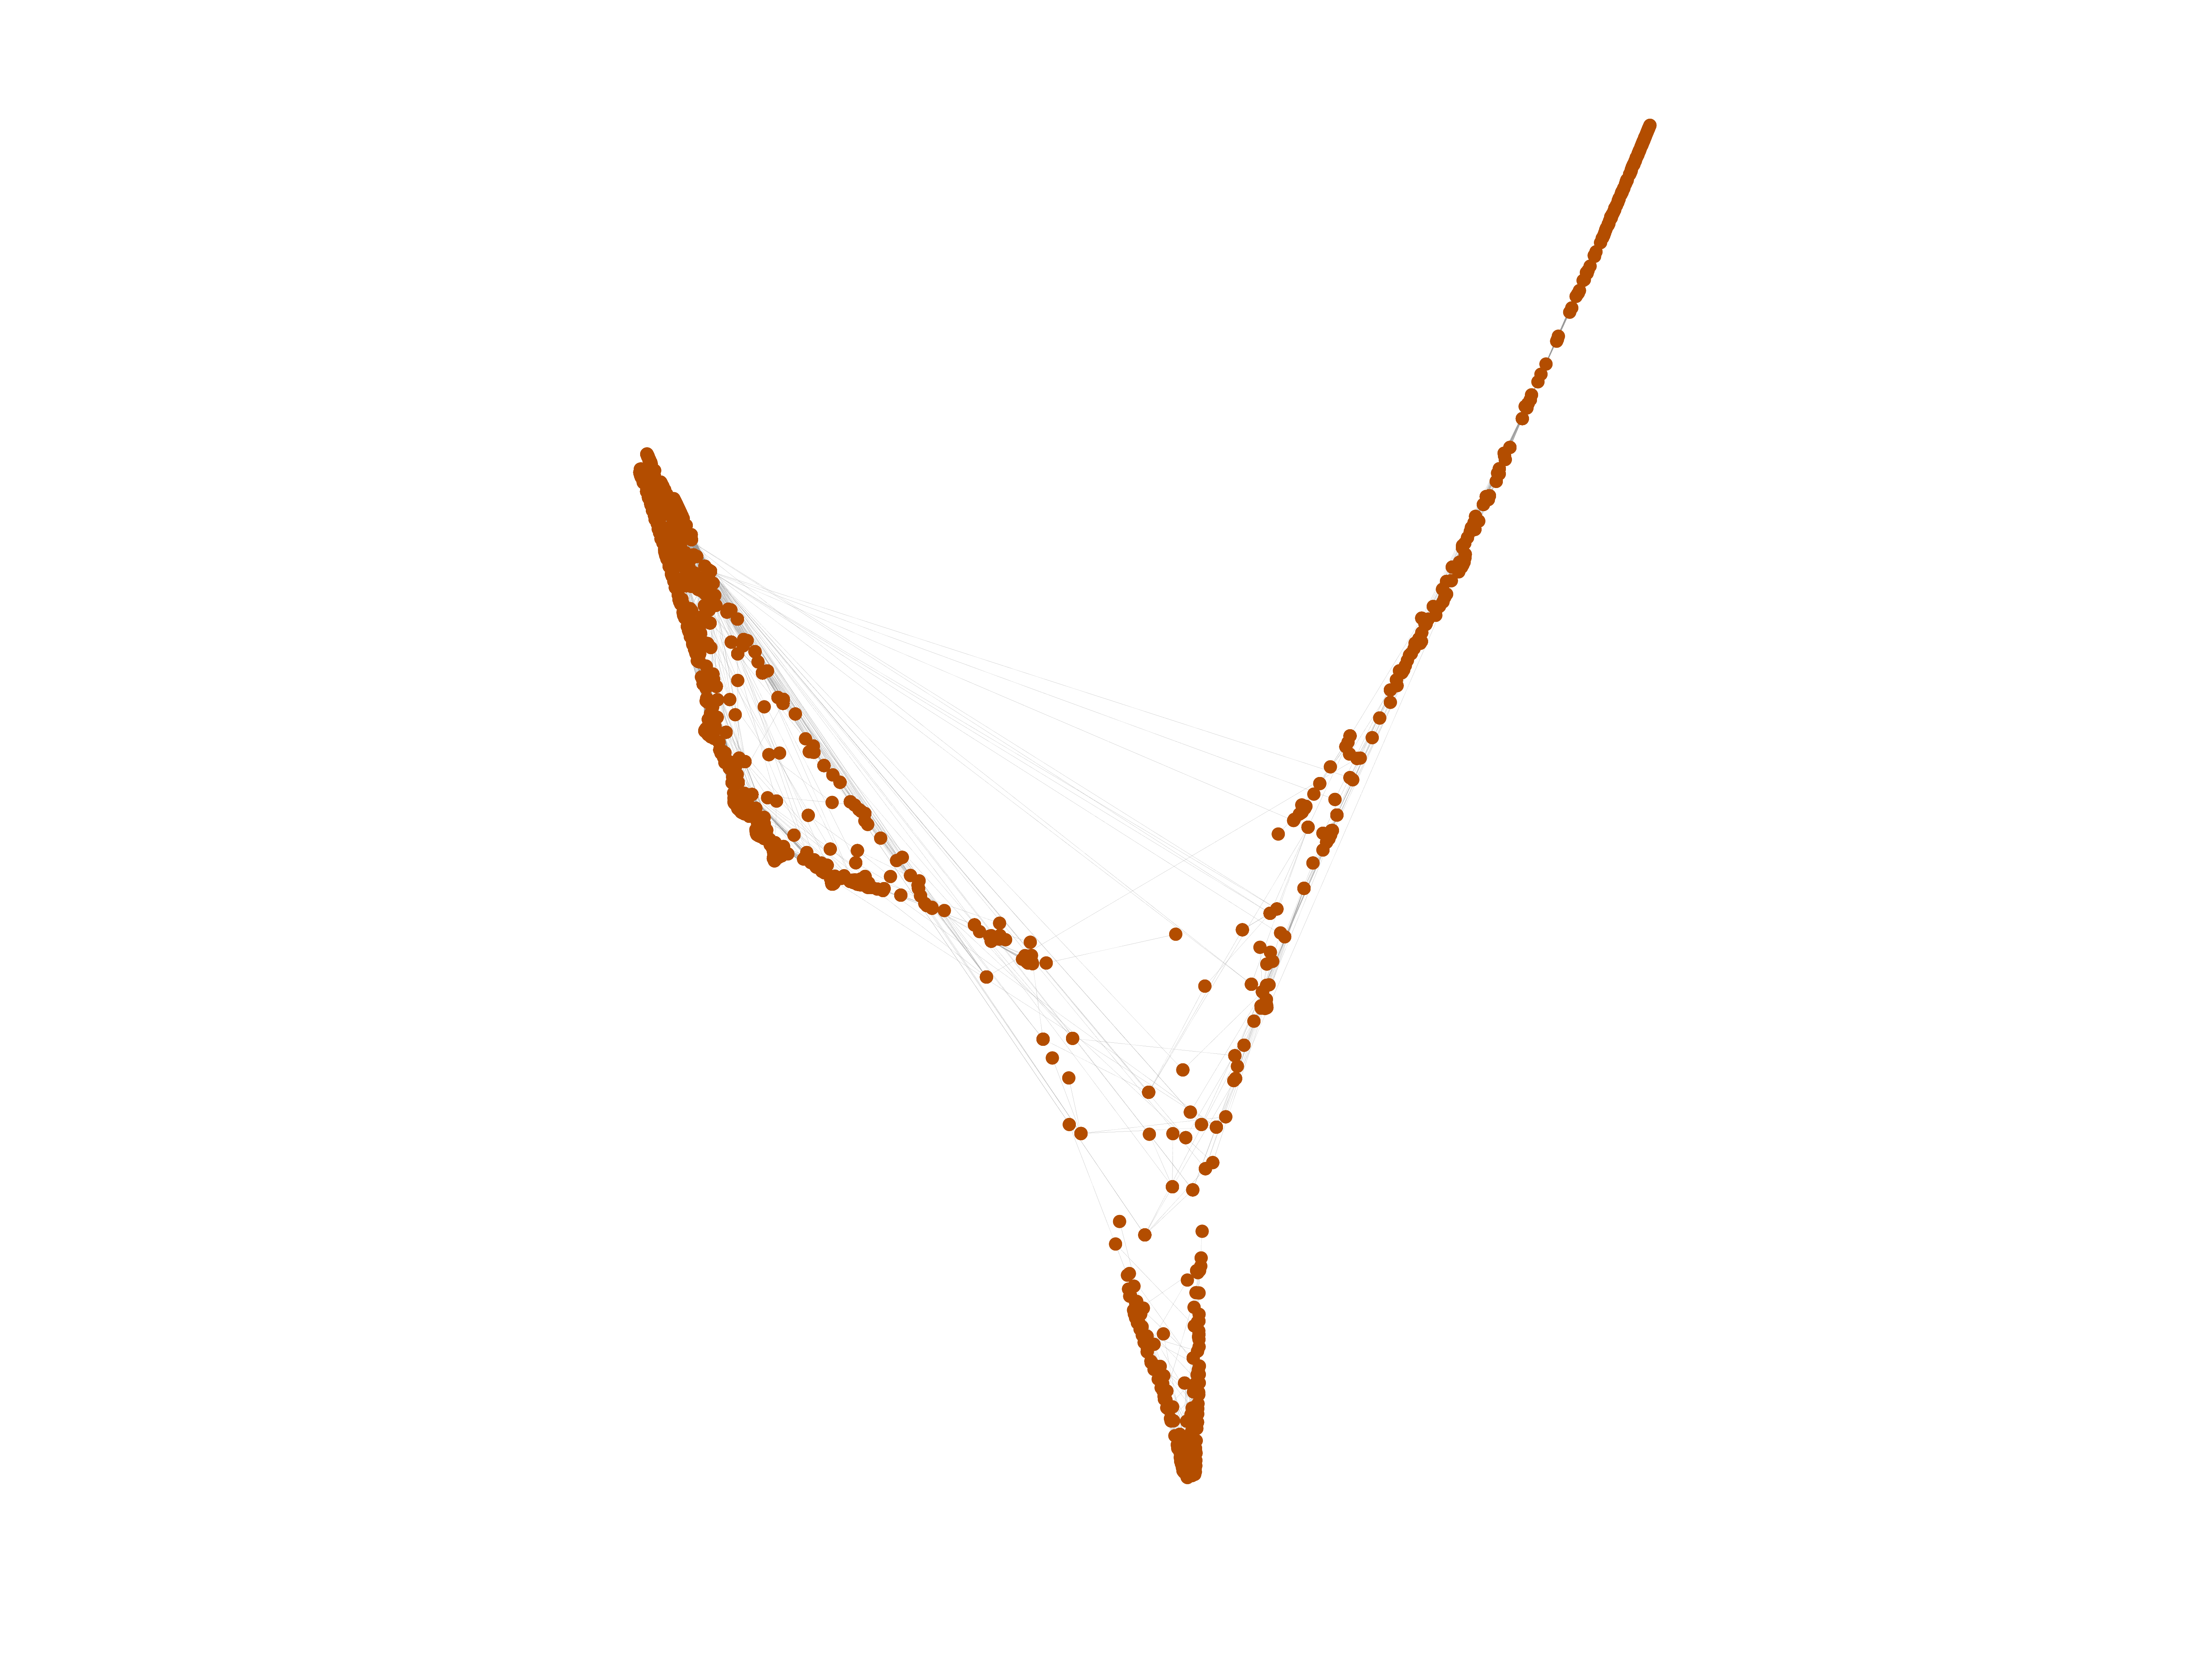
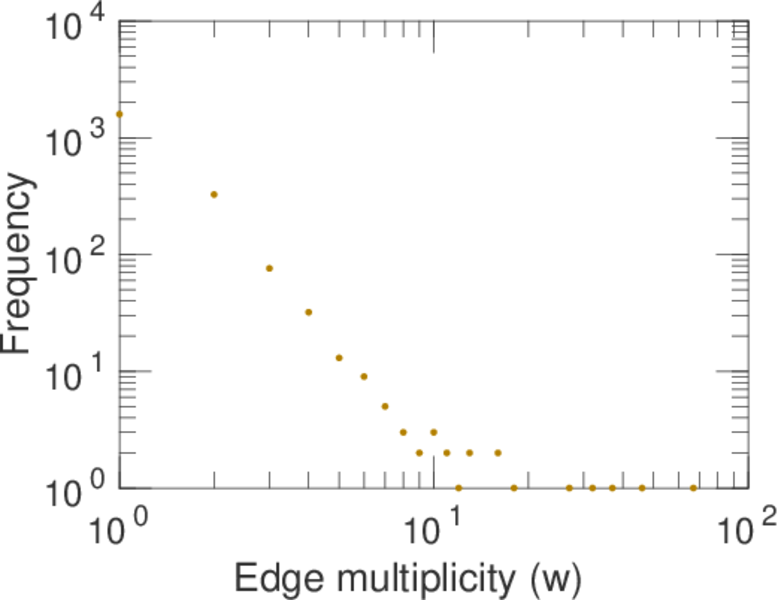
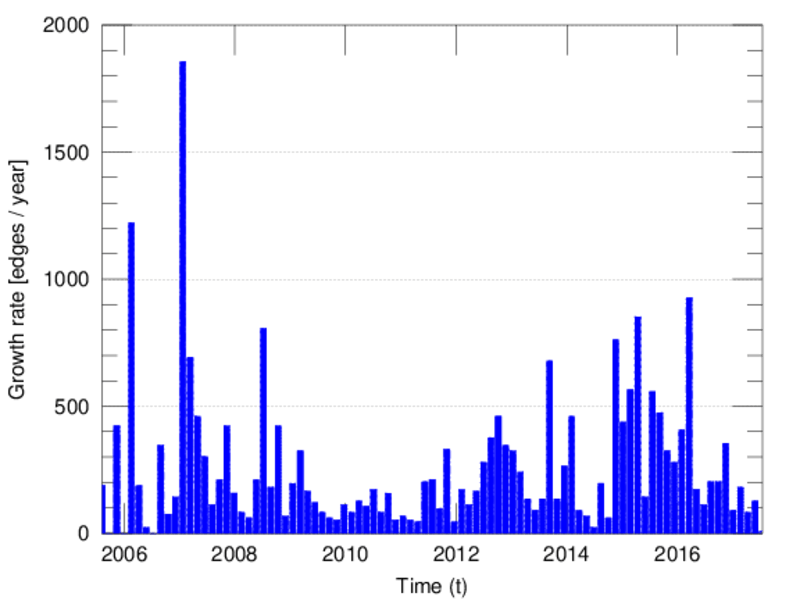
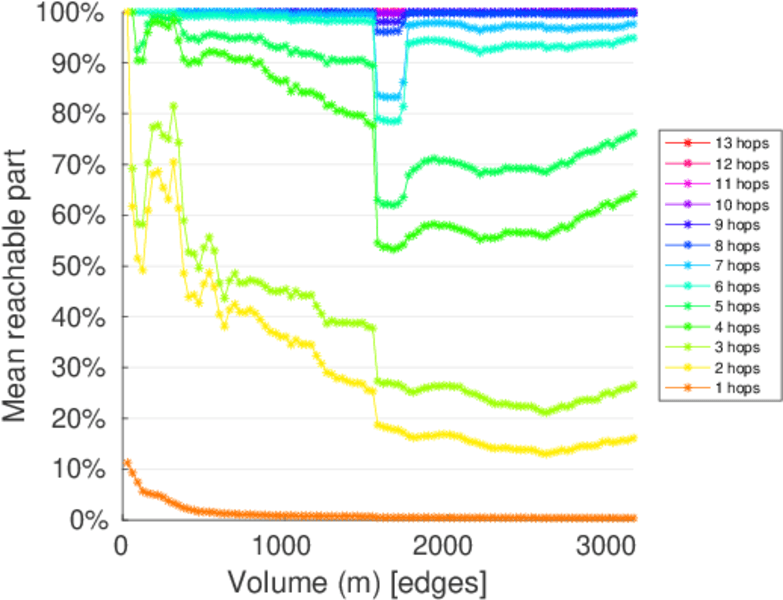
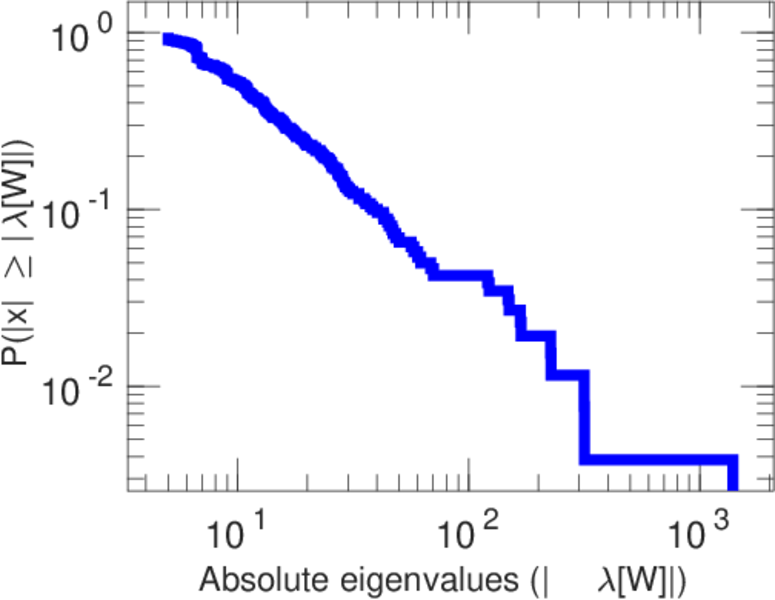
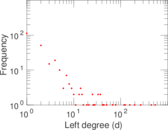
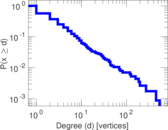
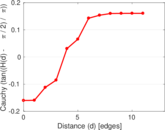
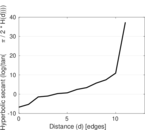
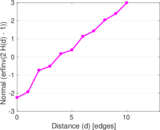
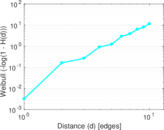
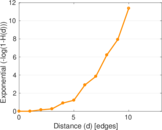
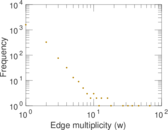
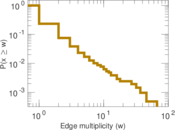
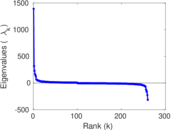
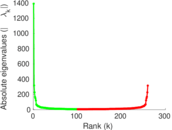
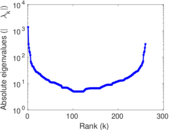
Plots


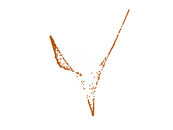
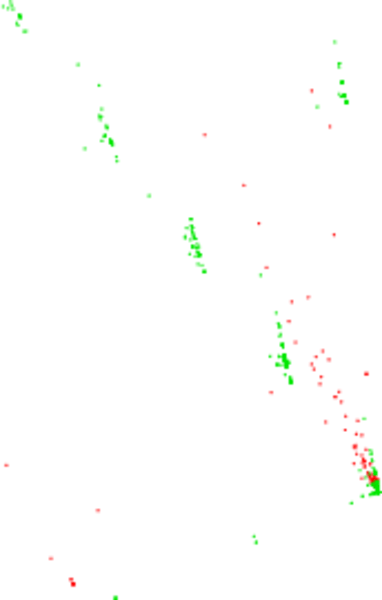
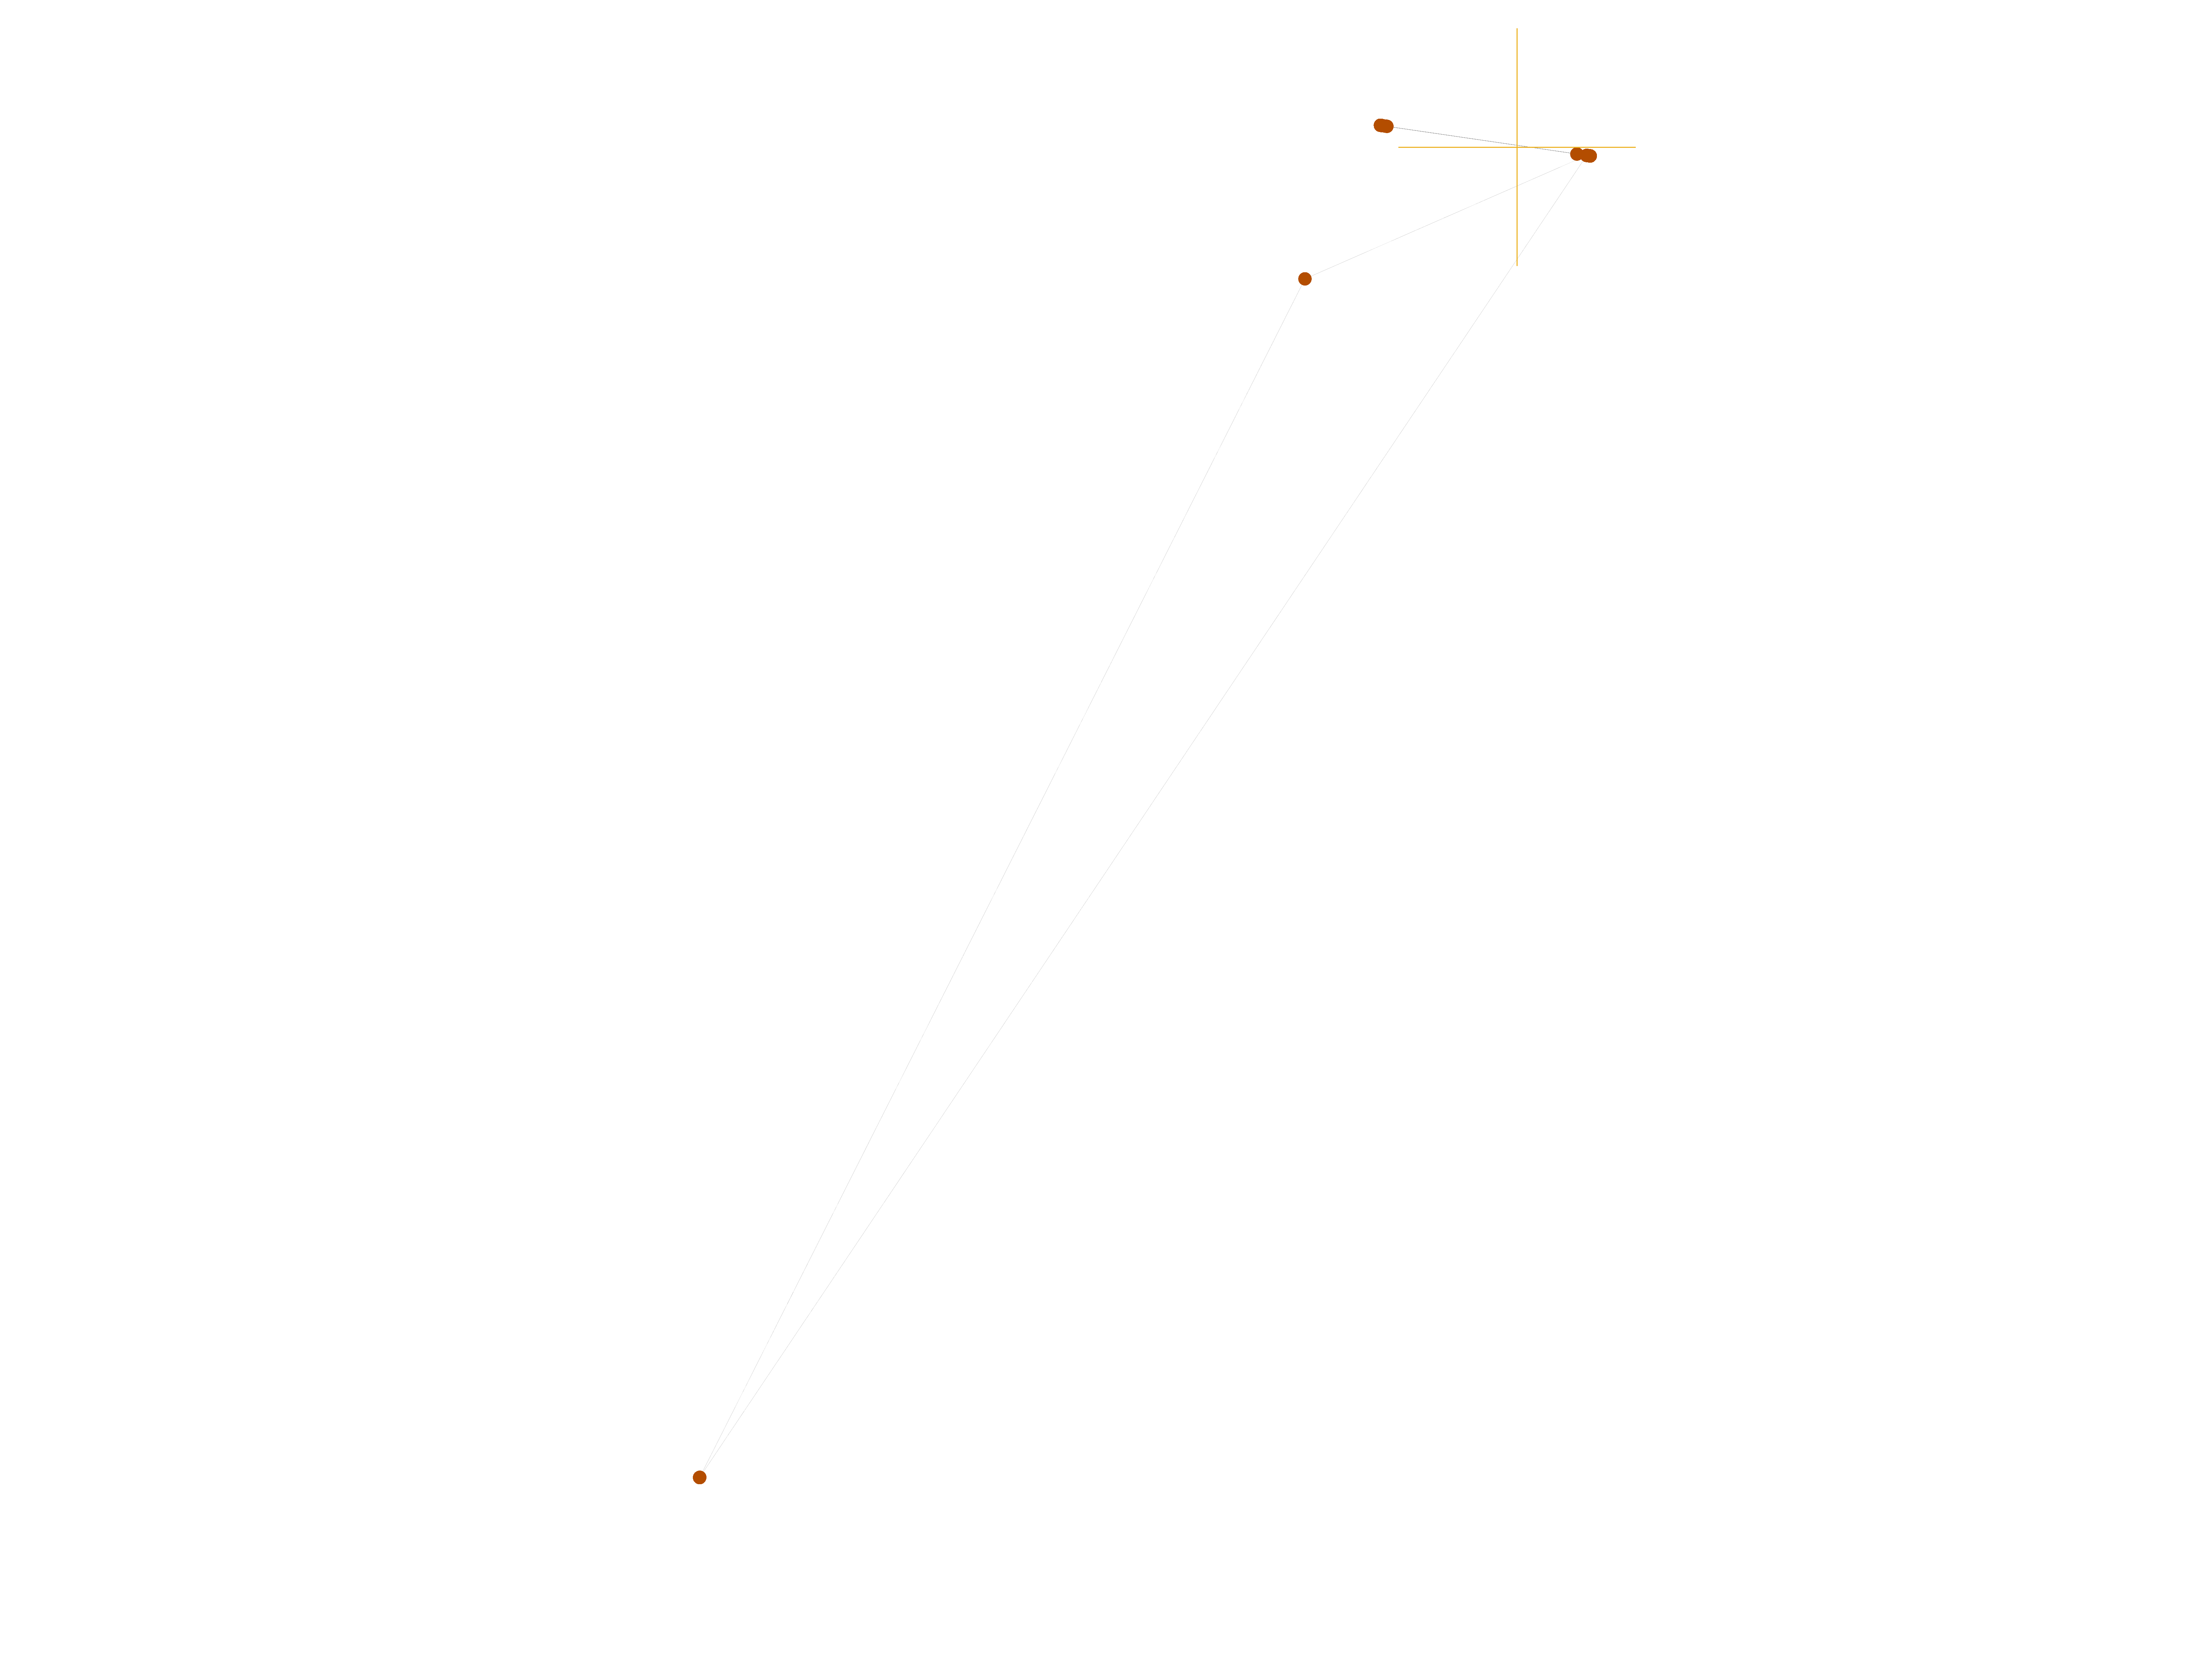
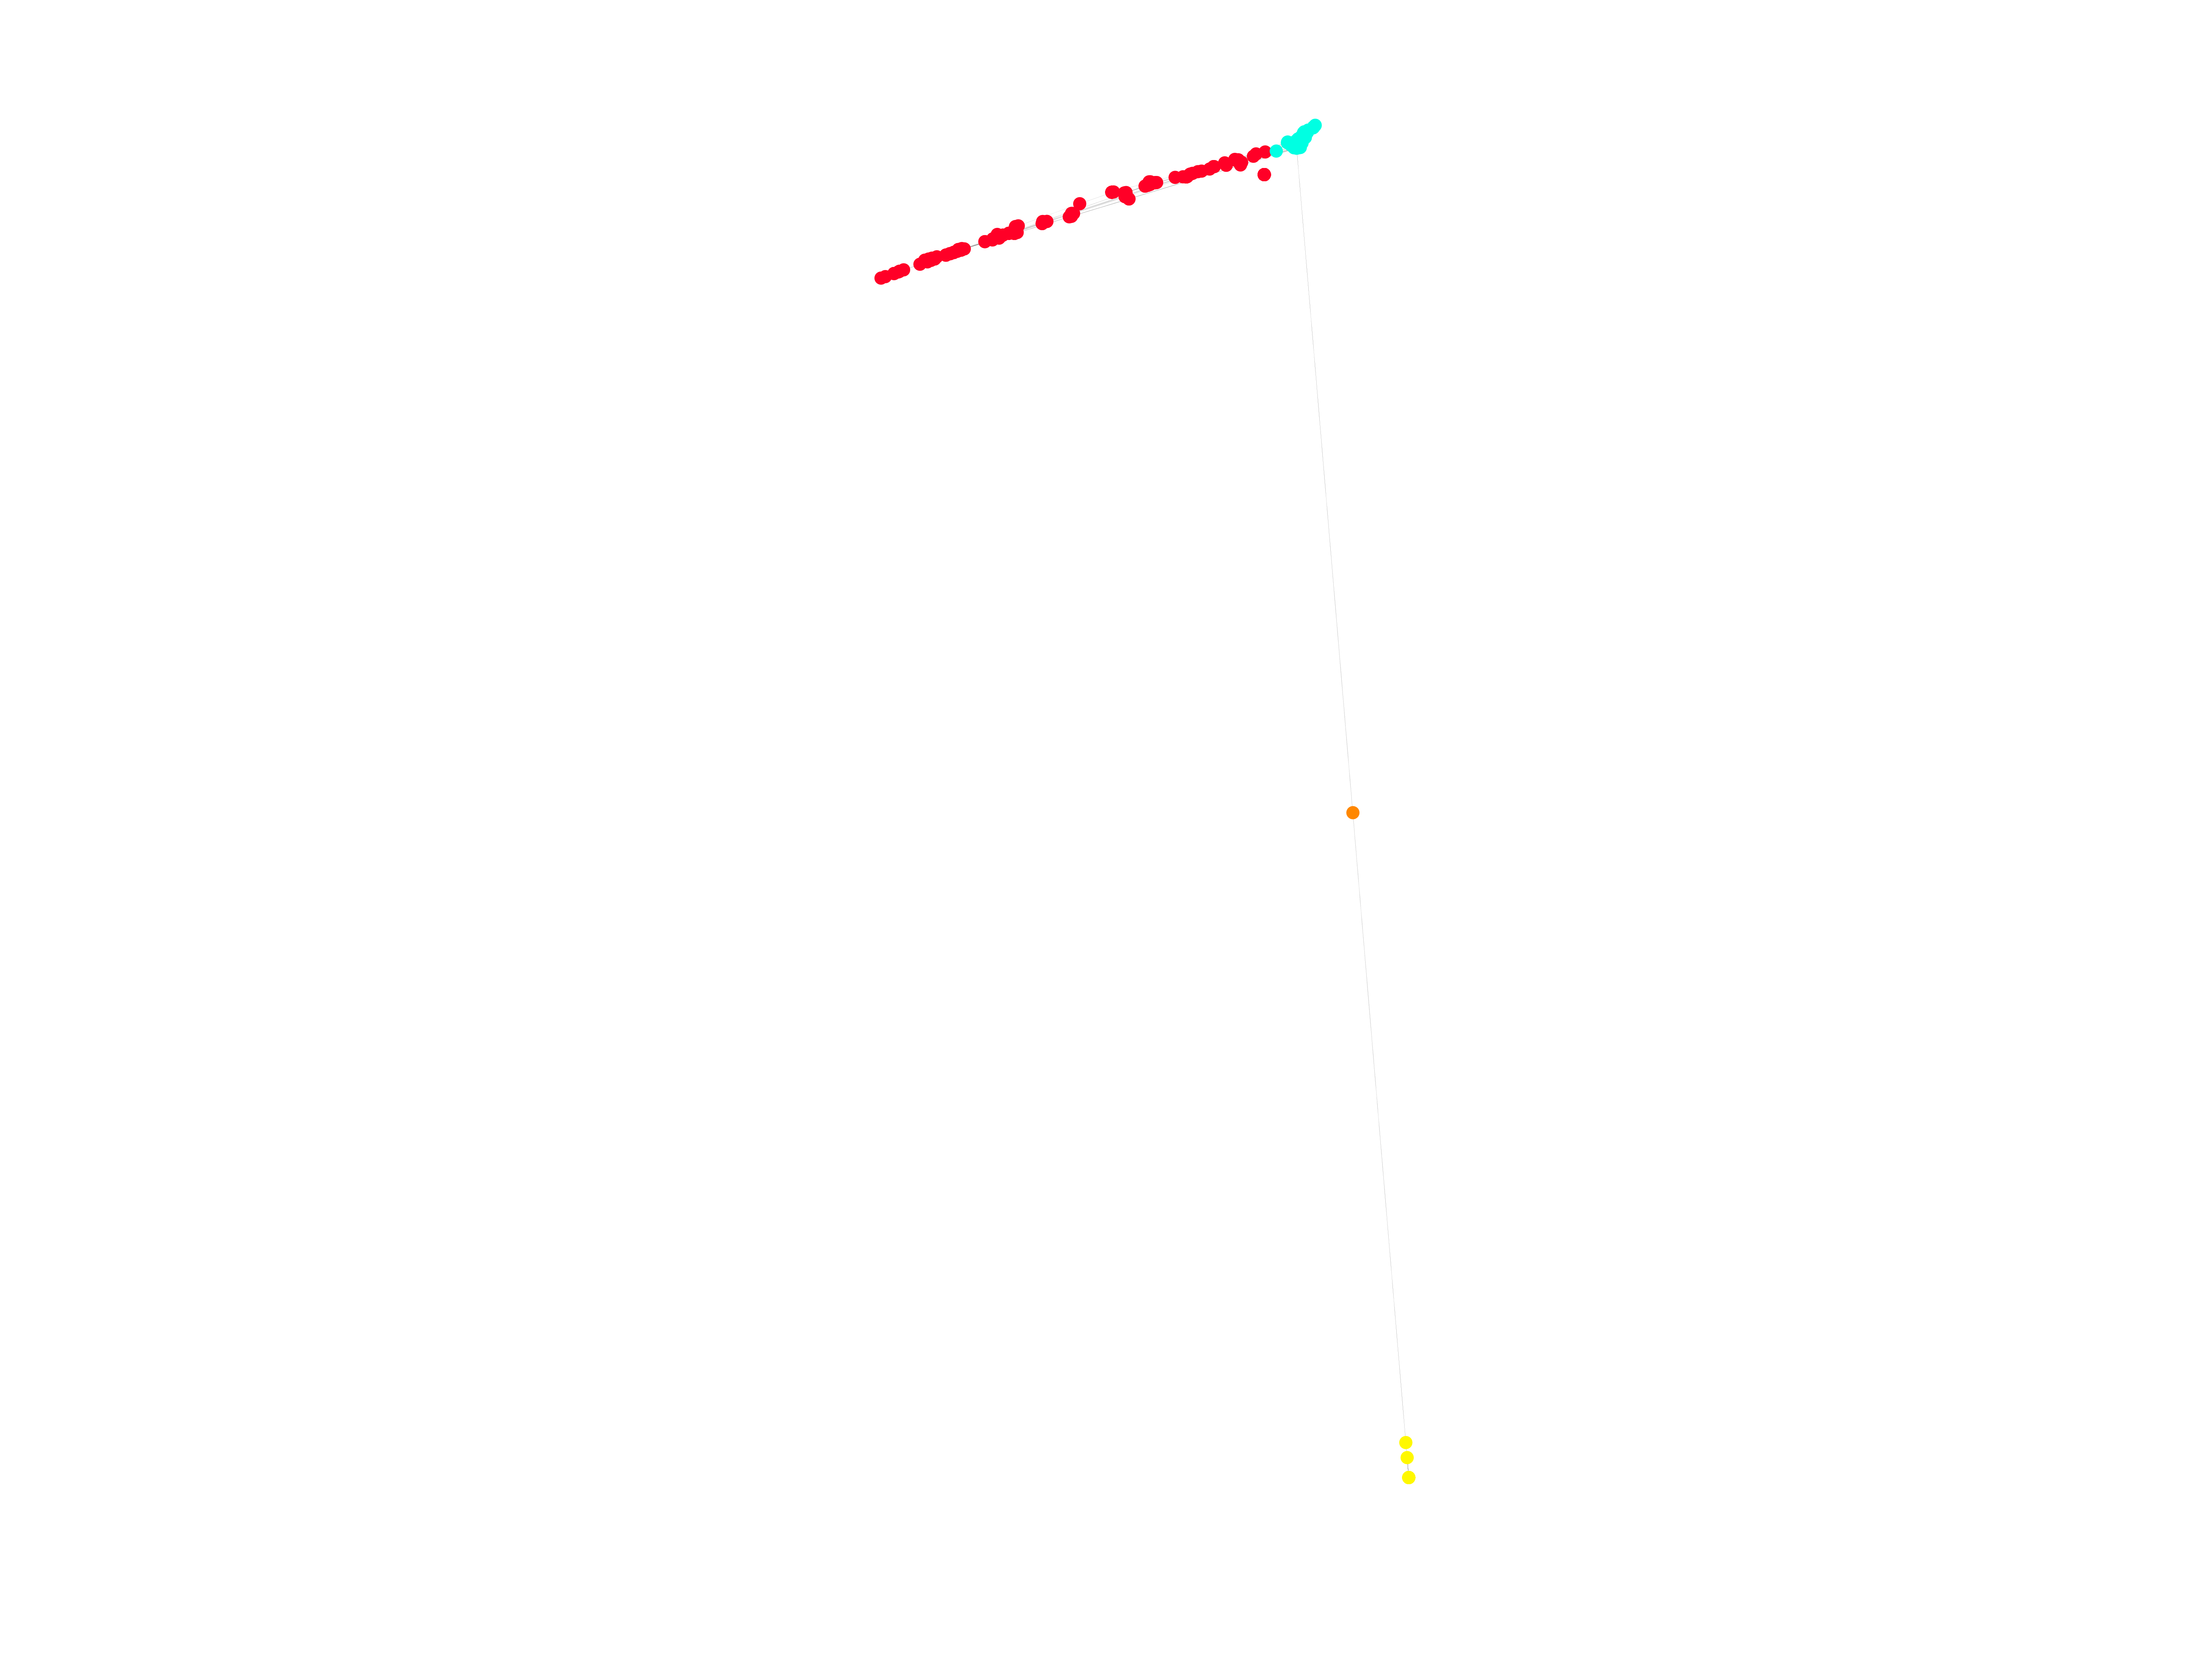
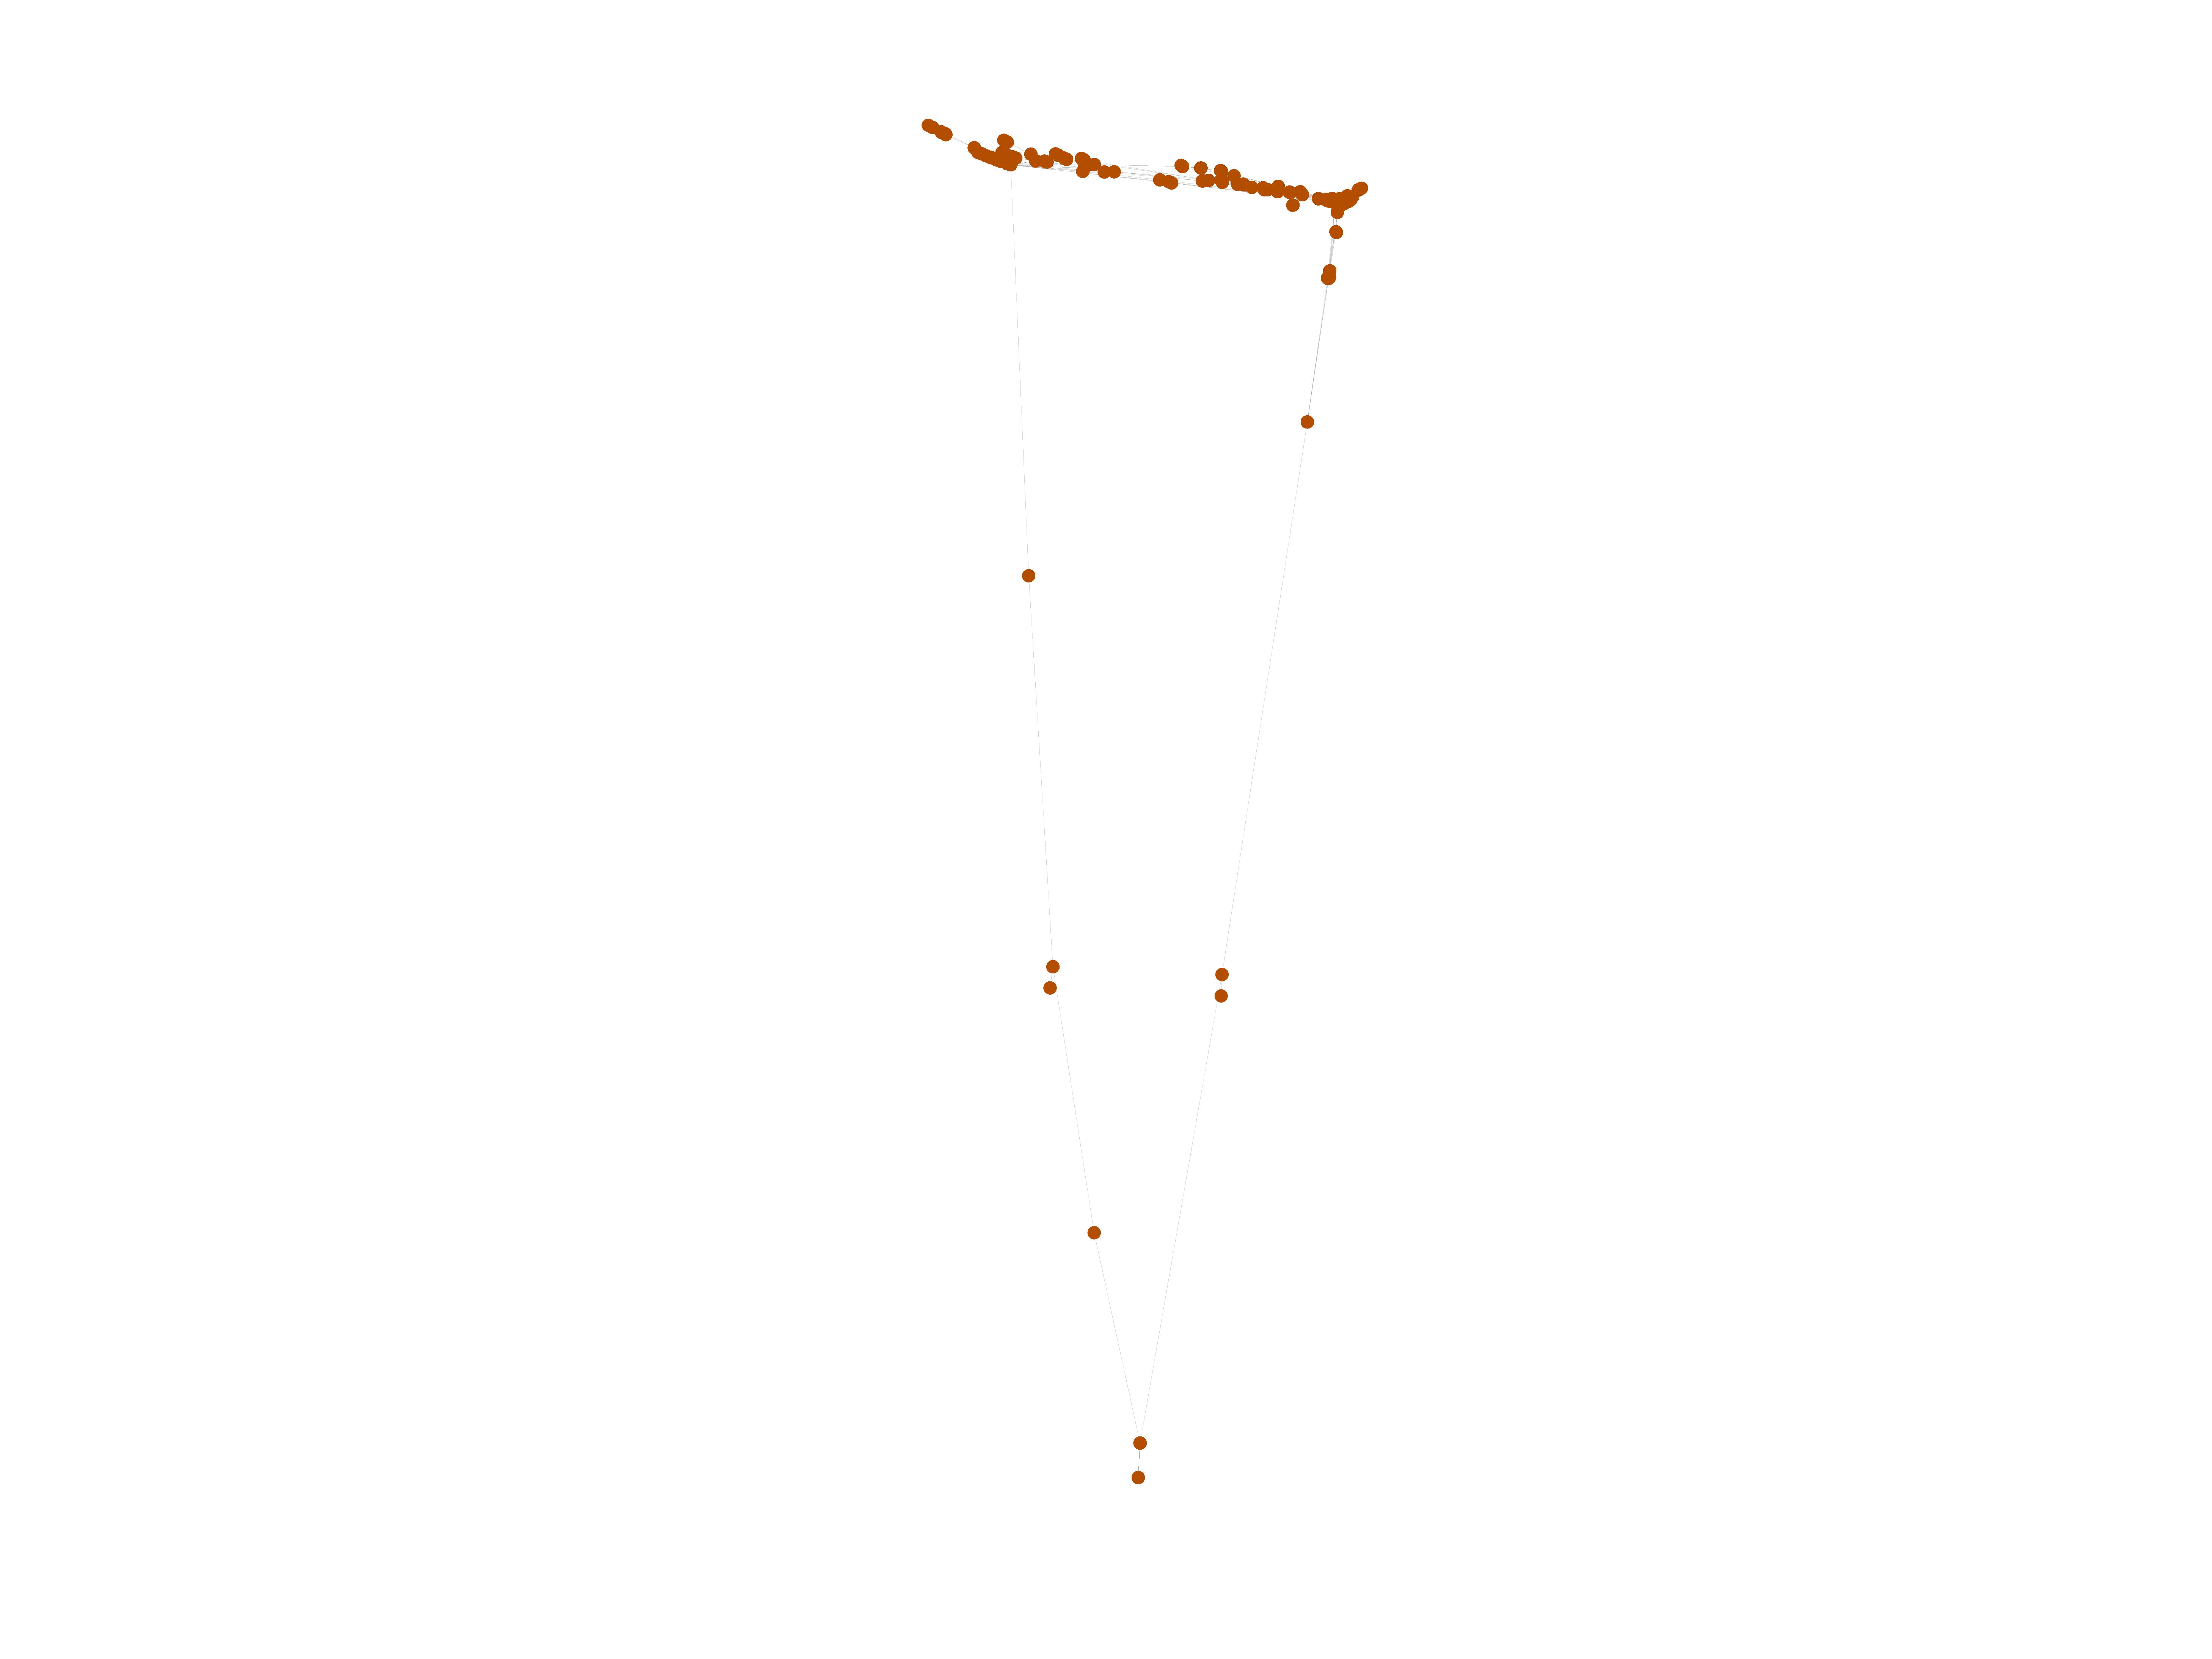
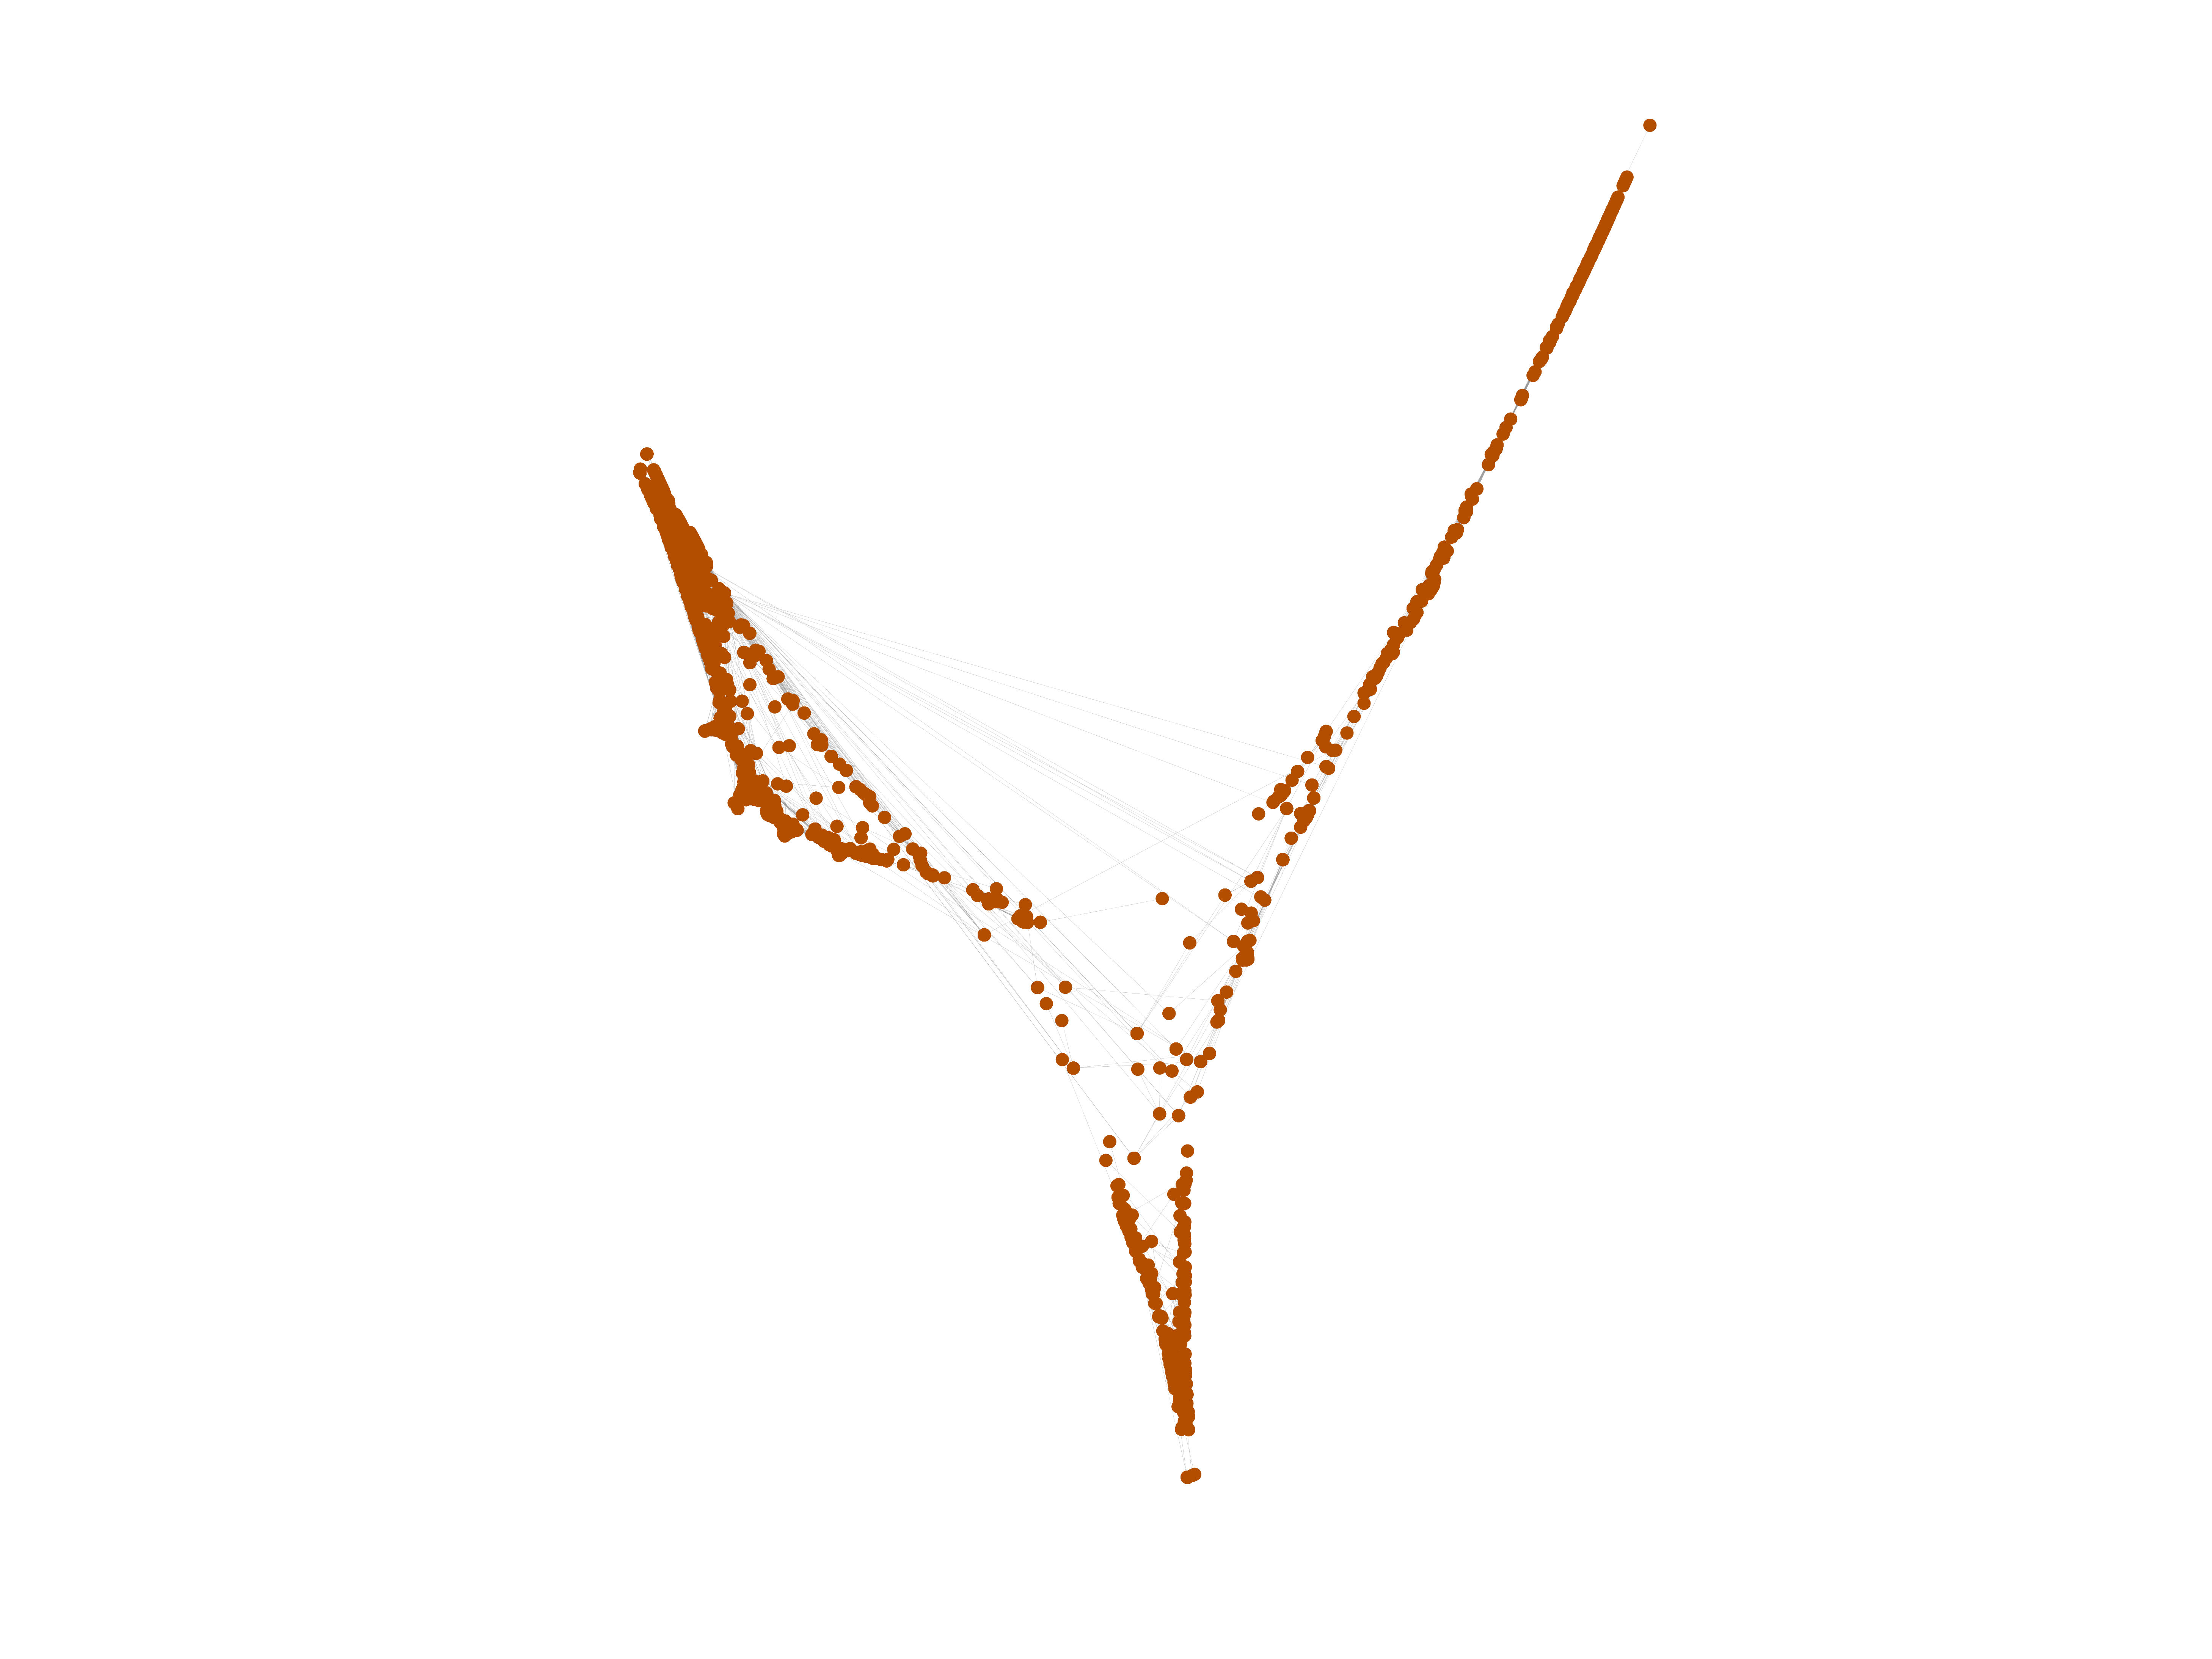
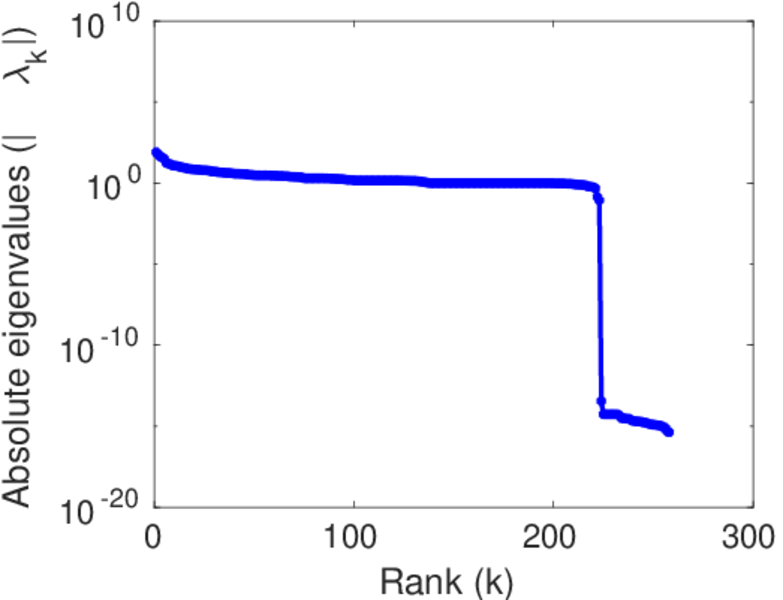
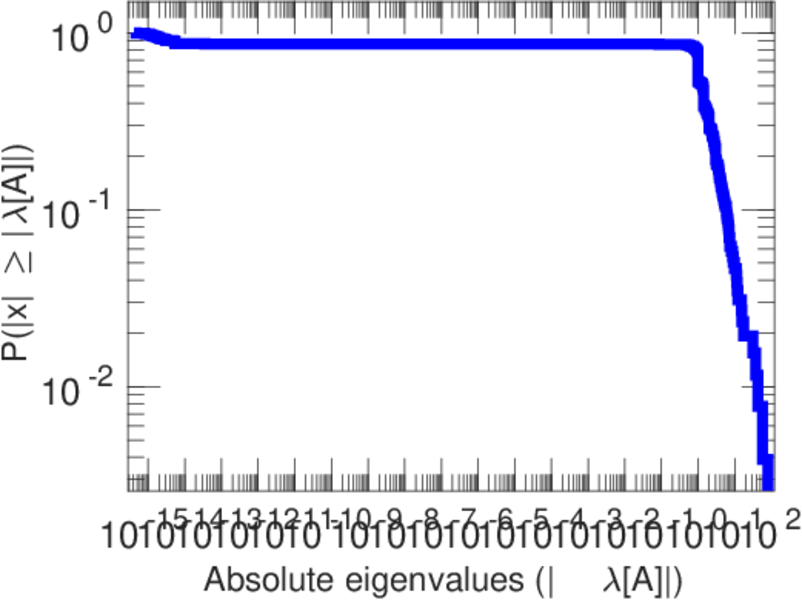
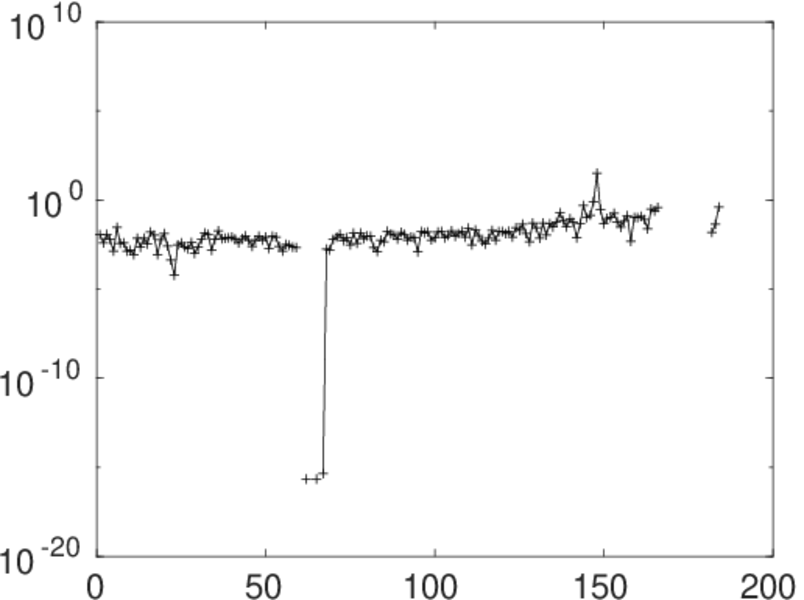
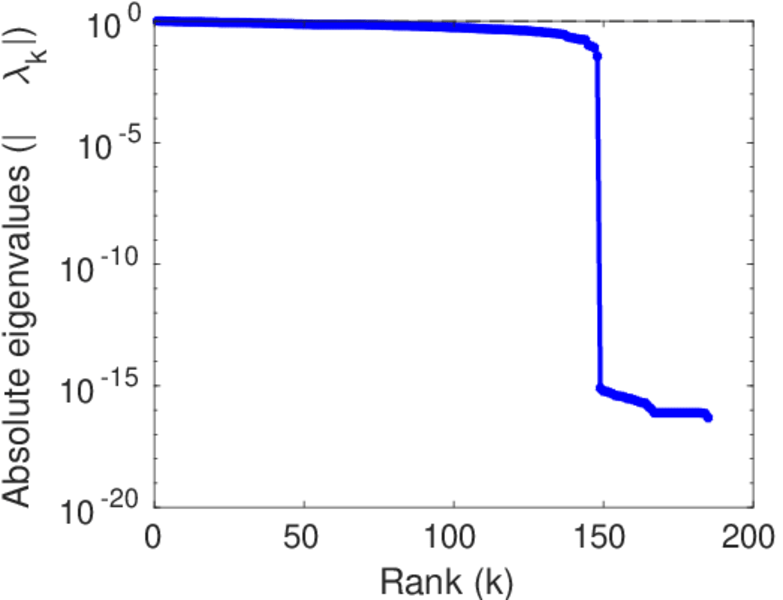
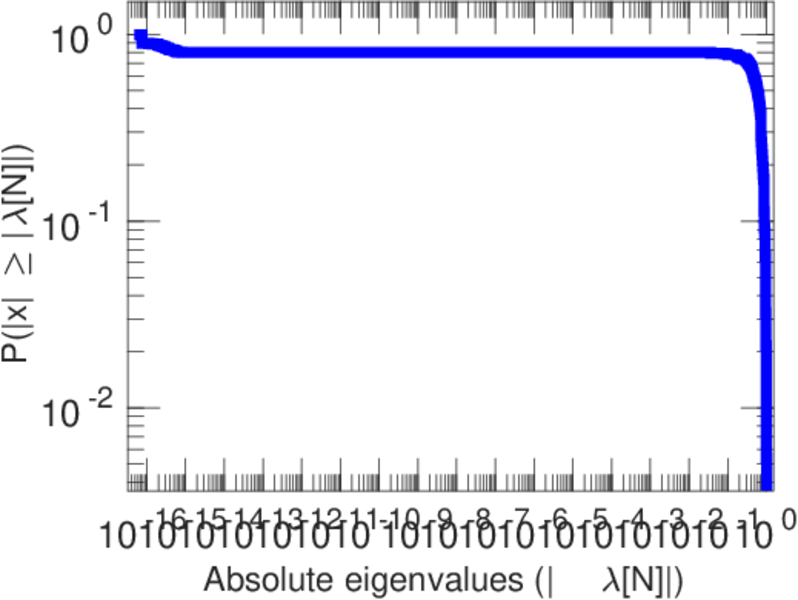
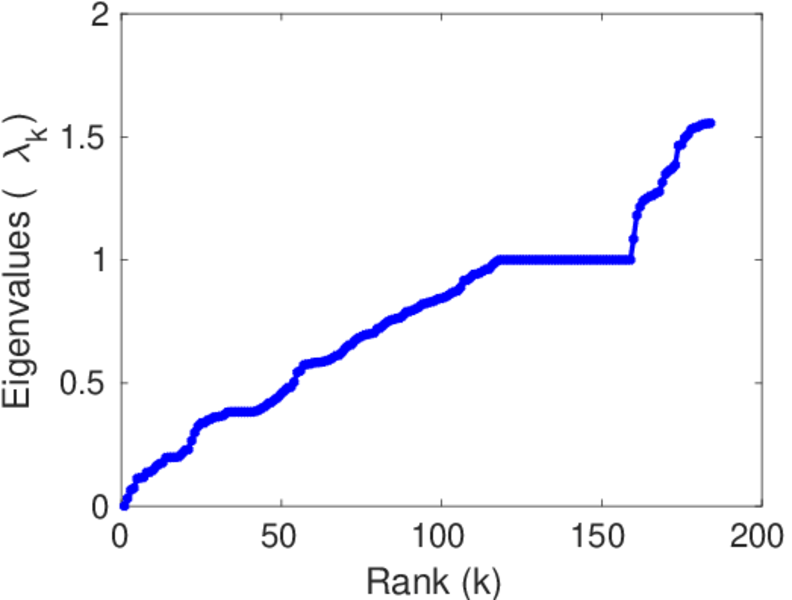
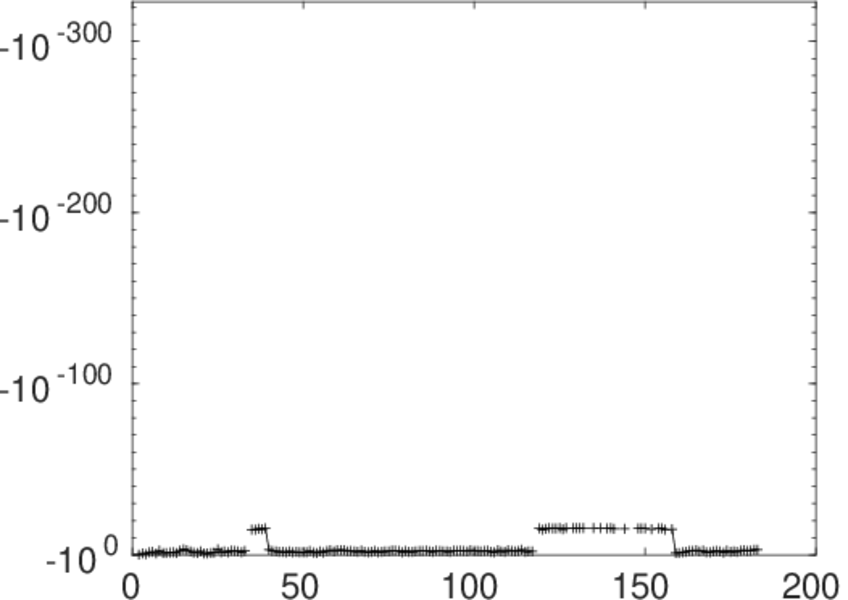
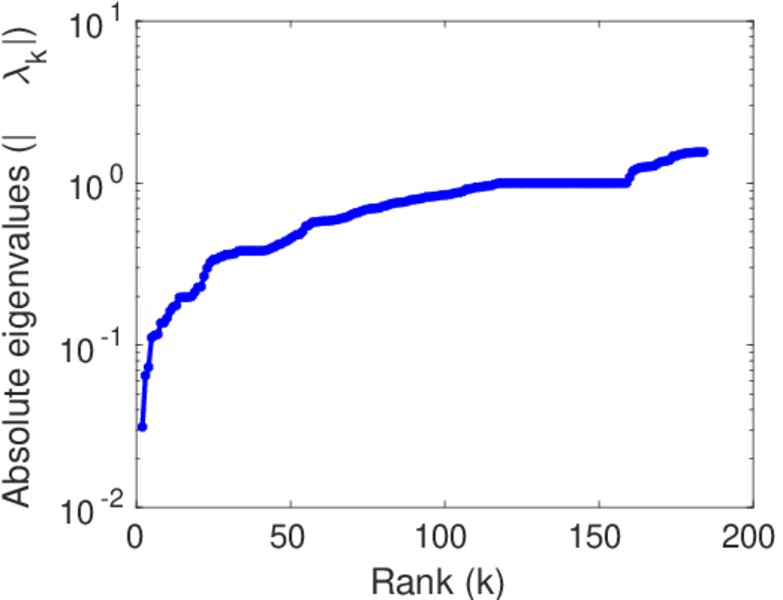
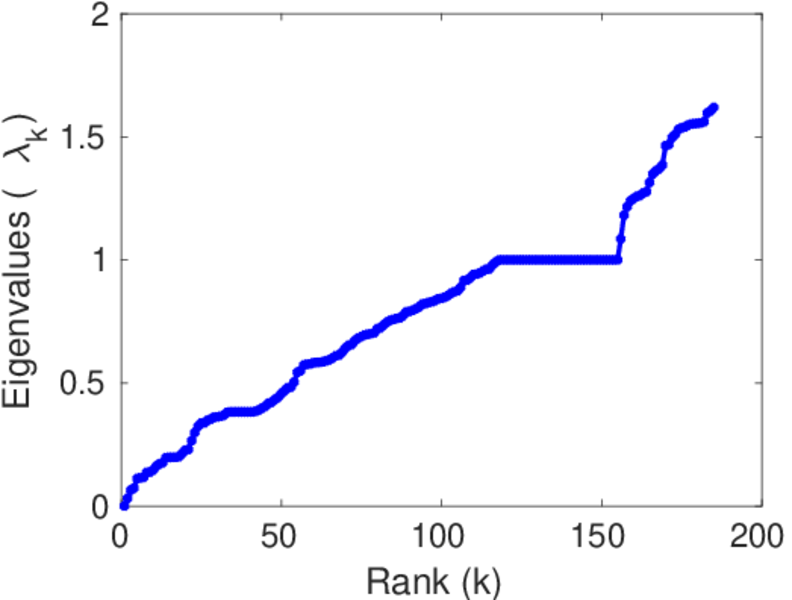
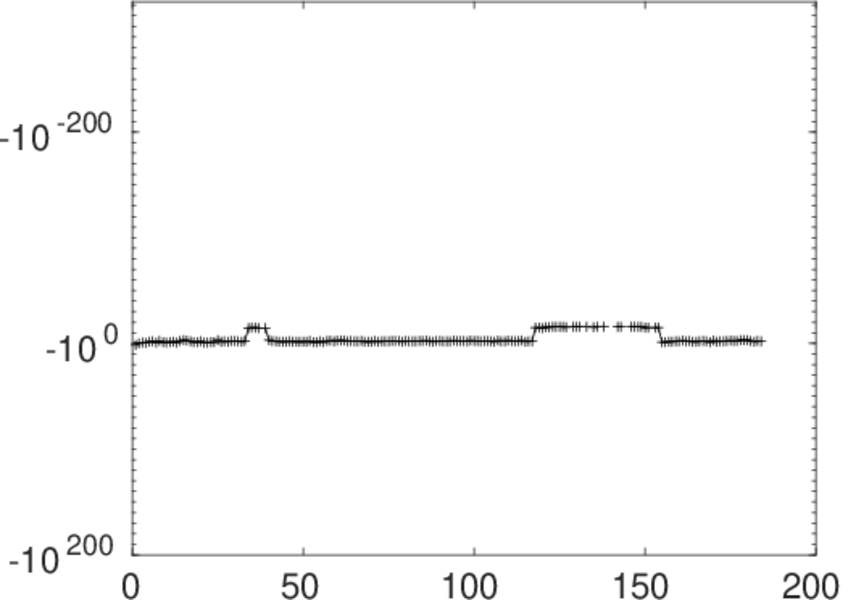
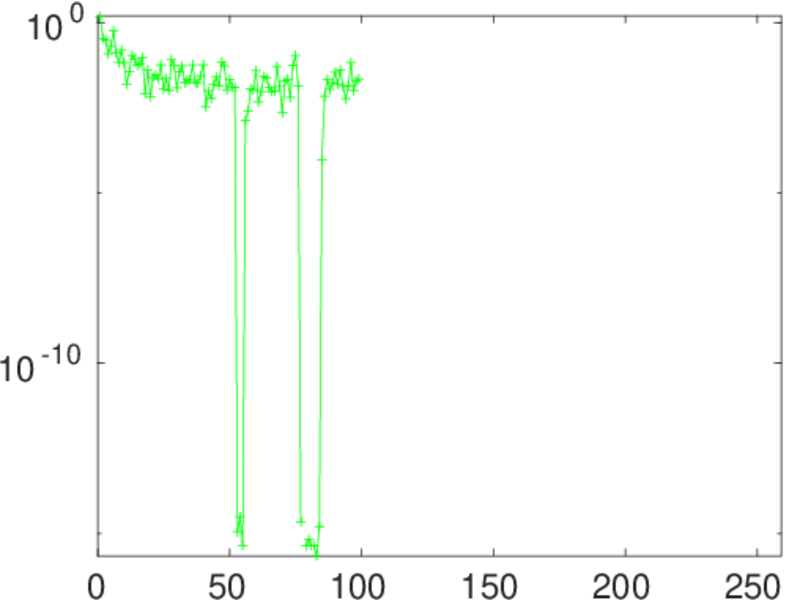
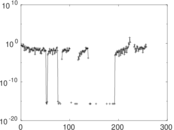
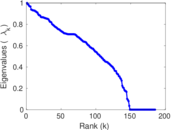
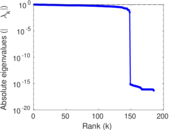
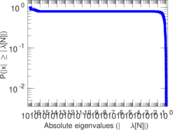
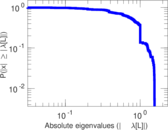
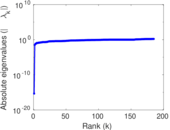
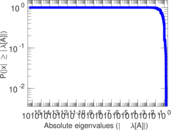
Matrix decompositions plots


Downloads
References
|
[1]
|
Jérôme Kunegis.
KONECT – The Koblenz Network Collection.
In Proc. Int. Conf. on World Wide Web Companion, pages
1343–1350, 2013.
[ http ]
|
|
[2]
|
Wikimedia Foundation.
Wikimedia downloads.
http://dumps.wikimedia.org/, January 2010.
|
 KONECT ‣ Networks ‣
Buy Me a Coffee
KONECT ‣ Networks ‣
Buy Me a Coffee