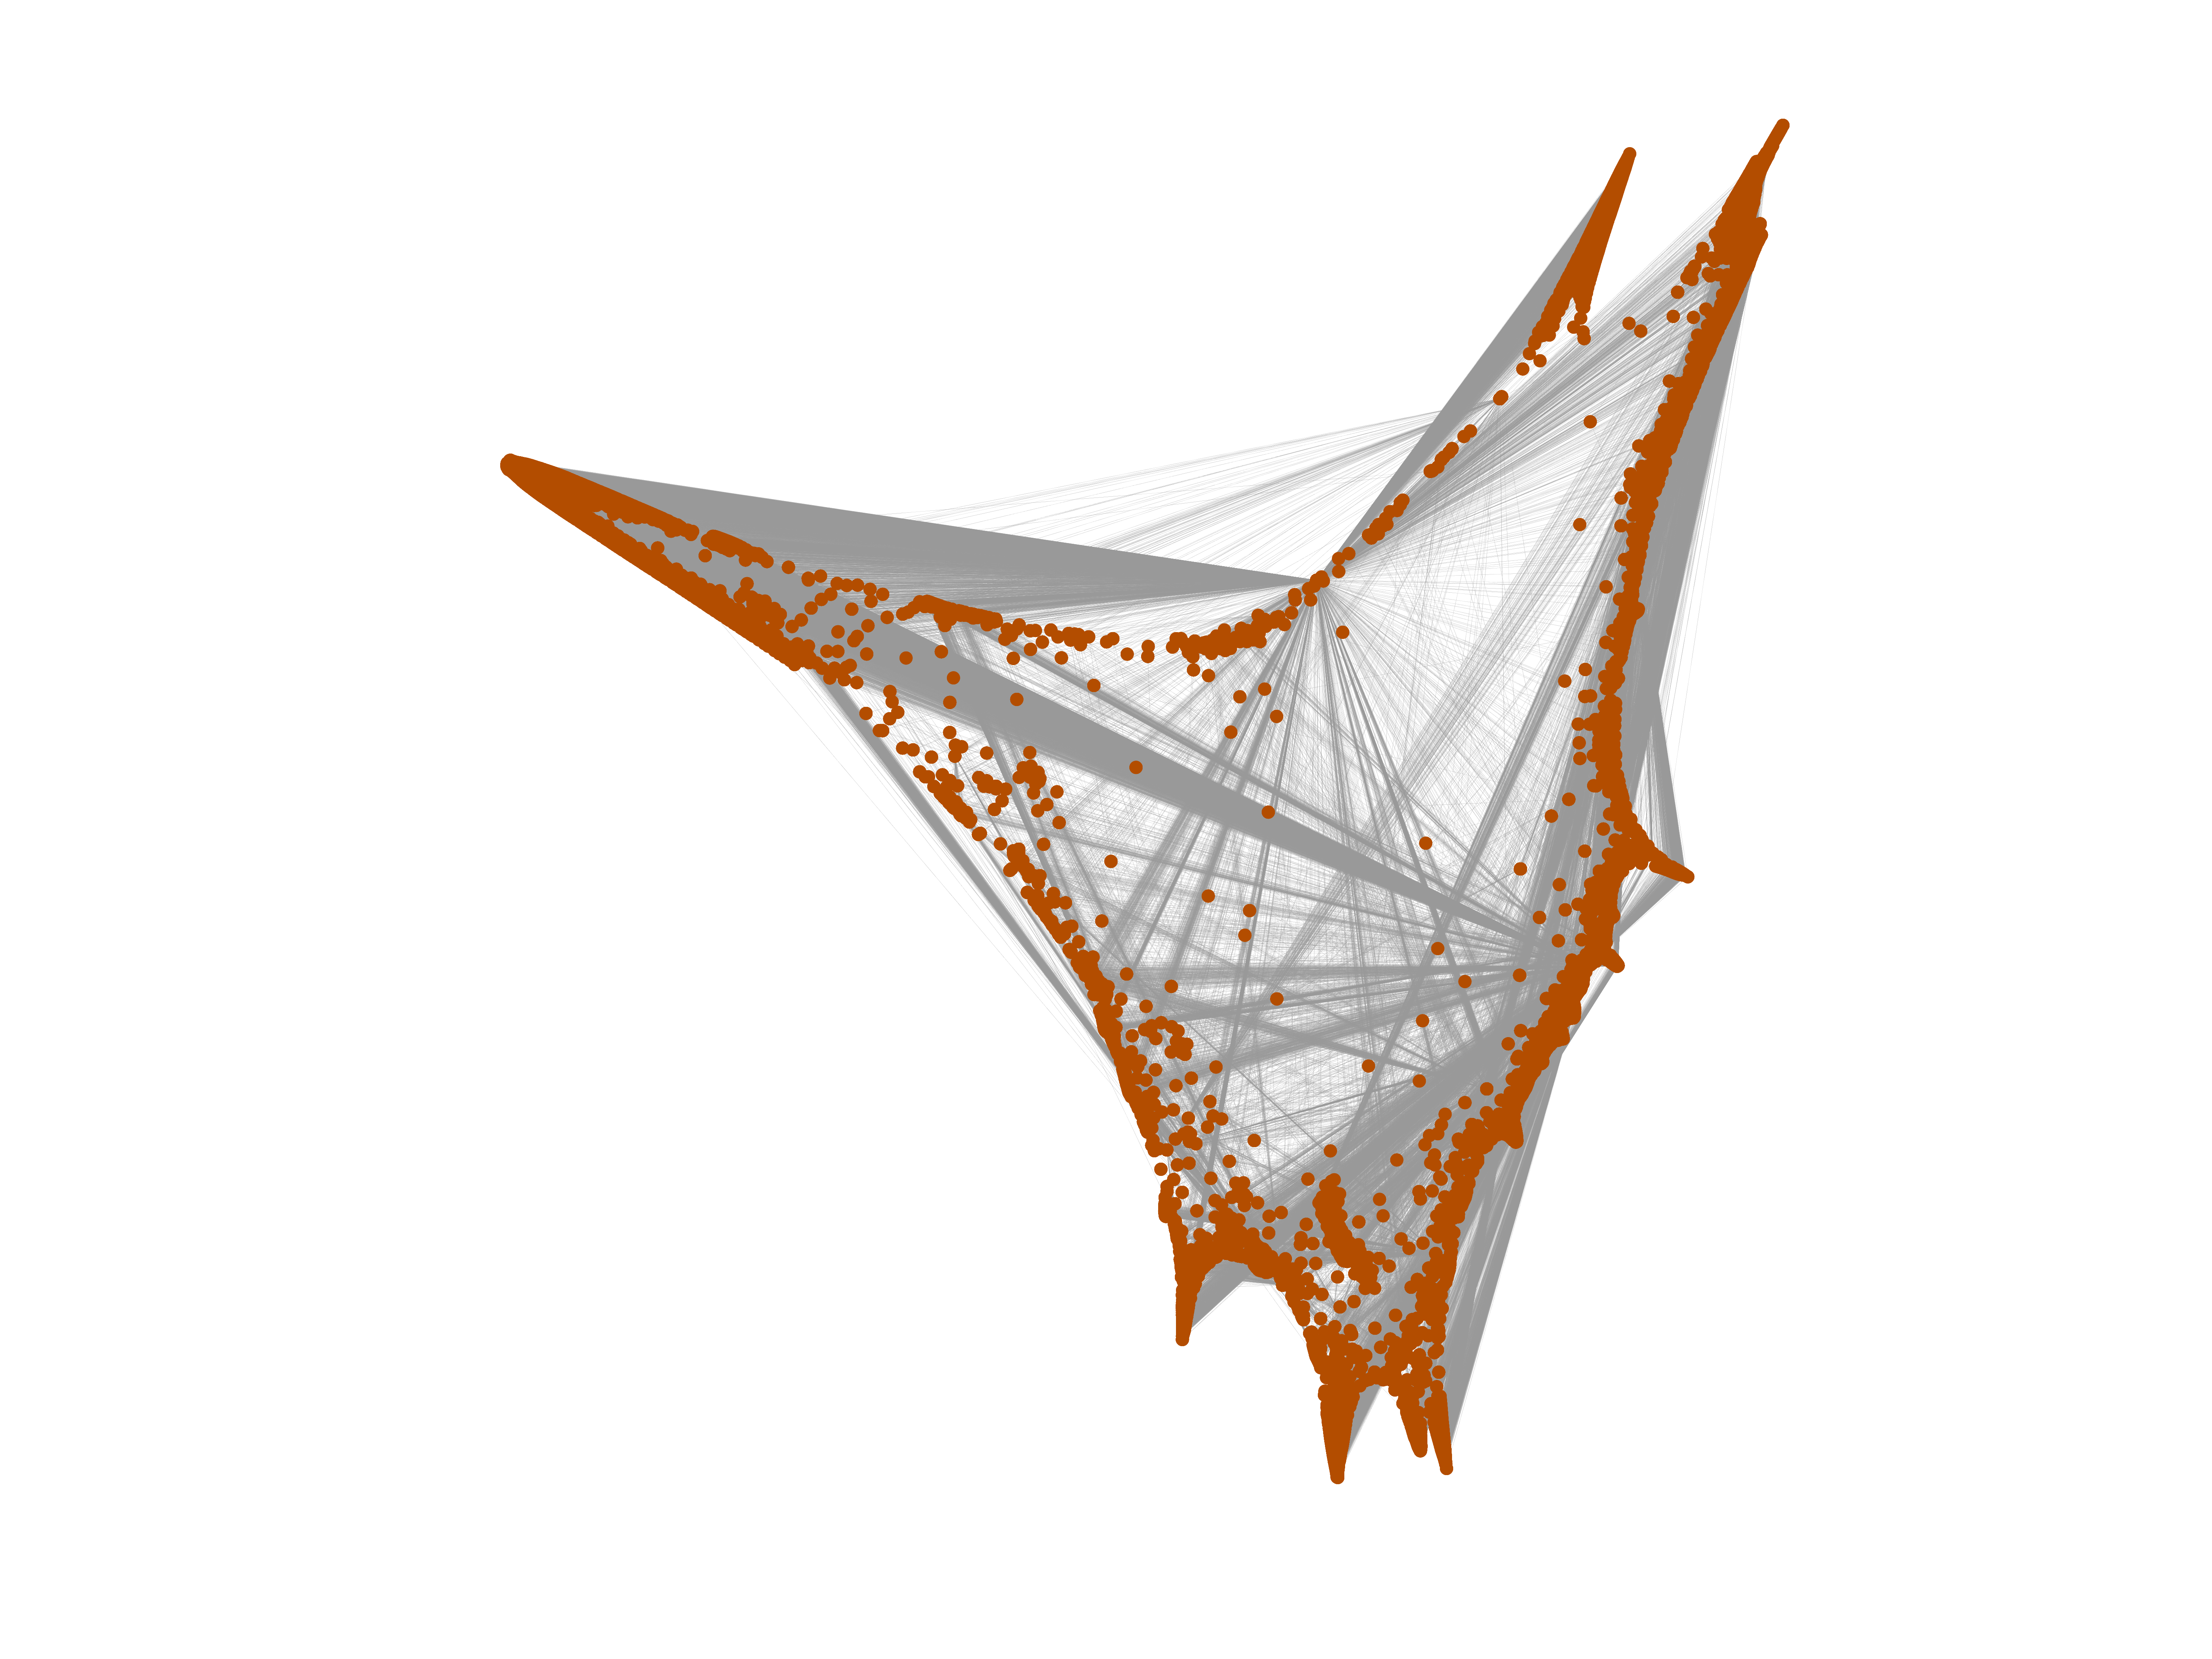
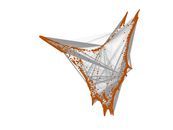
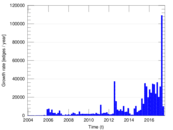
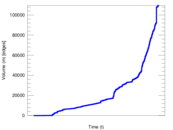
Wiktionary edits (sk)
This is the bipartite edit network of the Slovak Wiktionary. It contains users
and pages from the Slovak Wiktionary, connected by edit events. Each edge
represents an edit. The dataset includes the timestamp of each edit.
Metadata
Statistics
| Size | n = | 22,385
|
| Left size | n1 = | 409
|
| Right size | n2 = | 21,976
|
| Volume | m = | 109,533
|
| Unique edge count | m̿ = | 60,521
|
| Wedge count | s = | 239,971,492
|
| Claw count | z = | 1,115,207,606,647
|
| Square count | q = | 71,943,191
|
| 4-Tour count | T4 = | 1,535,579,674
|
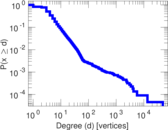
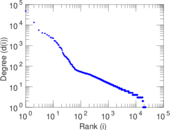
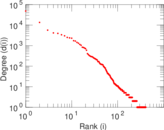
| Maximum degree | dmax = | 48,309
|
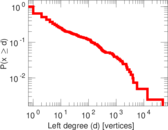
| Maximum left degree | d1max = | 48,309
|
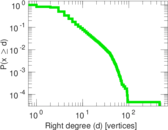
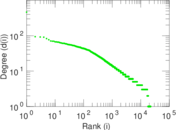
| Maximum right degree | d2max = | 463
|
| Average degree | d = | 9.786 29
|
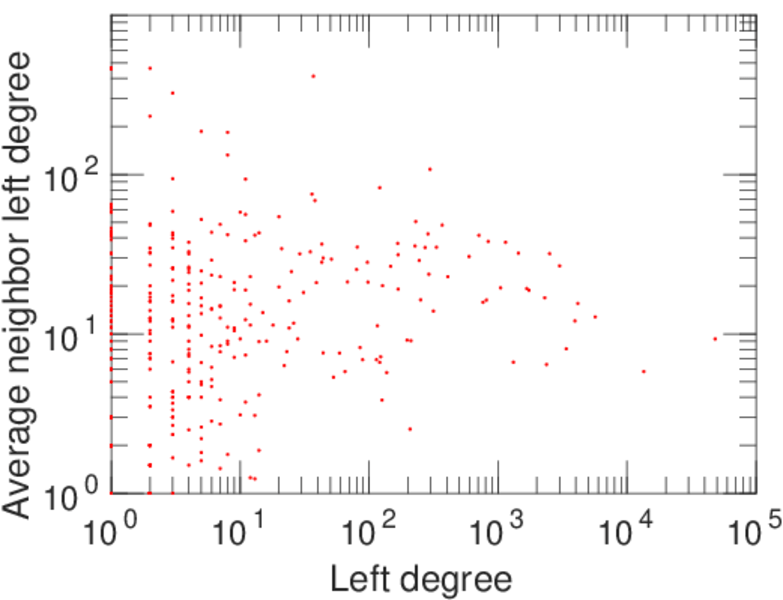
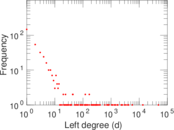
| Average left degree | d1 = | 267.807
|
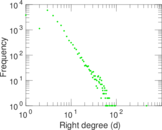
| Average right degree | d2 = | 4.984 21
|
| Fill | p = | 0.006 733 40
|
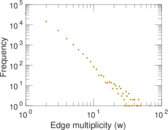
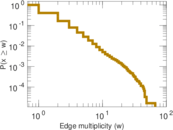
| Average edge multiplicity | m̃ = | 1.809 83
|
| Size of LCC | N = | 22,194
|
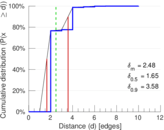
| Diameter | δ = | 14
|
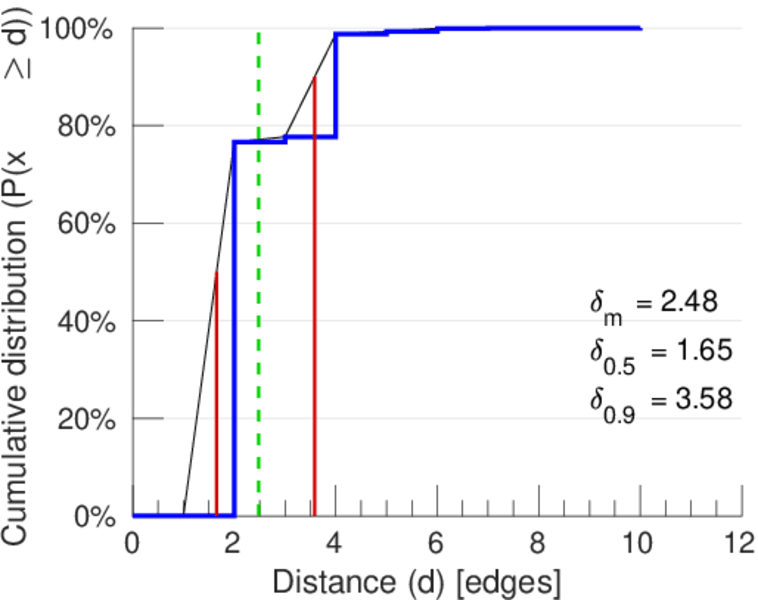
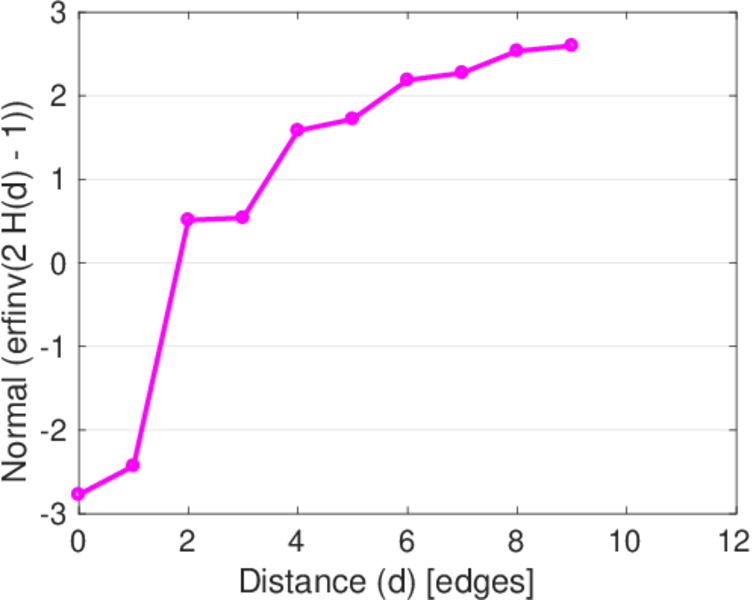
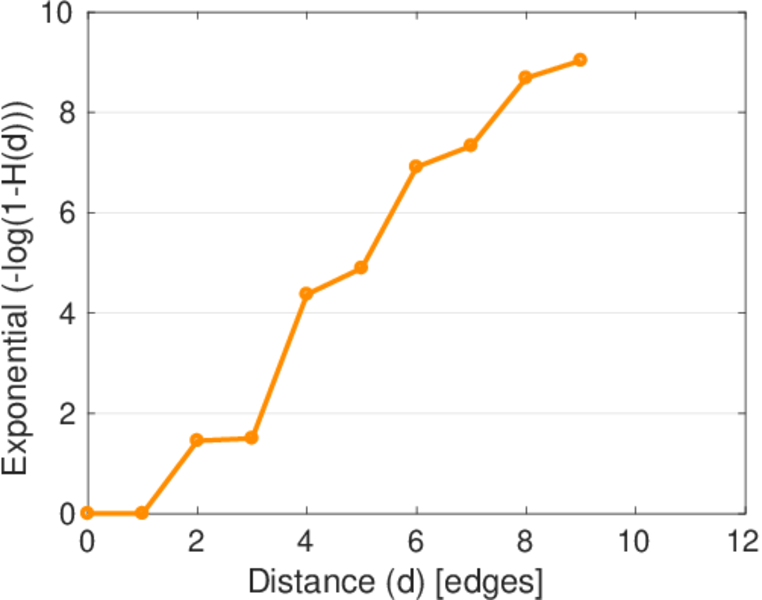
| 50-Percentile effective diameter | δ0.5 = | 1.652 70
|
| 90-Percentile effective diameter | δ0.9 = | 3.584 77
|
| Median distance | δM = | 2
|
| Mean distance | δm = | 2.478 88
|
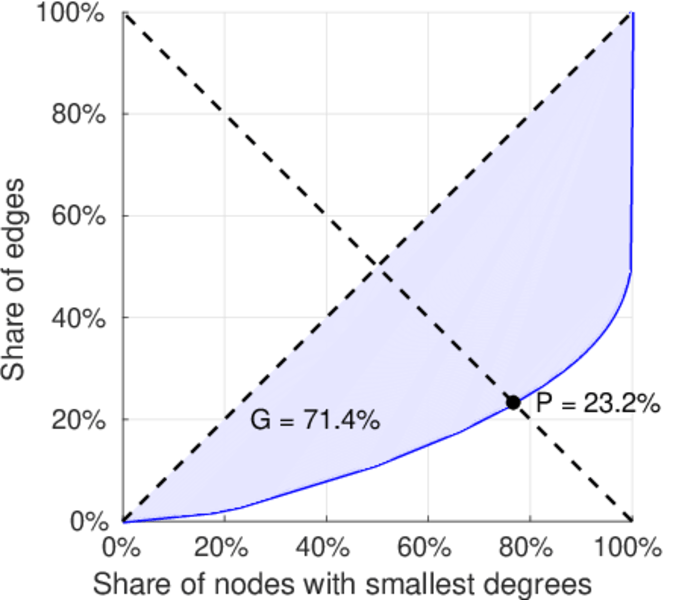
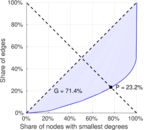
| Gini coefficient | G = | 0.716 808
|
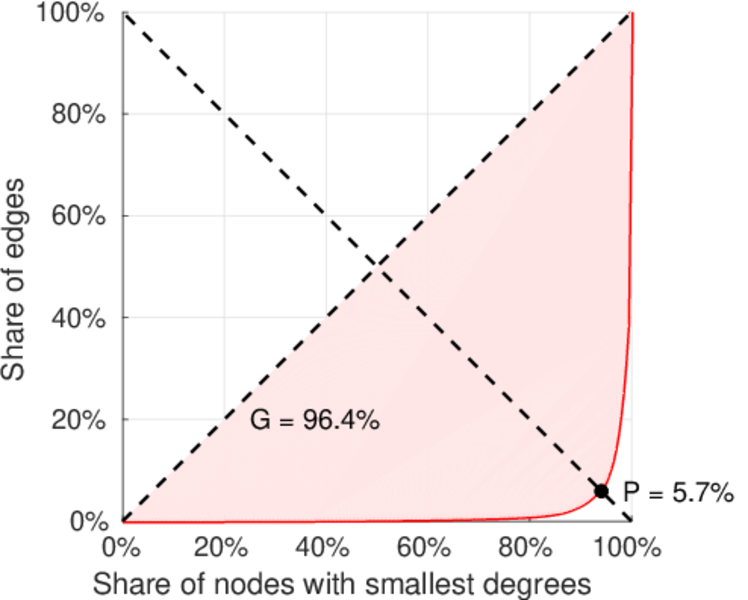
| Balanced inequality ratio | P = | 0.229 146
|
| Left balanced inequality ratio | P1 = | 0.057 489 5
|
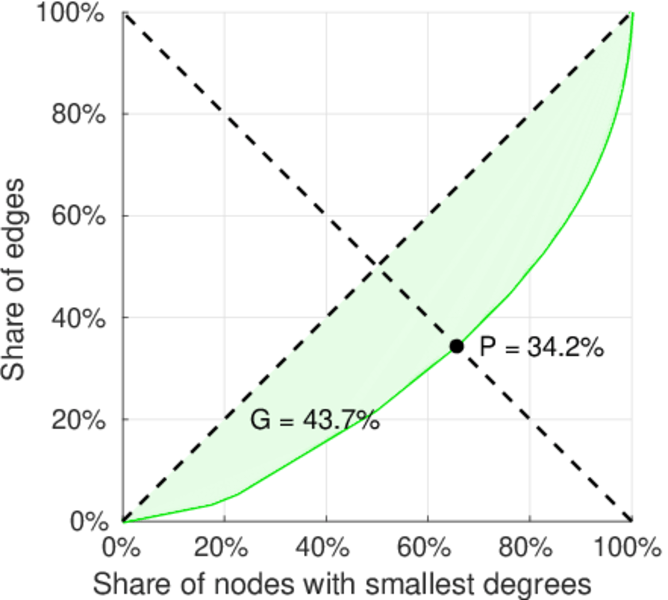
| Right balanced inequality ratio | P2 = | 0.342 025
|
| Relative edge distribution entropy | Her = | 0.700 430
|
| Power law exponent | γ = | 2.191 75
|
| Tail power law exponent | γt = | 3.181 00
|
| Tail power law exponent with p | γ3 = | 3.181 00
|
| p-value | p = | 0.000 00
|
| Left tail power law exponent with p | γ3,1 = | 1.521 00
|
| Left p-value | p1 = | 0.030 000 0
|
| Right tail power law exponent with p | γ3,2 = | 3.371 00
|
| Right p-value | p2 = | 0.000 00
|
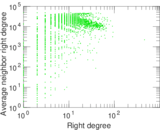
| Degree assortativity | ρ = | −0.370 681
|
| Degree assortativity p-value | pρ = | 0.000 00
|
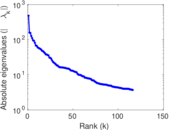
| Spectral norm | α = | 482.364
|
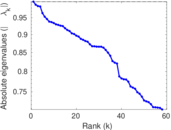
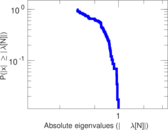
| Algebraic connectivity | a = | 0.034 151 6
|
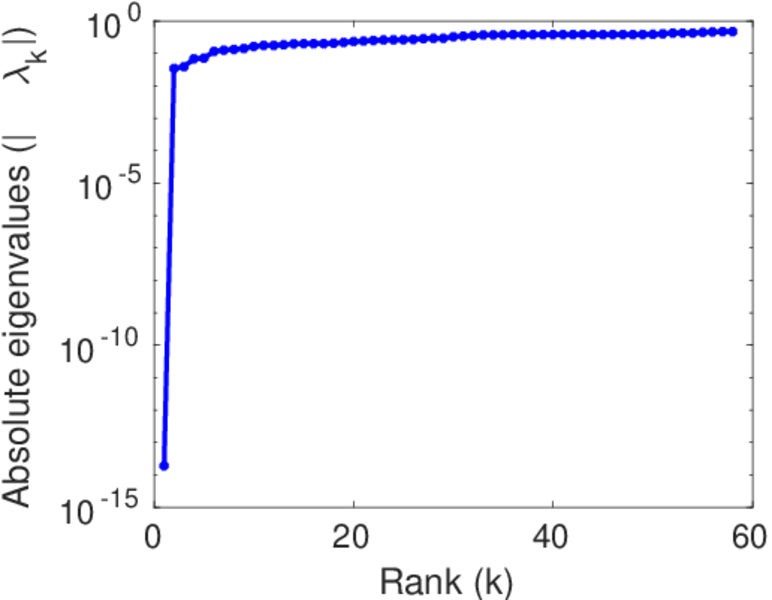
| Spectral separation | |λ1[A] / λ2[A]| = | 3.032 56
|
| Controllability | C = | 21,589
|
| Relative controllability | Cr = | 0.964 785
|
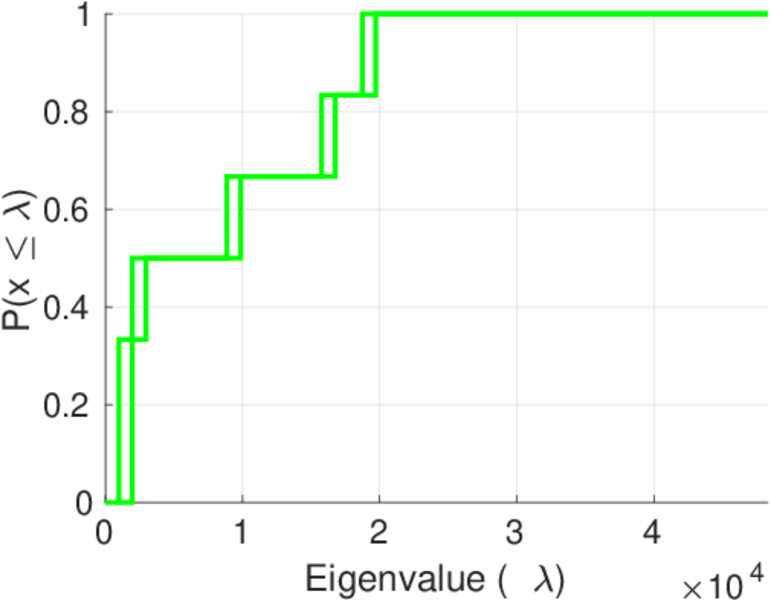
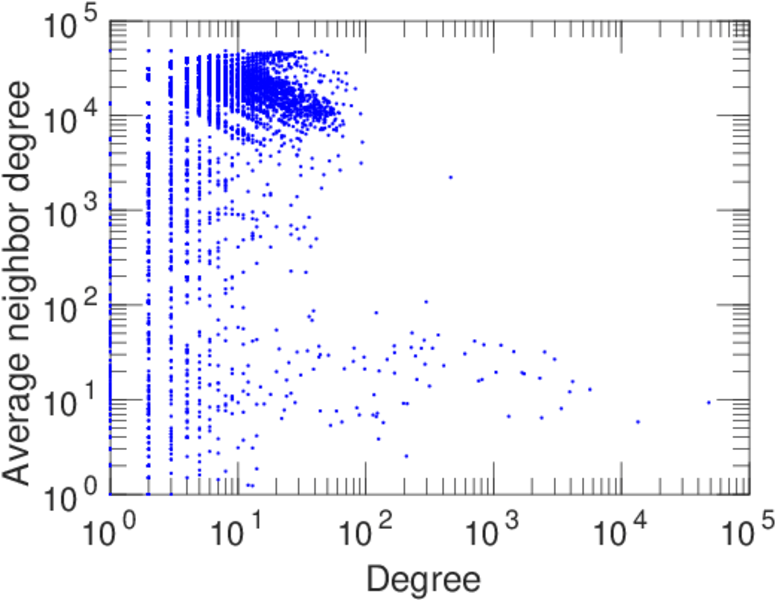
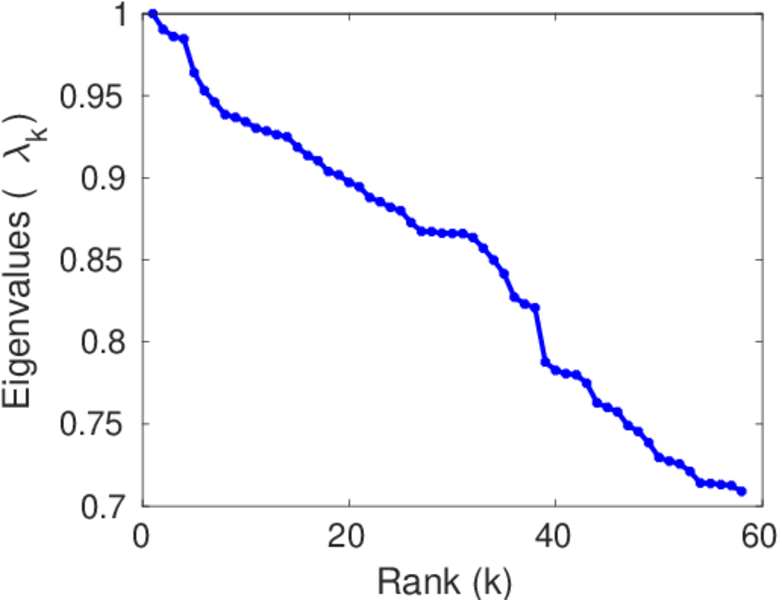
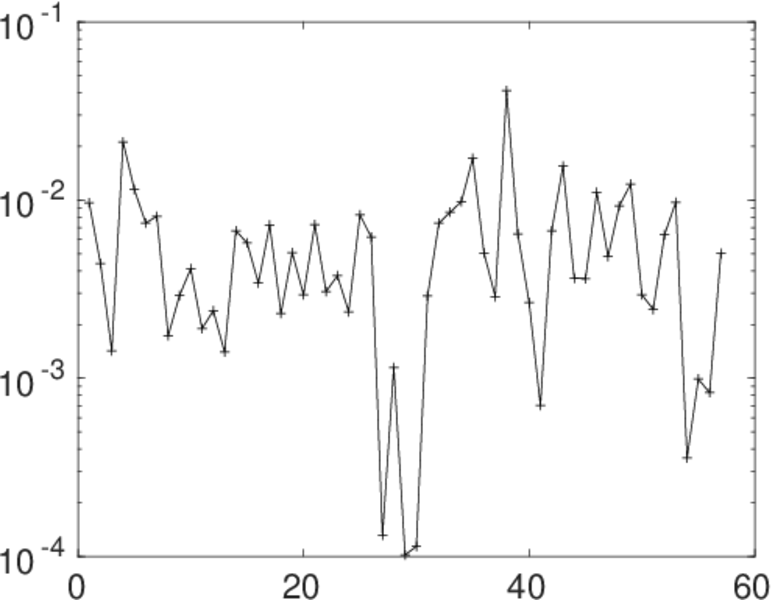
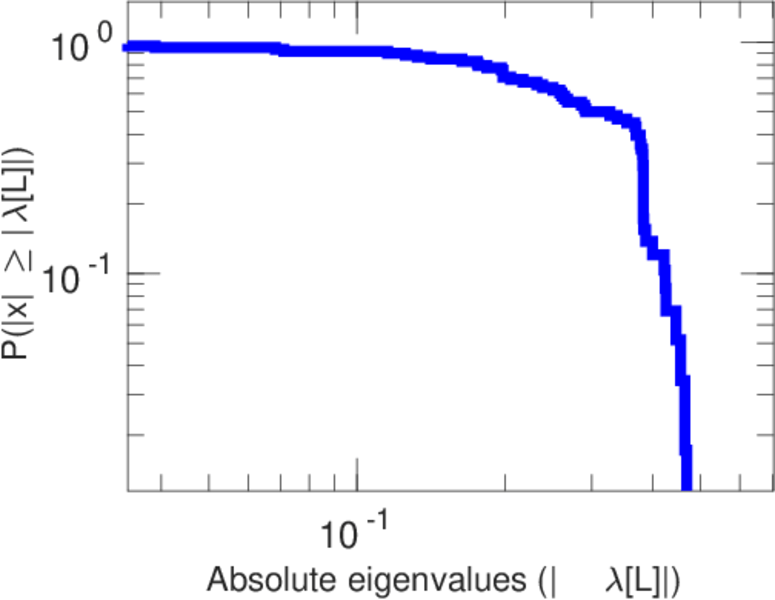
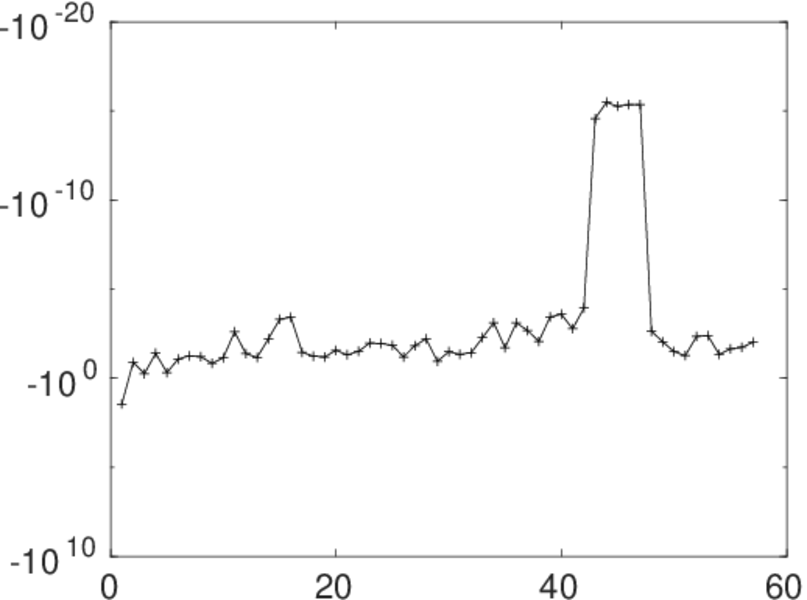
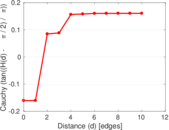
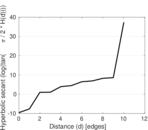
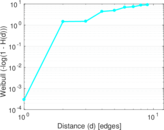
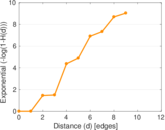
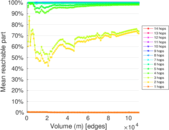
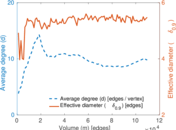
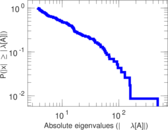
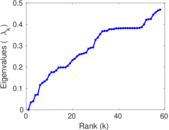
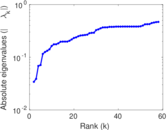
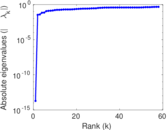
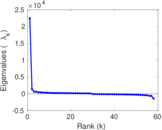
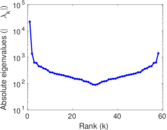
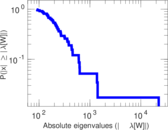
Plots


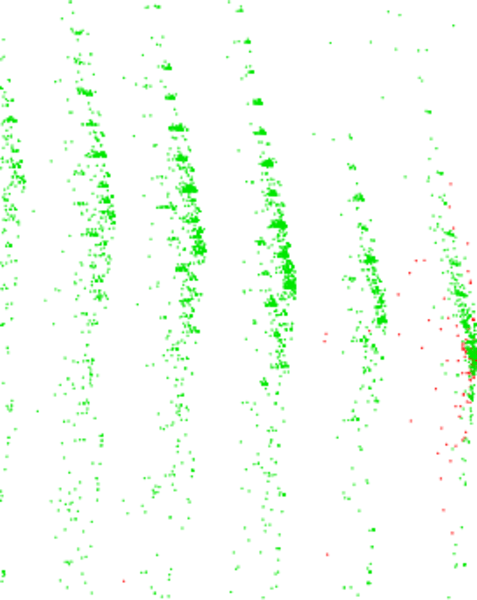
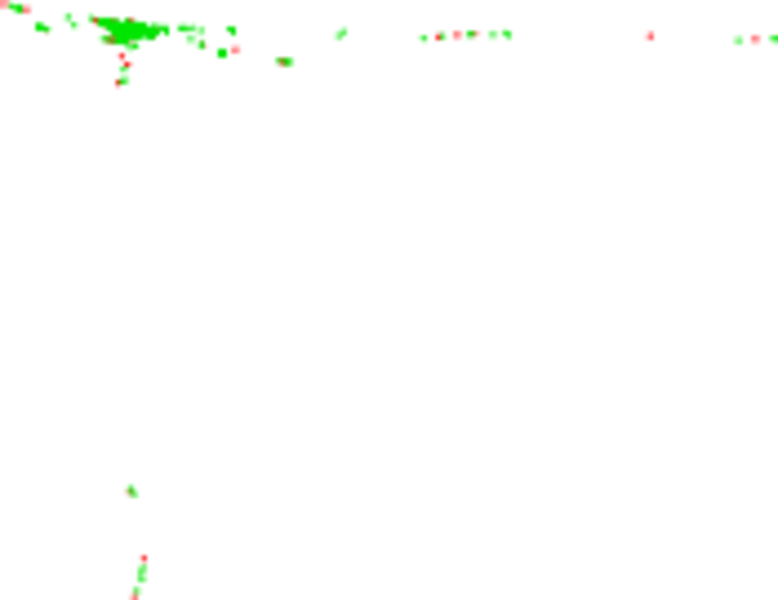
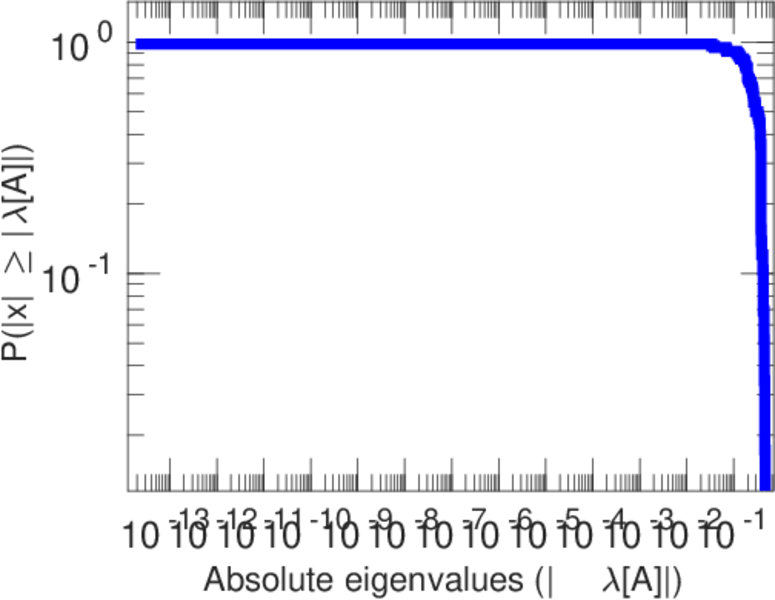
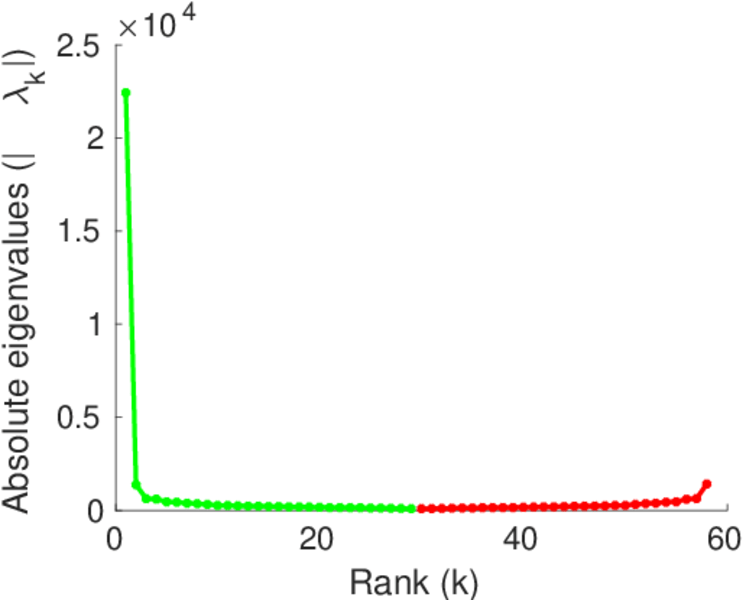
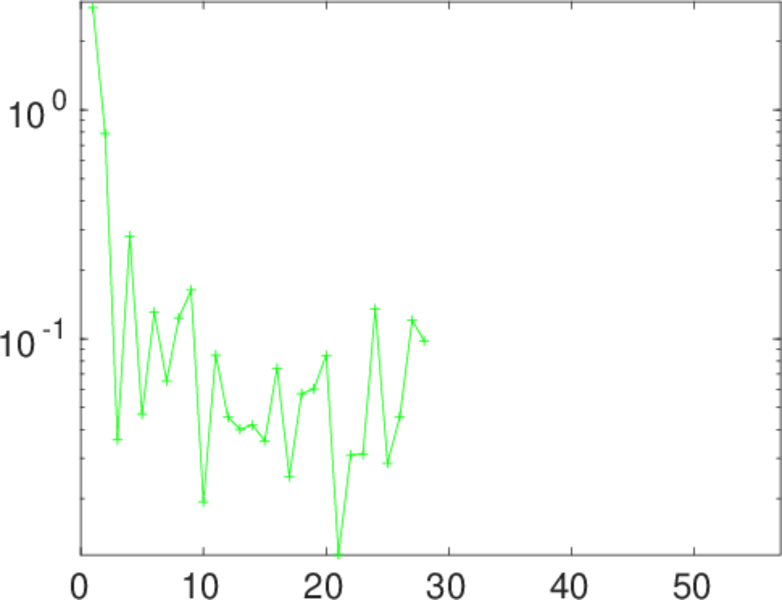
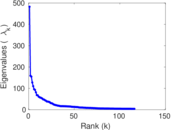
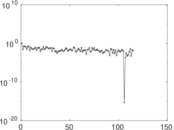
Matrix decompositions plots


Downloads
References
|
[1]
|
Jérôme Kunegis.
KONECT – The Koblenz Network Collection.
In Proc. Int. Conf. on World Wide Web Companion, pages
1343–1350, 2013.
[ http ]
|
|
[2]
|
Wikimedia Foundation.
Wikimedia downloads.
http://dumps.wikimedia.org/, January 2010.
|
 KONECT ‣ Networks ‣
Buy Me a Coffee
KONECT ‣ Networks ‣
Buy Me a Coffee