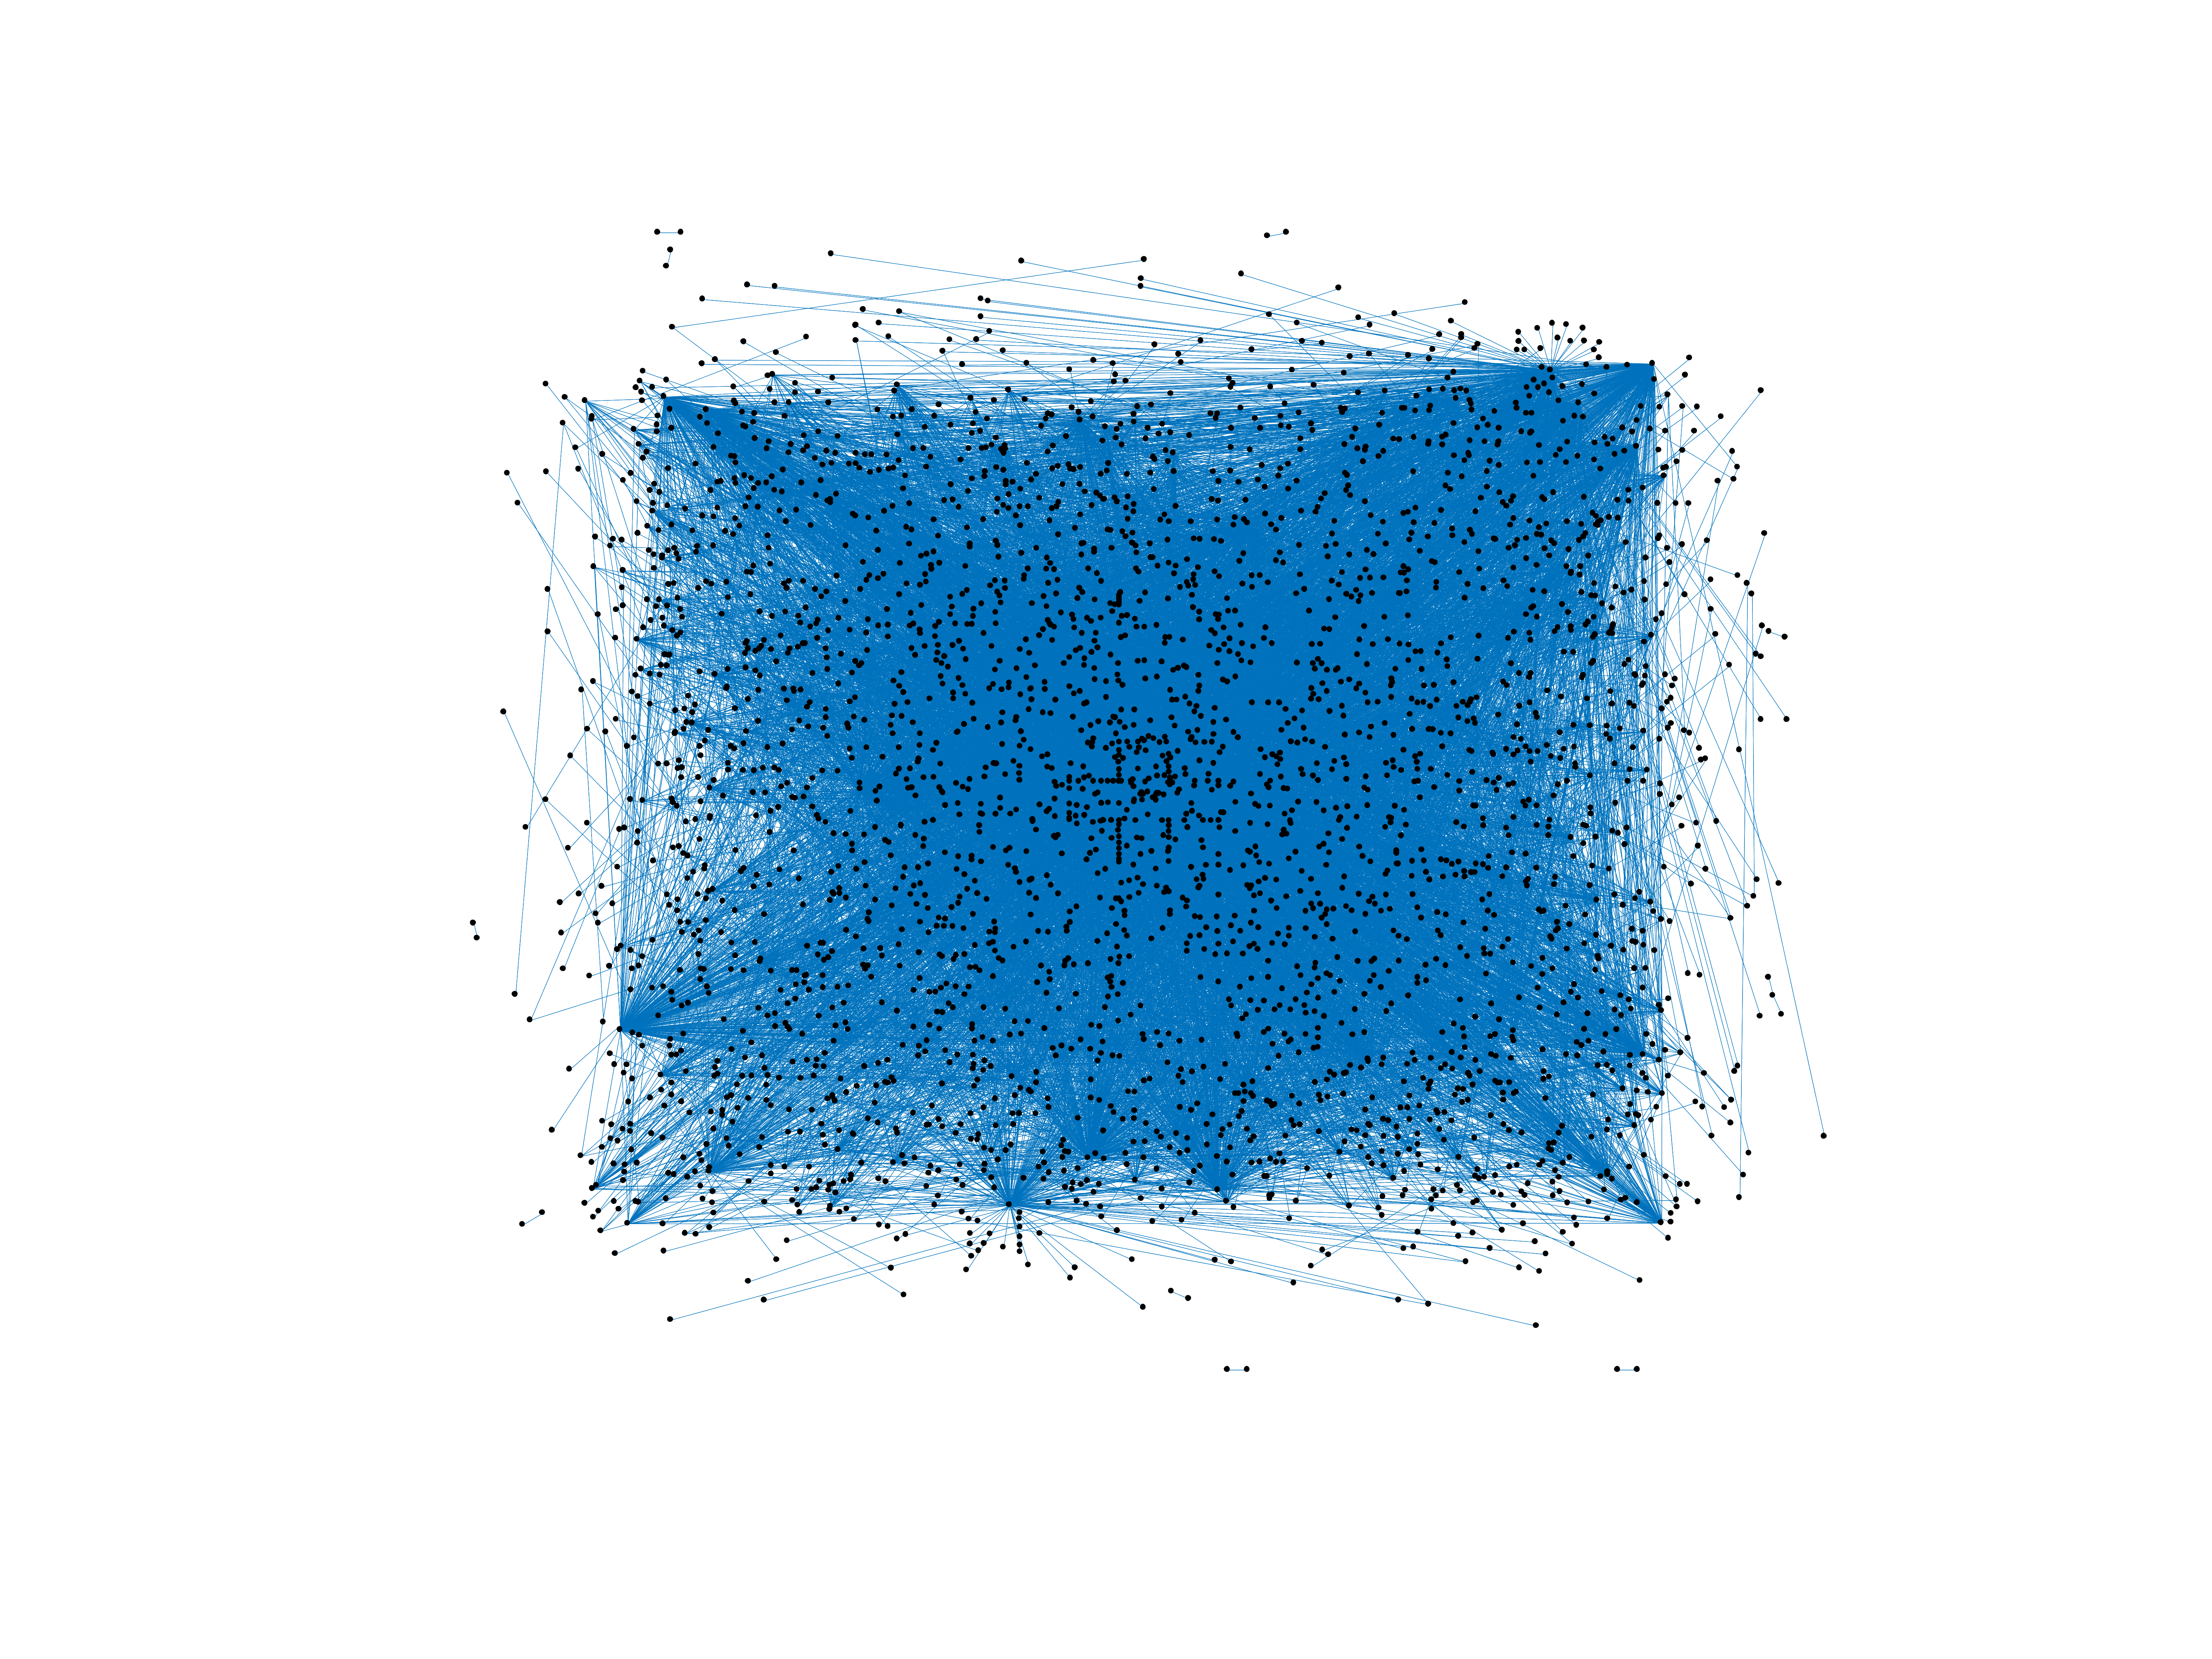
Wikipedia edits (sm)
This is the bipartite edit network of the Samoan Wikipedia. It contains users
and pages from the Samoan Wikipedia, connected by edit events. Each edge
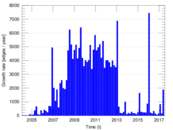
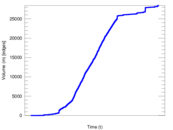
represents an edit. The dataset includes the timestamp of each edit.
Metadata
Statistics
| Size | n = | 3,364
|
| Left size | n1 = | 650
|
| Right size | n2 = | 2,714
|
| Volume | m = | 28,469
|
| Unique edge count | m̿ = | 12,023
|
| Wedge count | s = | 1,211,761
|
| Claw count | z = | 114,529,781
|
| Cross count | x = | 11,447,689,174
|
| Square count | q = | 4,351,173
|
| 4-Tour count | T4 = | 39,687,882
|
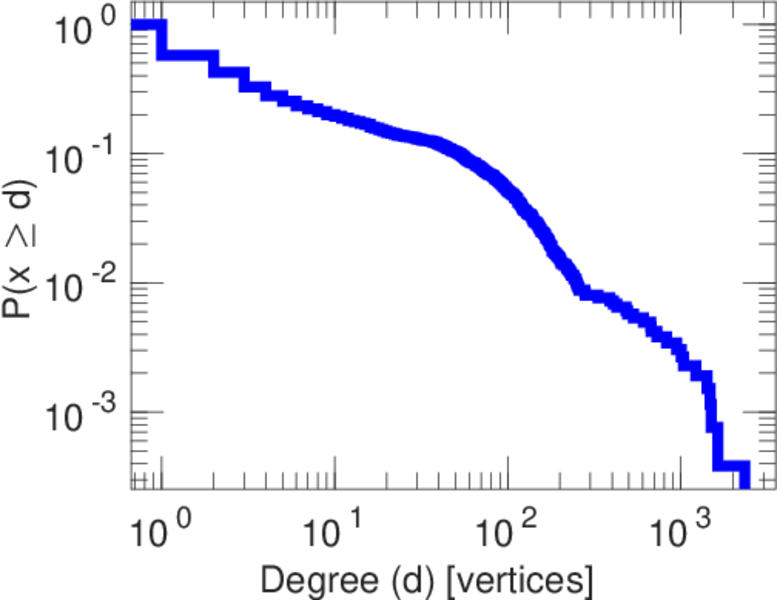
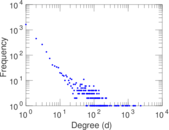
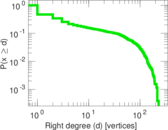
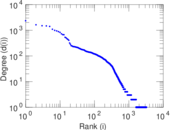
| Maximum degree | dmax = | 2,340
|
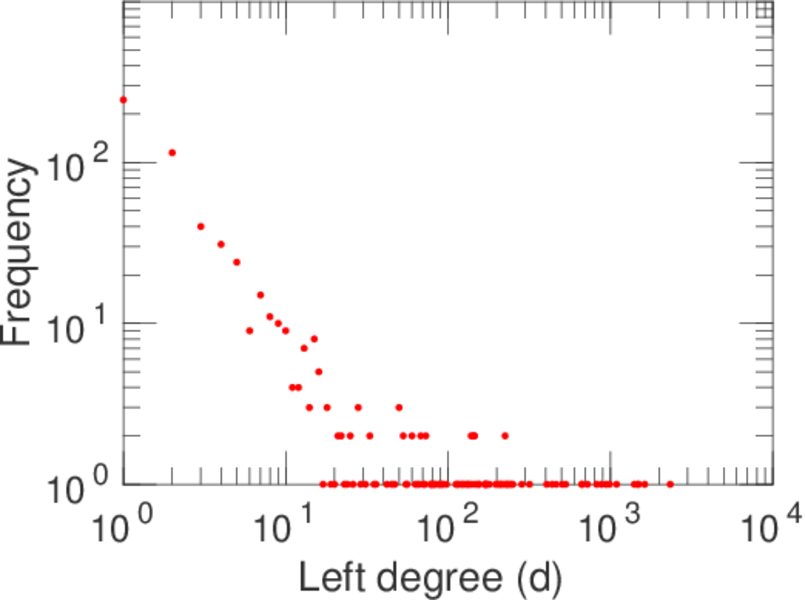
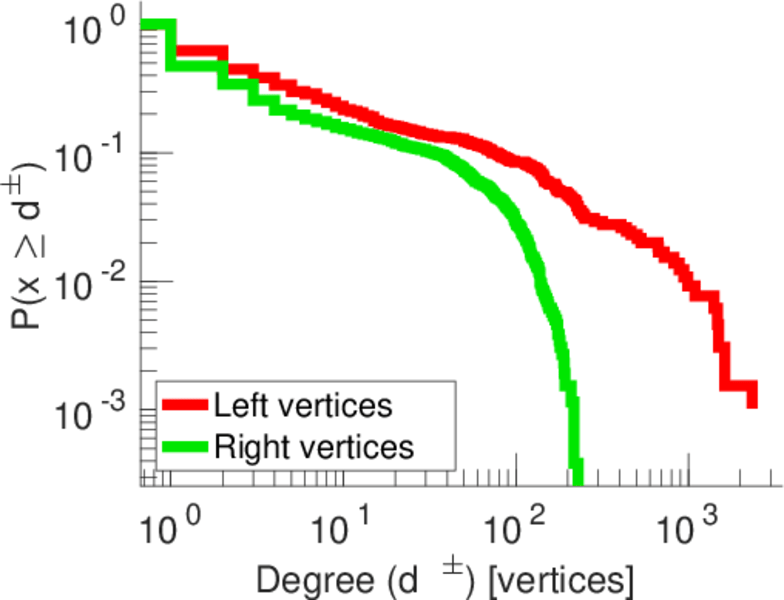
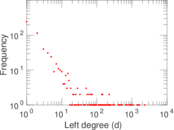
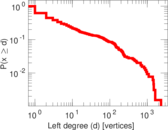
| Maximum left degree | d1max = | 2,340
|
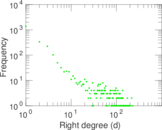
| Maximum right degree | d2max = | 230
|
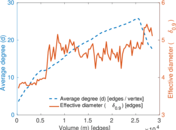
| Average degree | d = | 16.925 7
|
| Average left degree | d1 = | 43.798 5
|
| Average right degree | d2 = | 10.489 7
|
| Fill | p = | 0.006 815 37
|
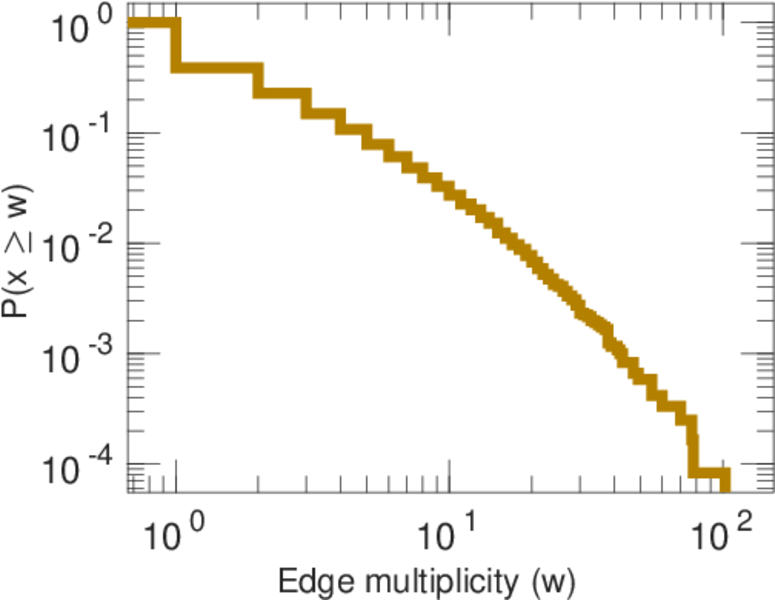
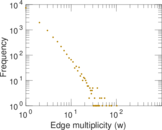
| Average edge multiplicity | m̃ = | 2.367 88
|
| Size of LCC | N = | 2,703
|
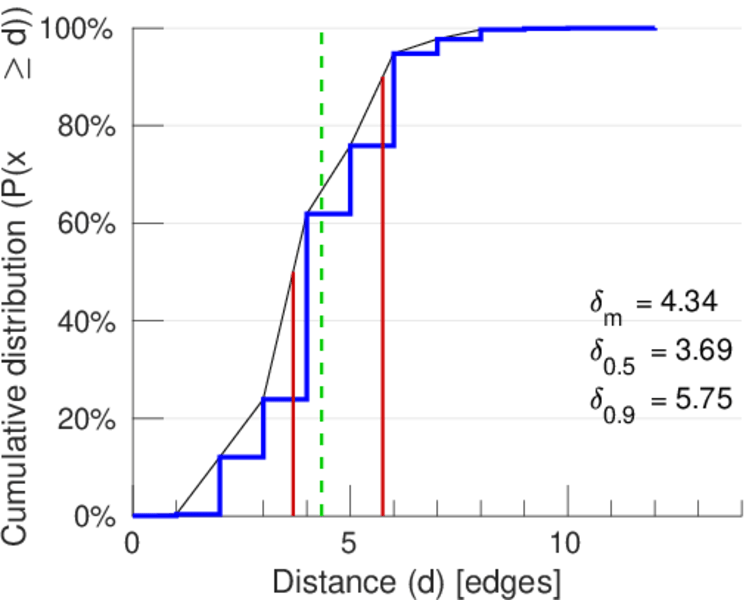
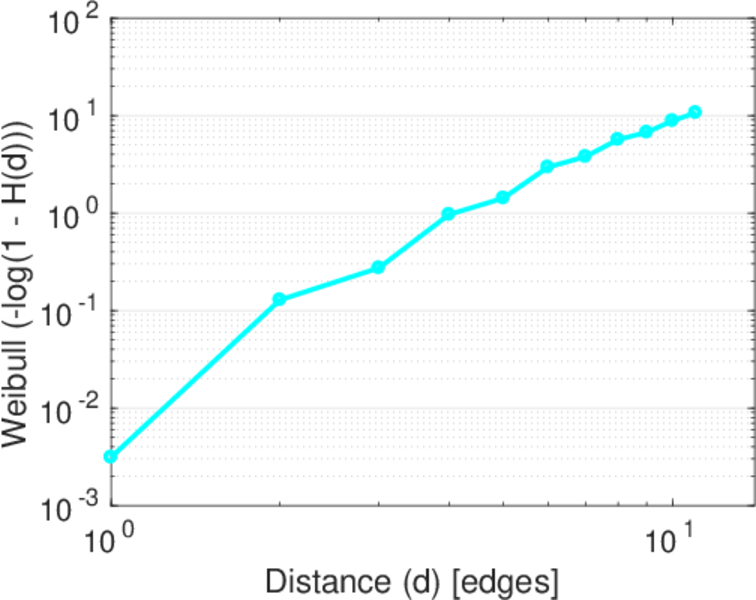
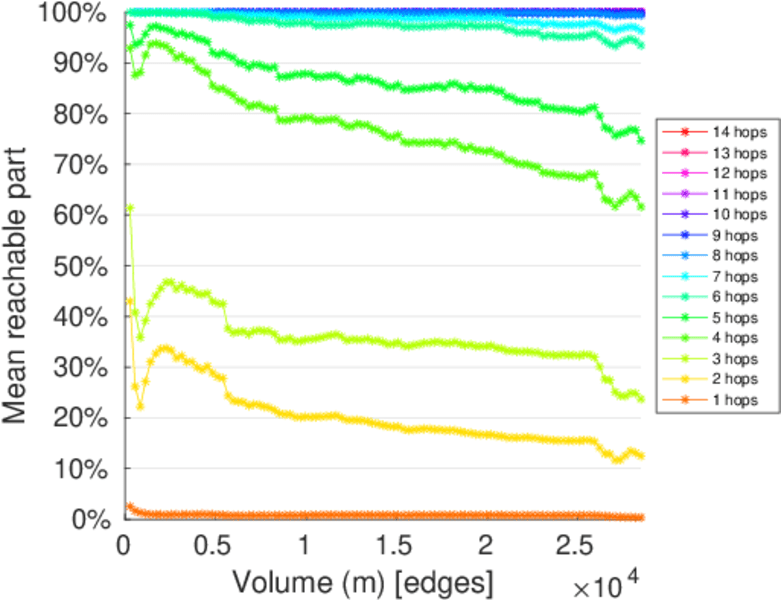
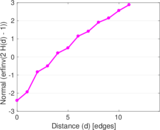
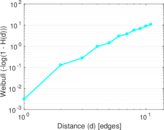
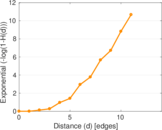
| Diameter | δ = | 14
|
| 50-Percentile effective diameter | δ0.5 = | 3.687 57
|
| 90-Percentile effective diameter | δ0.9 = | 5.747 85
|
| Median distance | δM = | 4
|
| Mean distance | δm = | 4.340 01
|
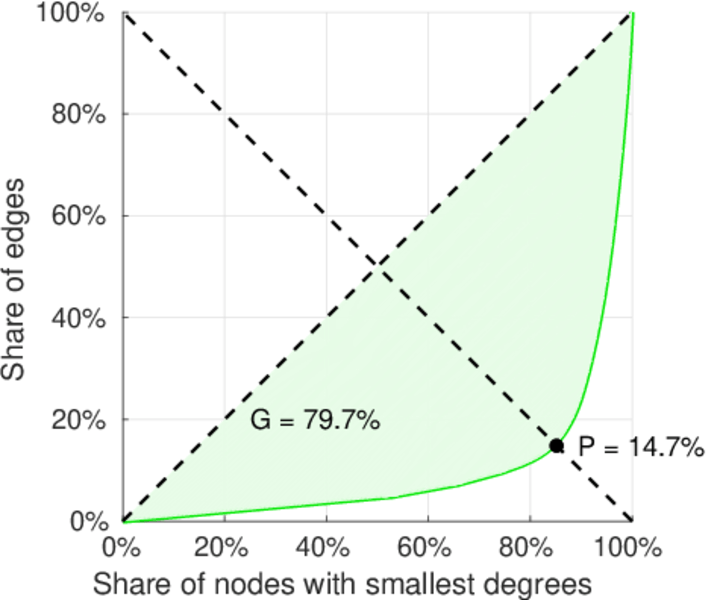
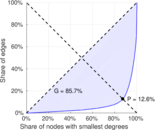
| Gini coefficient | G = | 0.856 255
|
| Balanced inequality ratio | P = | 0.126 717
|
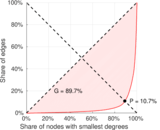
| Left balanced inequality ratio | P1 = | 0.106 783
|
| Right balanced inequality ratio | P2 = | 0.146 861
|
| Relative edge distribution entropy | Her = | 0.803 922
|
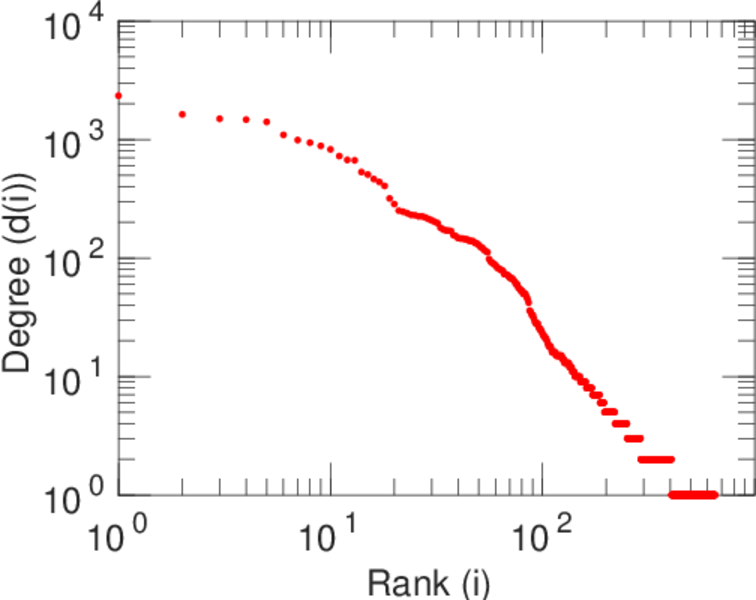
| Power law exponent | γ = | 2.394 61
|
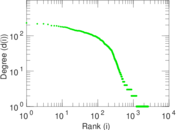
| Tail power law exponent | γt = | 2.471 00
|
| Tail power law exponent with p | γ3 = | 2.471 00
|
| p-value | p = | 0.001 000 00
|
| Left tail power law exponent with p | γ3,1 = | 1.611 00
|
| Left p-value | p1 = | 0.000 00
|
| Right tail power law exponent with p | γ3,2 = | 1.961 00
|
| Right p-value | p2 = | 0.000 00
|
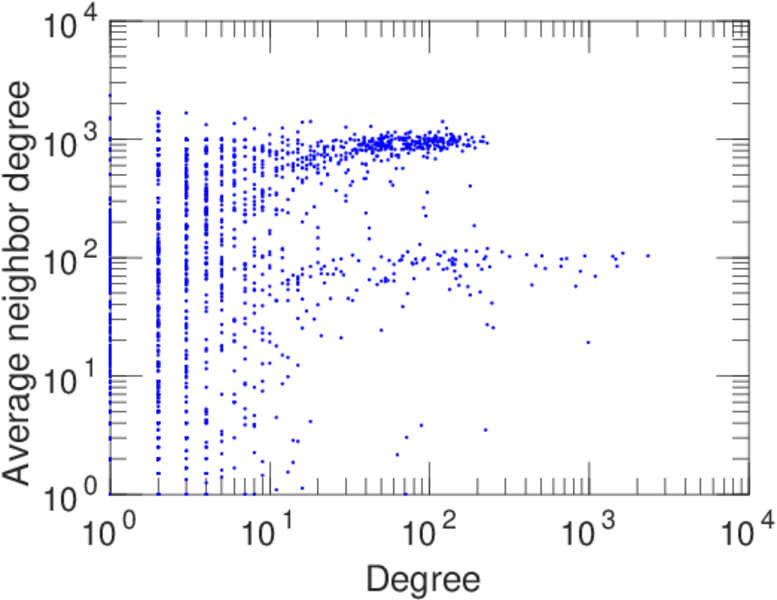
| Degree assortativity | ρ = | −0.161 943
|
| Degree assortativity p-value | pρ = | 1.908 30 × 10−71
|
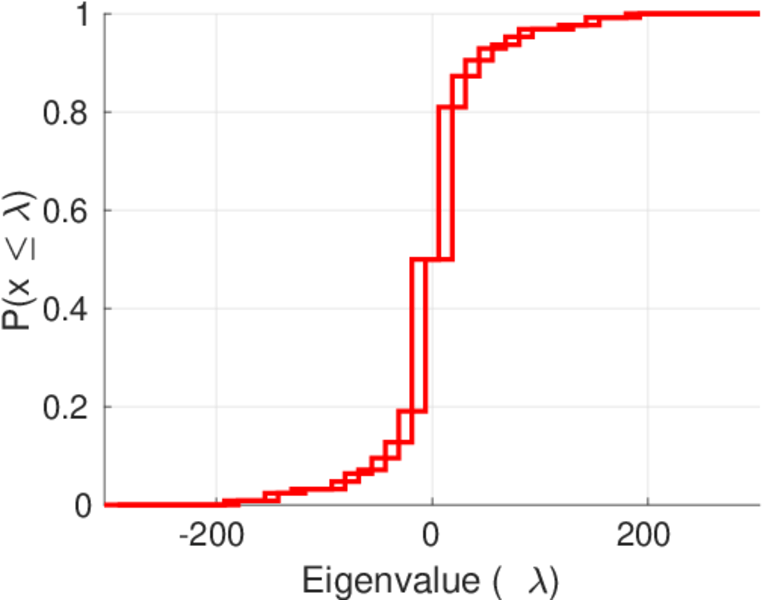
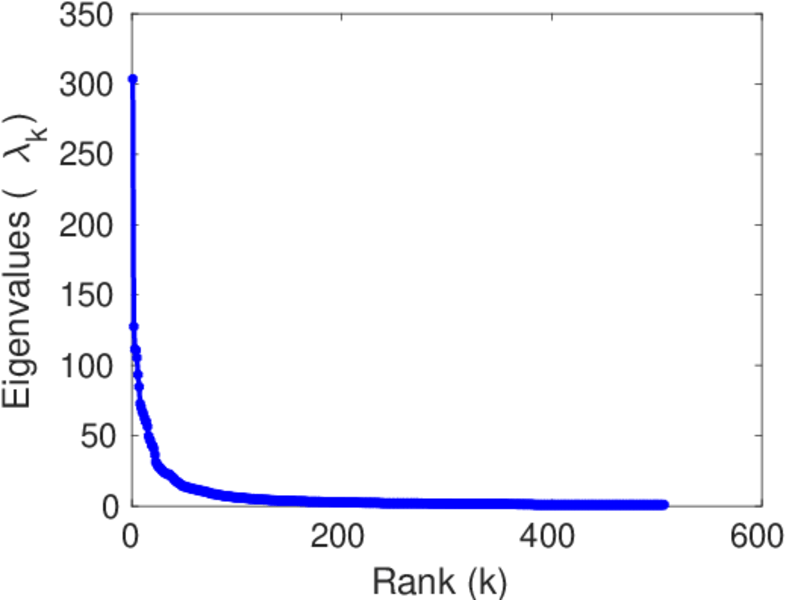
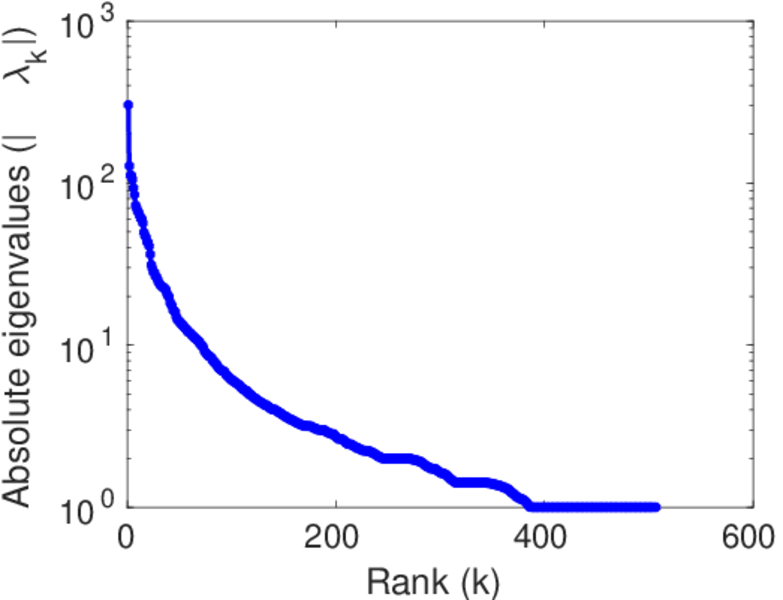
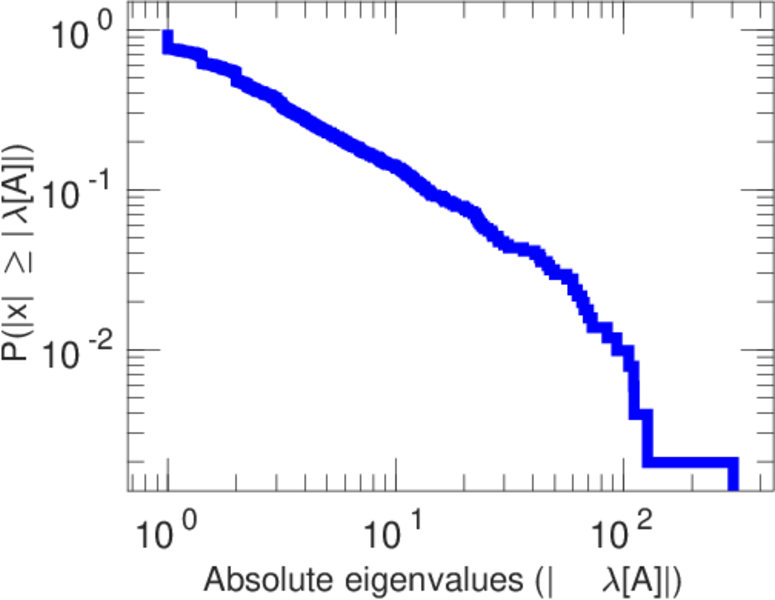
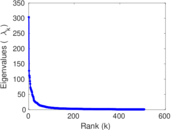
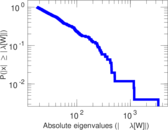
| Spectral norm | α = | 303.557
|
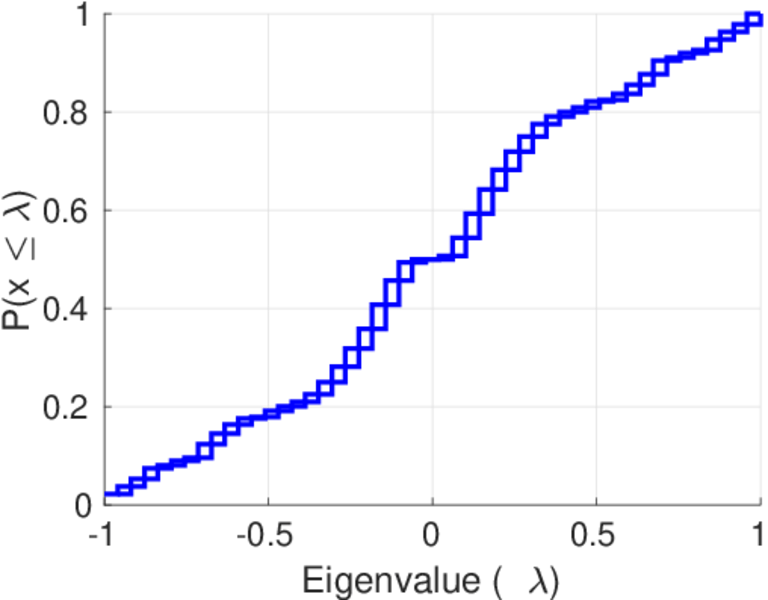
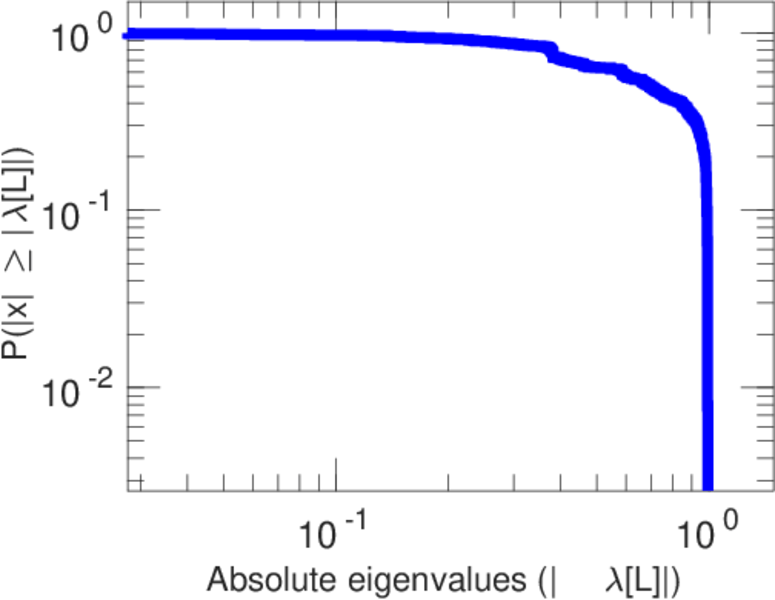
| Algebraic connectivity | a = | 0.027 654 9
|
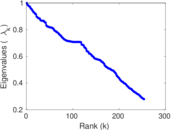
| Spectral separation | |λ1[A] / λ2[A]| = | 2.379 15
|
| Controllability | C = | 2,035
|
| Relative controllability | Cr = | 0.626 347
|
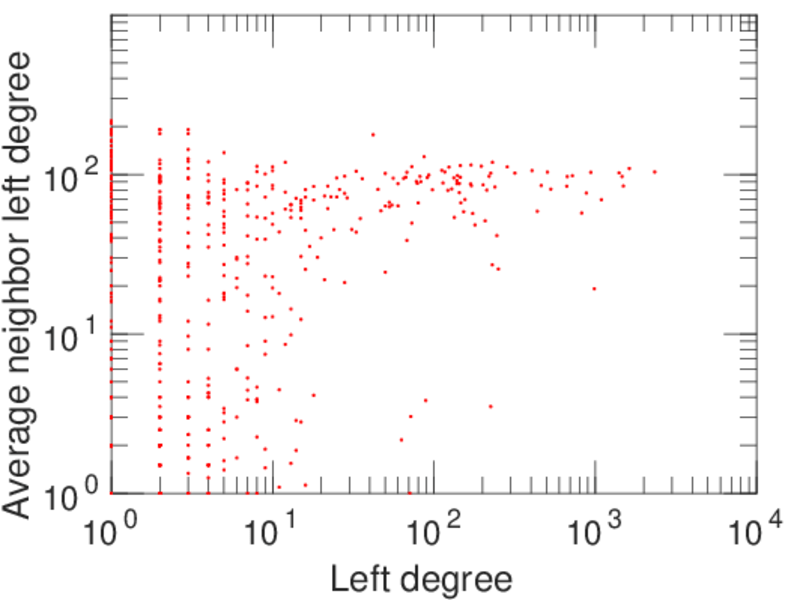
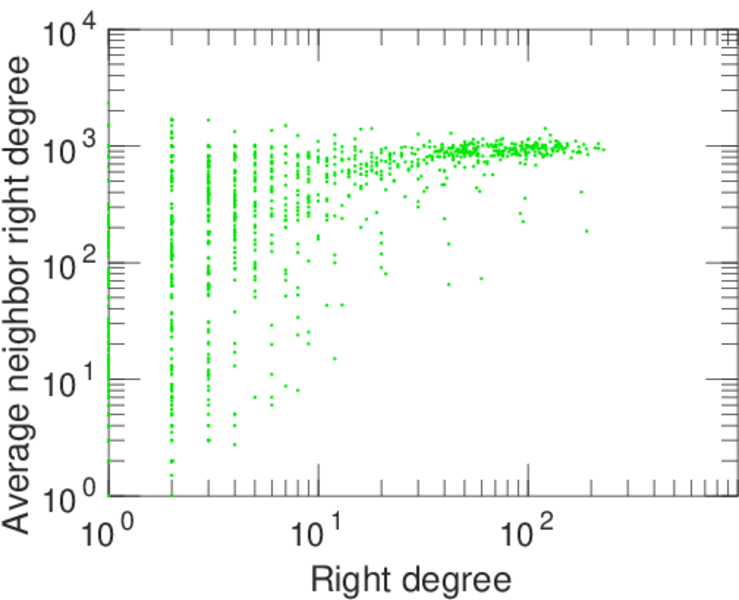
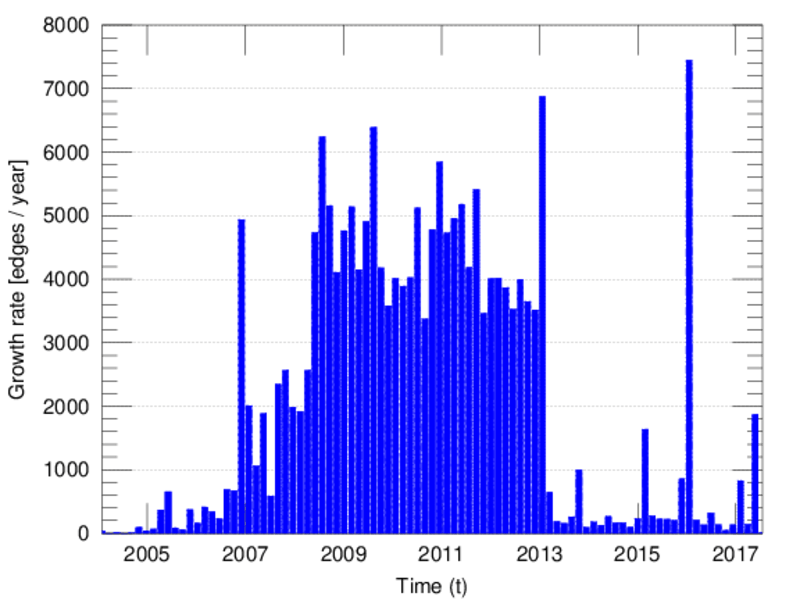
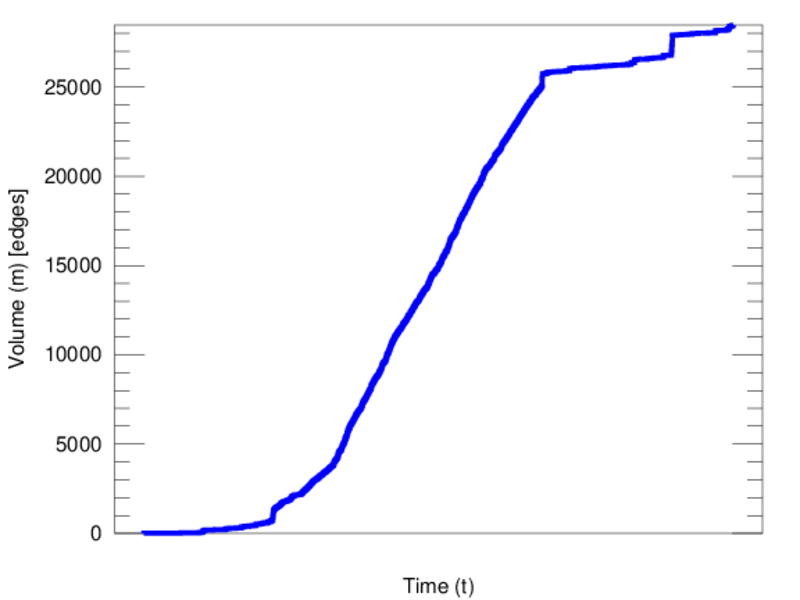
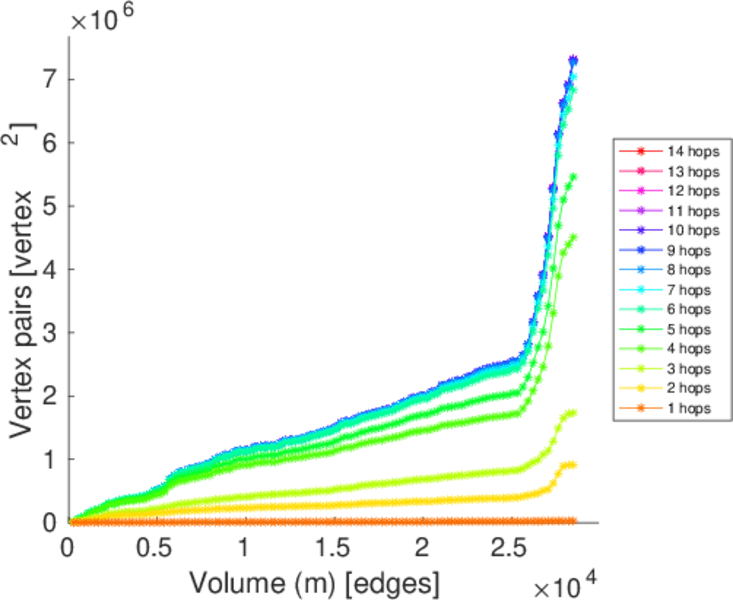
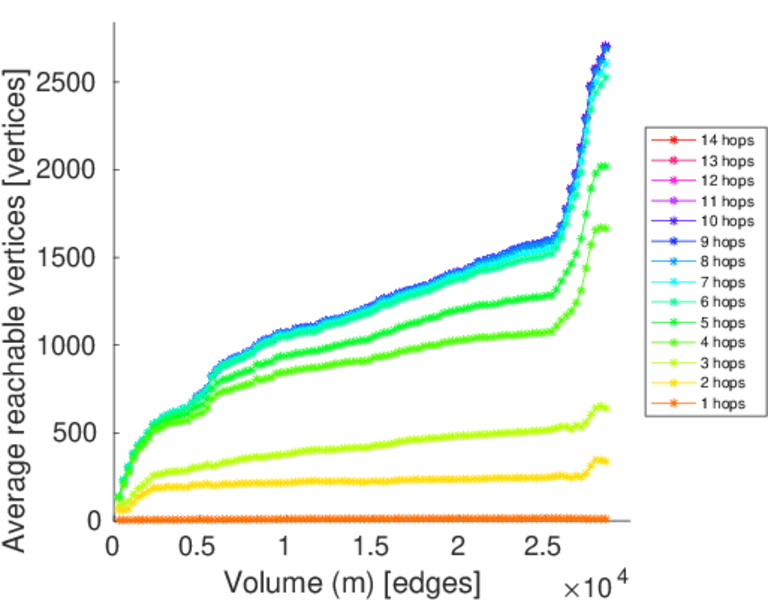
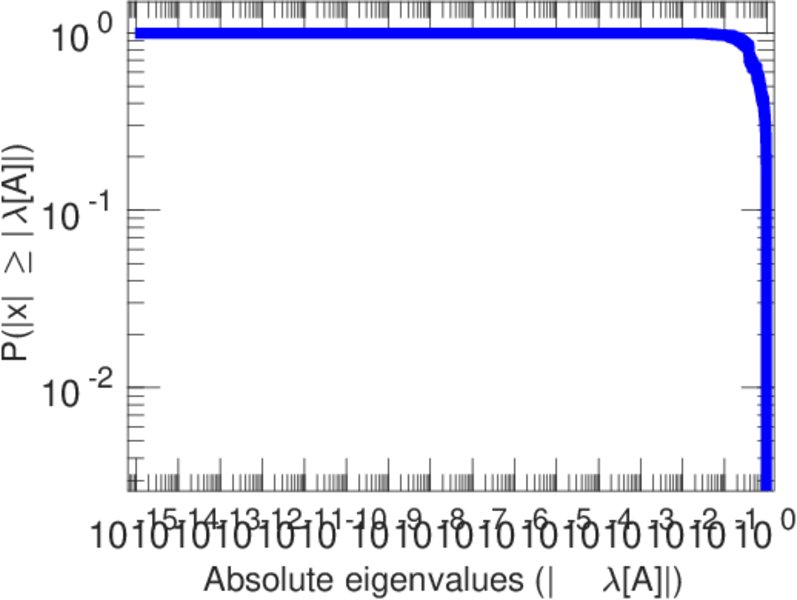
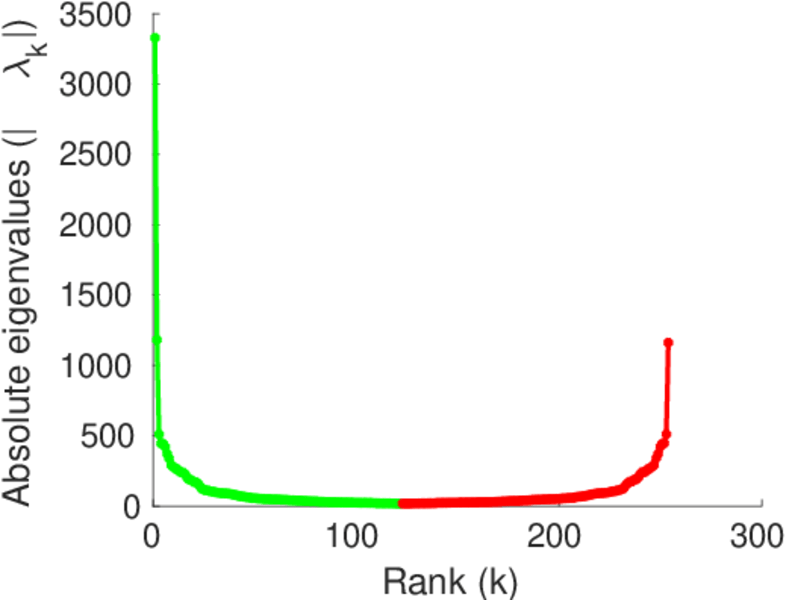
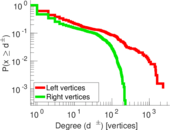
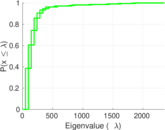
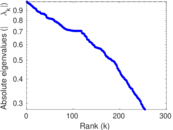
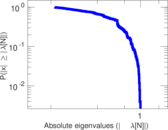
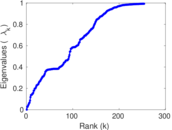
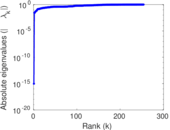
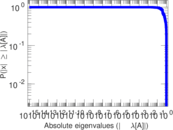
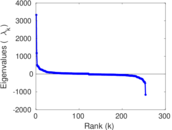
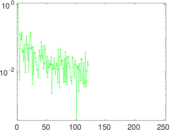
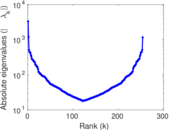
Plots


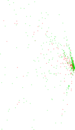
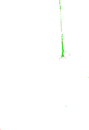
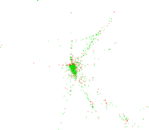


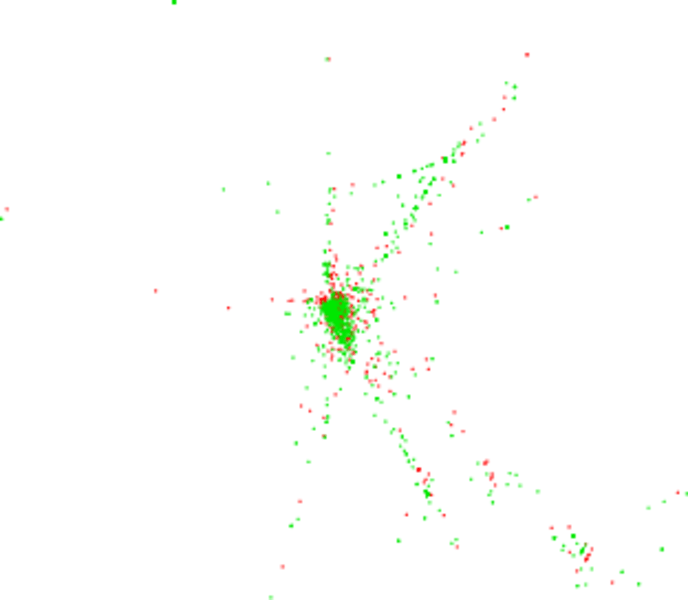
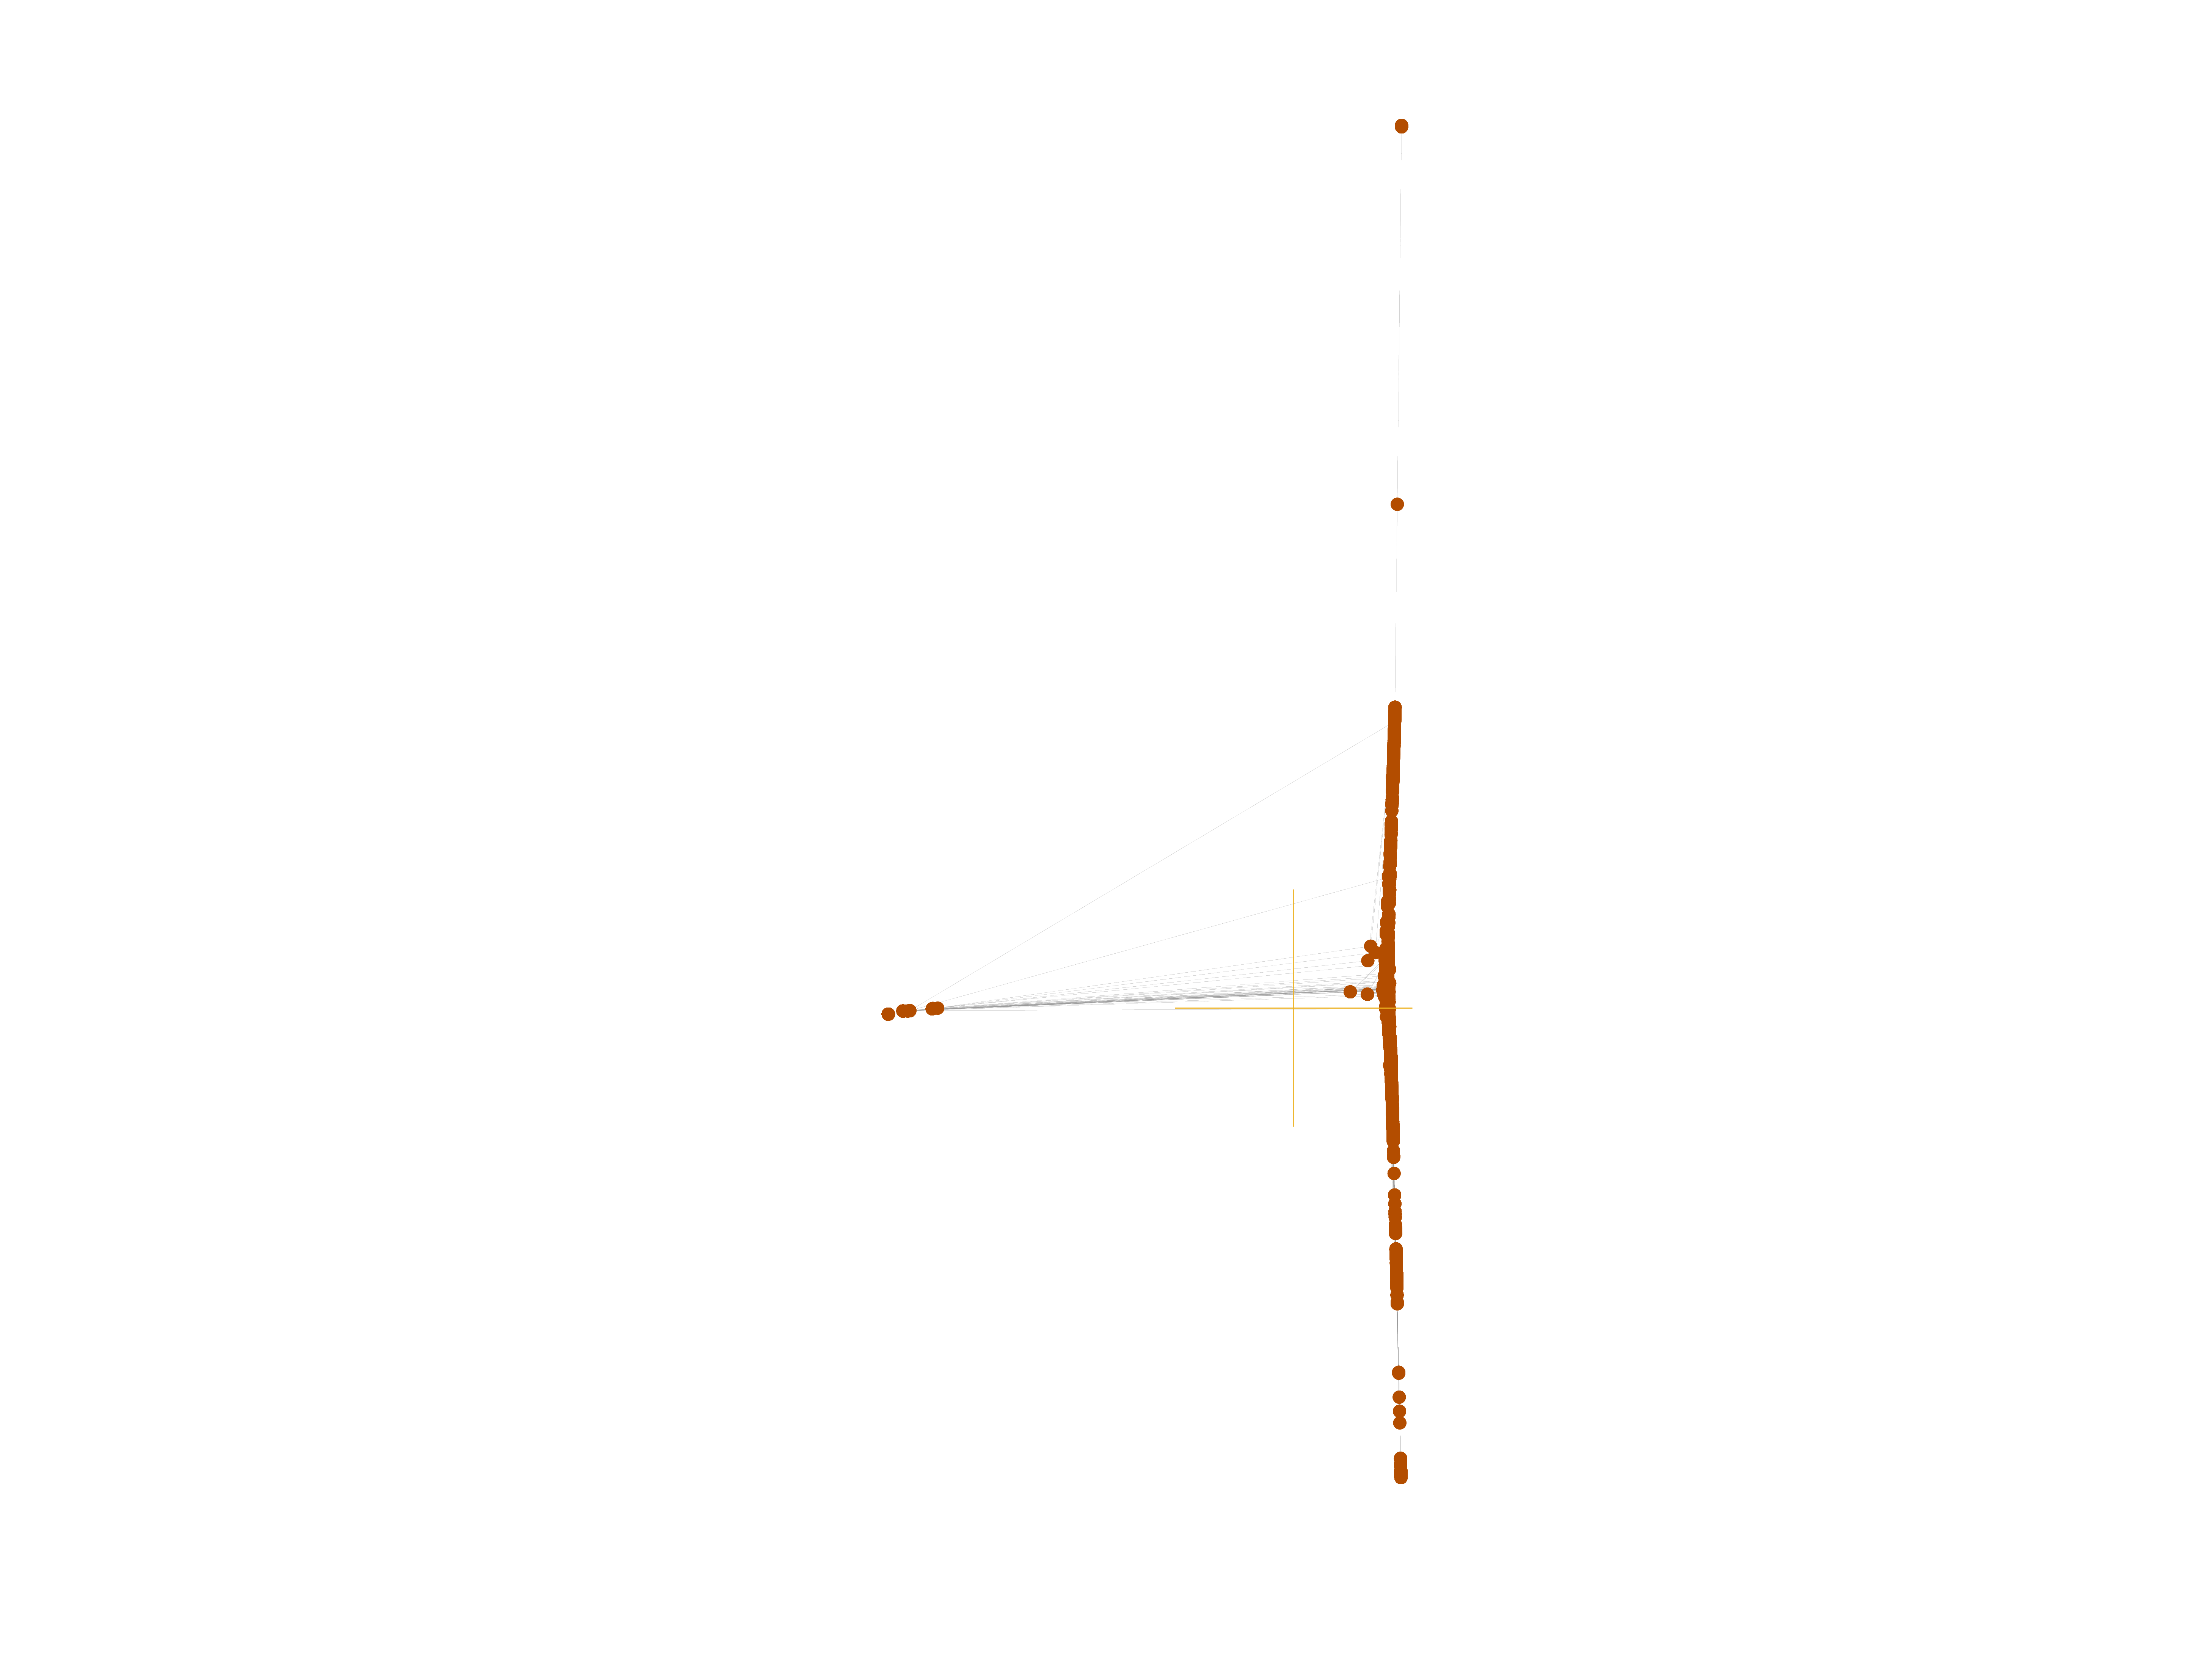
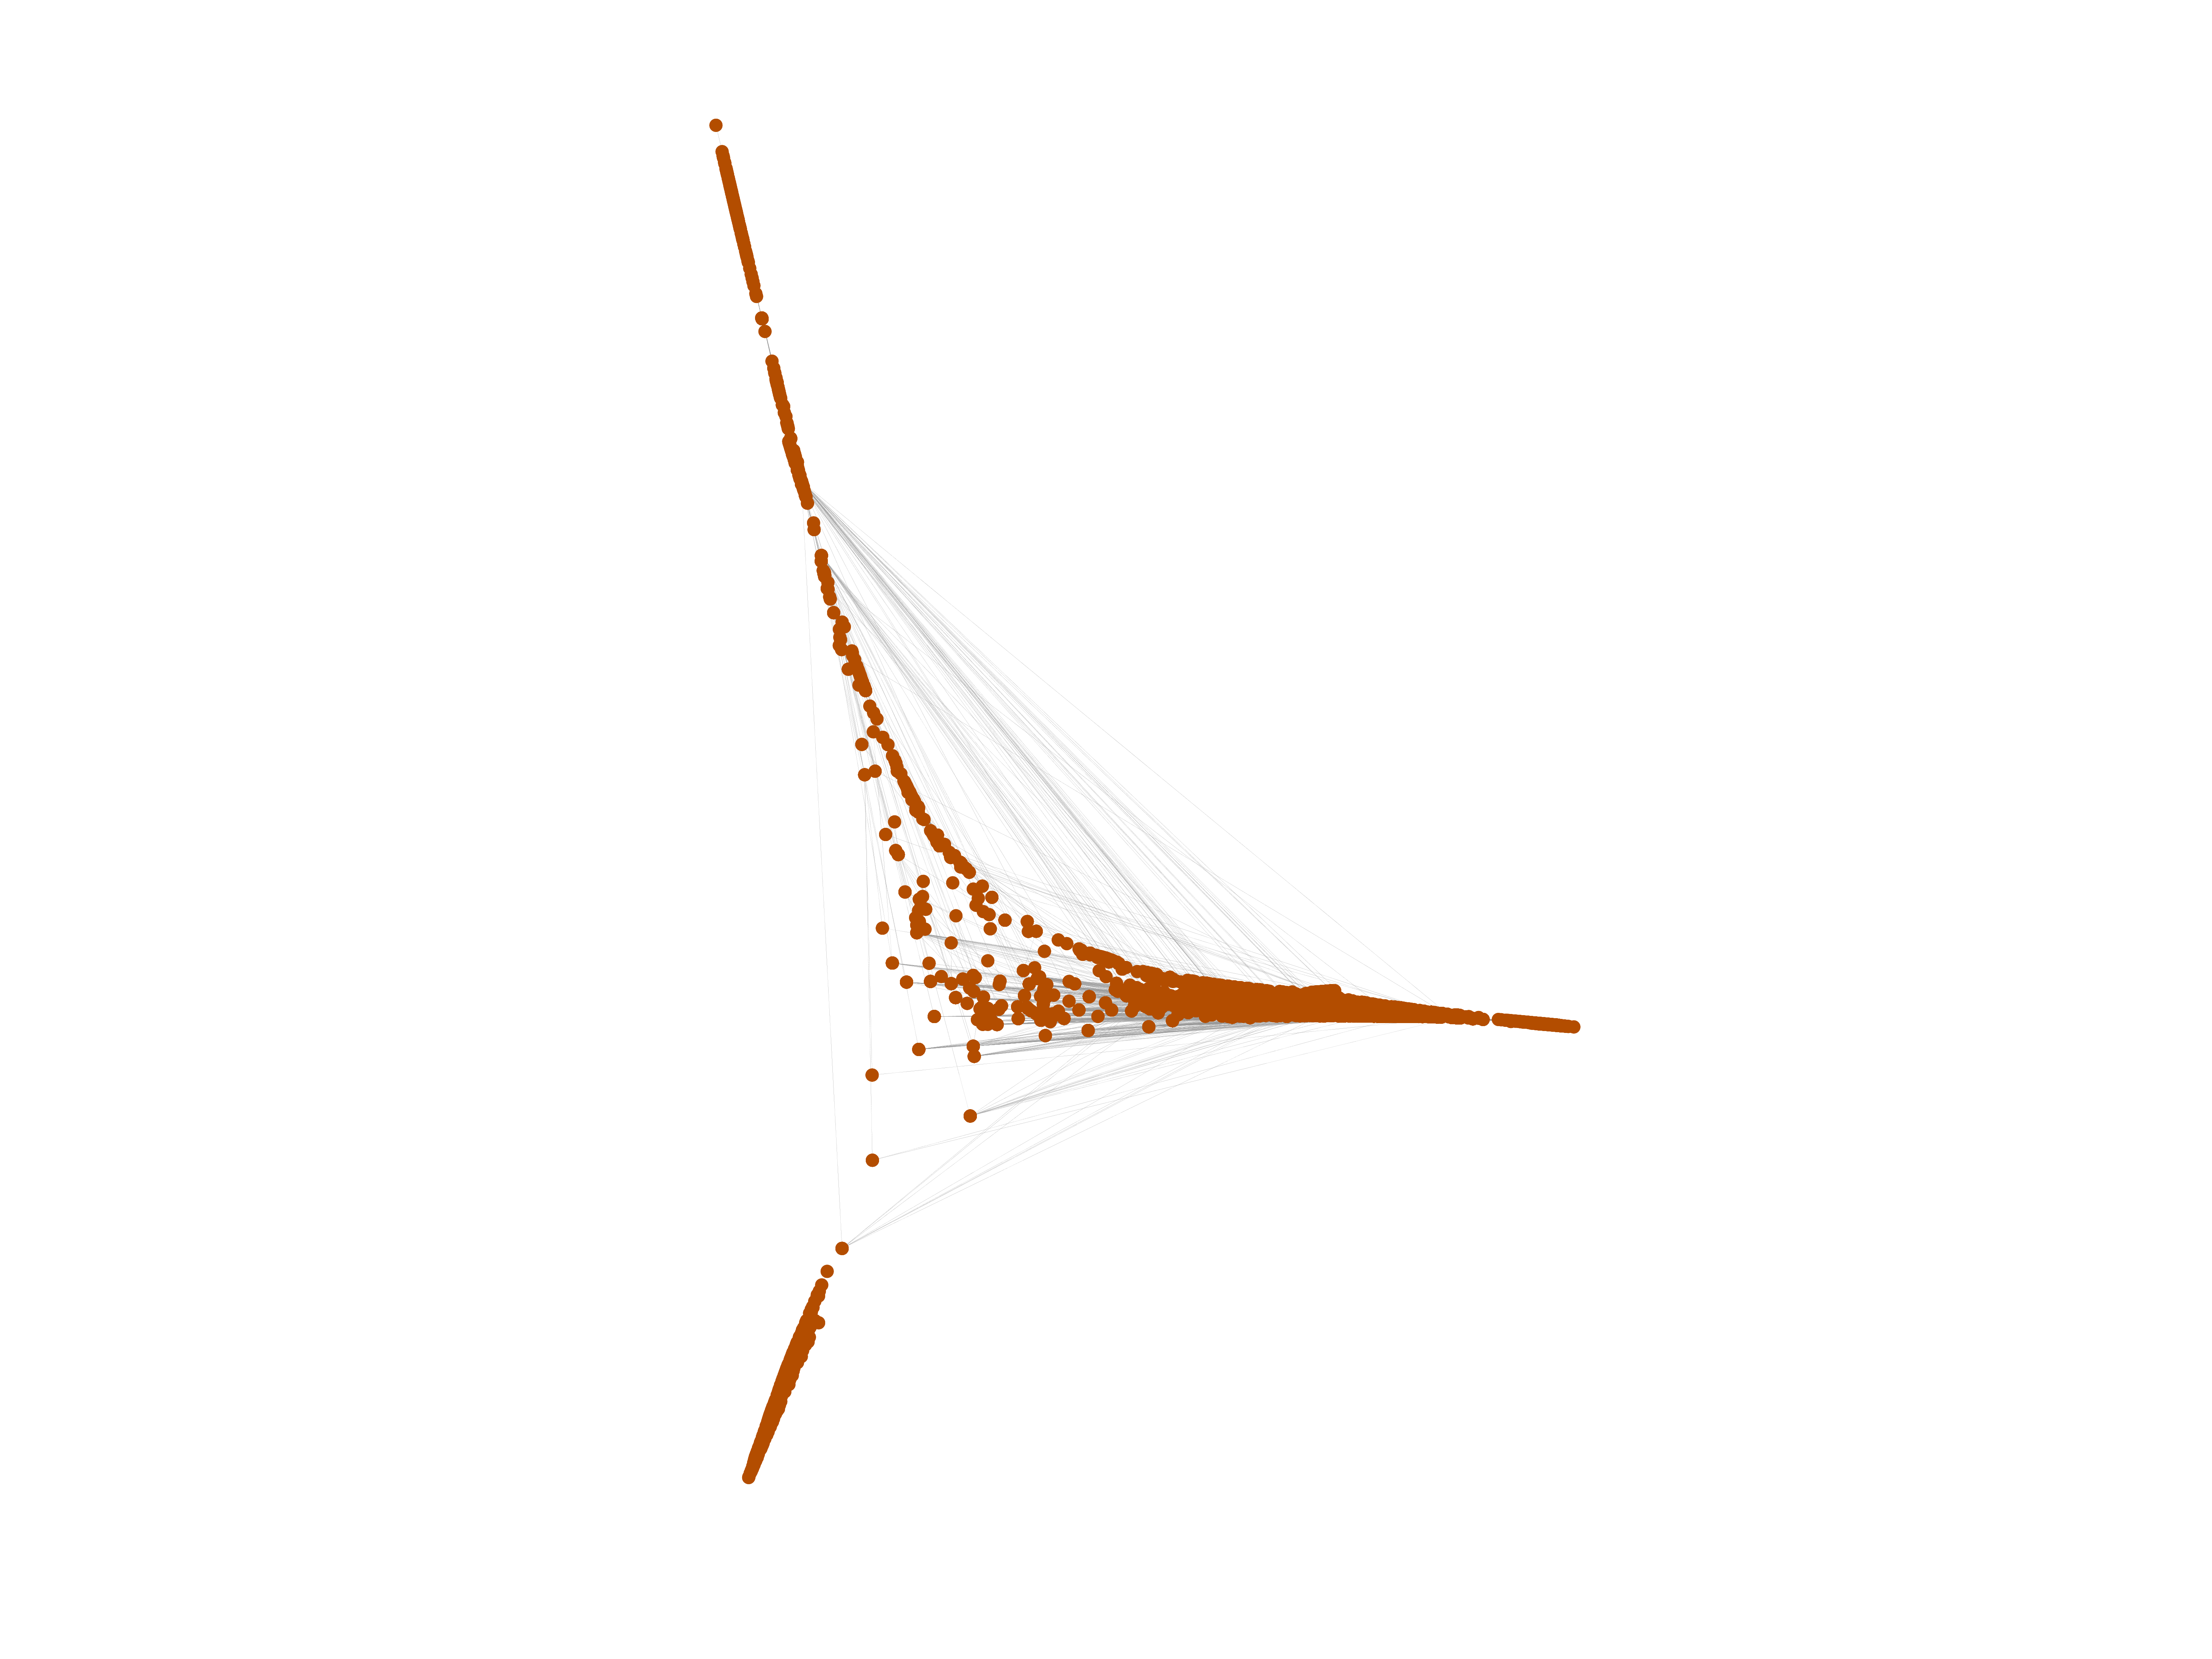
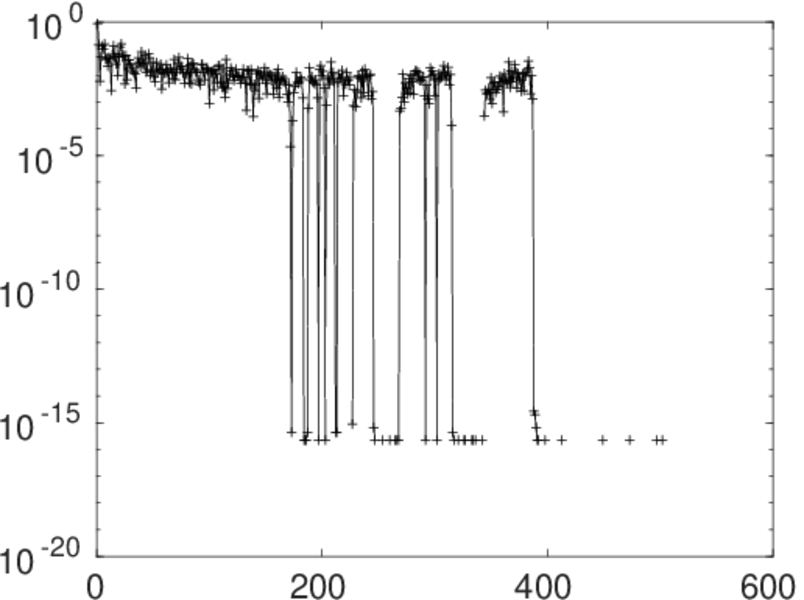
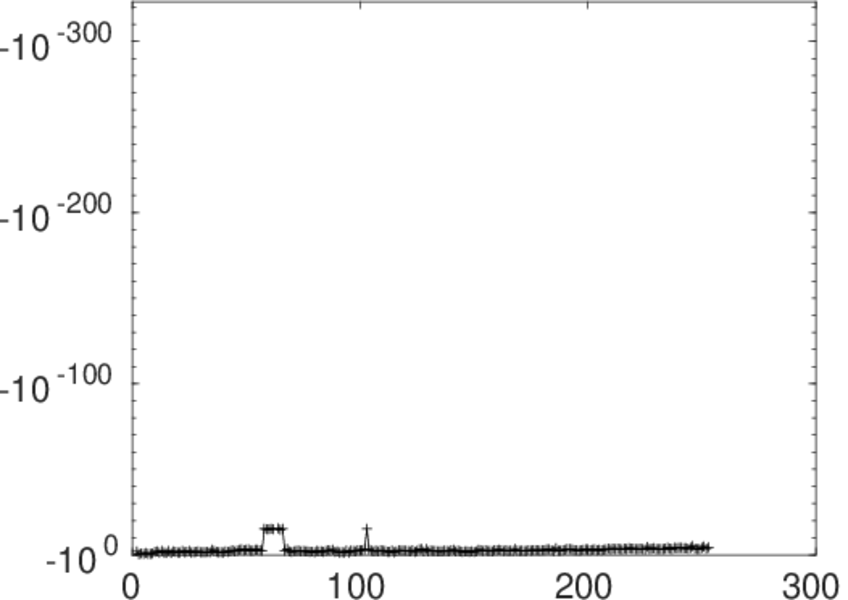
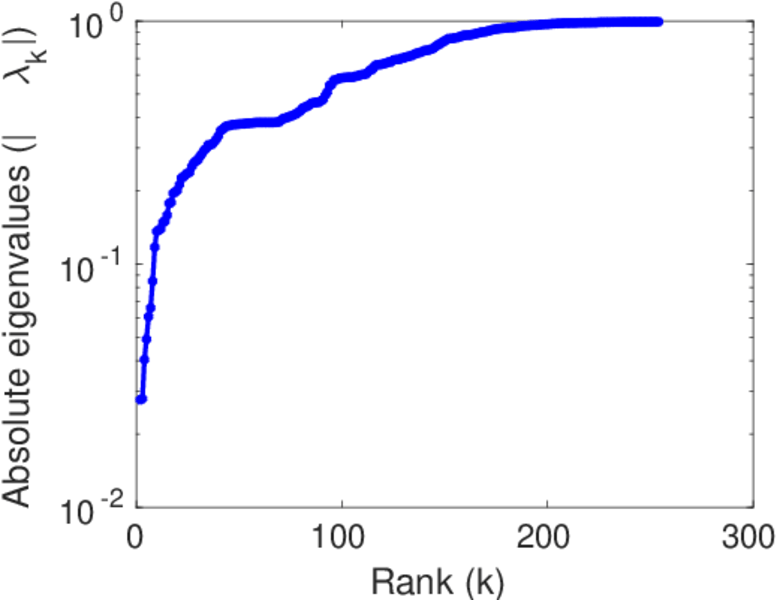
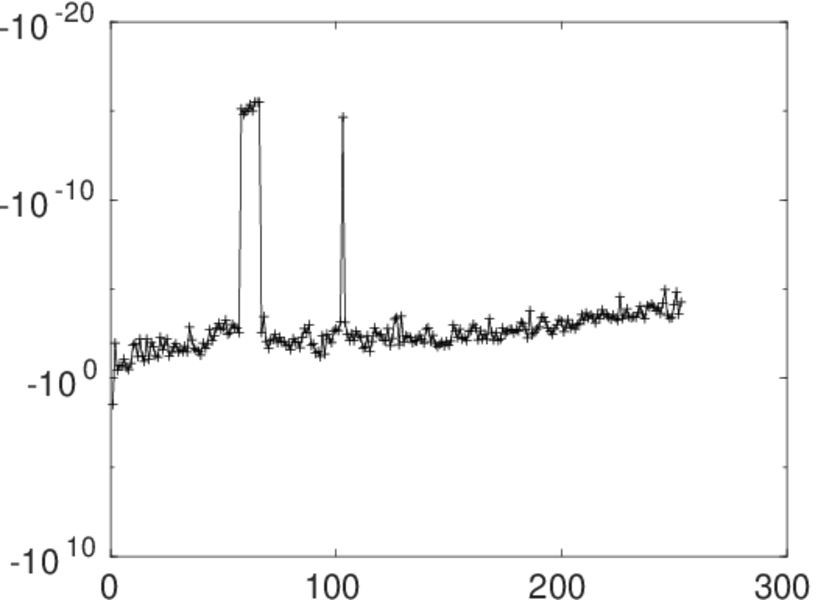
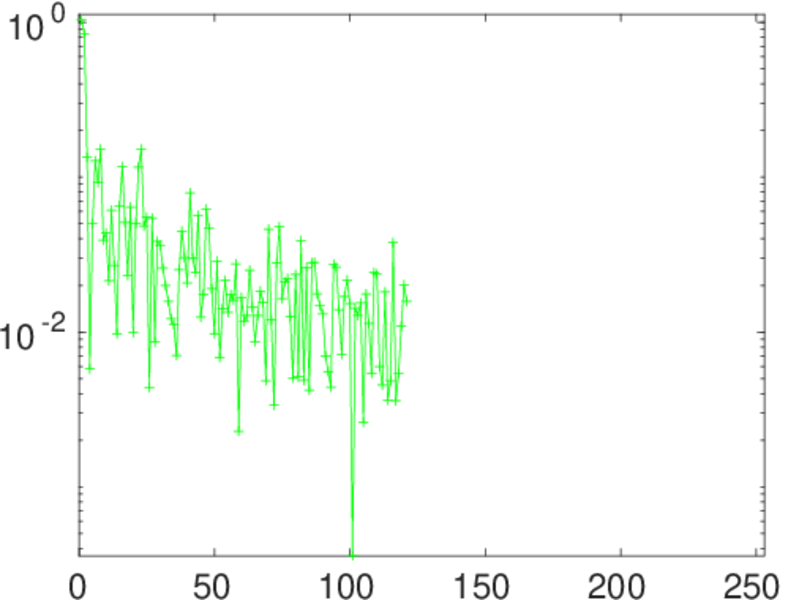
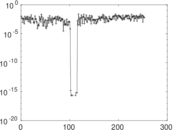
Matrix decompositions plots


Downloads
References
|
[1]
|
Jérôme Kunegis.
KONECT – The Koblenz Network Collection.
In Proc. Int. Conf. on World Wide Web Companion, pages
1343–1350, 2013.
[ http ]
|
|
[2]
|
Wikimedia Foundation.
Wikimedia downloads.
http://dumps.wikimedia.org/, January 2010.
|
 KONECT ‣ Networks ‣
Buy Me a Coffee
KONECT ‣ Networks ‣
Buy Me a Coffee