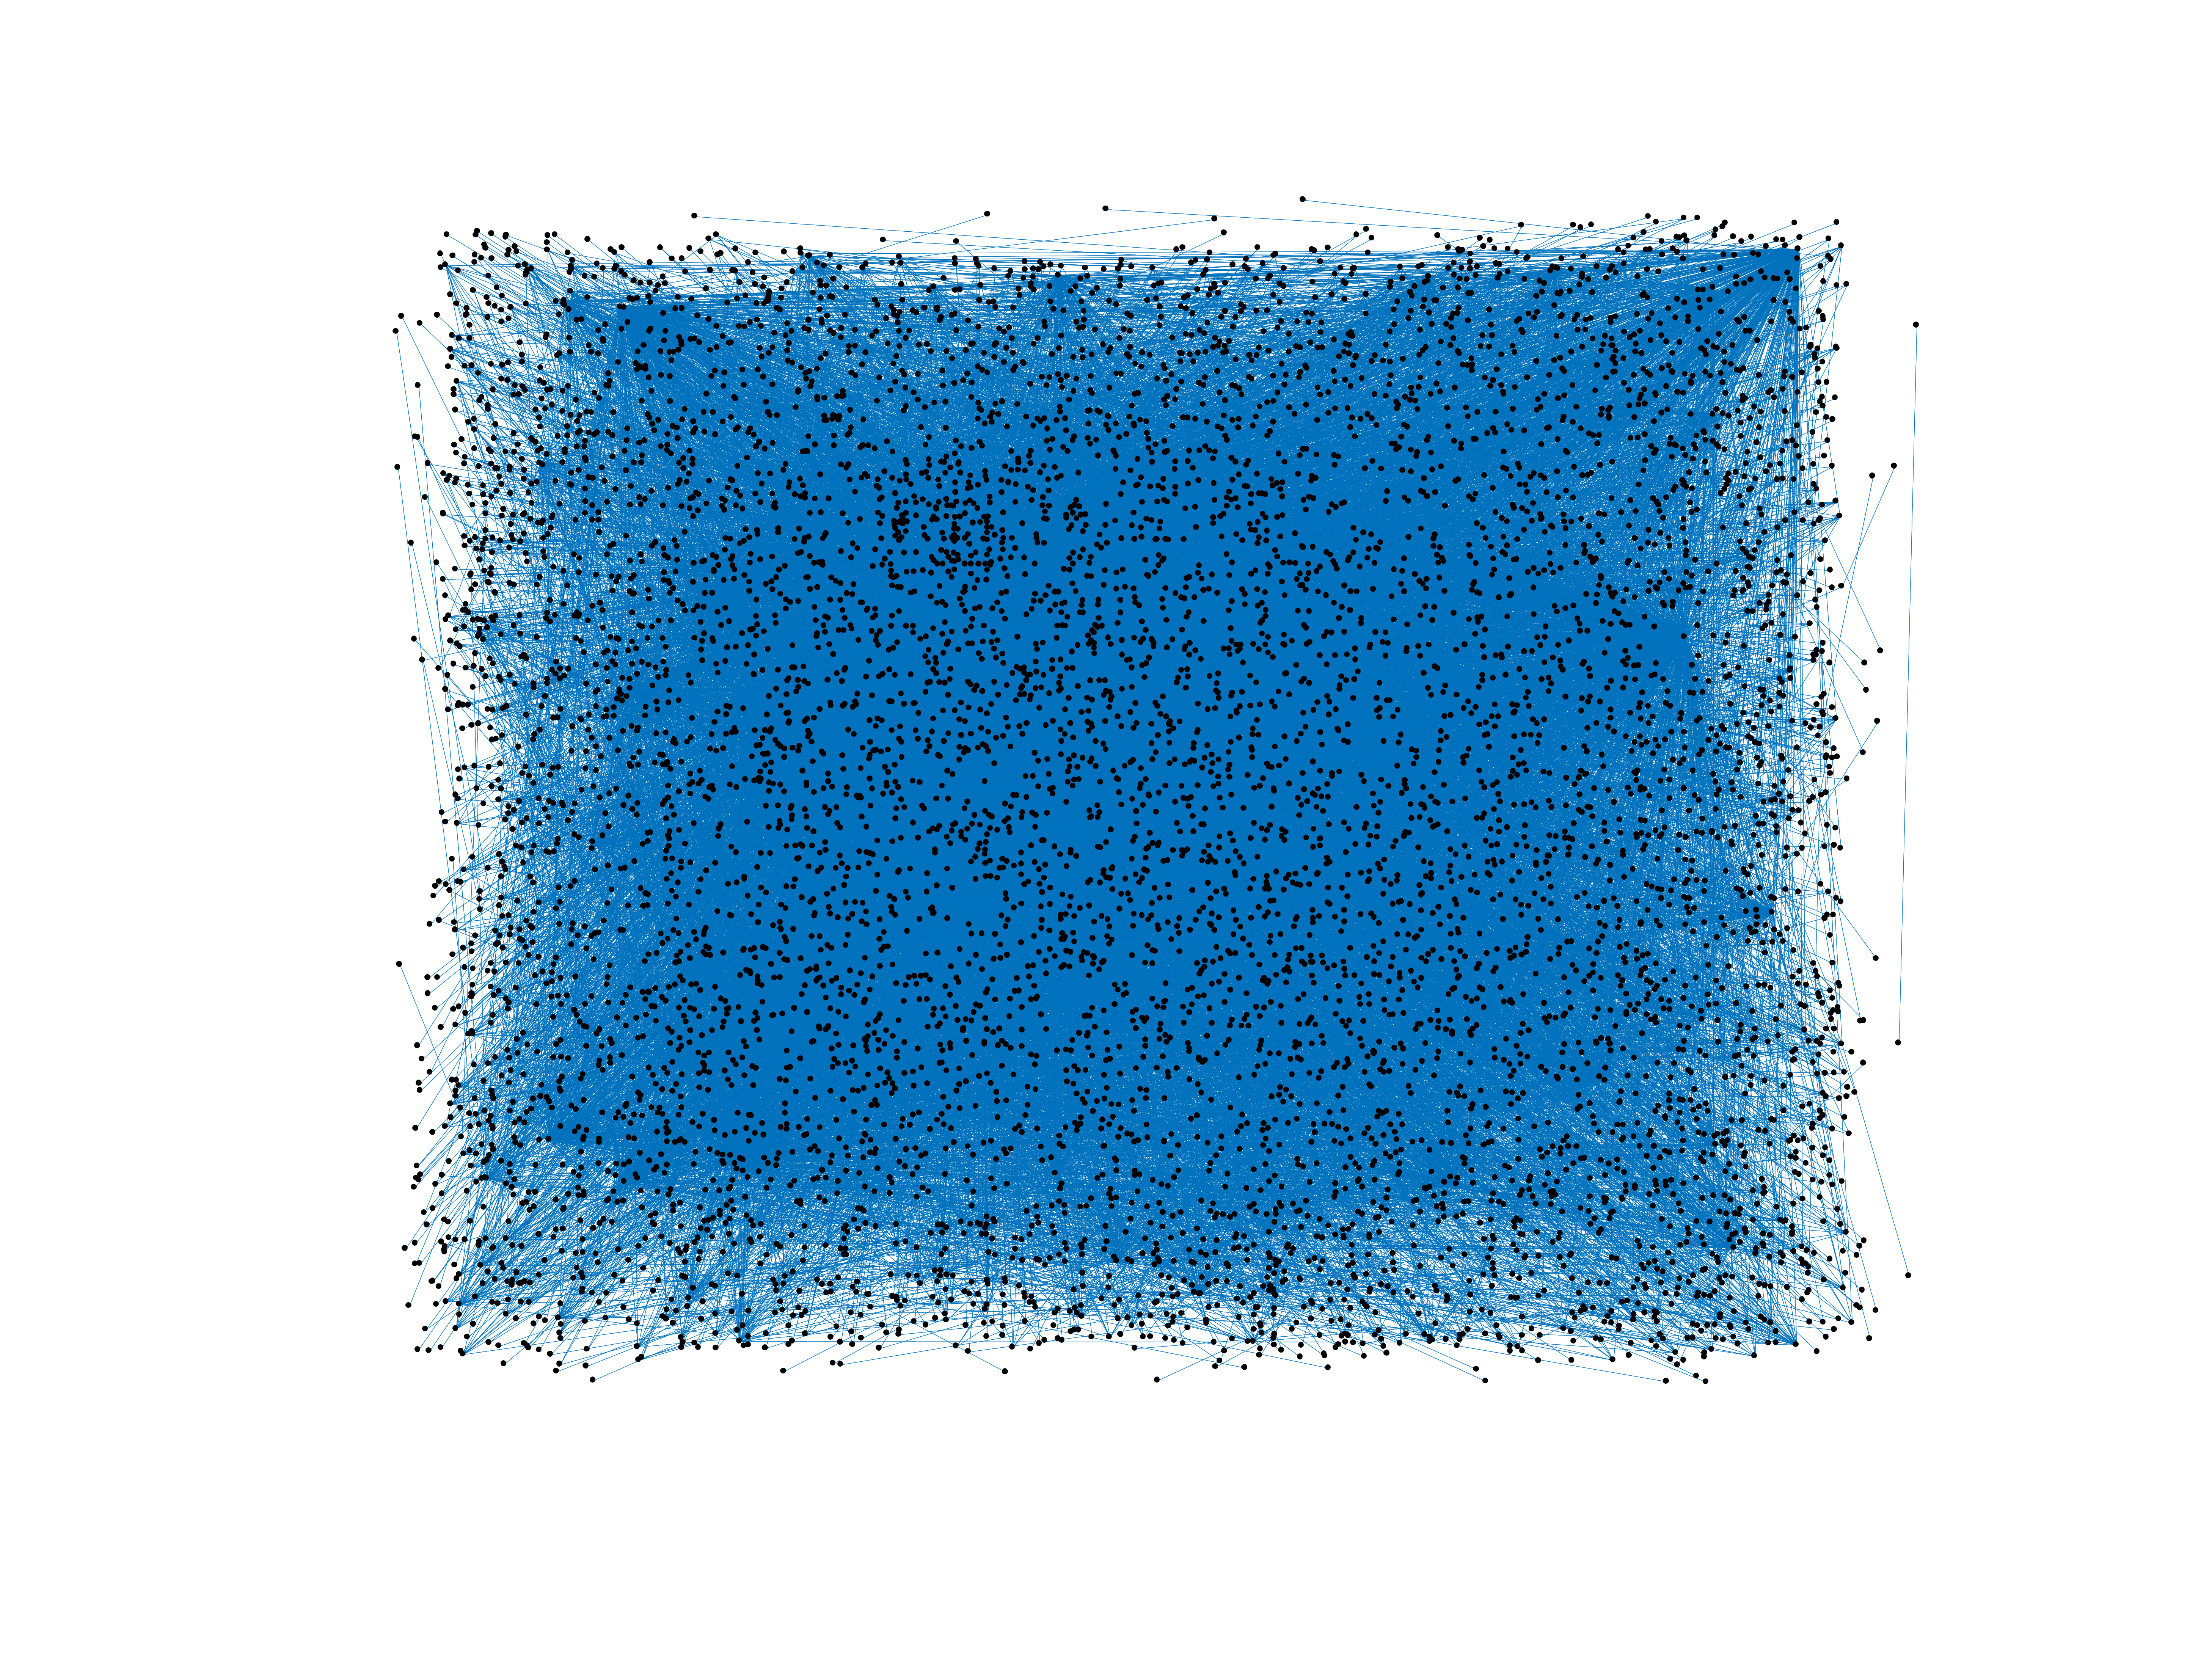
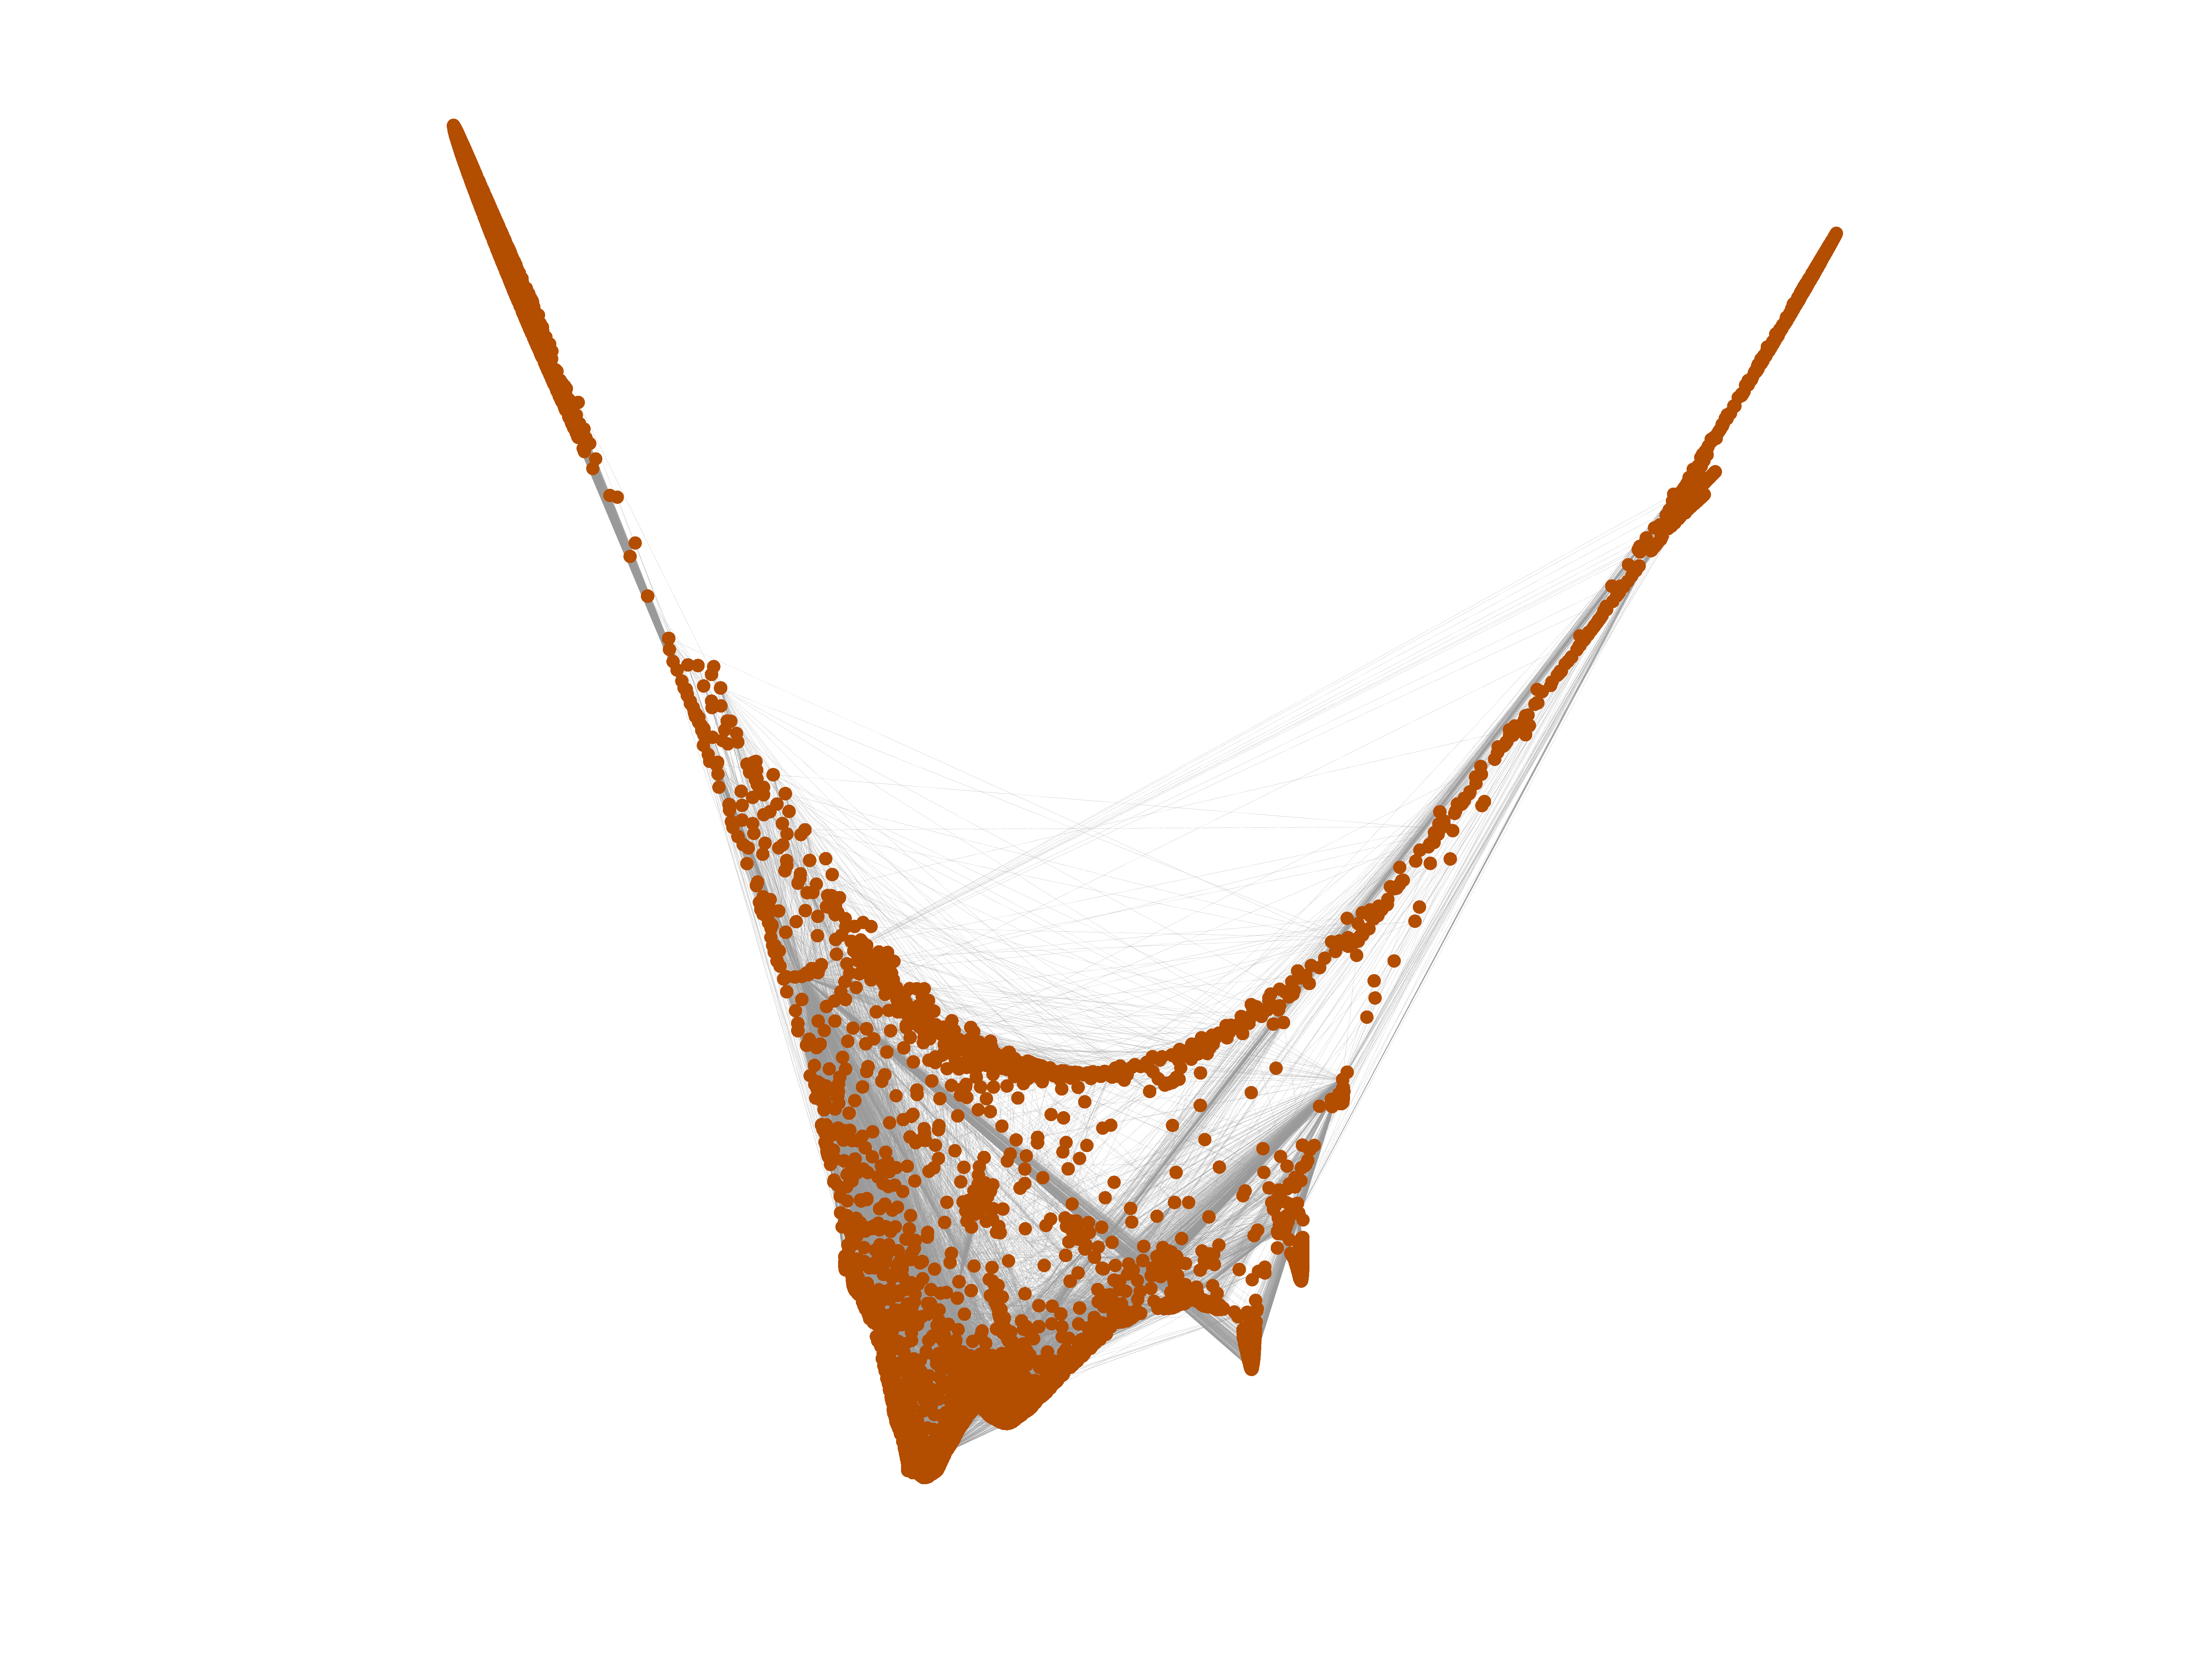
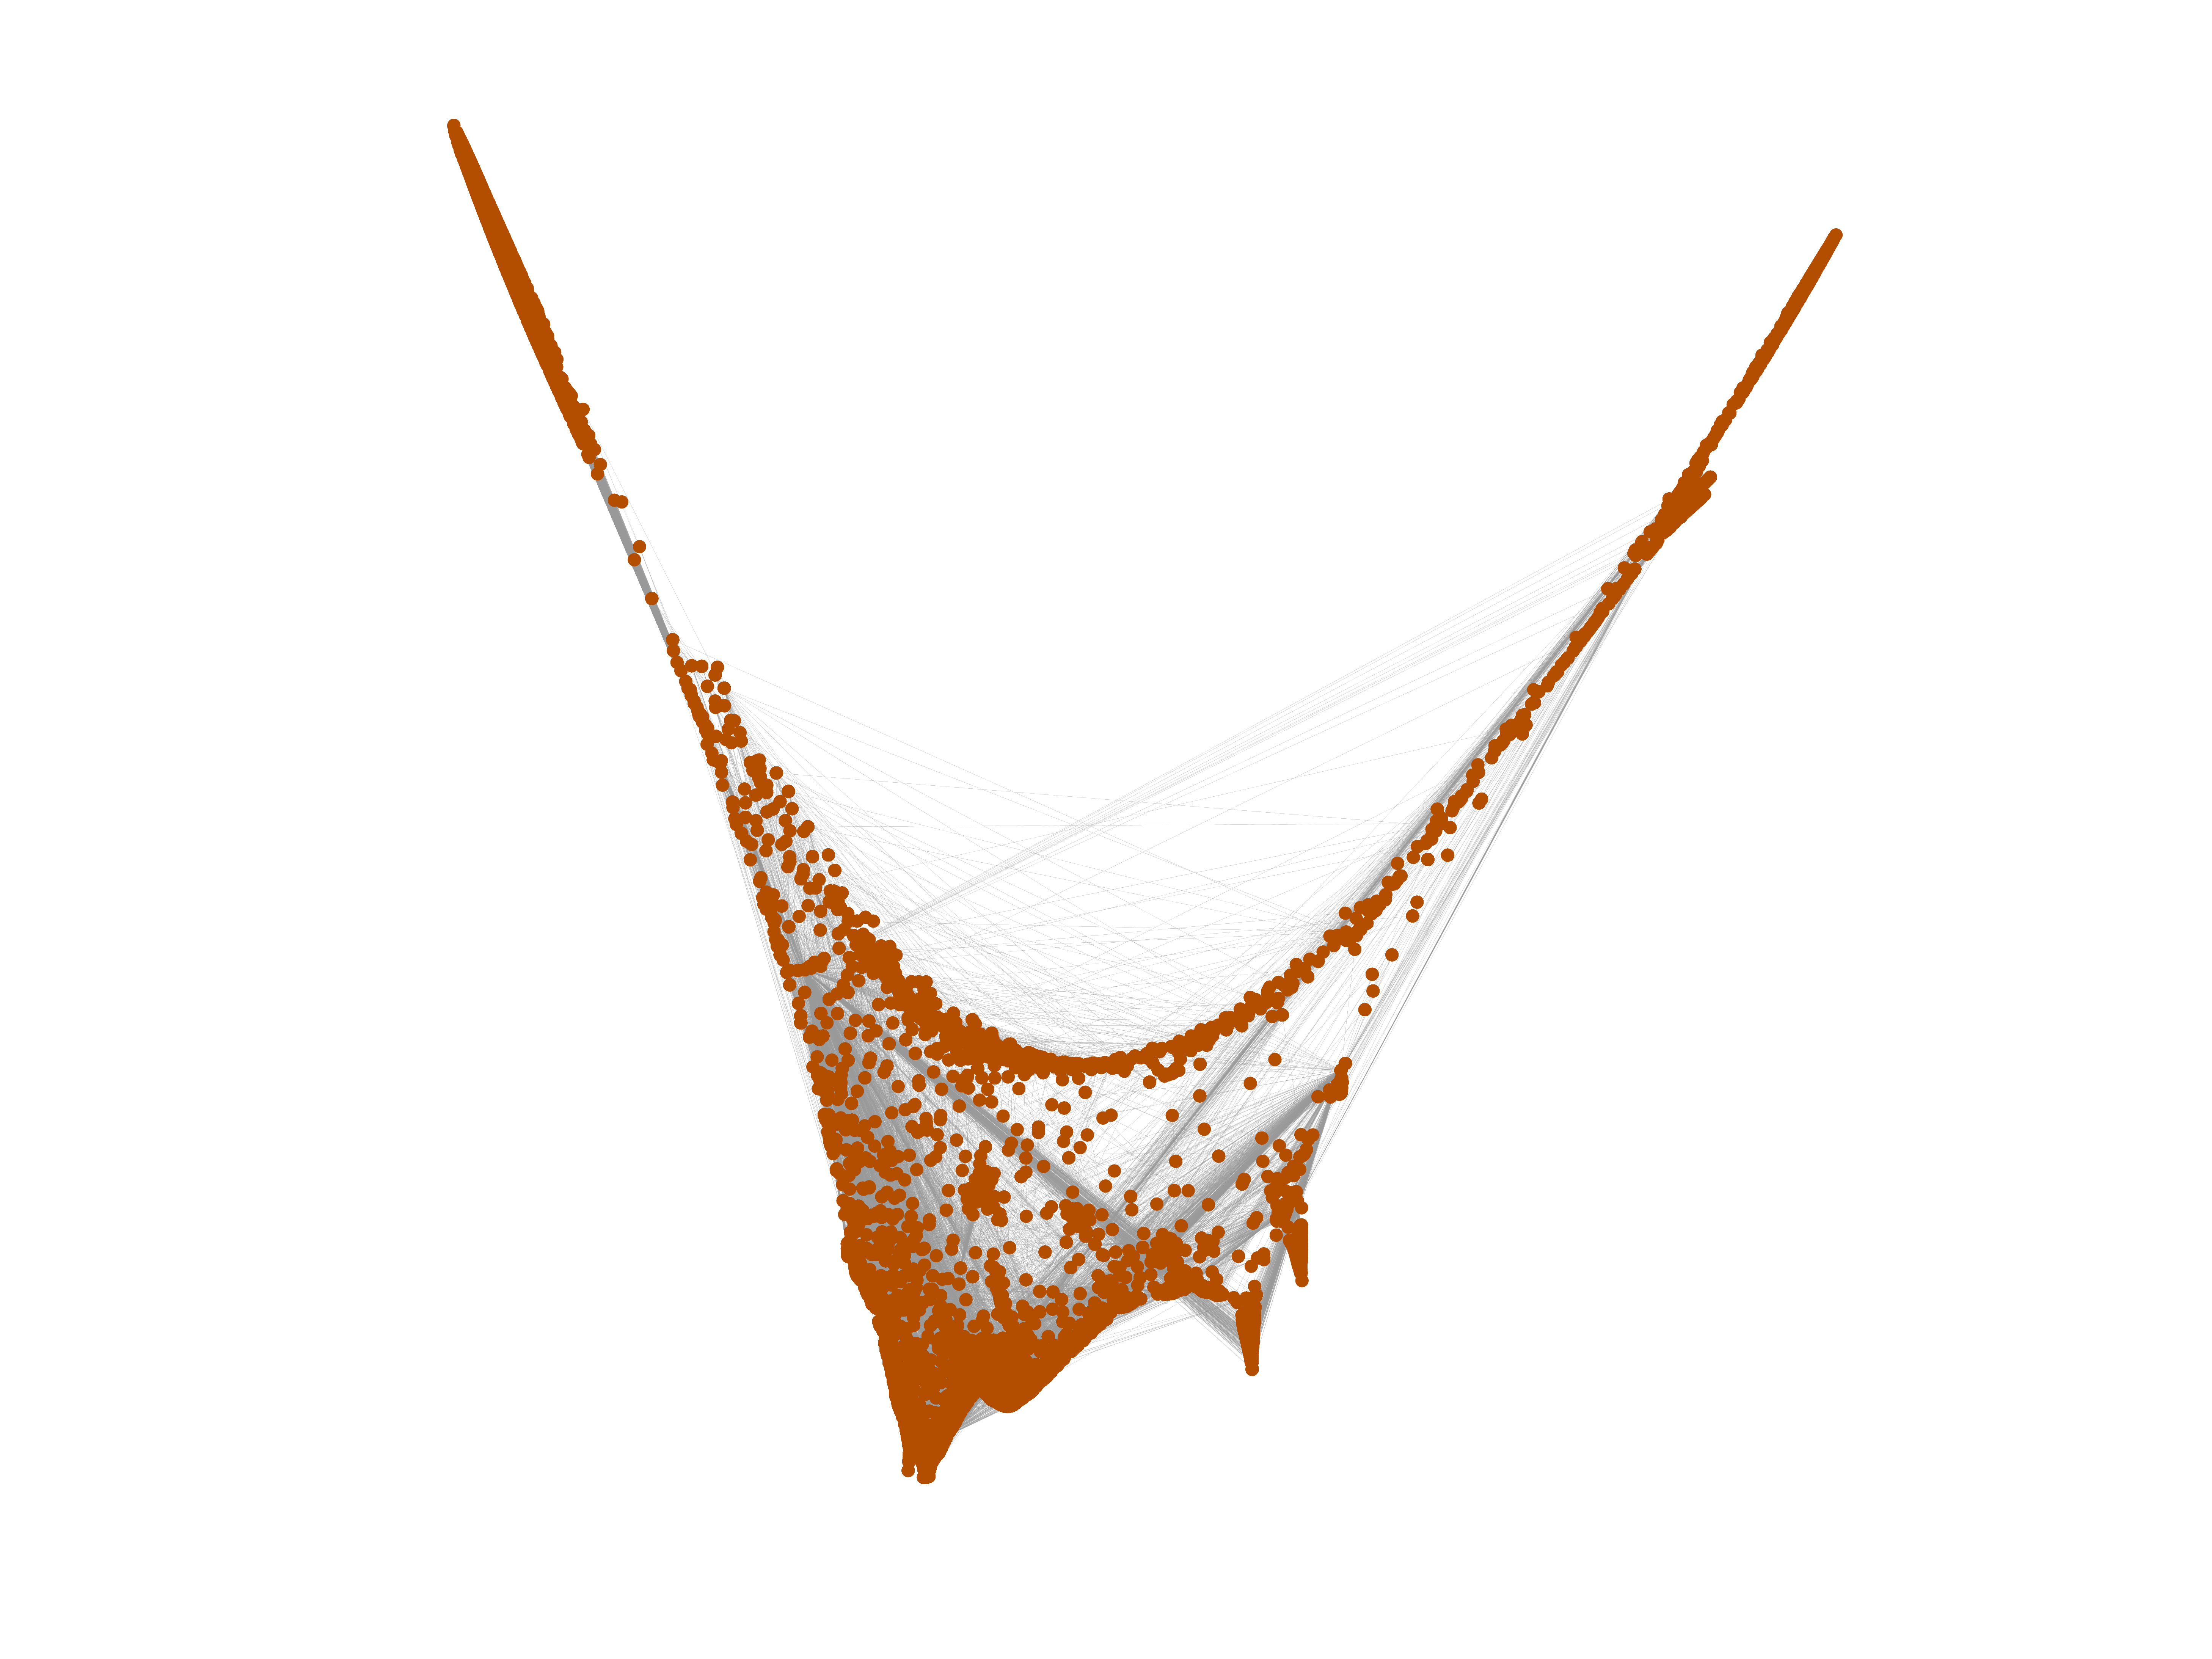
Wikipedia edits (sn)
This is the bipartite edit network of the Shona Wikipedia. It contains users
and pages from the Shona Wikipedia, connected by edit events. Each edge
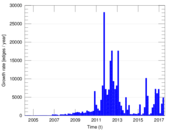
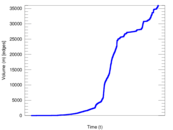
represents an edit. The dataset includes the timestamp of each edit.
Metadata
Statistics
| Size | n = | 9,067
|
| Left size | n1 = | 743
|
| Right size | n2 = | 8,324
|
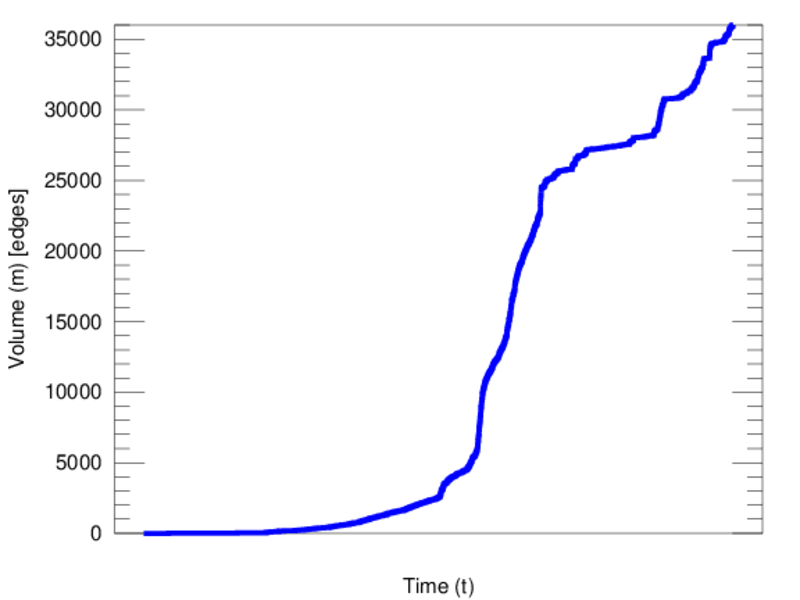
| Volume | m = | 36,007
|
| Unique edge count | m̿ = | 18,576
|
| Wedge count | s = | 12,283,642
|
| Claw count | z = | 14,049,067,285
|
| Cross count | x = | 14,494,497,943,358
|
| Square count | q = | 4,940,338
|
| 4-Tour count | T4 = | 88,697,992
|
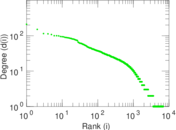
| Maximum degree | dmax = | 12,018
|
| Maximum left degree | d1max = | 12,018
|
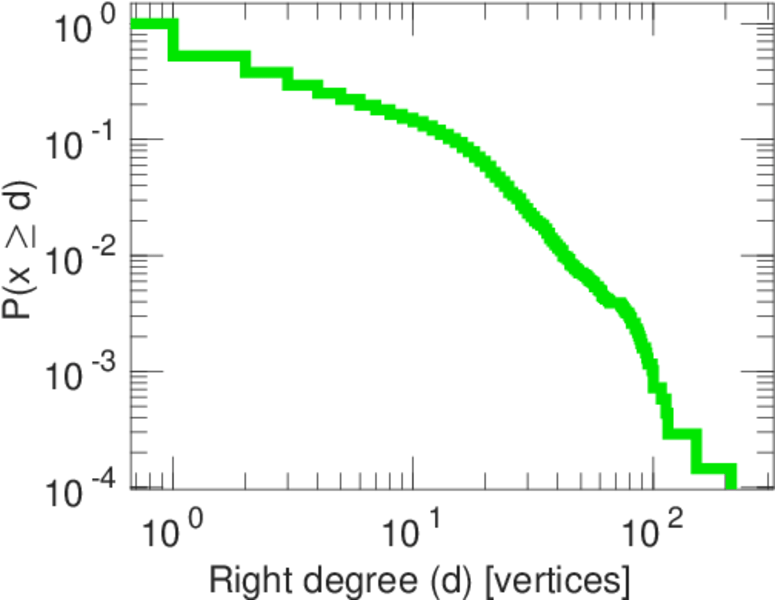
| Maximum right degree | d2max = | 211
|
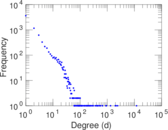
| Average degree | d = | 7.942 43
|
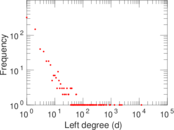
| Average left degree | d1 = | 48.461 6
|
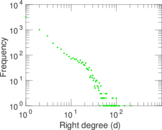
| Average right degree | d2 = | 4.325 68
|
| Fill | p = | 0.003 003 53
|
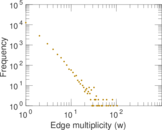
| Average edge multiplicity | m̃ = | 1.938 36
|
| Size of LCC | N = | 7,062
|
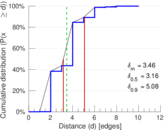
| Diameter | δ = | 13
|
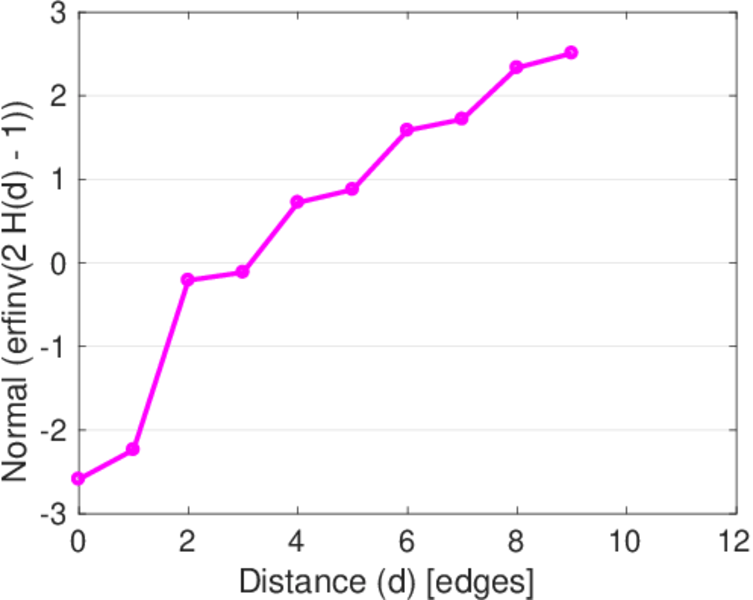
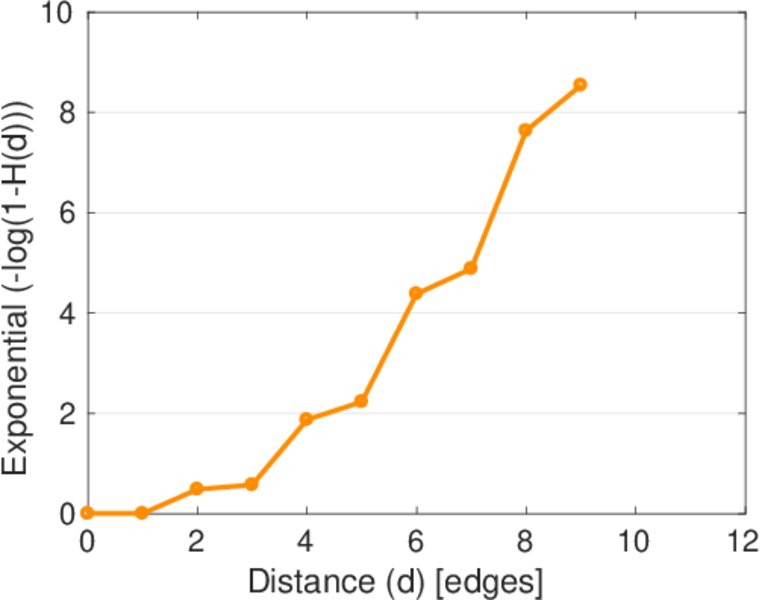
| 50-Percentile effective diameter | δ0.5 = | 3.155 80
|
| 90-Percentile effective diameter | δ0.9 = | 5.080 32
|
| Median distance | δM = | 4
|
| Mean distance | δm = | 3.461 58
|
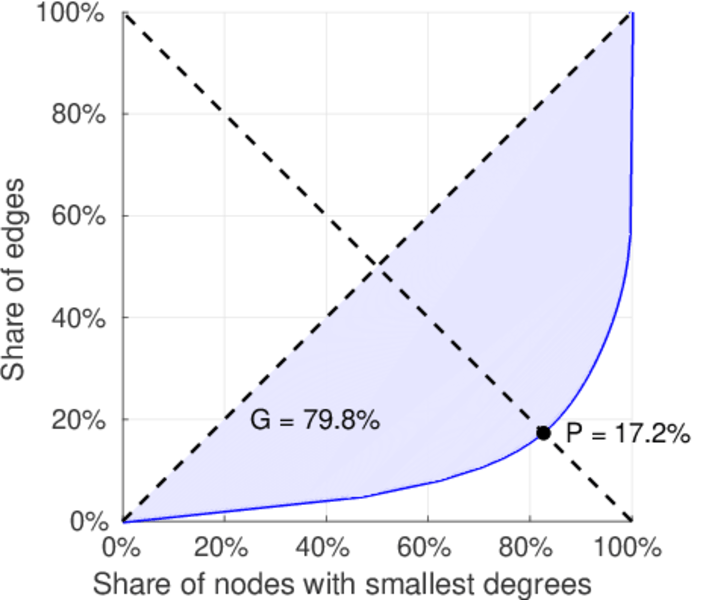
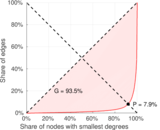
| Gini coefficient | G = | 0.801 382
|
| Balanced inequality ratio | P = | 0.172 383
|
| Left balanced inequality ratio | P1 = | 0.078 623 6
|
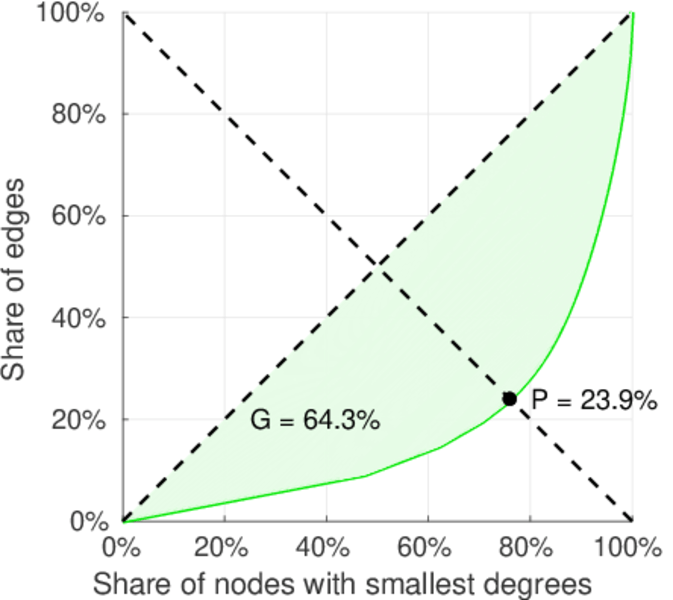
| Right balanced inequality ratio | P2 = | 0.238 704
|
| Relative edge distribution entropy | Her = | 0.756 025
|
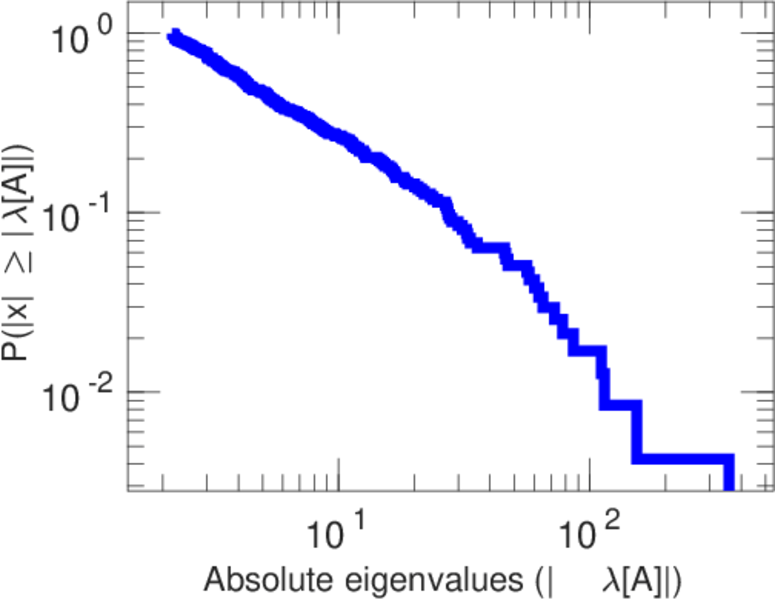
| Power law exponent | γ = | 2.814 49
|
| Tail power law exponent | γt = | 2.021 00
|
| Tail power law exponent with p | γ3 = | 2.021 00
|
| p-value | p = | 0.000 00
|
| Left tail power law exponent with p | γ3,1 = | 1.551 00
|
| Left p-value | p1 = | 0.052 000 0
|
| Right tail power law exponent with p | γ3,2 = | 4.671 00
|
| Right p-value | p2 = | 0.862 000
|
| Degree assortativity | ρ = | −0.382 265
|
| Degree assortativity p-value | pρ = | 0.000 00
|
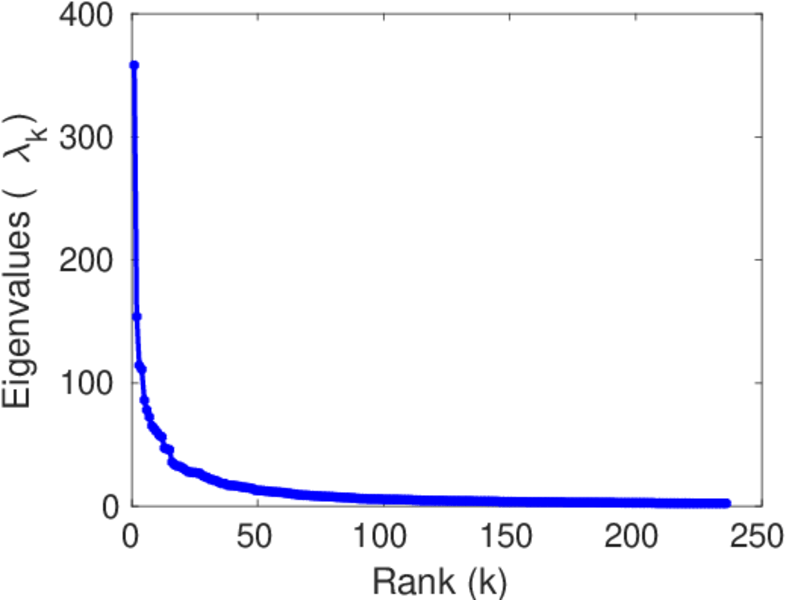
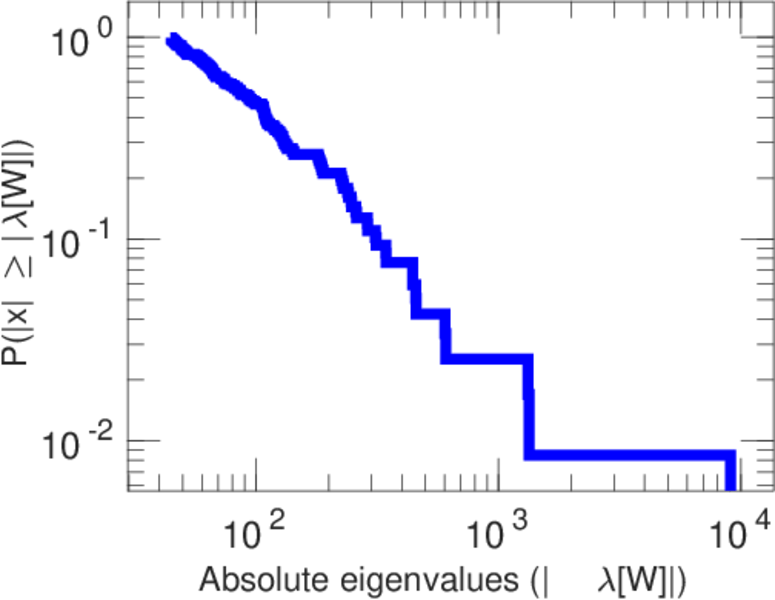
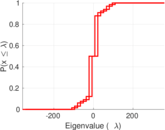
| Spectral norm | α = | 358.120
|
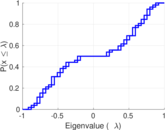
| Algebraic connectivity | a = | 0.015 699 2
|
| Spectral separation | |λ1[A] / λ2[A]| = | 2.326 88
|
| Controllability | C = | 6,255
|
| Relative controllability | Cr = | 0.819 039
|
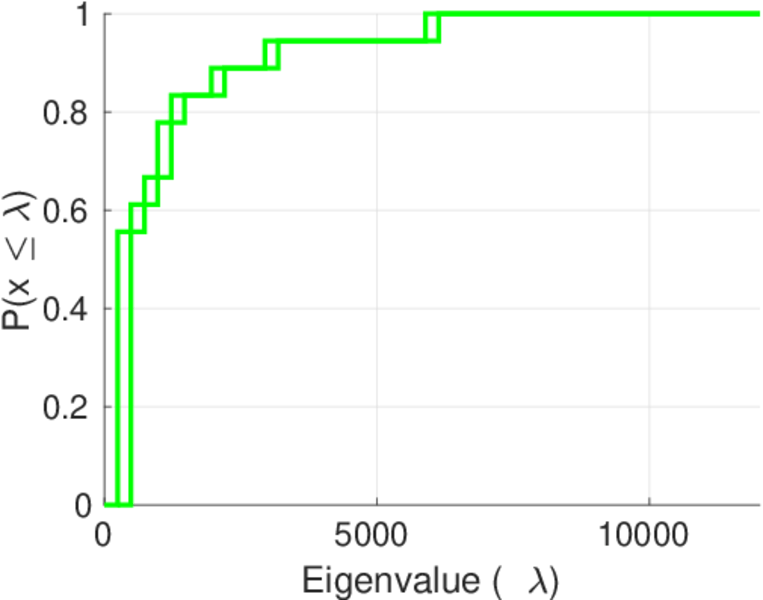
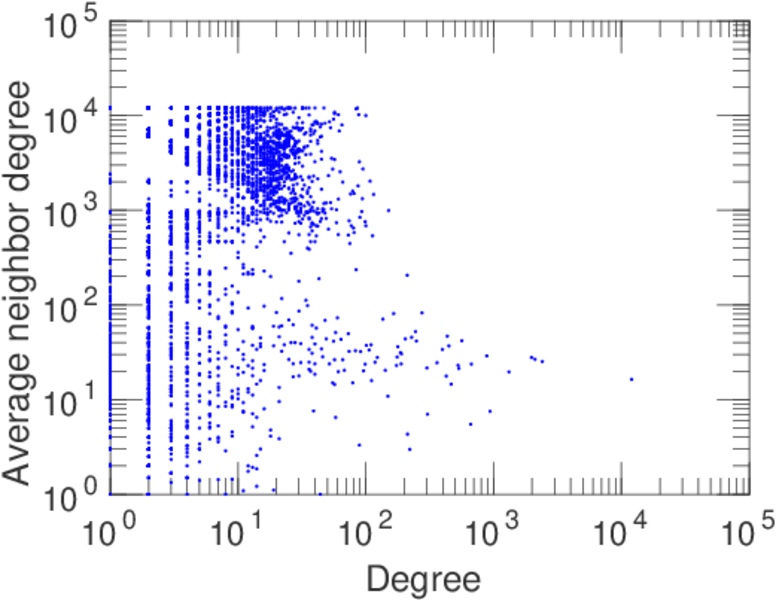
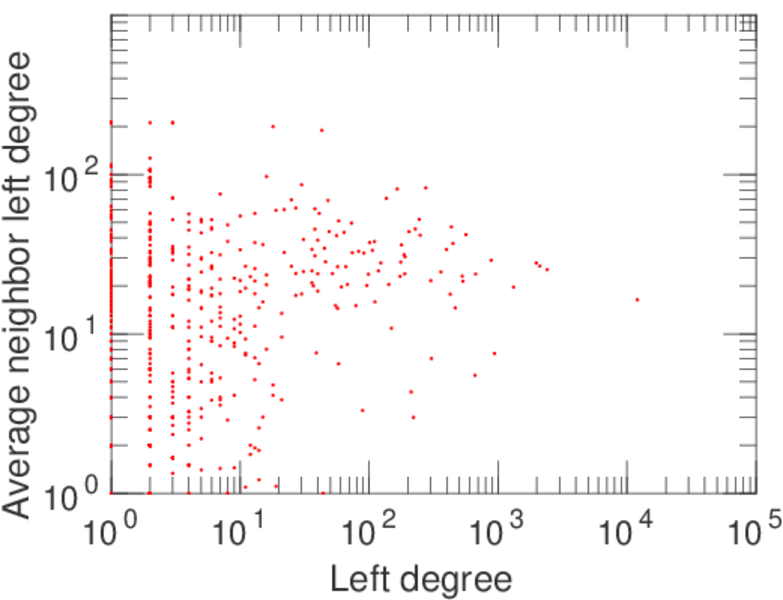
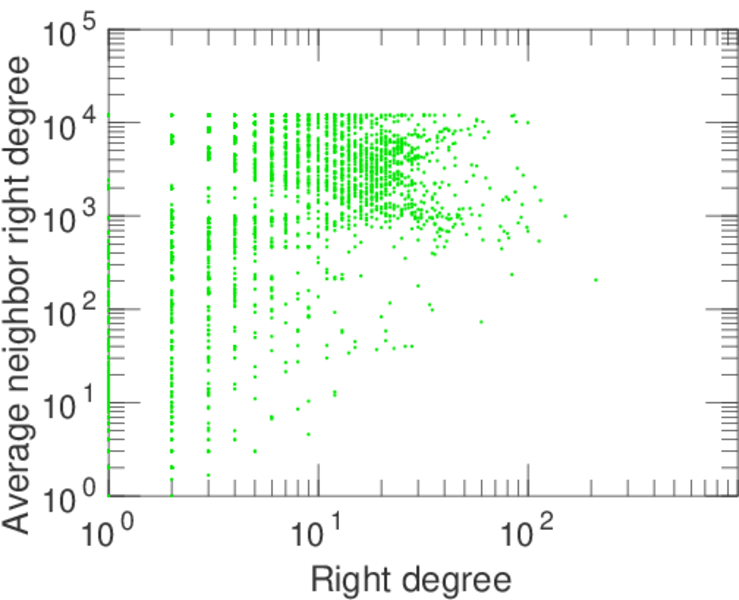
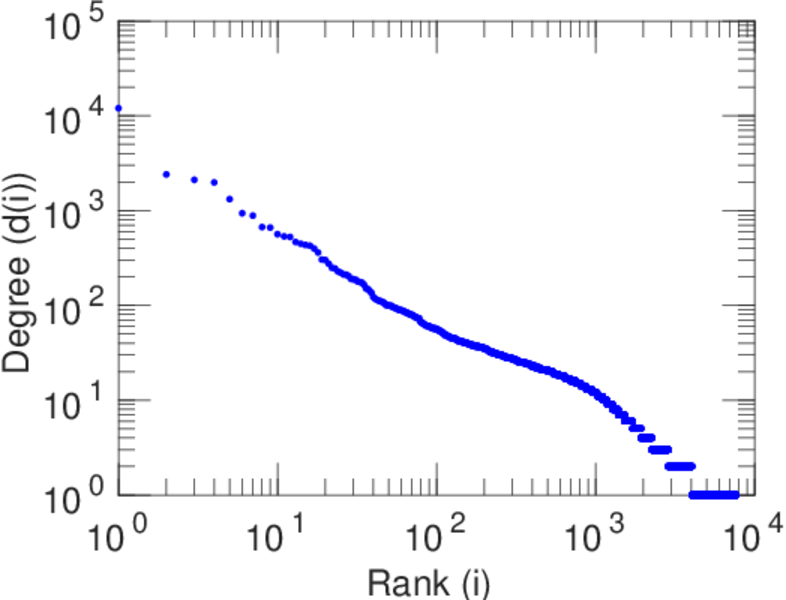
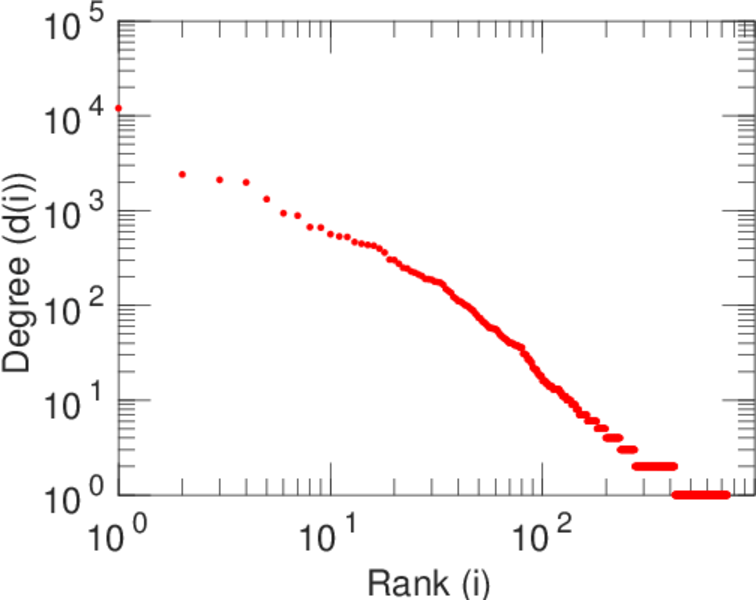
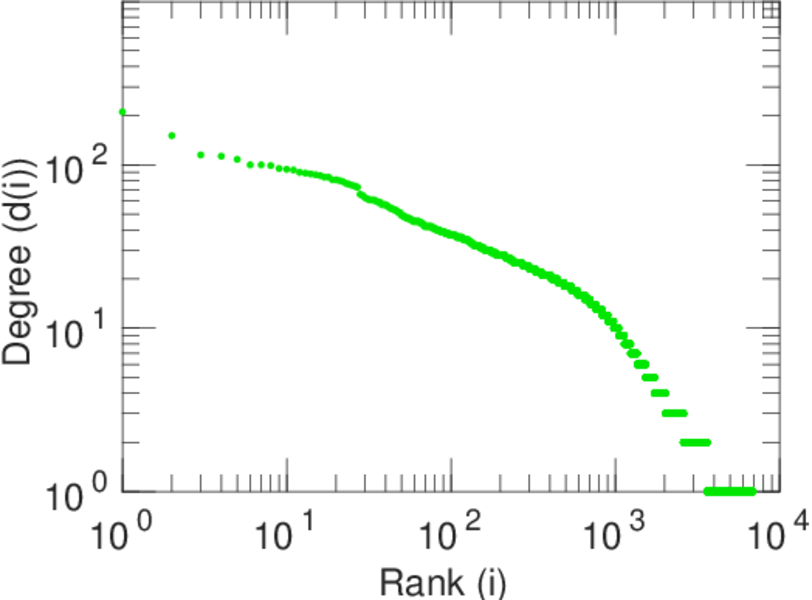
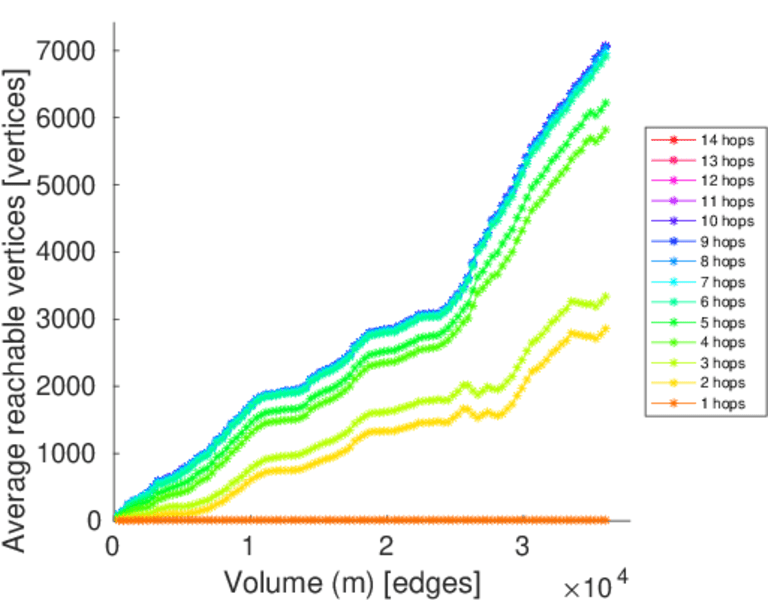
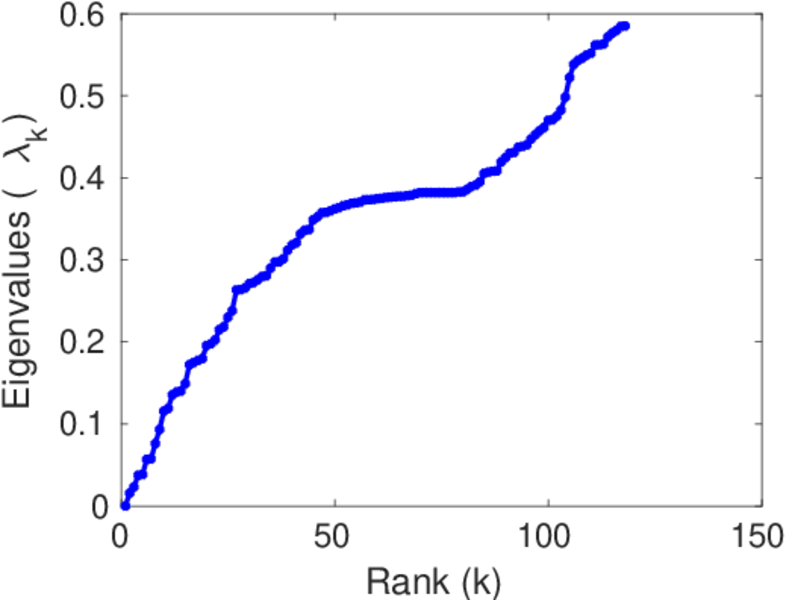
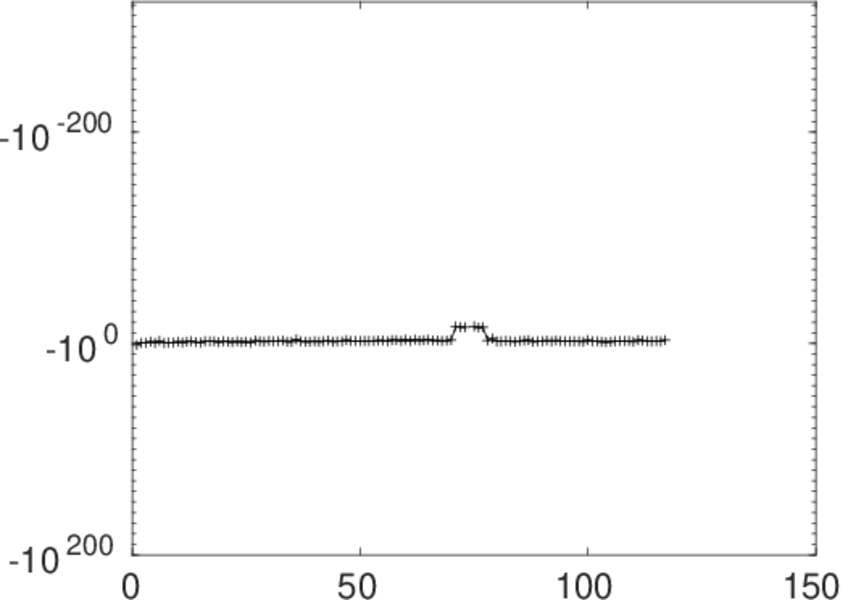
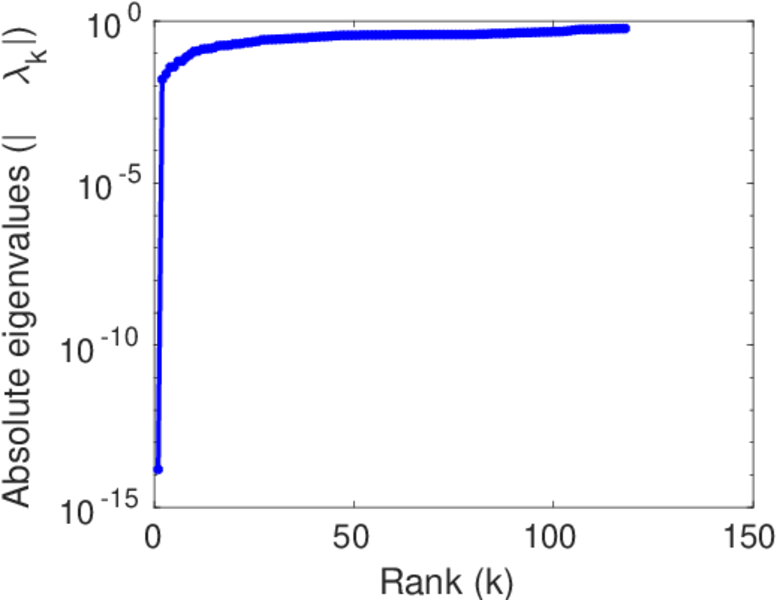
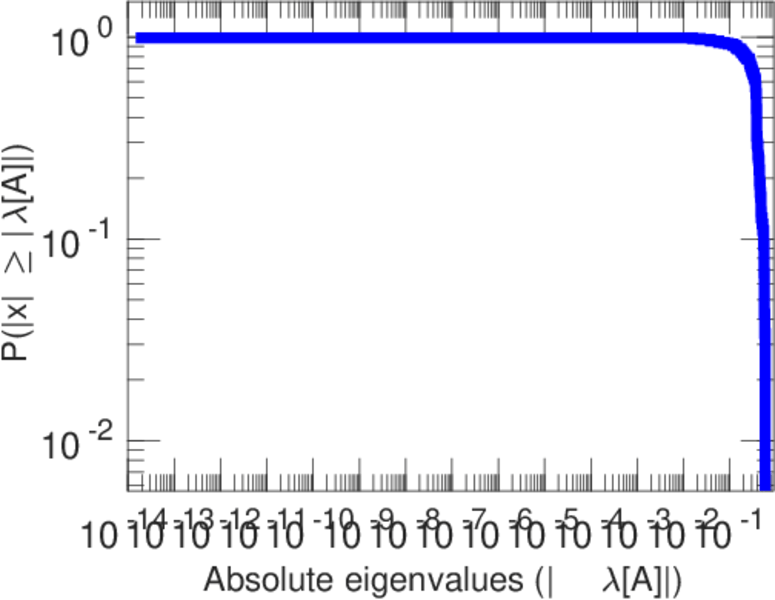
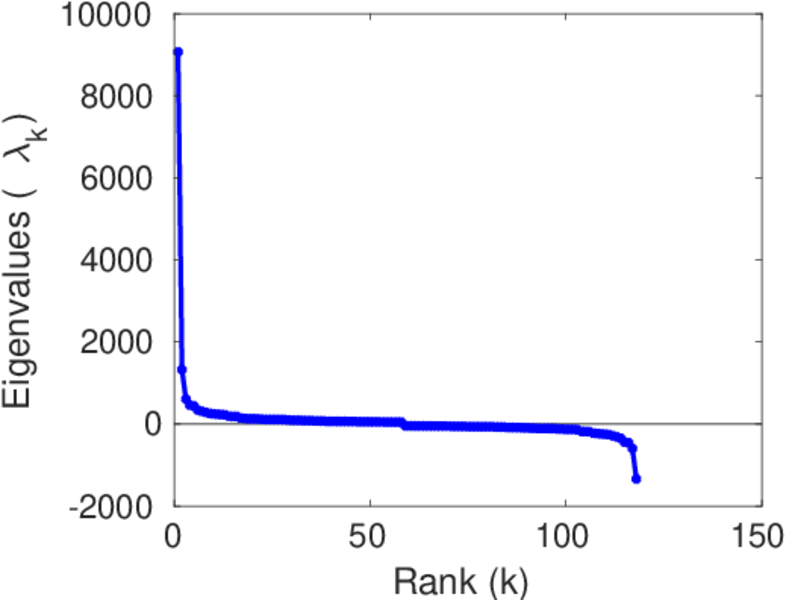
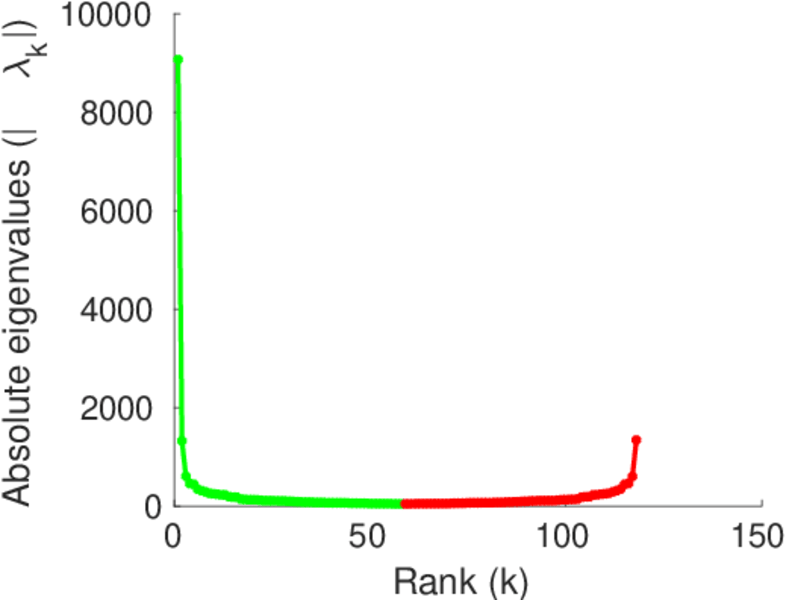
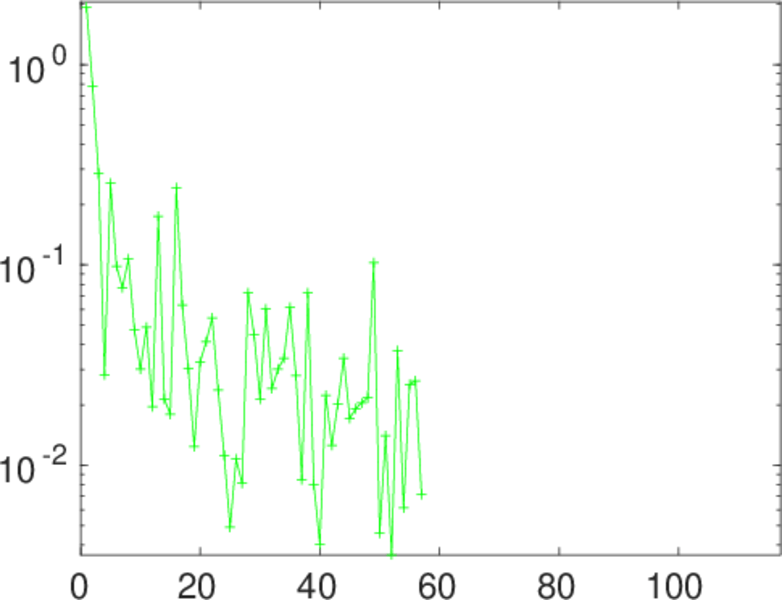
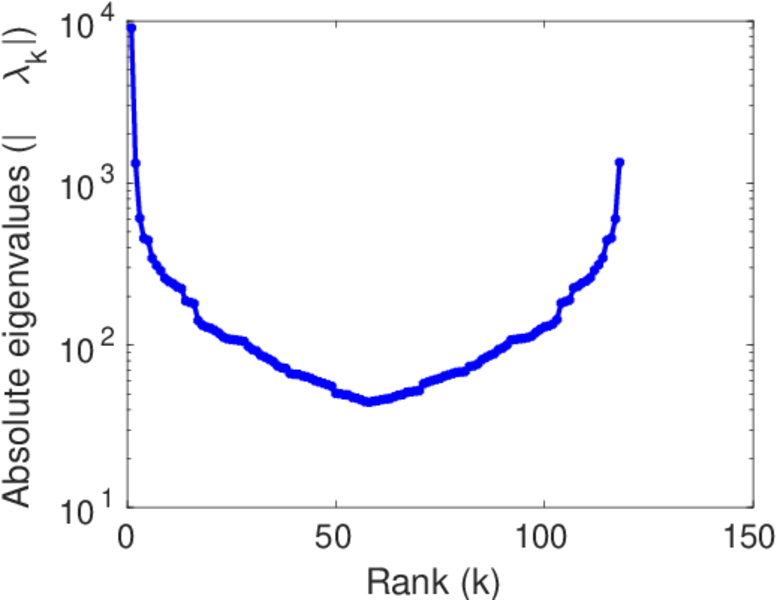
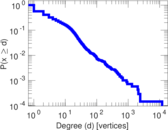
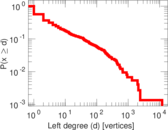
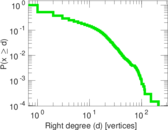
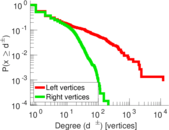
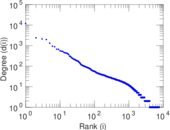
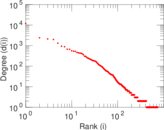
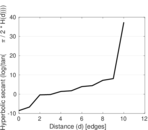
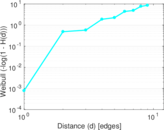
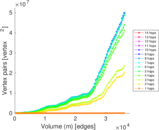
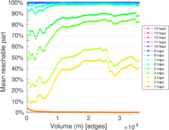
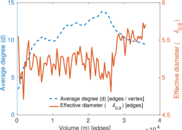
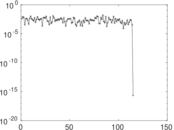
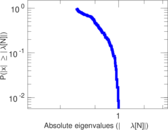
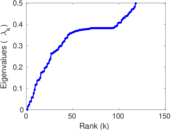
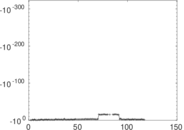
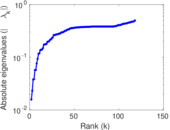
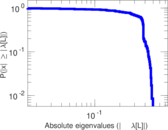
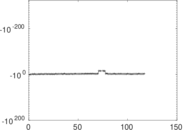
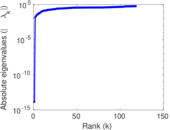
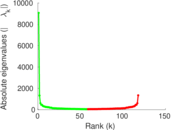
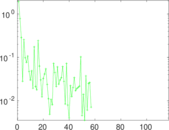
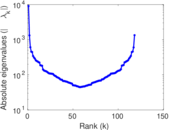
Plots


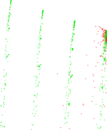


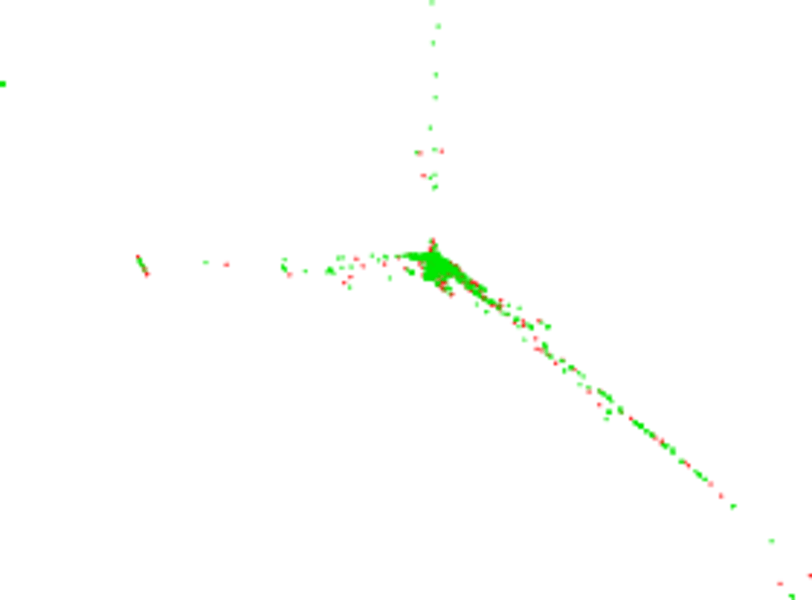
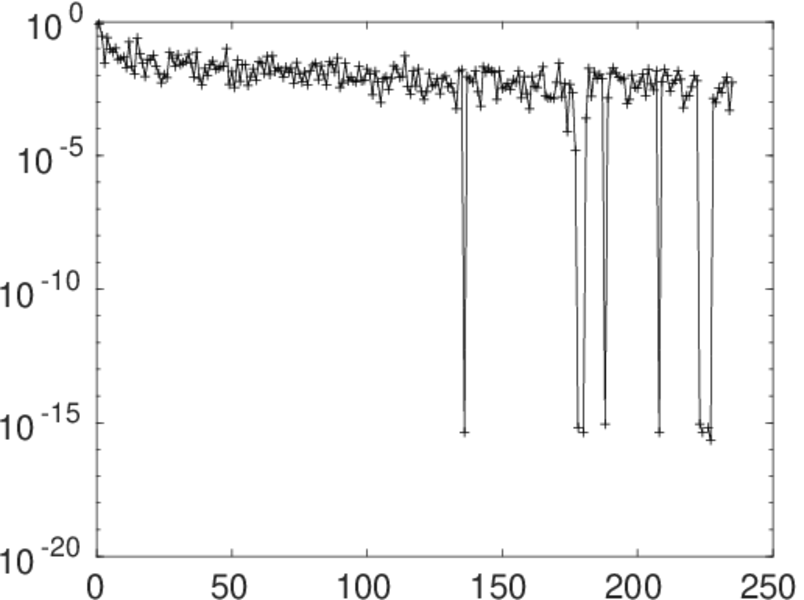
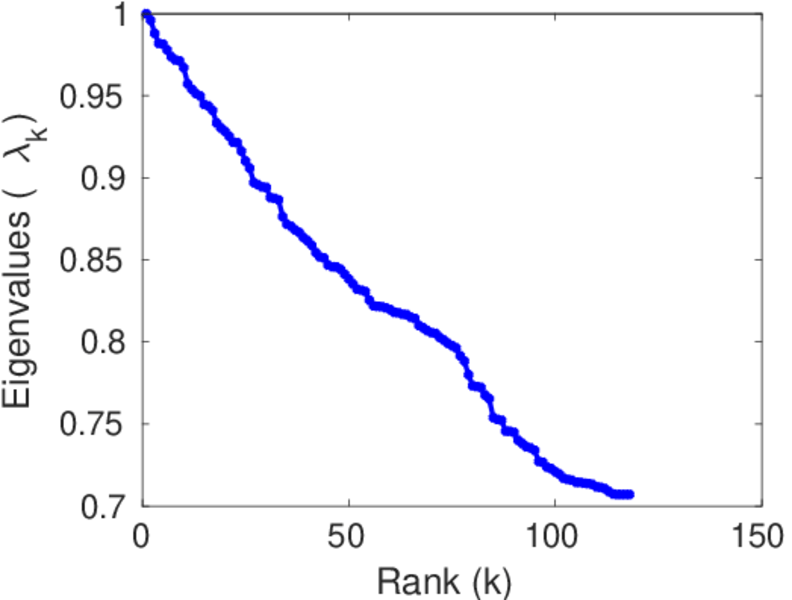
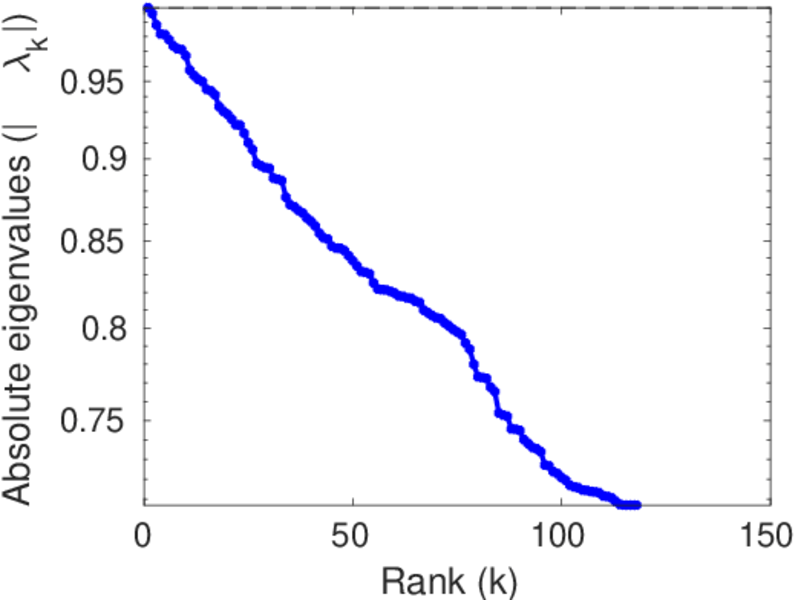
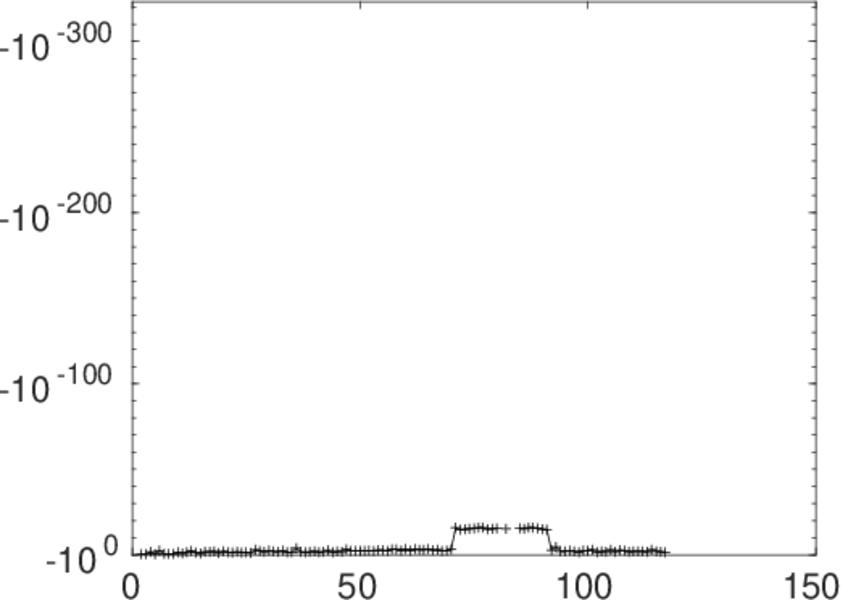
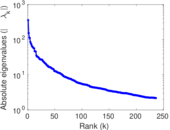
Matrix decompositions plots


Downloads
References
|
[1]
|
Jérôme Kunegis.
KONECT – The Koblenz Network Collection.
In Proc. Int. Conf. on World Wide Web Companion, pages
1343–1350, 2013.
[ http ]
|
|
[2]
|
Wikimedia Foundation.
Wikimedia downloads.
http://dumps.wikimedia.org/, January 2010.
|
 KONECT ‣ Networks ‣
Buy Me a Coffee
KONECT ‣ Networks ‣
Buy Me a Coffee