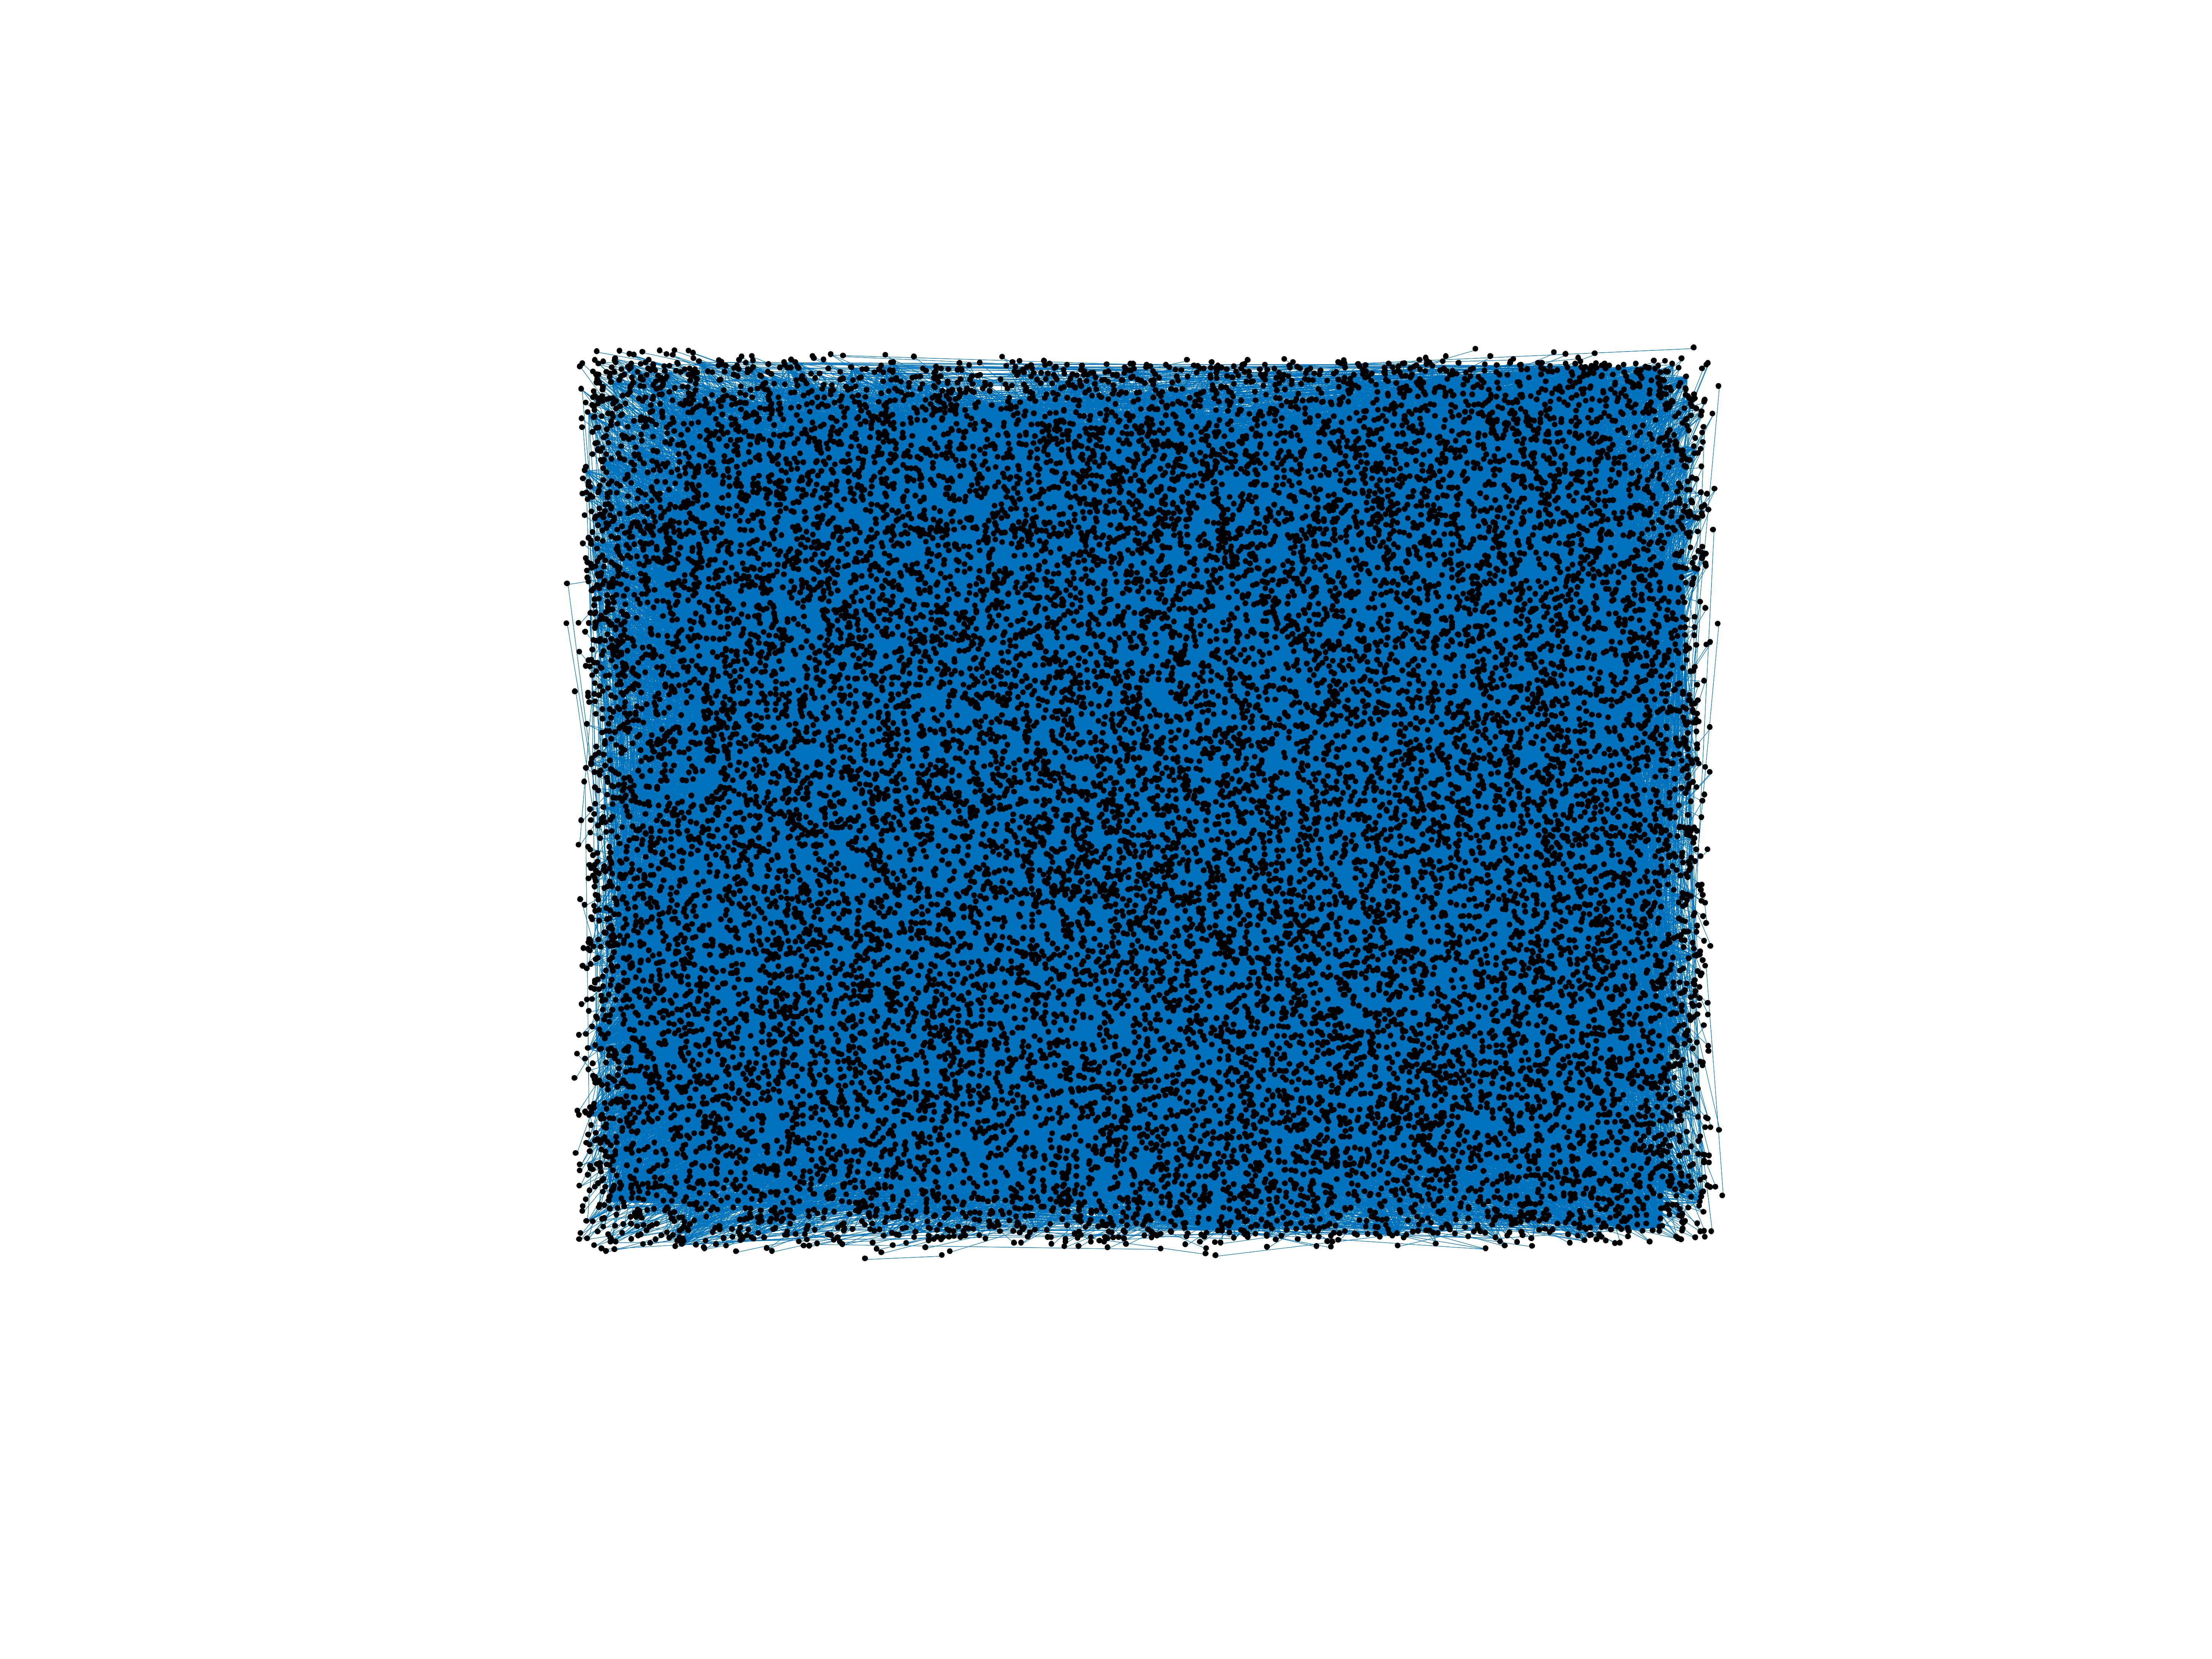
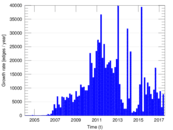
Wikipedia edits (so)
This is the bipartite edit network of the Somali Wikipedia. It contains users
and pages from the Somali Wikipedia, connected by edit events. Each edge
represents an edit. The dataset includes the timestamp of each edit.
Metadata
Statistics
| Size | n = | 20,387
|
| Left size | n1 = | 2,692
|
| Right size | n2 = | 17,695
|
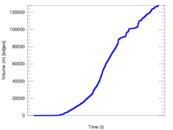
| Volume | m = | 127,958
|
| Unique edge count | m̿ = | 61,586
|
| Wedge count | s = | 50,788,989
|
| Claw count | z = | 56,124,446,854
|
| Cross count | x = | 56,768,589,530,245
|
| Square count | q = | 62,524,033
|
| 4-Tour count | T4 = | 703,520,792
|
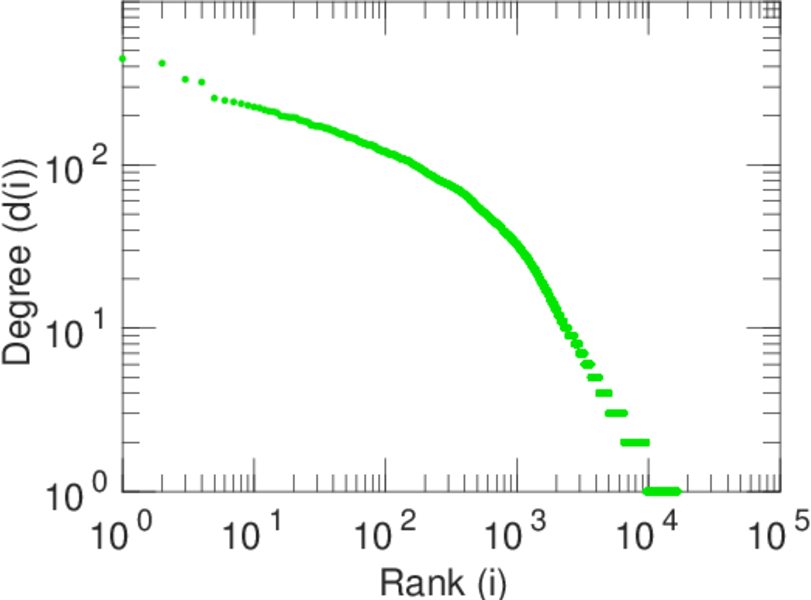
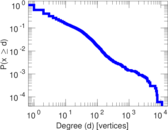
| Maximum degree | dmax = | 10,908
|
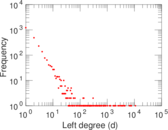
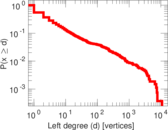
| Maximum left degree | d1max = | 10,908
|
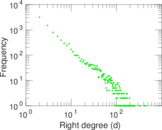
| Maximum right degree | d2max = | 447
|
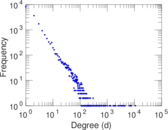
| Average degree | d = | 12.552 9
|
| Average left degree | d1 = | 47.532 7
|
| Average right degree | d2 = | 7.231 31
|
| Fill | p = | 0.001 292 87
|
| Average edge multiplicity | m̃ = | 2.077 71
|
| Size of LCC | N = | 17,704
|
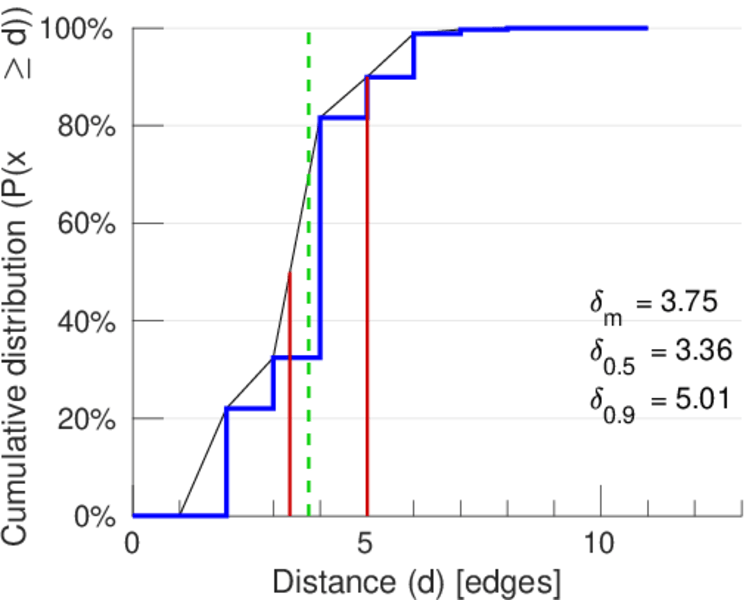
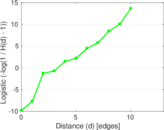
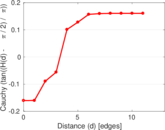
| Diameter | δ = | 13
|
| 50-Percentile effective diameter | δ0.5 = | 3.357 45
|
| 90-Percentile effective diameter | δ0.9 = | 5.006 34
|
| Median distance | δM = | 4
|
| Mean distance | δm = | 3.754 43
|
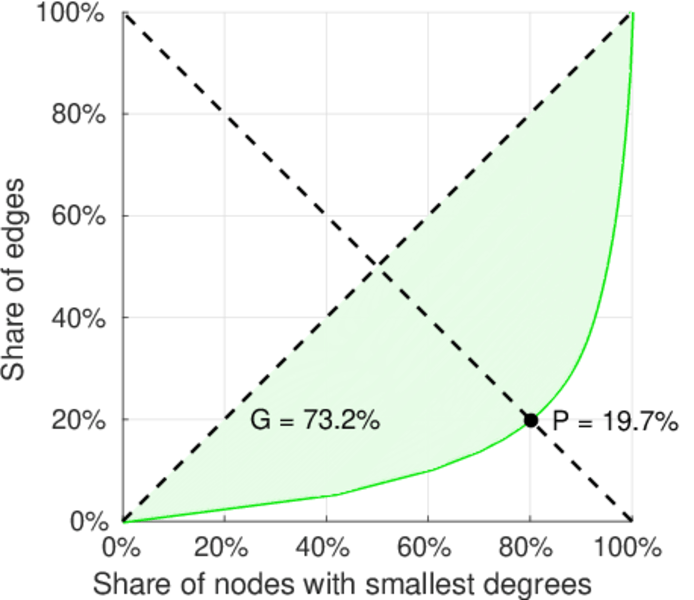
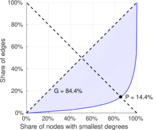
| Gini coefficient | G = | 0.849 549
|
| Balanced inequality ratio | P = | 0.143 285
|
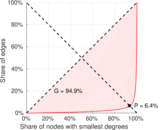
| Left balanced inequality ratio | P1 = | 0.064 341 4
|
| Right balanced inequality ratio | P2 = | 0.196 518
|
| Relative edge distribution entropy | Her = | 0.755 695
|
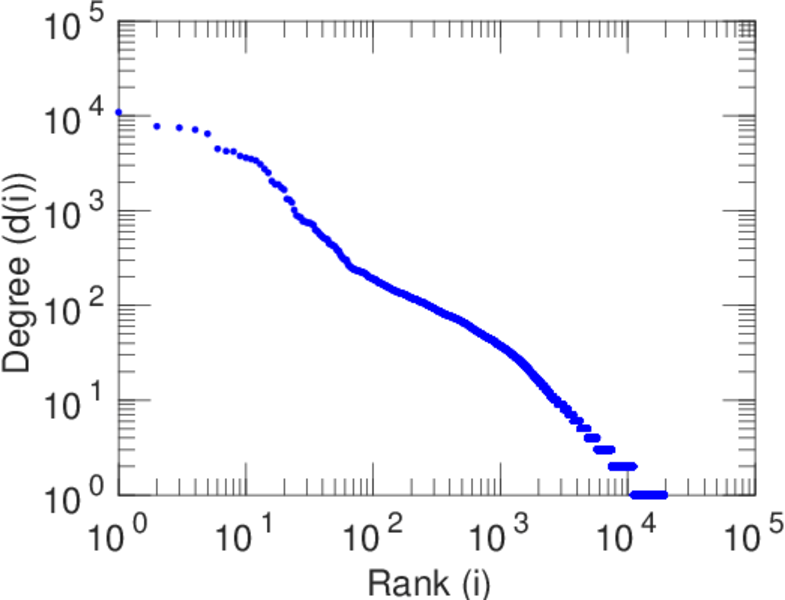
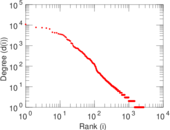
| Power law exponent | γ = | 2.583 65
|
| Tail power law exponent | γt = | 1.931 00
|
| Tail power law exponent with p | γ3 = | 1.931 00
|
| p-value | p = | 0.000 00
|
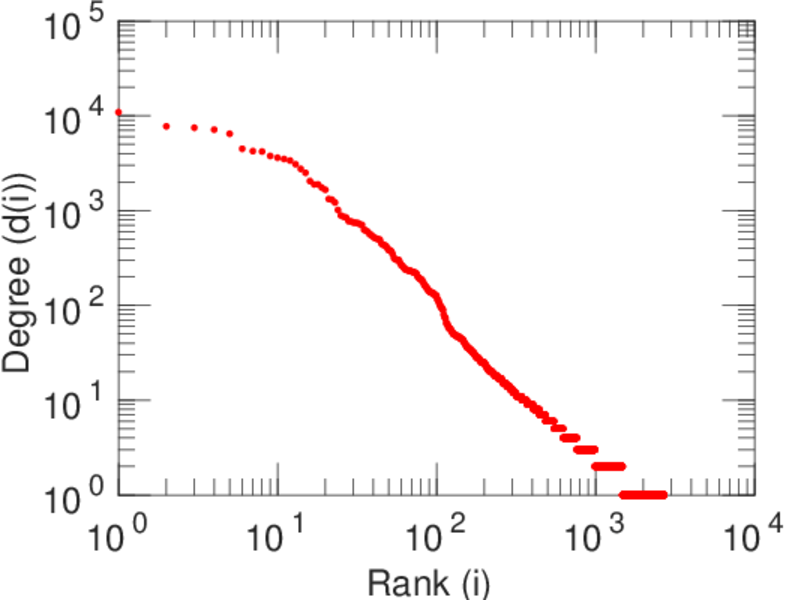
| Left tail power law exponent with p | γ3,1 = | 1.891 00
|
| Left p-value | p1 = | 0.000 00
|
| Right tail power law exponent with p | γ3,2 = | 1.941 00
|
| Right p-value | p2 = | 0.000 00
|
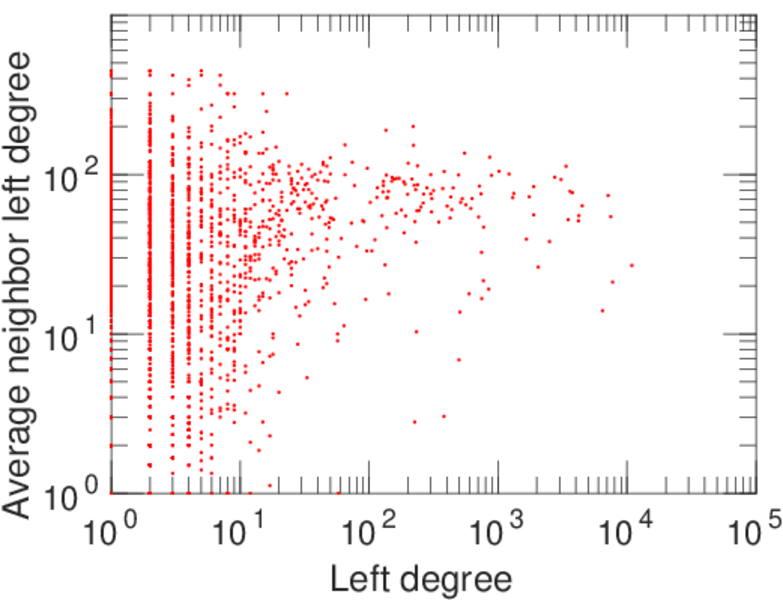
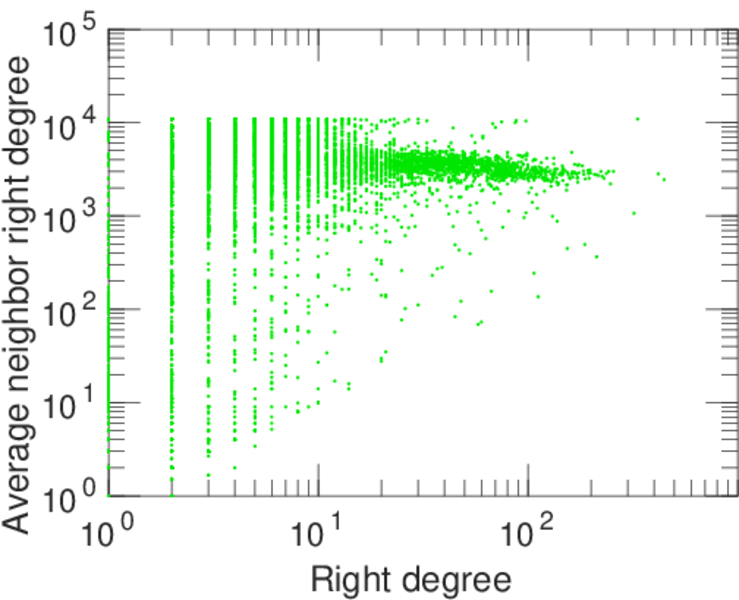
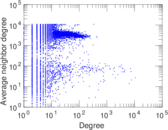
| Degree assortativity | ρ = | −0.393 294
|
| Degree assortativity p-value | pρ = | 0.000 00
|
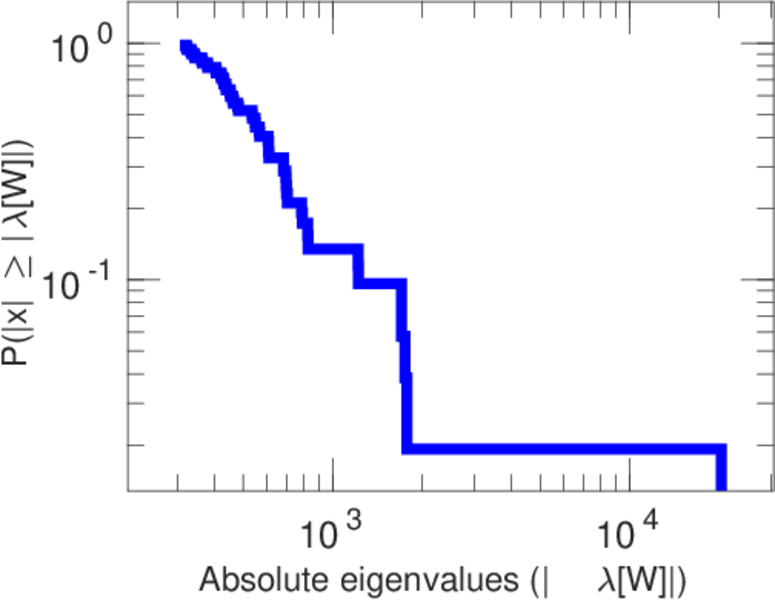
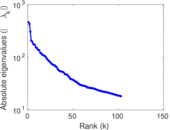
| Spectral norm | α = | 462.919
|
| Algebraic connectivity | a = | 0.026 536 3
|
| Spectral separation | |λ1[A] / λ2[A]| = | 1.083 42
|
| Controllability | C = | 14,674
|
| Relative controllability | Cr = | 0.759 917
|
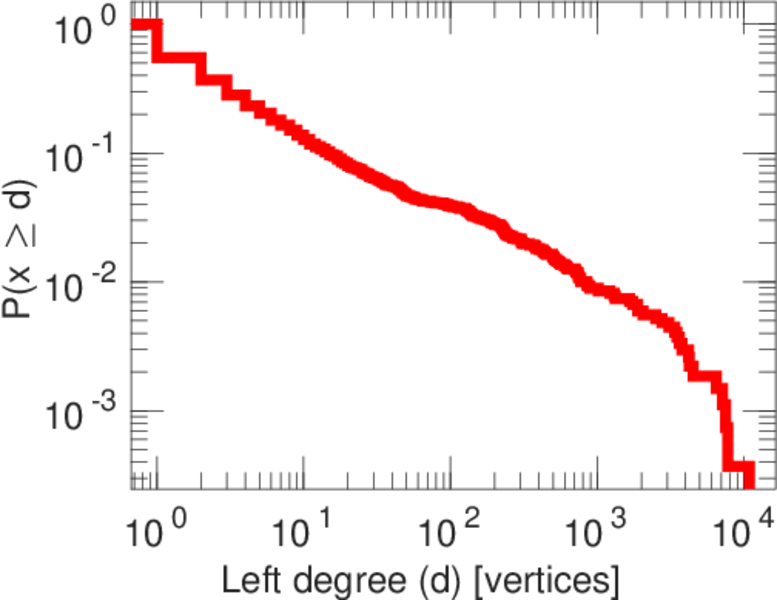
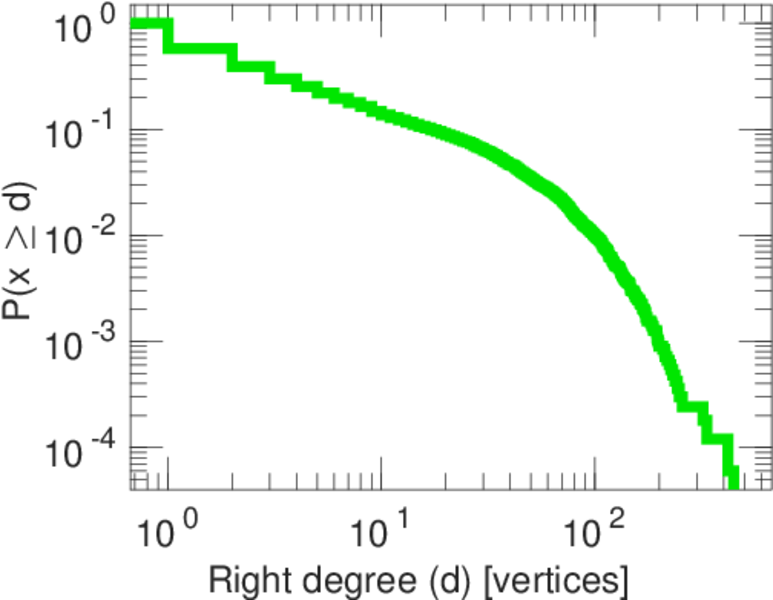
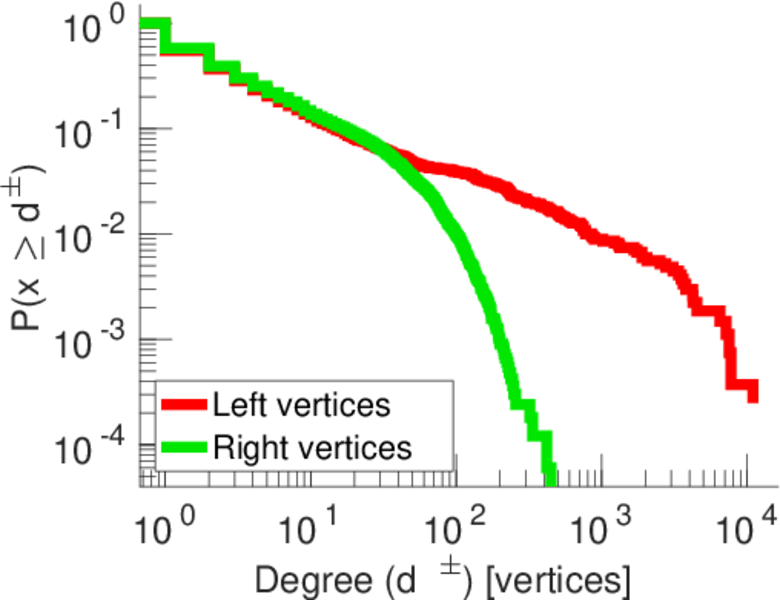
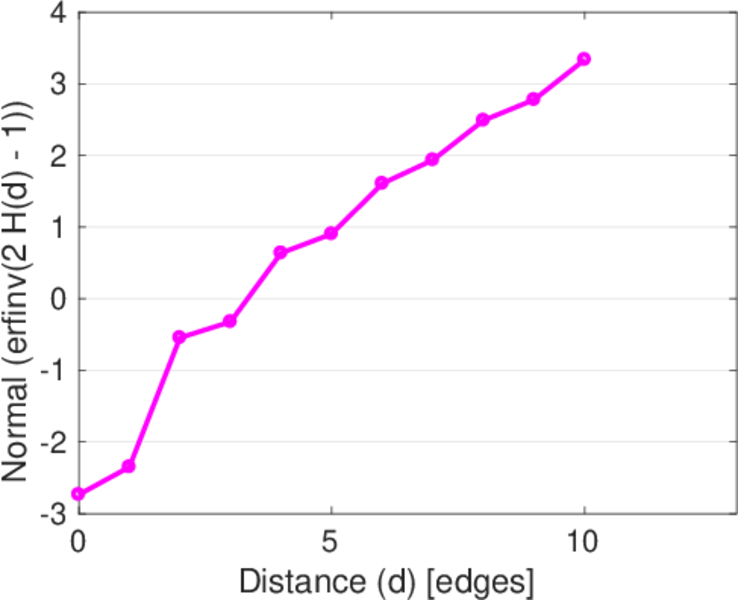
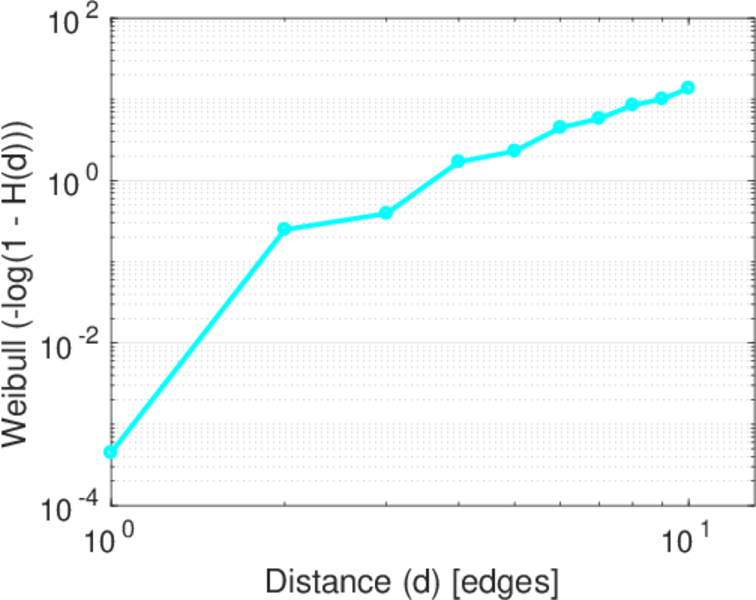
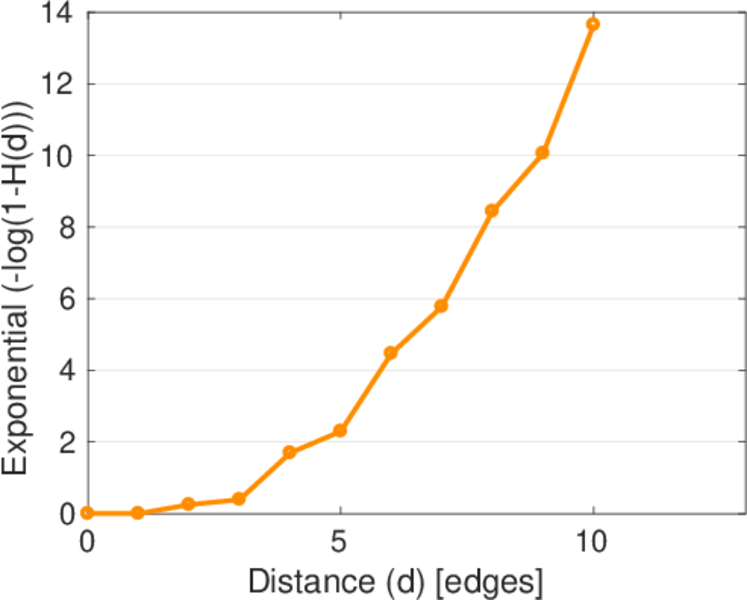
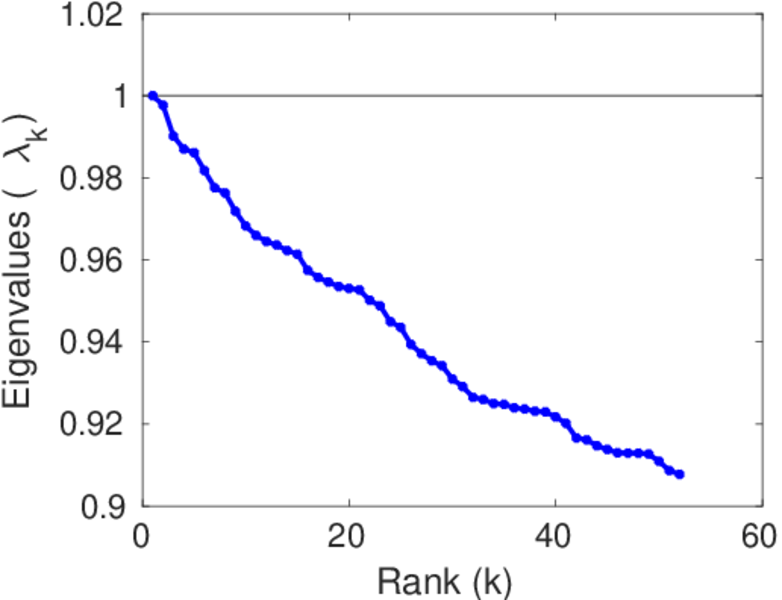
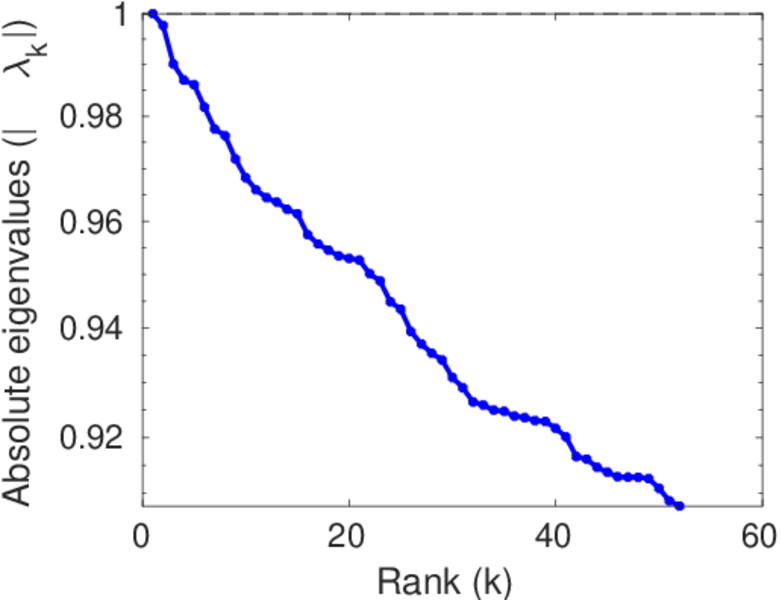
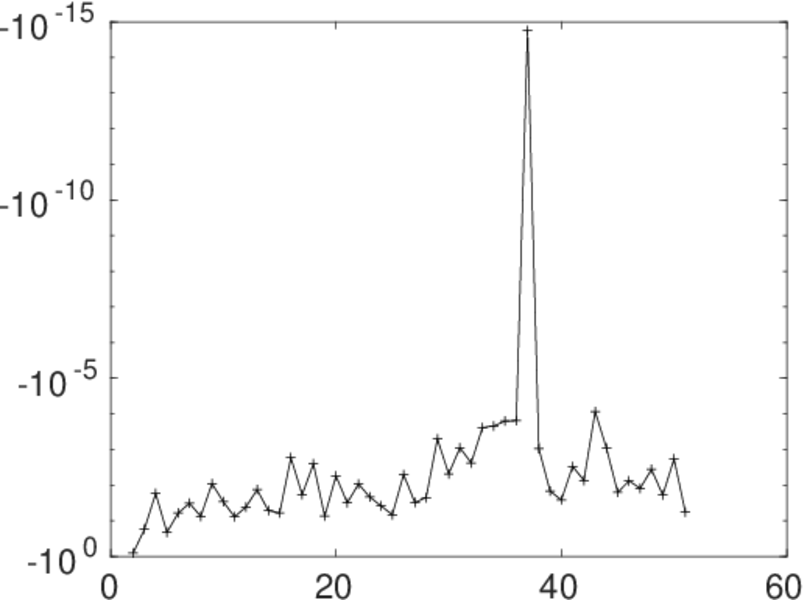
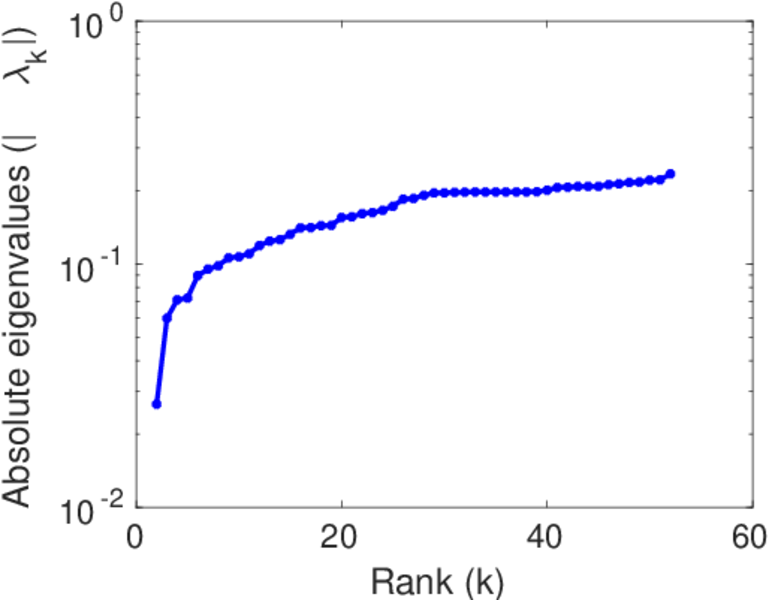
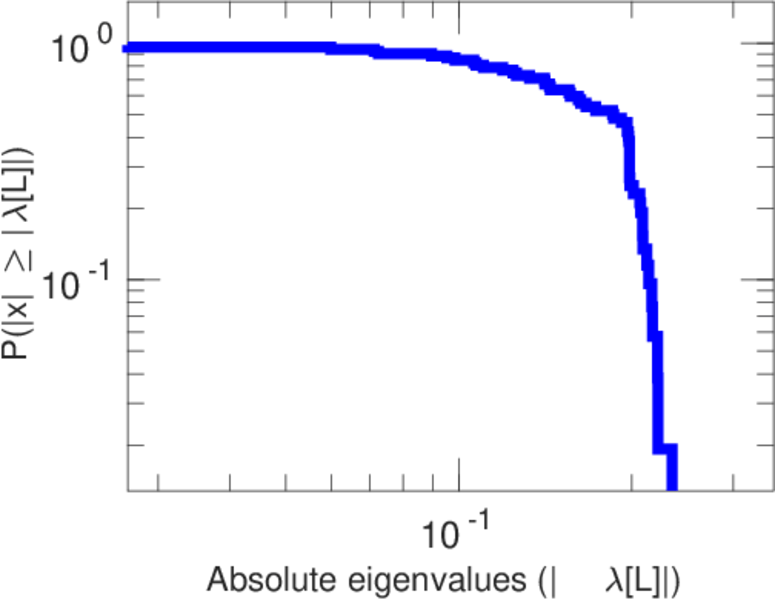
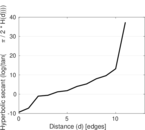
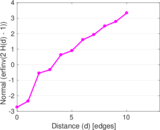
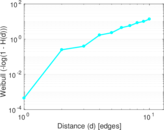
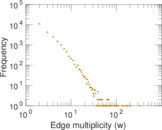
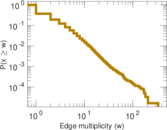
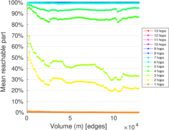
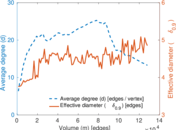
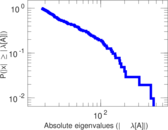
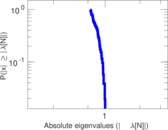
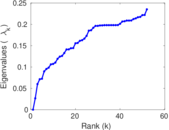
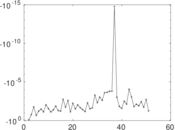
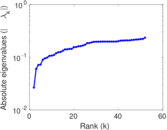
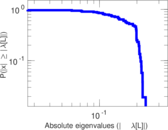
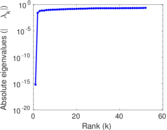
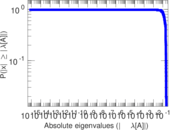
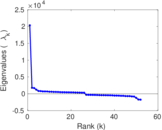
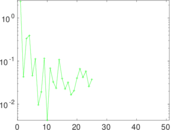
Plots


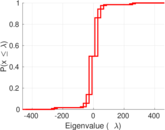
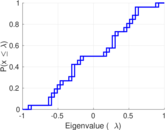

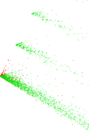
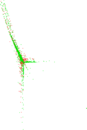


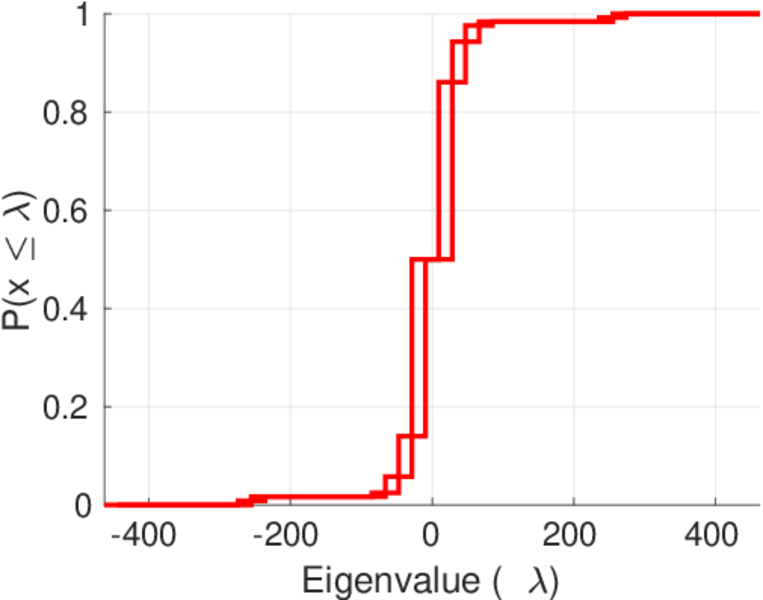
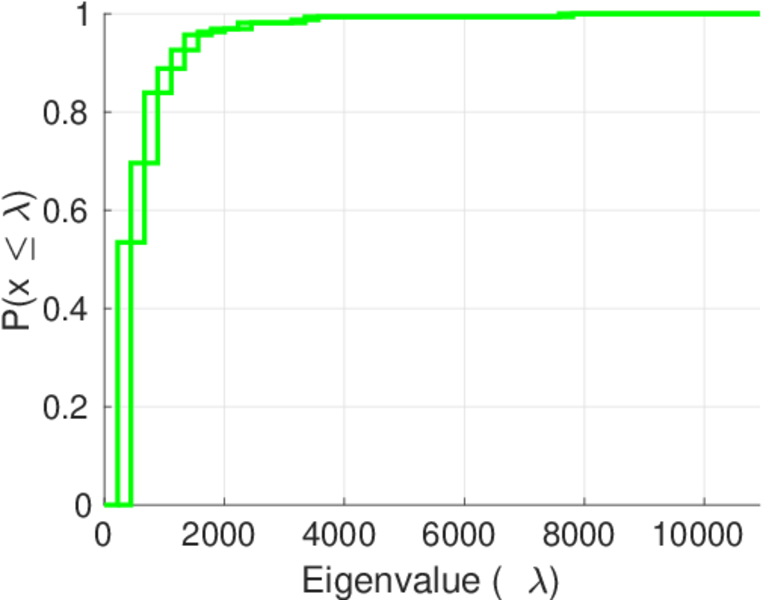
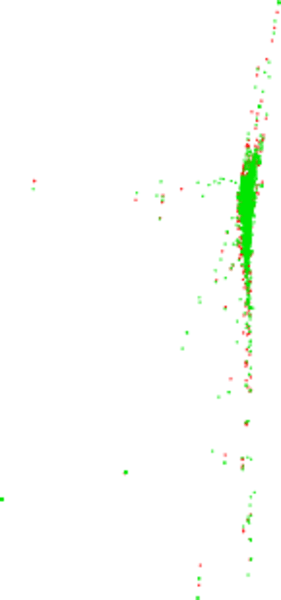
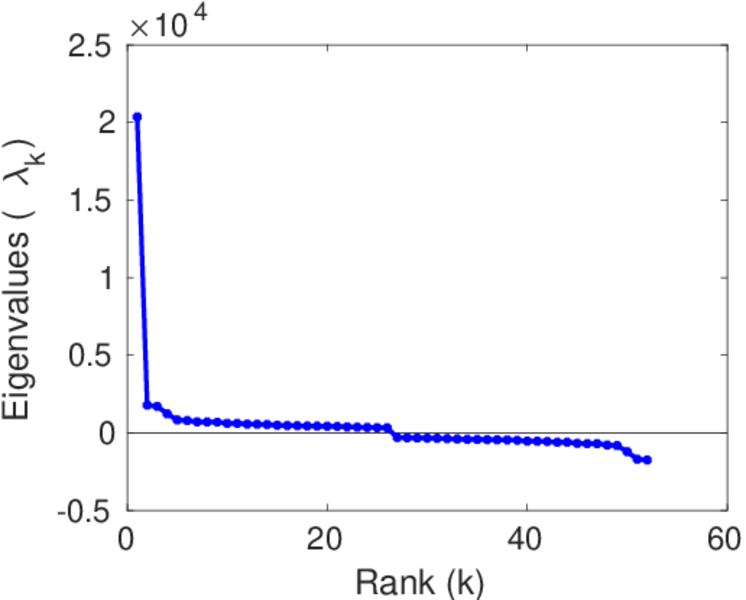
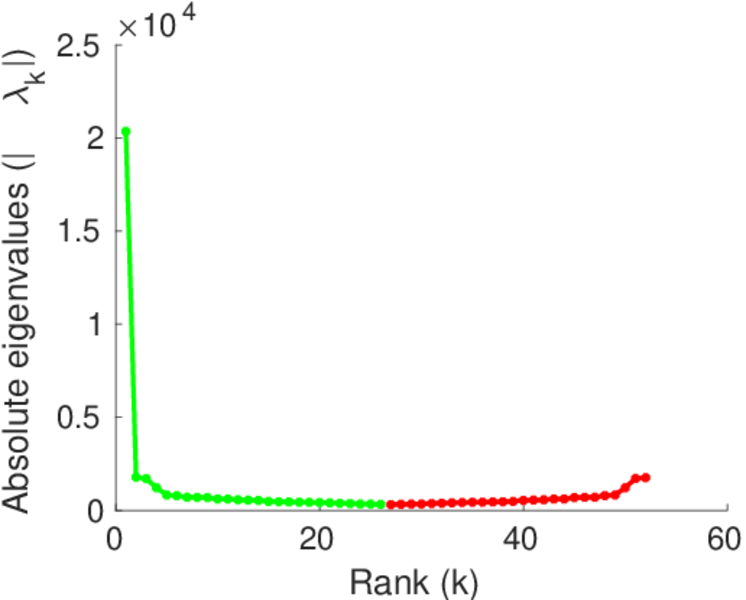
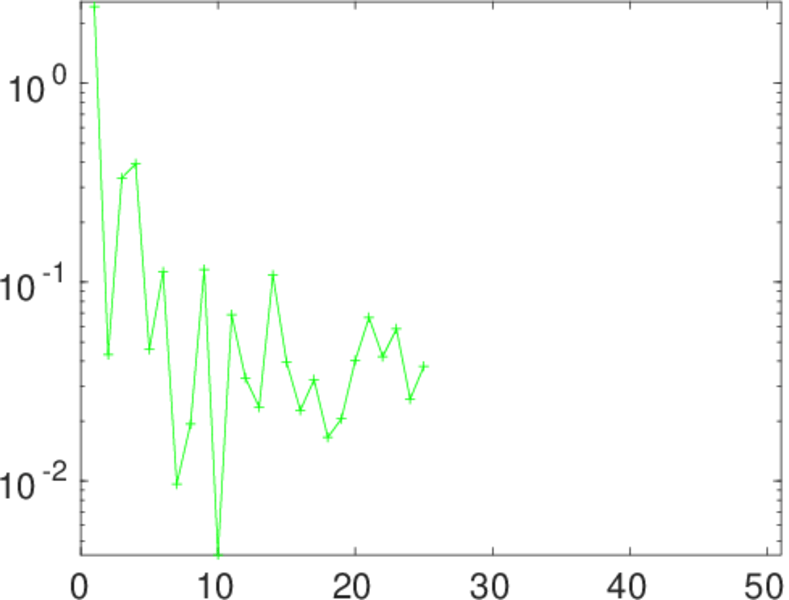
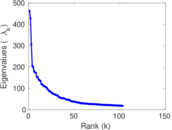
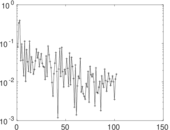
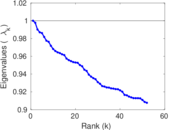
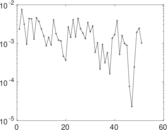
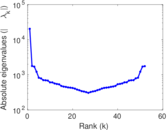
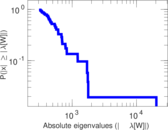
Matrix decompositions plots


Downloads
References
|
[1]
|
Jérôme Kunegis.
KONECT – The Koblenz Network Collection.
In Proc. Int. Conf. on World Wide Web Companion, pages
1343–1350, 2013.
[ http ]
|
|
[2]
|
Wikimedia Foundation.
Wikimedia downloads.
http://dumps.wikimedia.org/, January 2010.
|
 KONECT ‣ Networks ‣
Buy Me a Coffee
KONECT ‣ Networks ‣
Buy Me a Coffee