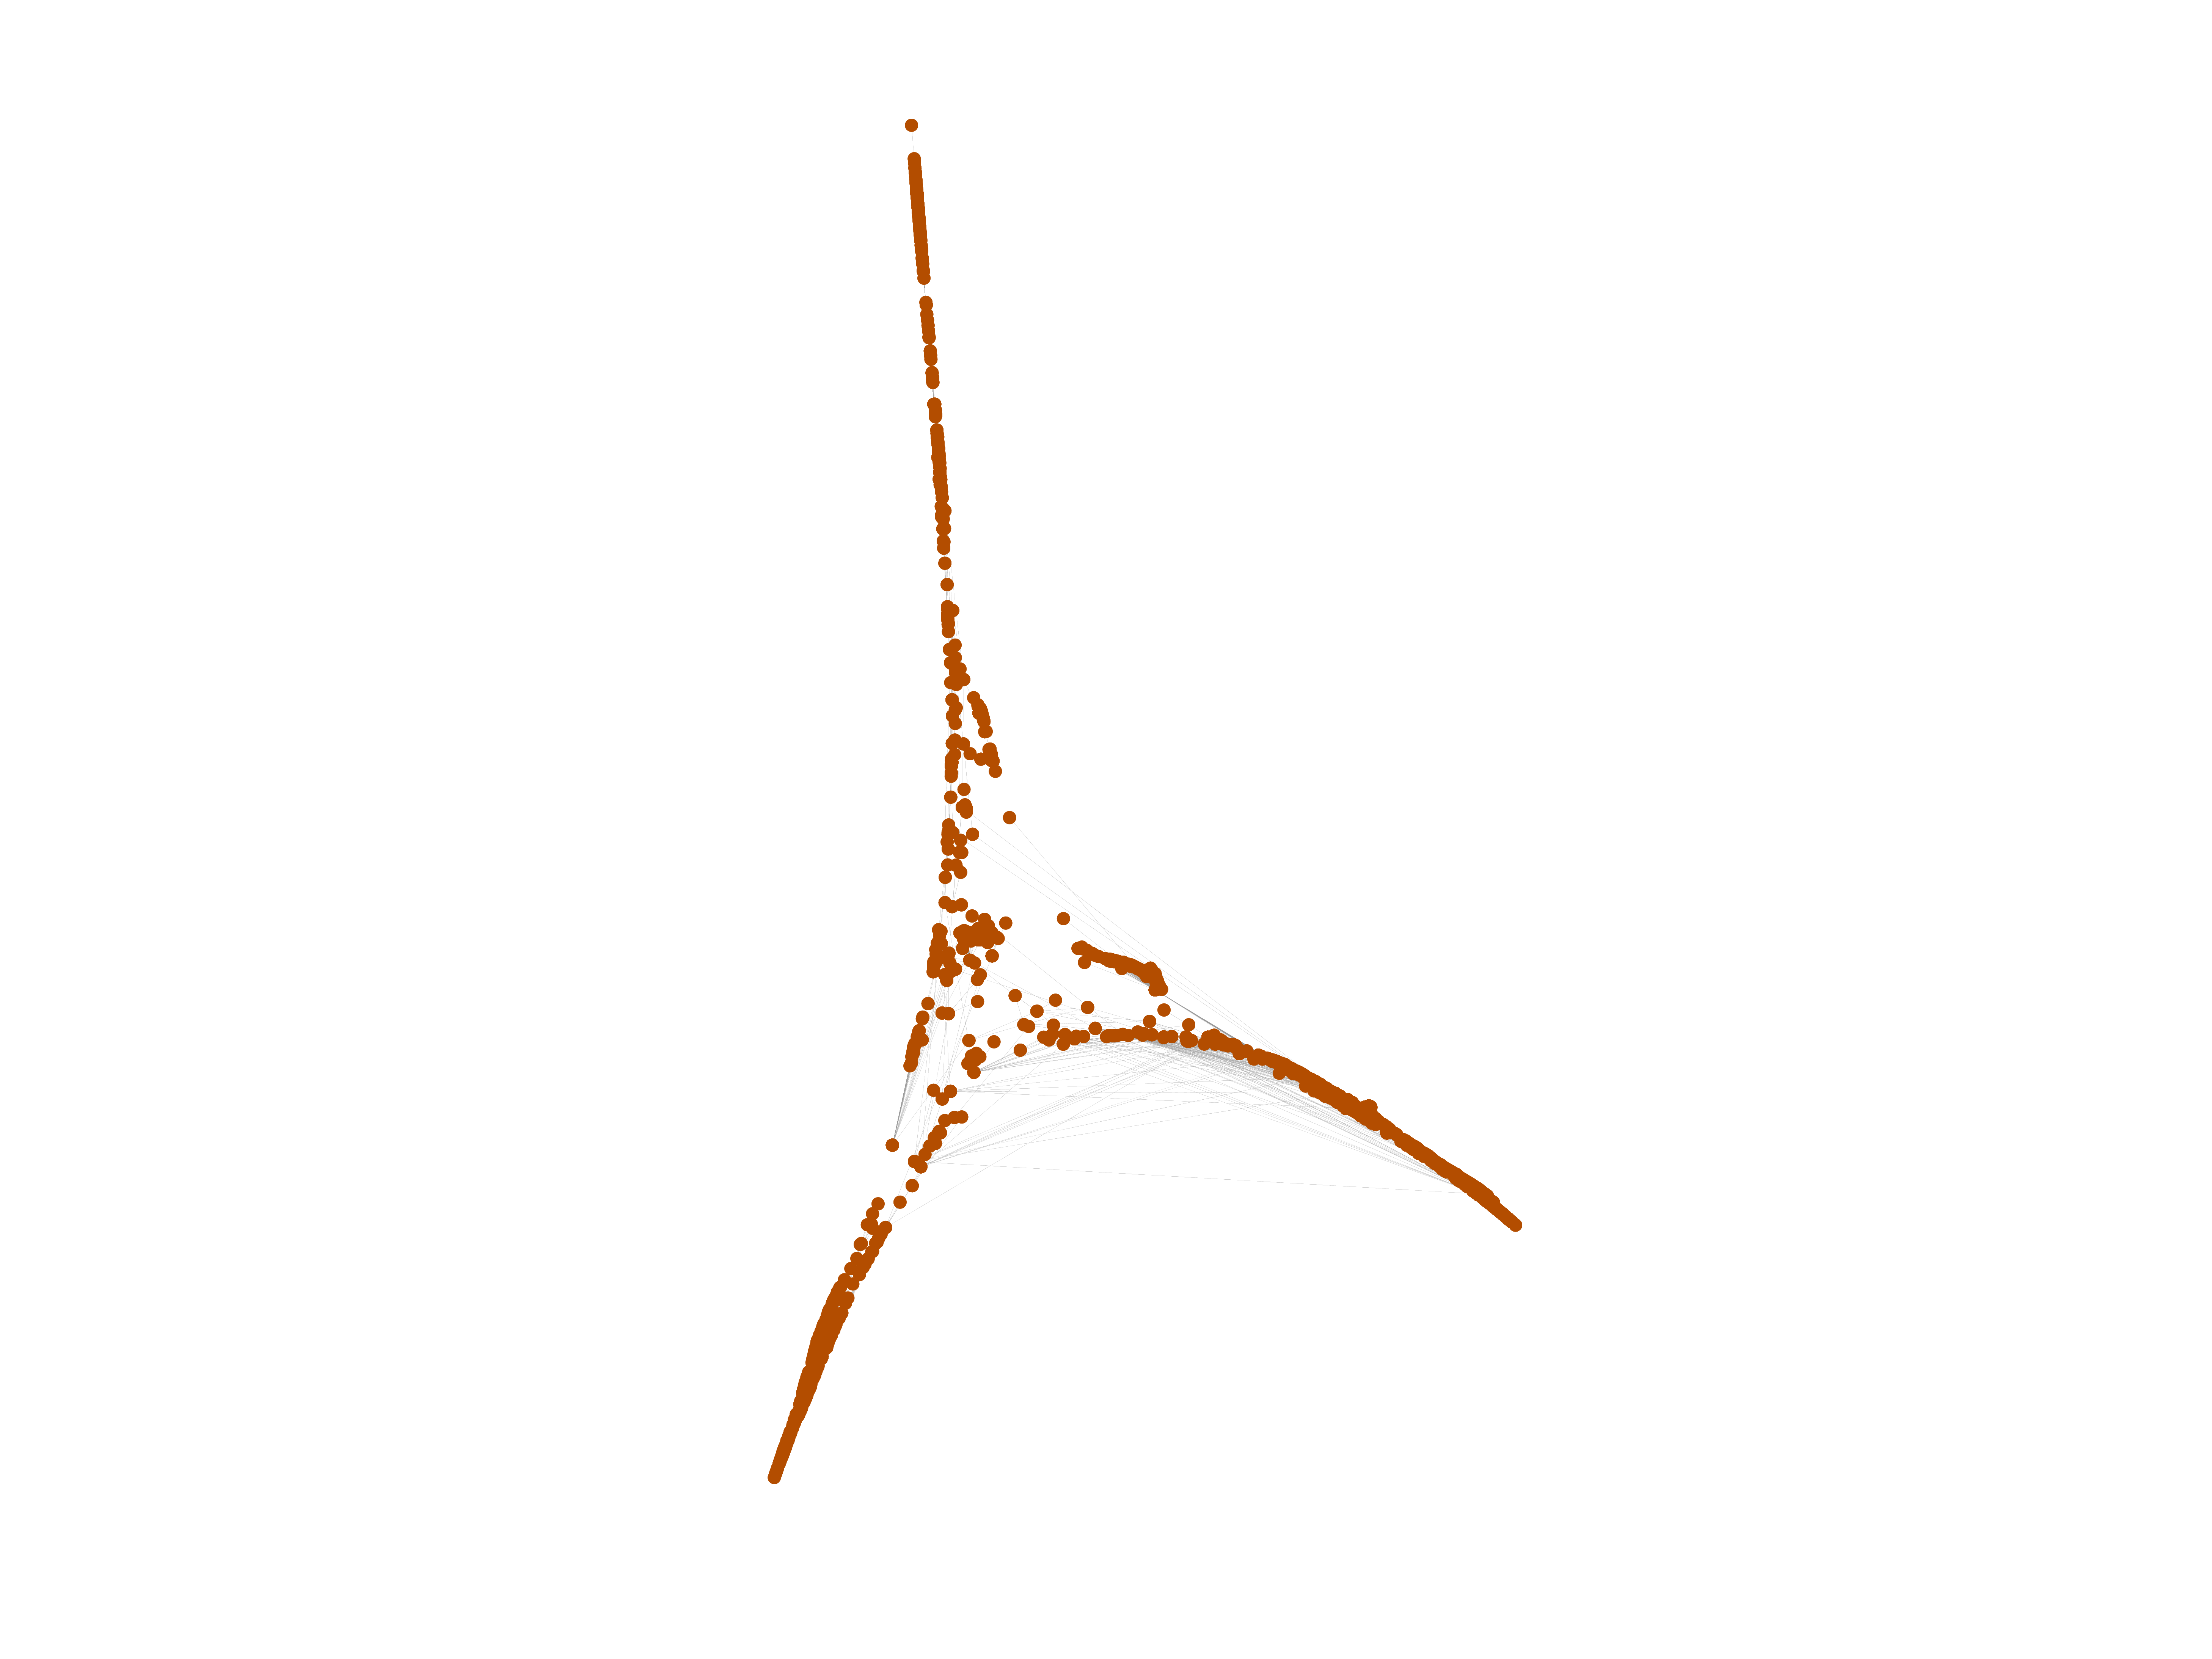
Wiktionary edits (so)
This is the bipartite edit network of the Somali Wiktionary. It contains users
and pages from the Somali Wiktionary, connected by edit events. Each edge
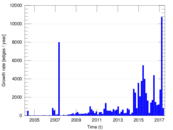
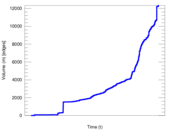
represents an edit. The dataset includes the timestamp of each edit.
Metadata
Statistics
| Size | n = | 3,378
|
| Left size | n1 = | 192
|
| Right size | n2 = | 3,186
|
| Volume | m = | 12,339
|
| Unique edge count | m̿ = | 6,141
|
| Wedge count | s = | 2,447,554
|
| Claw count | z = | 1,041,773,386
|
| Cross count | x = | 372,916,918,109
|
| Square count | q = | 1,325,104
|
| 4-Tour count | T4 = | 20,403,638
|
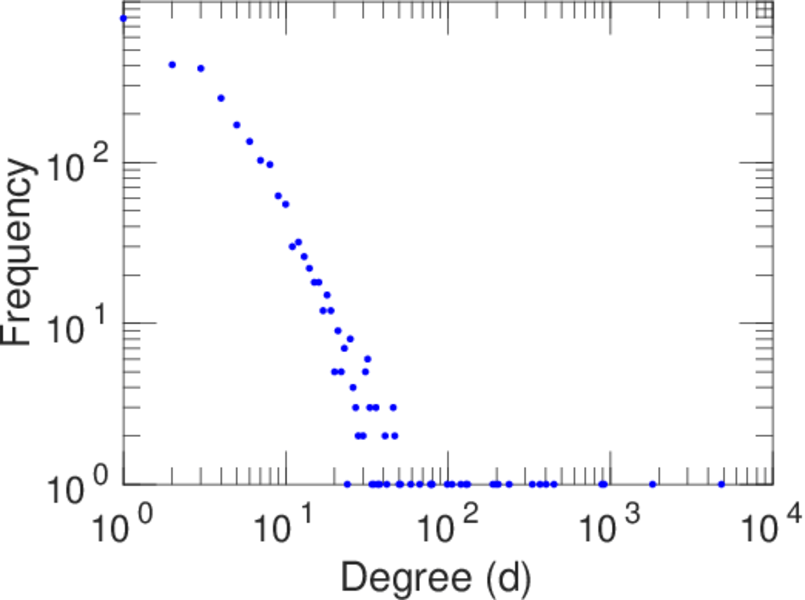
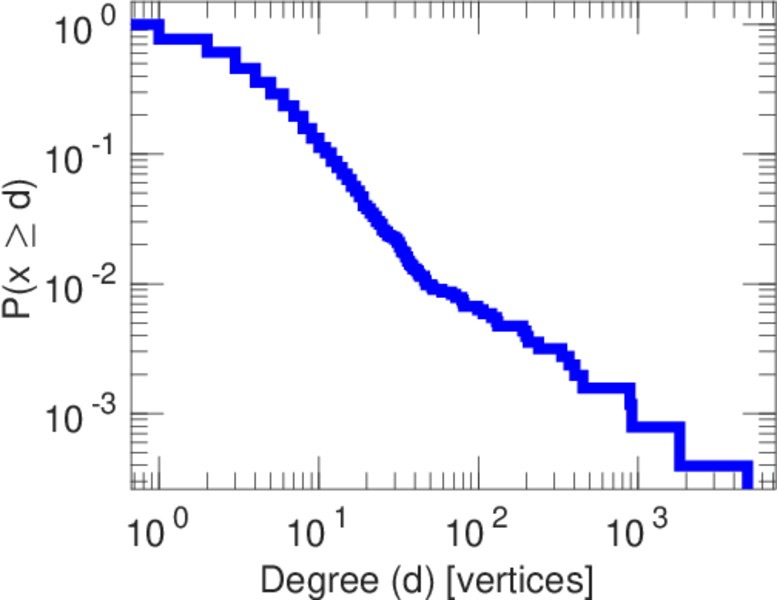
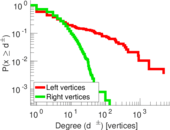
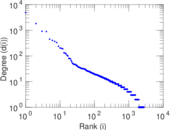
| Maximum degree | dmax = | 4,841
|
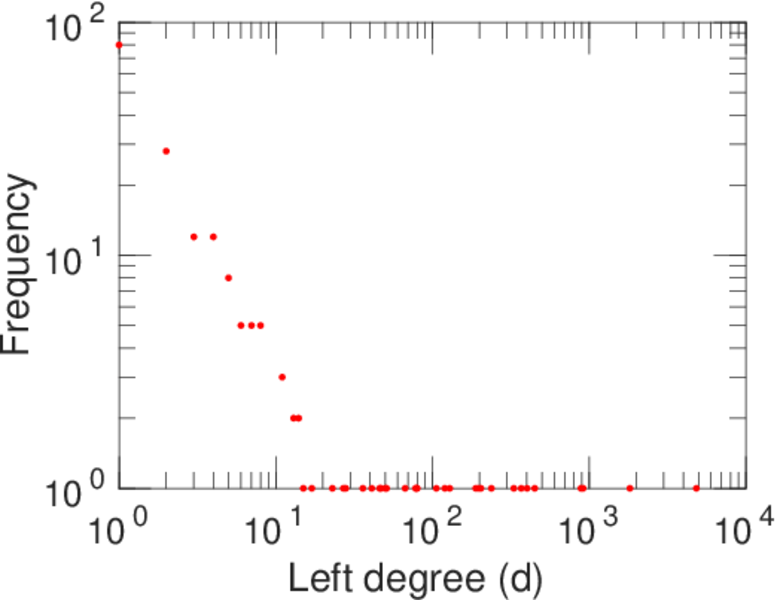
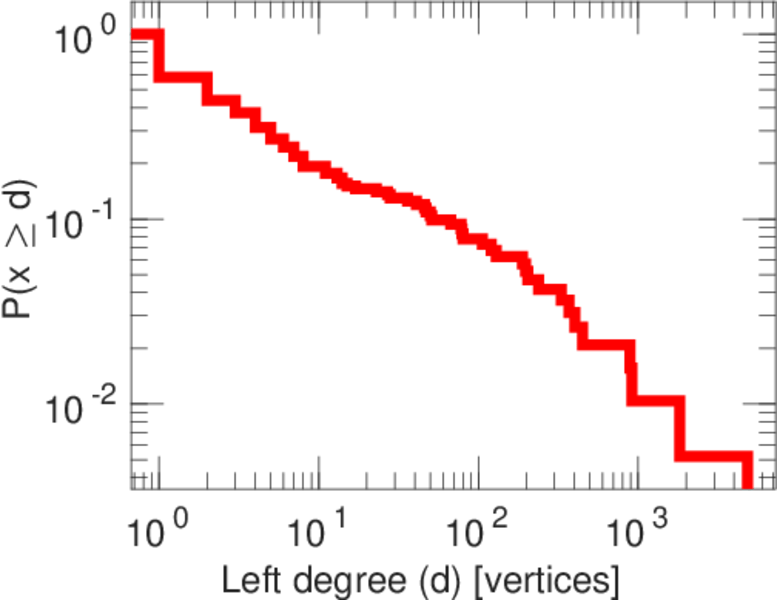
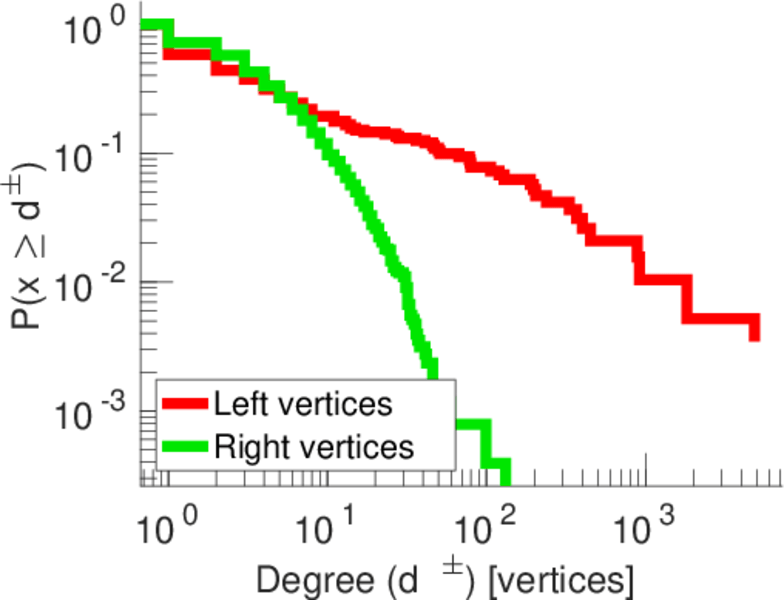
| Maximum left degree | d1max = | 4,841
|
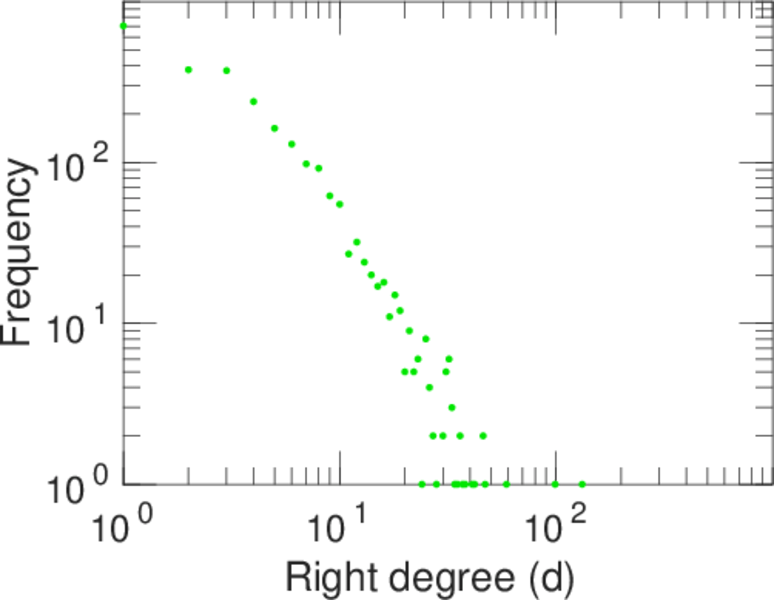
| Maximum right degree | d2max = | 132
|
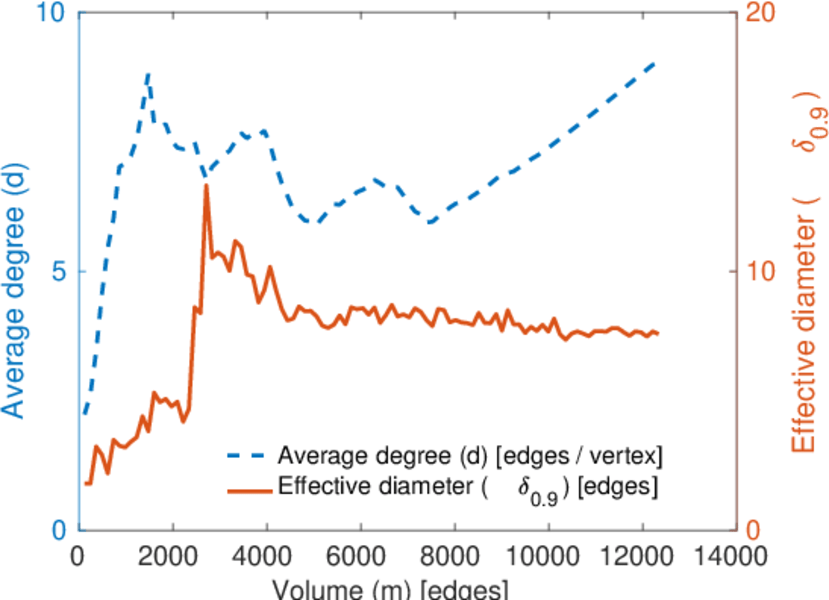
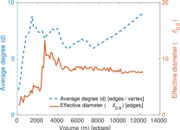
| Average degree | d = | 7.305 51
|
| Average left degree | d1 = | 64.265 6
|
| Average right degree | d2 = | 3.872 88
|
| Fill | p = | 0.010 039 0
|
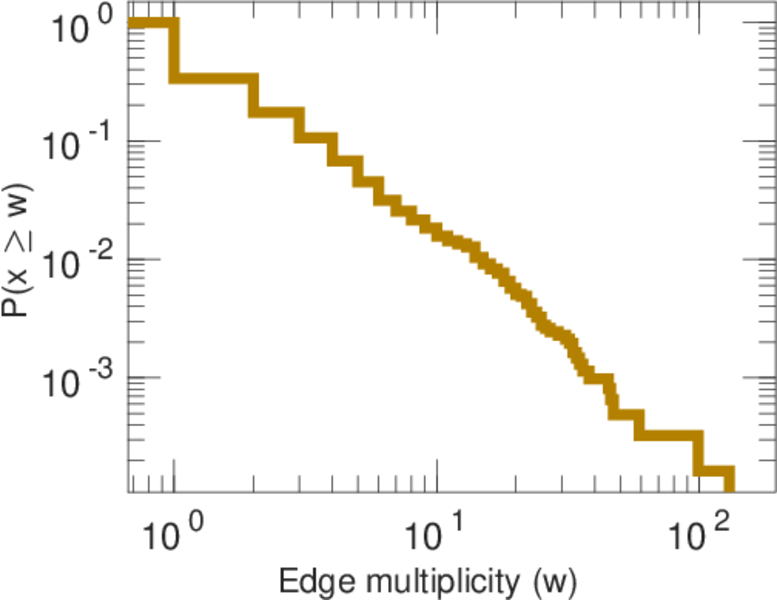
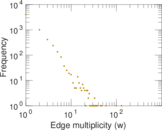
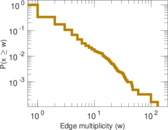
| Average edge multiplicity | m̃ = | 2.009 28
|
| Size of LCC | N = | 2,434
|
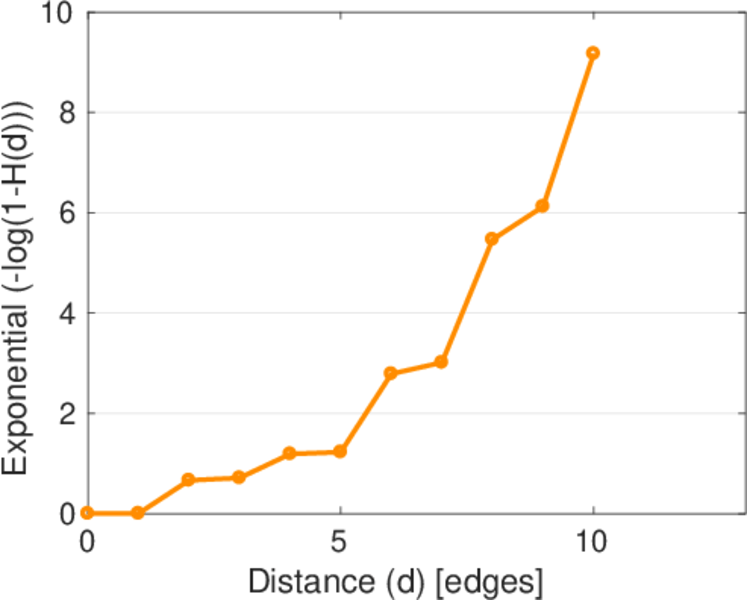
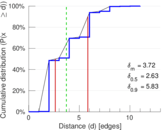
| Diameter | δ = | 12
|
| 50-Percentile effective diameter | δ0.5 = | 2.626 58
|
| 90-Percentile effective diameter | δ0.9 = | 5.834 41
|
| Median distance | δM = | 3
|
| Mean distance | δm = | 3.718 54
|
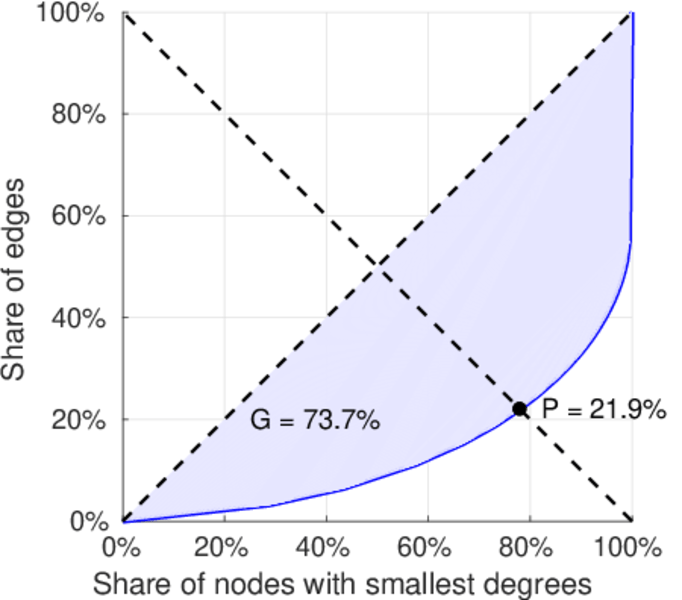
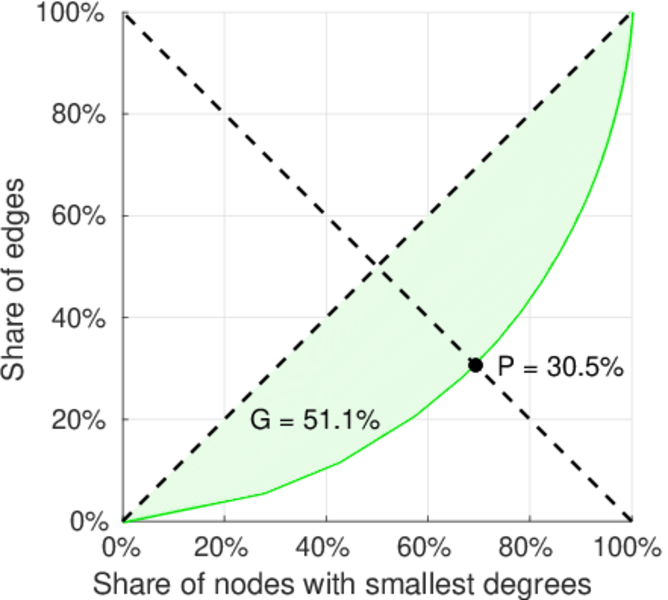
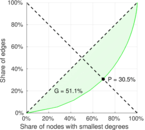
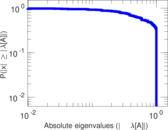
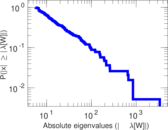
| Gini coefficient | G = | 0.732 033
|
| Balanced inequality ratio | P = | 0.221 047
|
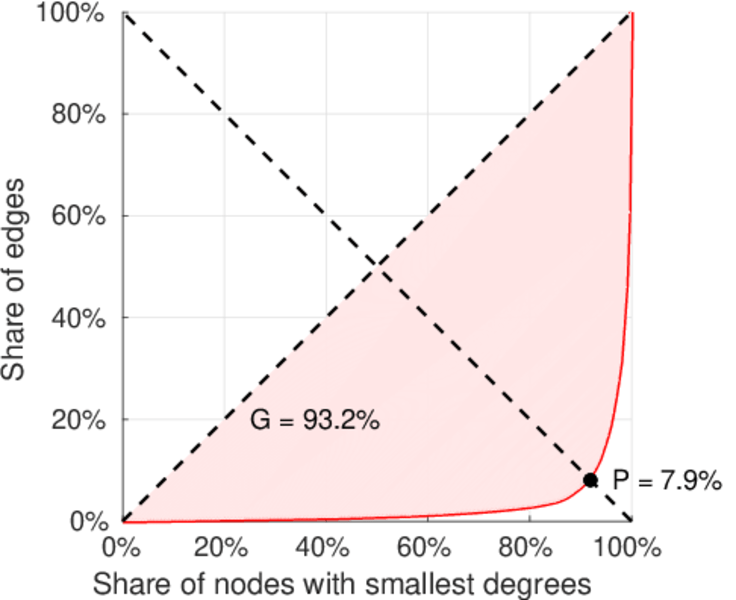
| Left balanced inequality ratio | P1 = | 0.079 260 9
|
| Right balanced inequality ratio | P2 = | 0.304 887
|
| Relative edge distribution entropy | Her = | 0.746 825
|
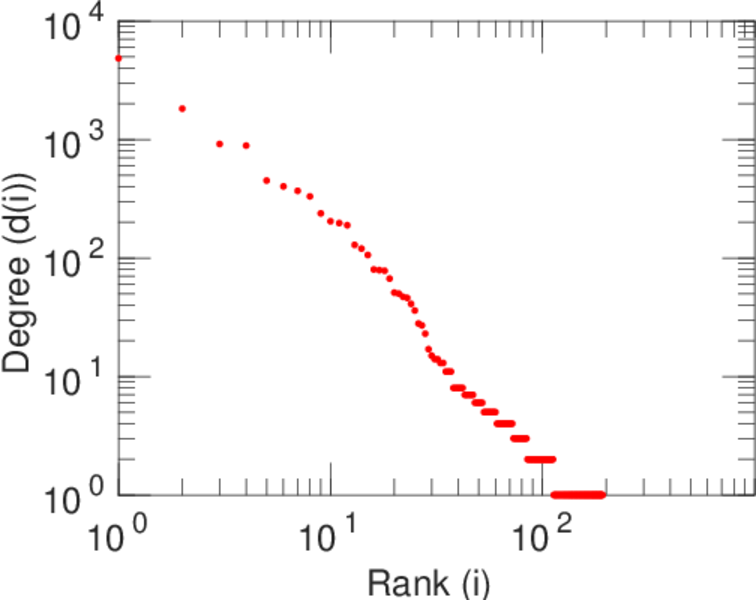
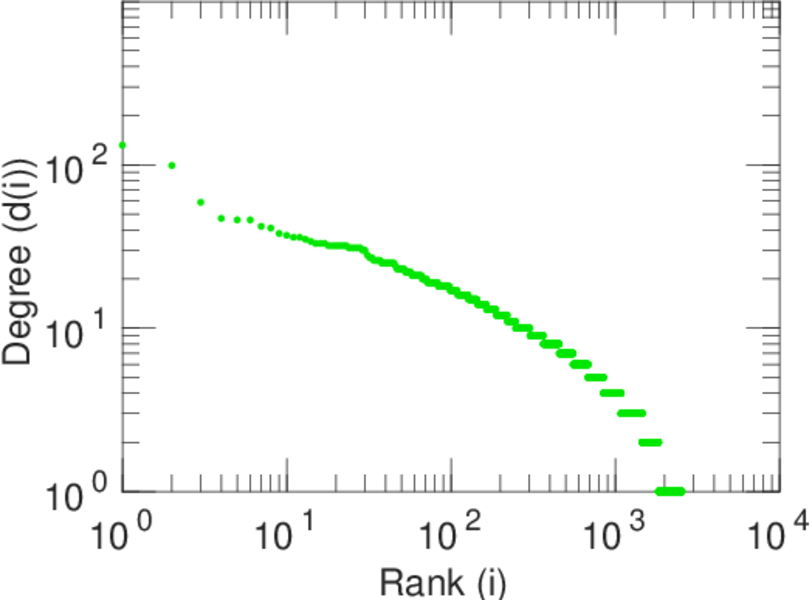
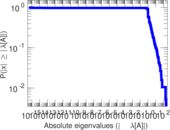
| Power law exponent | γ = | 2.387 38
|
| Tail power law exponent | γt = | 3.121 00
|
| Tail power law exponent with p | γ3 = | 3.121 00
|
| p-value | p = | 0.000 00
|
| Left tail power law exponent with p | γ3,1 = | 1.631 00
|
| Left p-value | p1 = | 0.522 000
|
| Right tail power law exponent with p | γ3,2 = | 4.211 00
|
| Right p-value | p2 = | 0.029 000 0
|
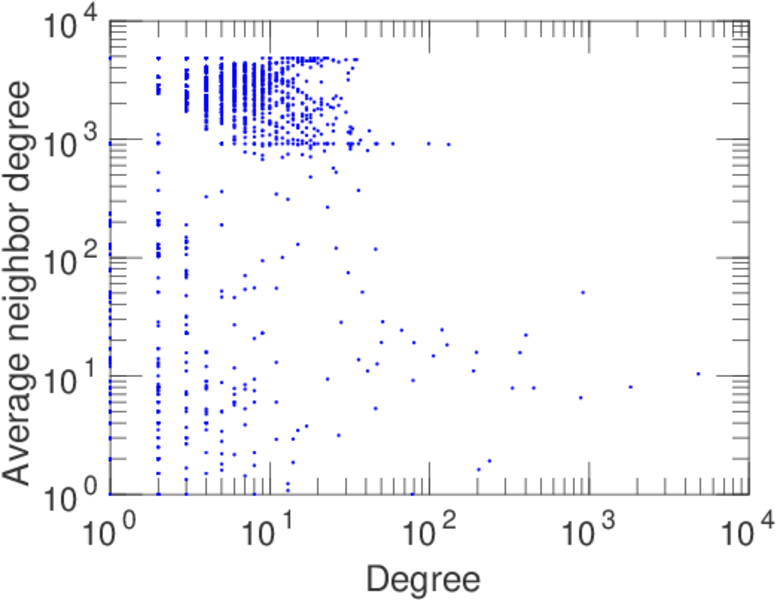
| Degree assortativity | ρ = | −0.113 601
|
| Degree assortativity p-value | pρ = | 4.283 64 × 10−19
|
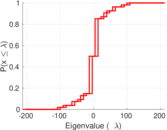
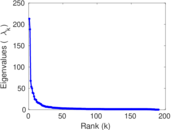
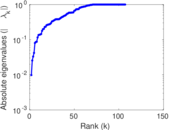
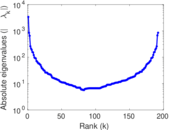
| Spectral norm | α = | 212.914
|
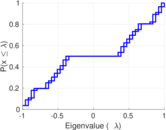
| Algebraic connectivity | a = | 0.009 817 32
|
| Spectral separation | |λ1[A] / λ2[A]| = | 1.131 59
|
| Controllability | C = | 2,365
|
| Relative controllability | Cr = | 0.865 349
|
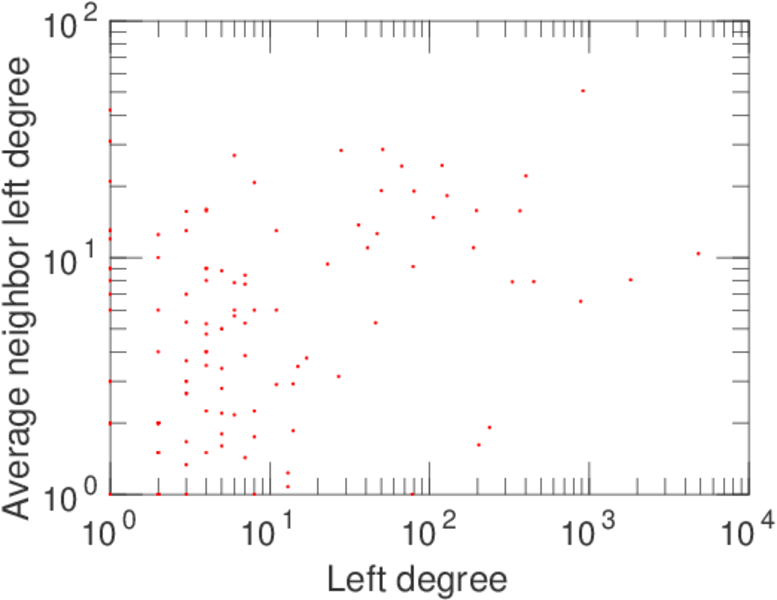
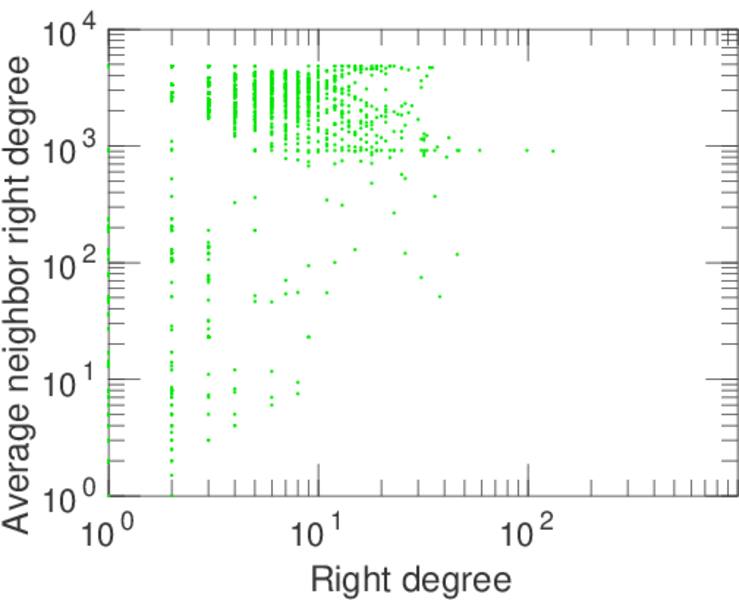
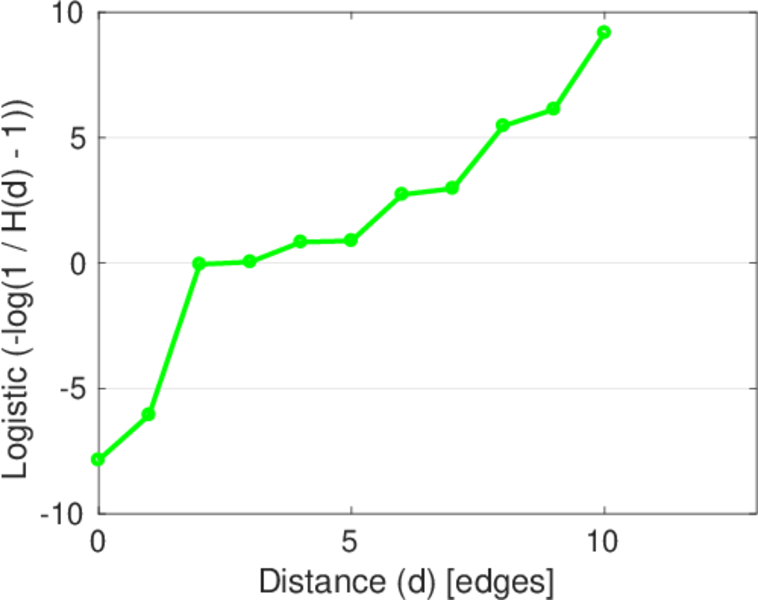
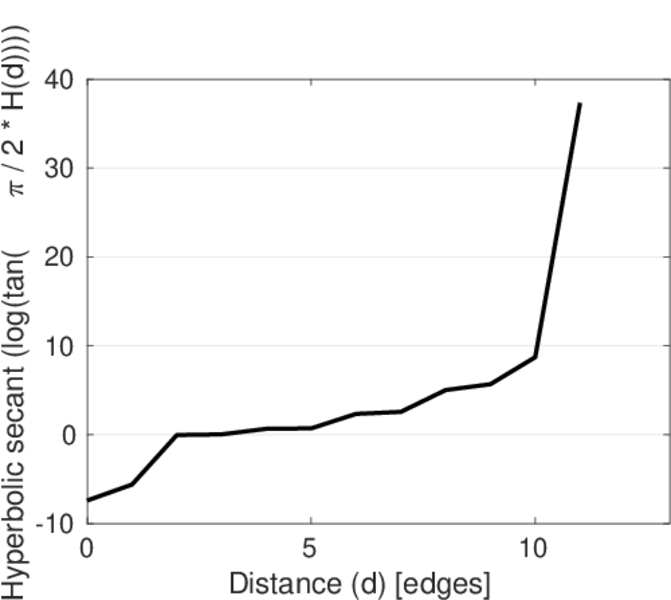
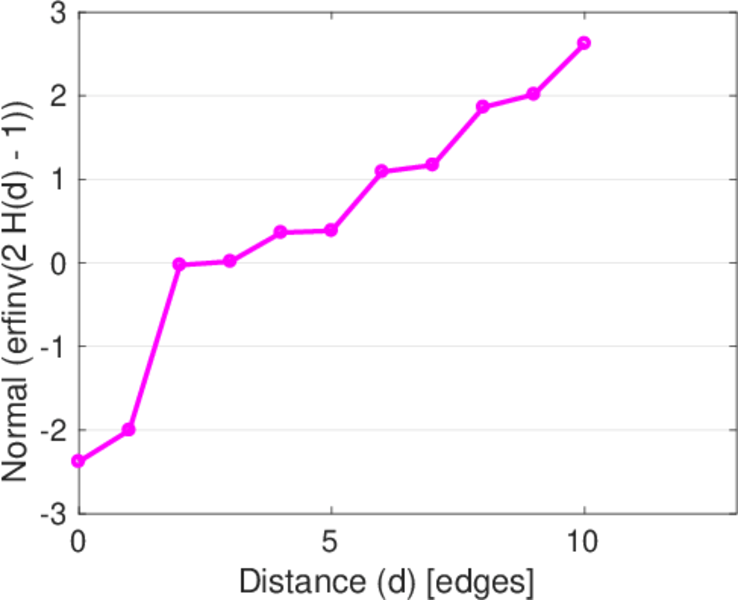
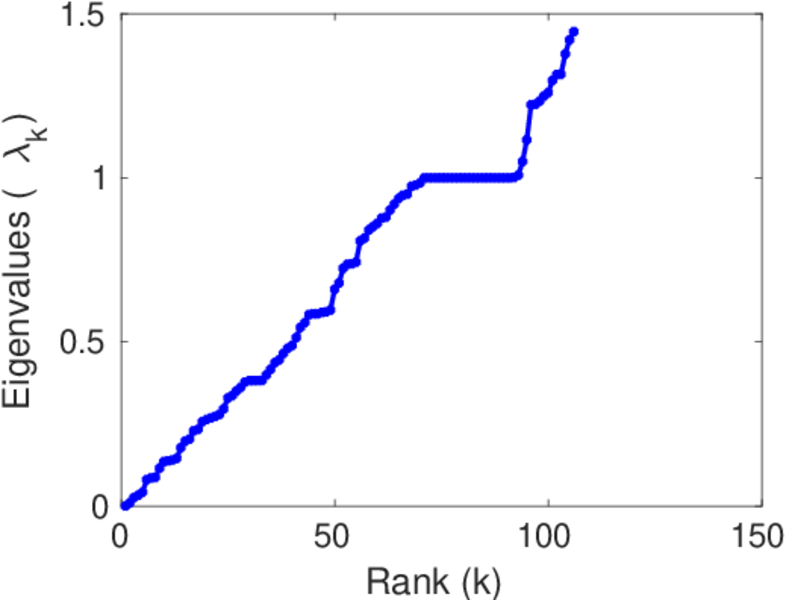
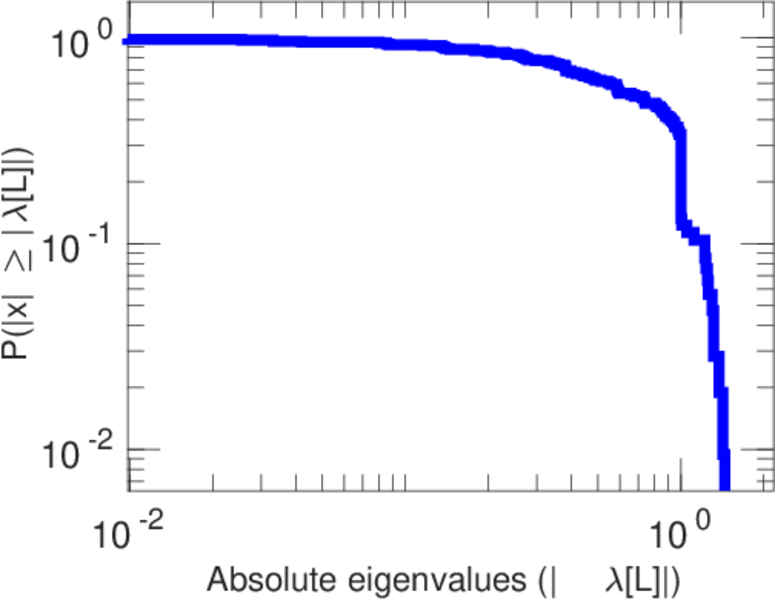
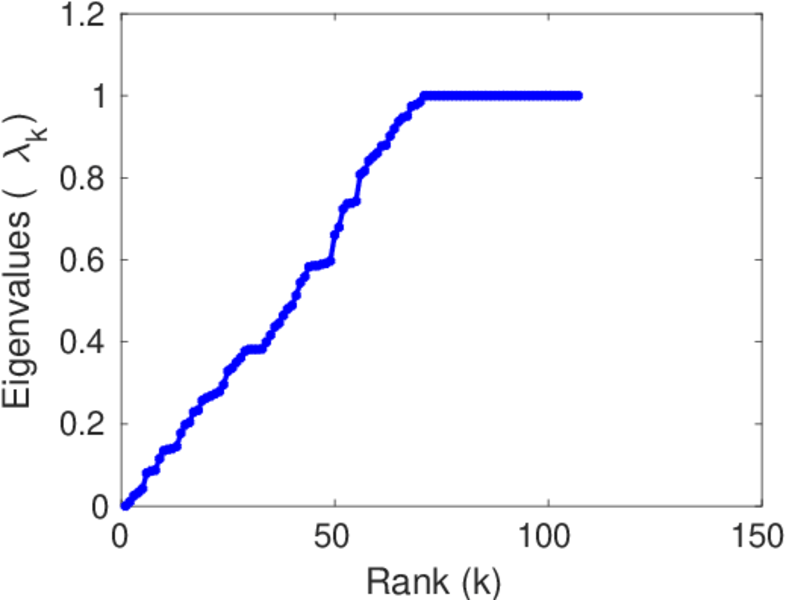
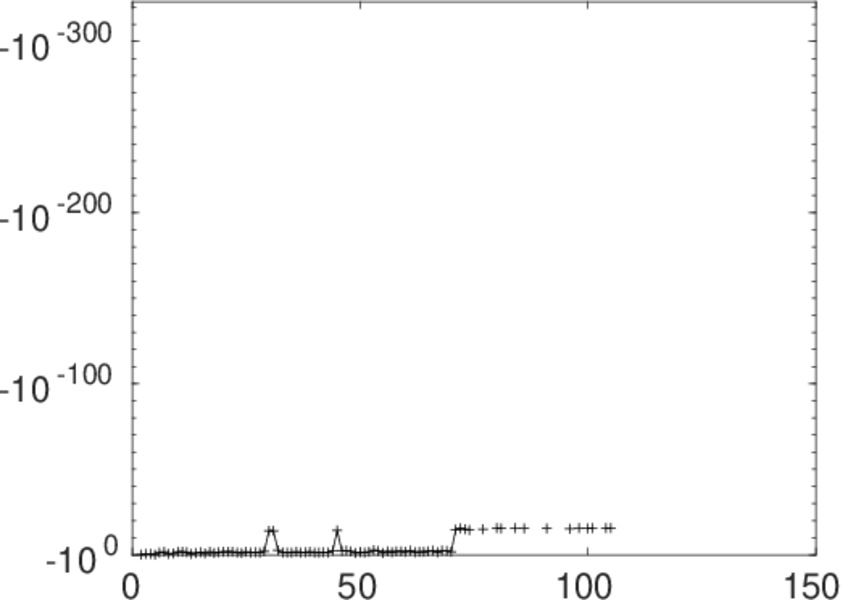
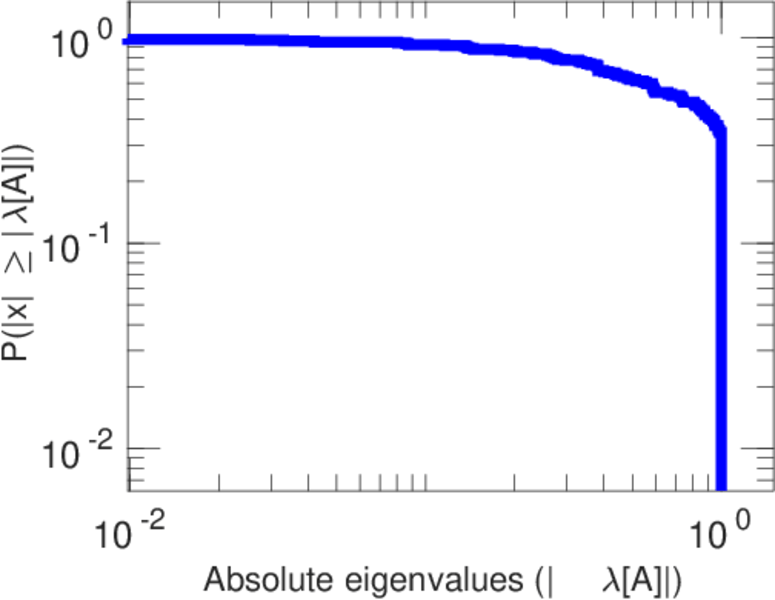
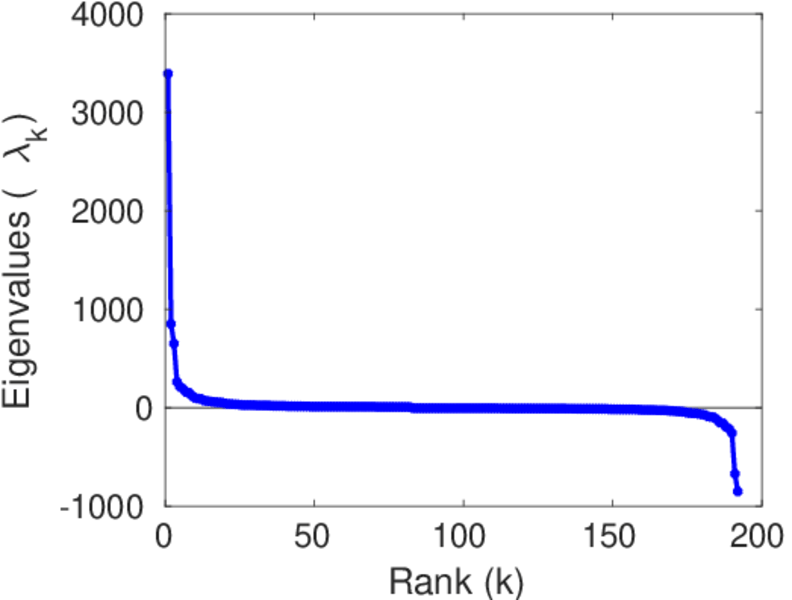
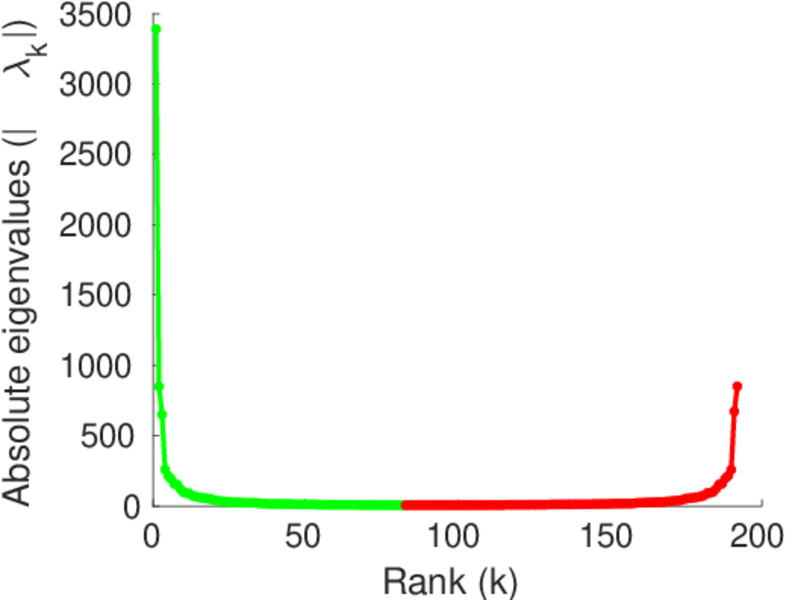
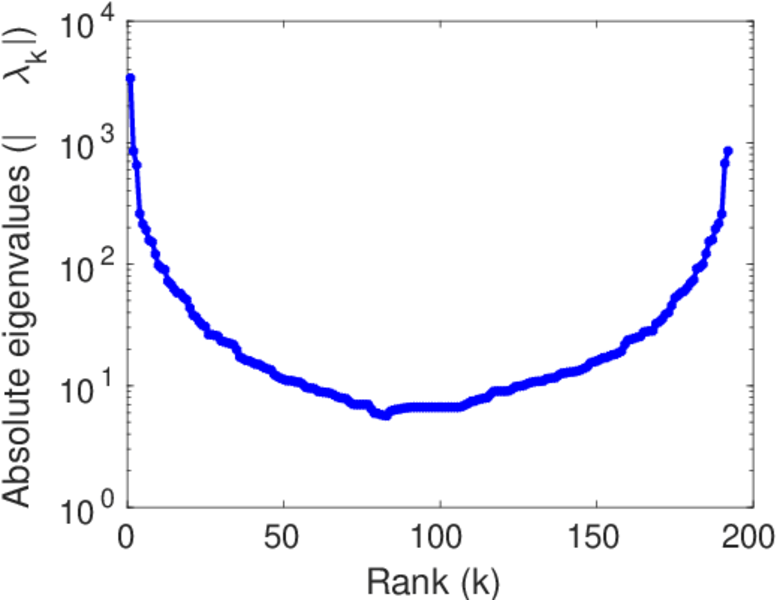
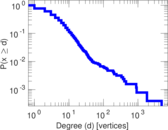
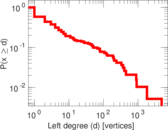
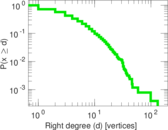
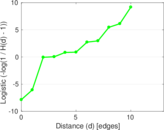
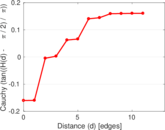
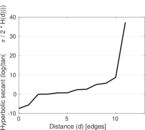
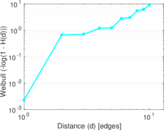
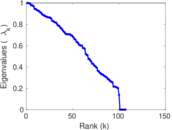
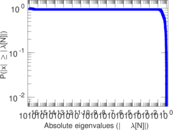
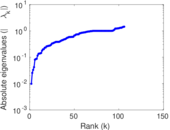
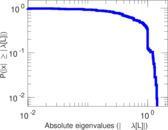
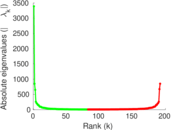
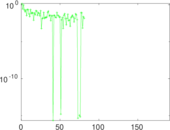
Plots


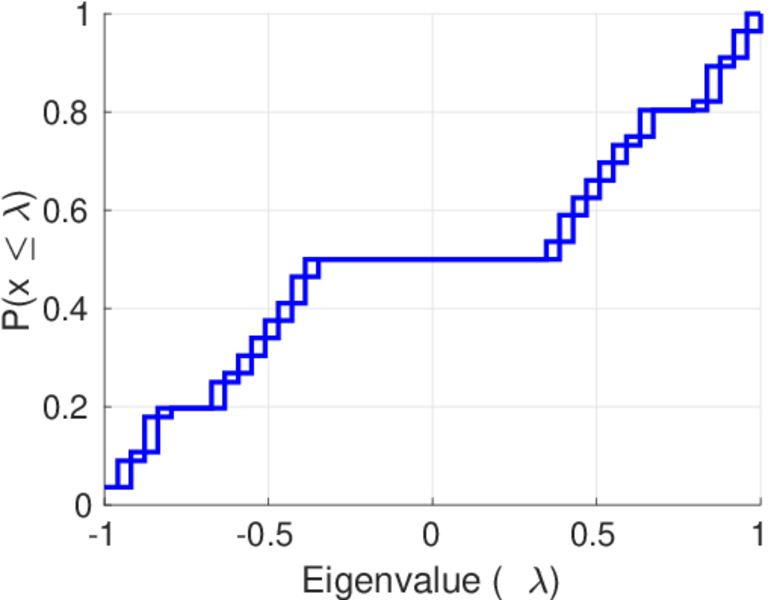
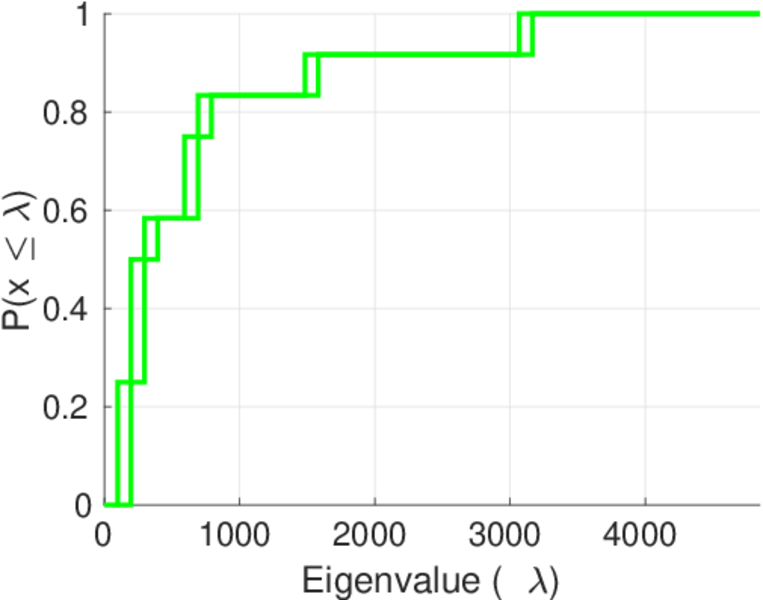
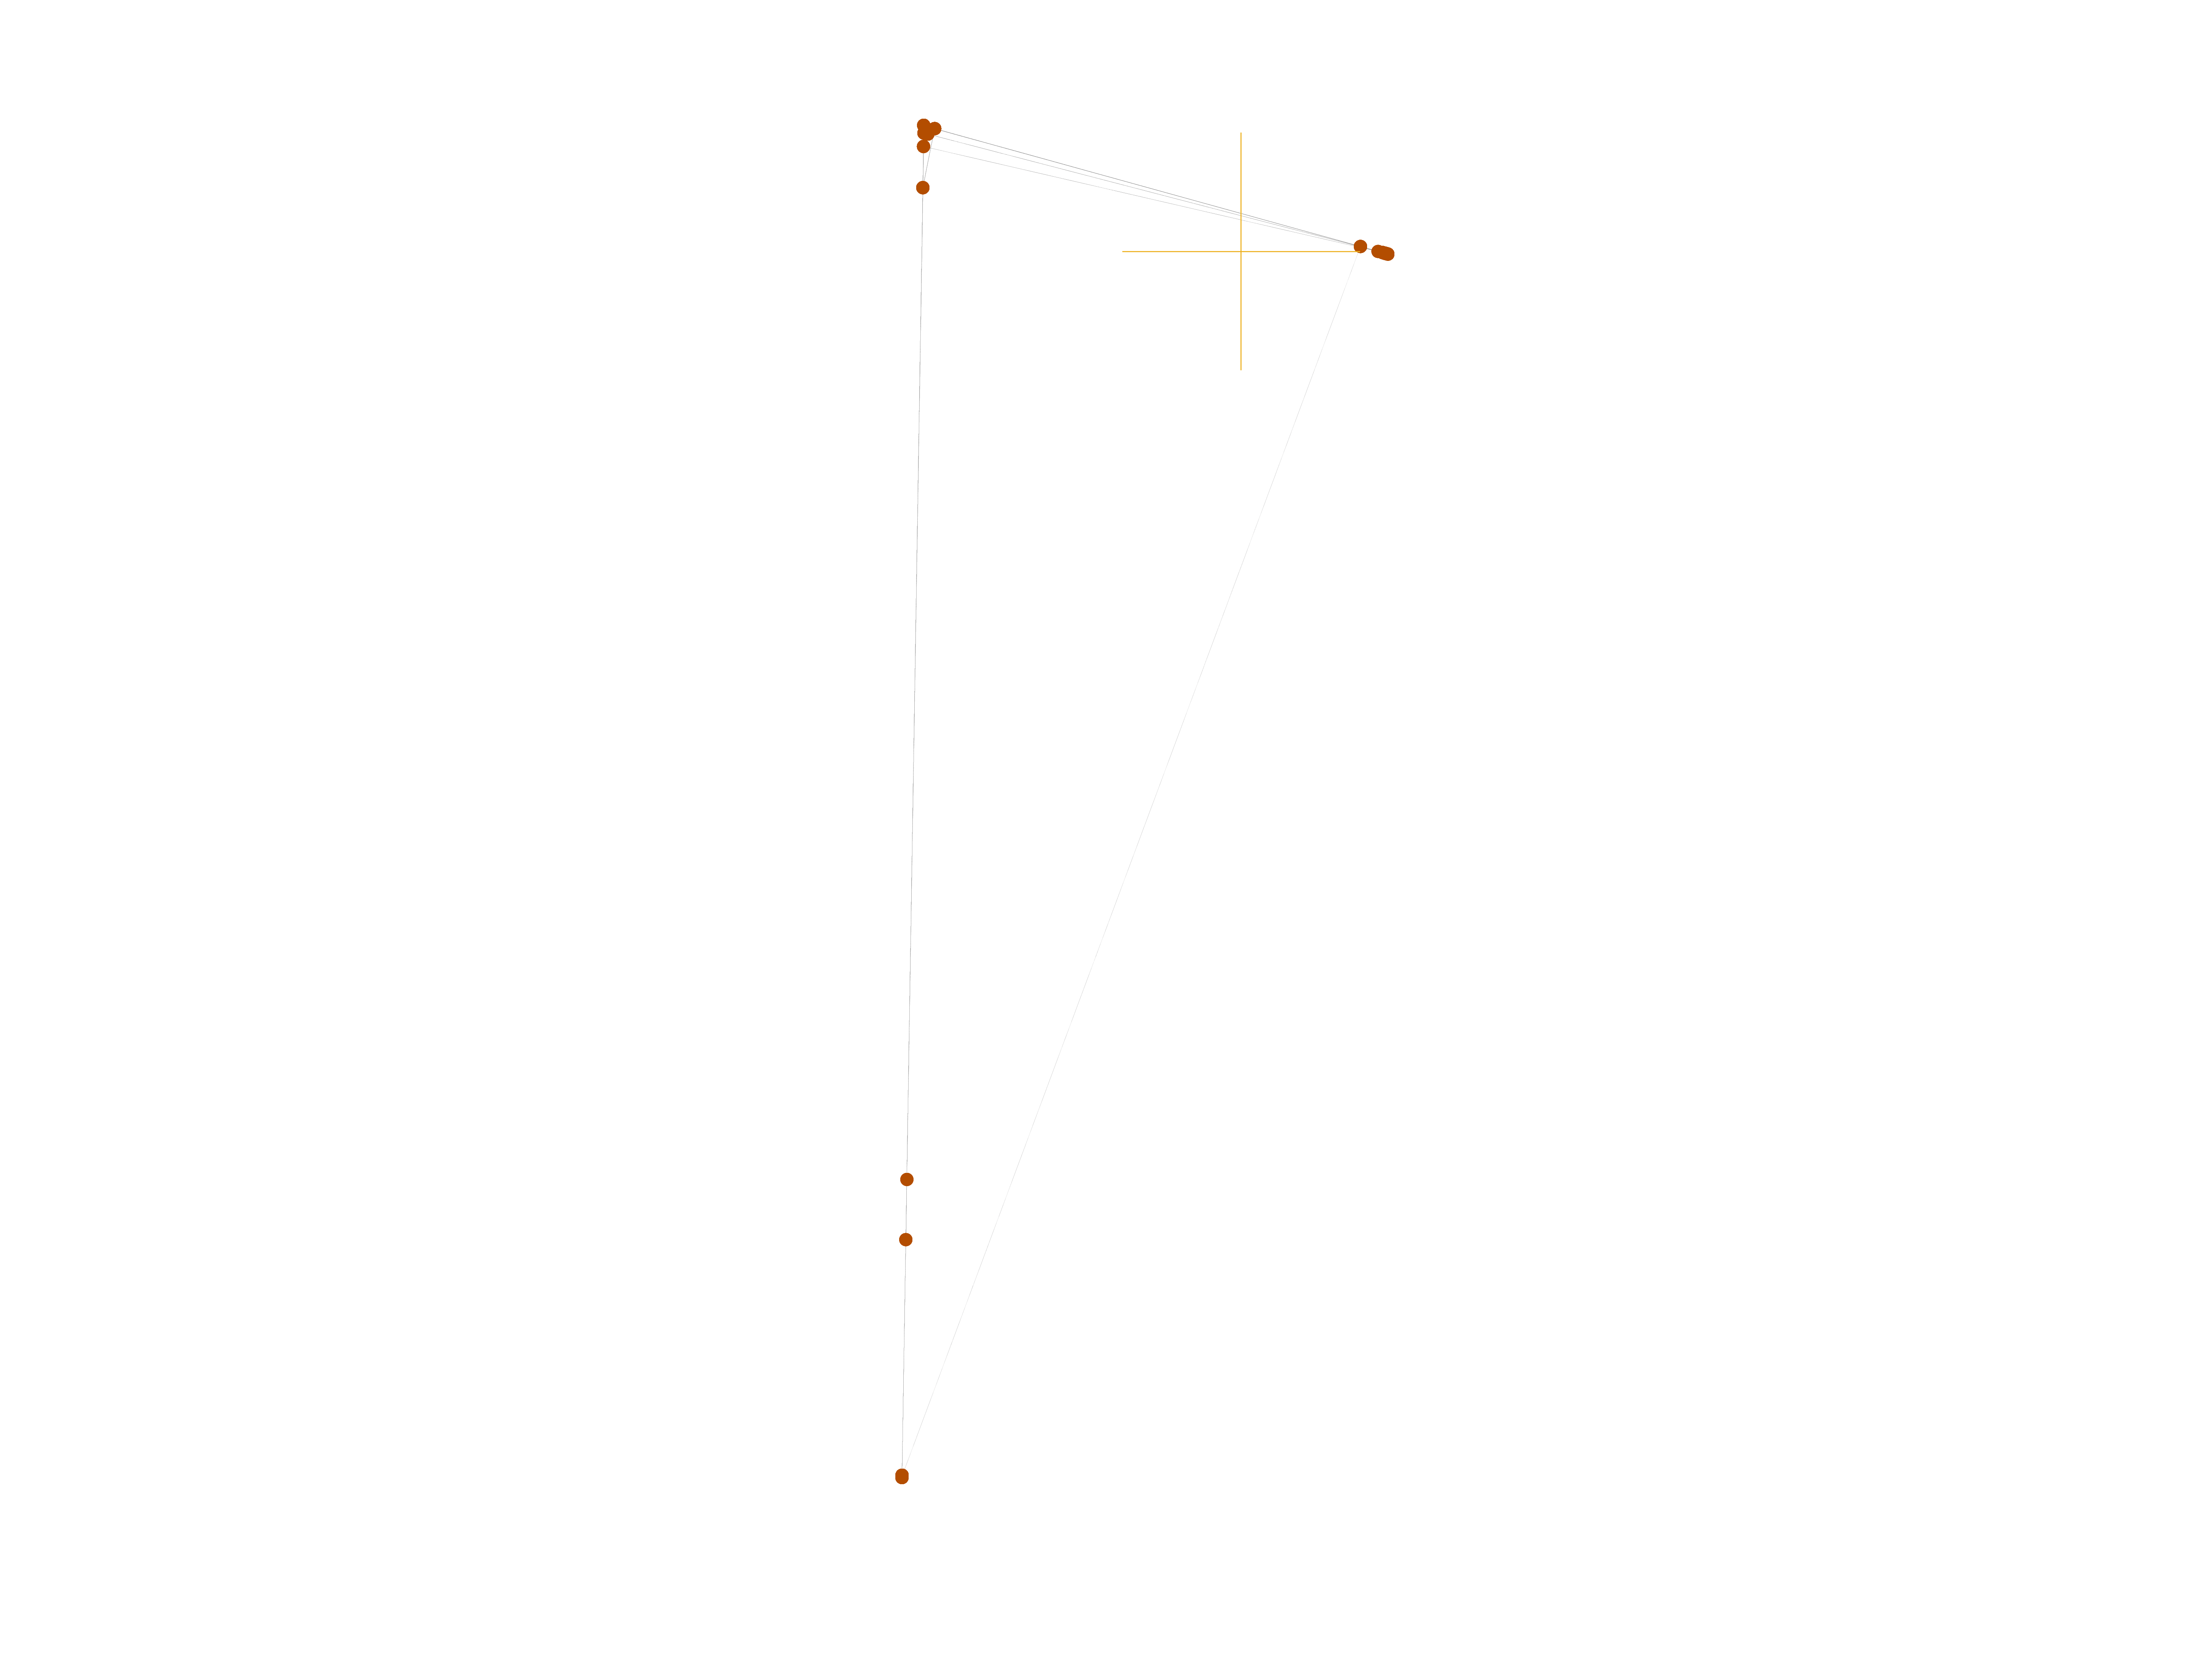
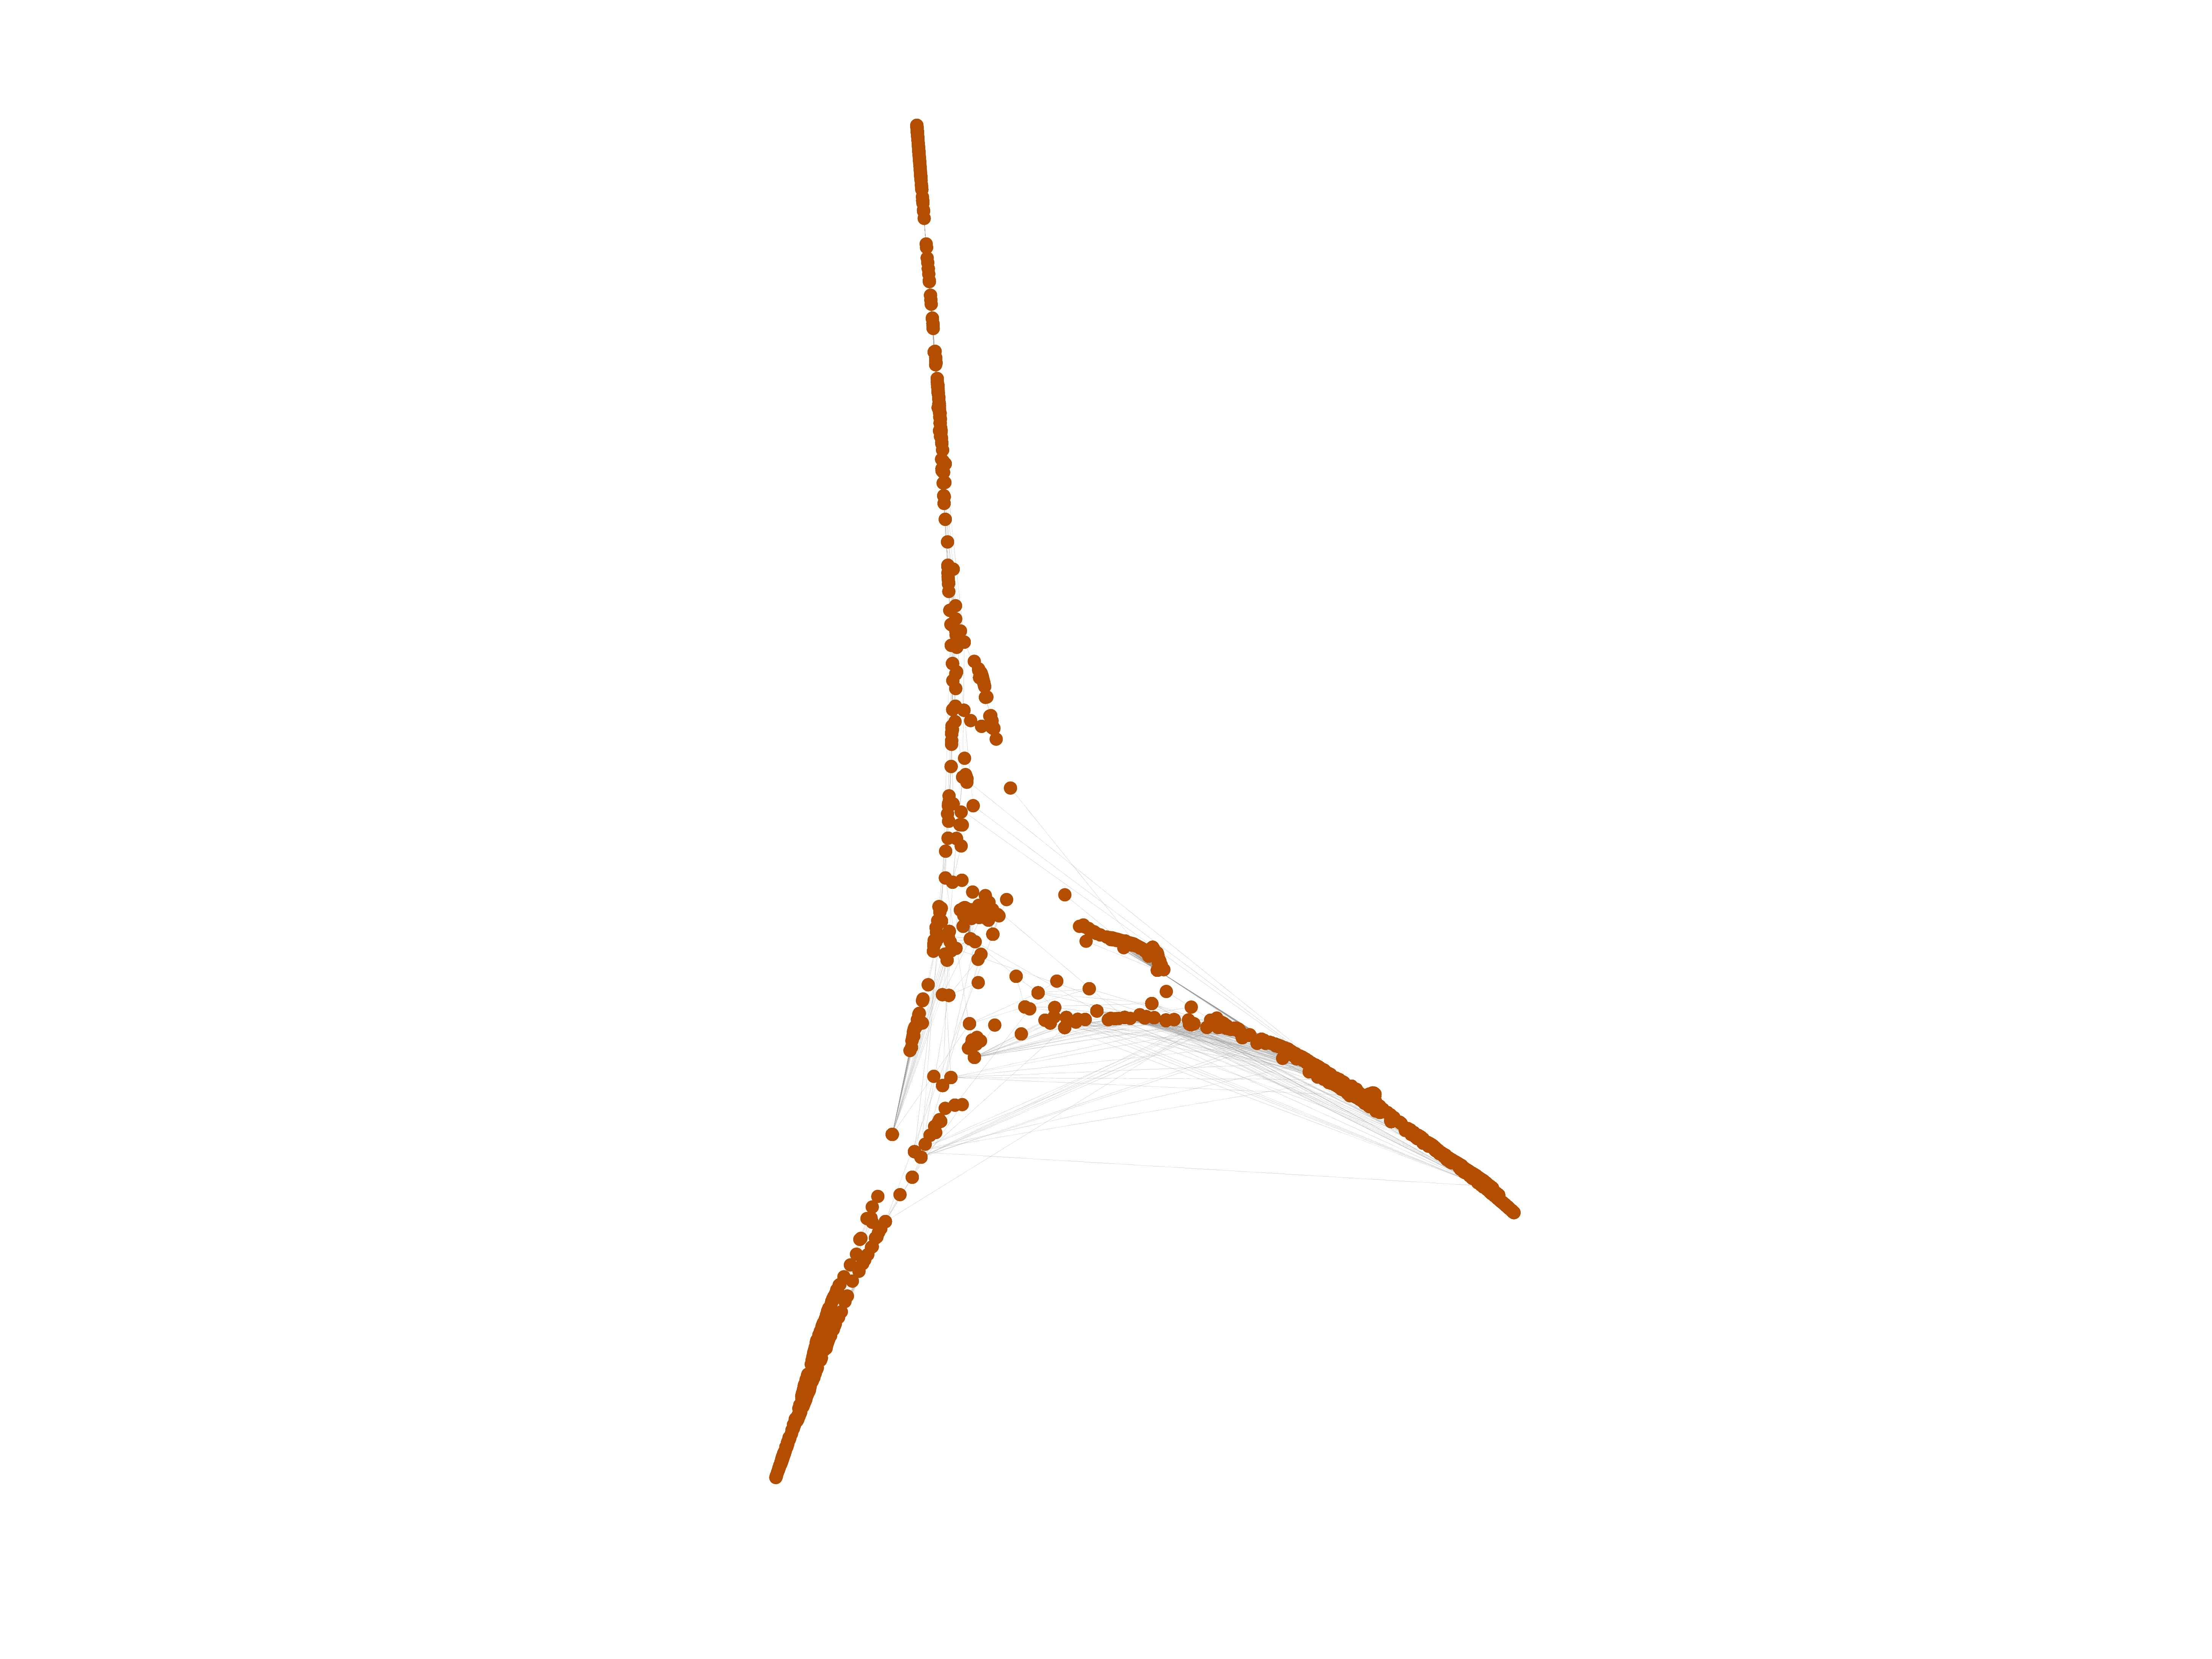
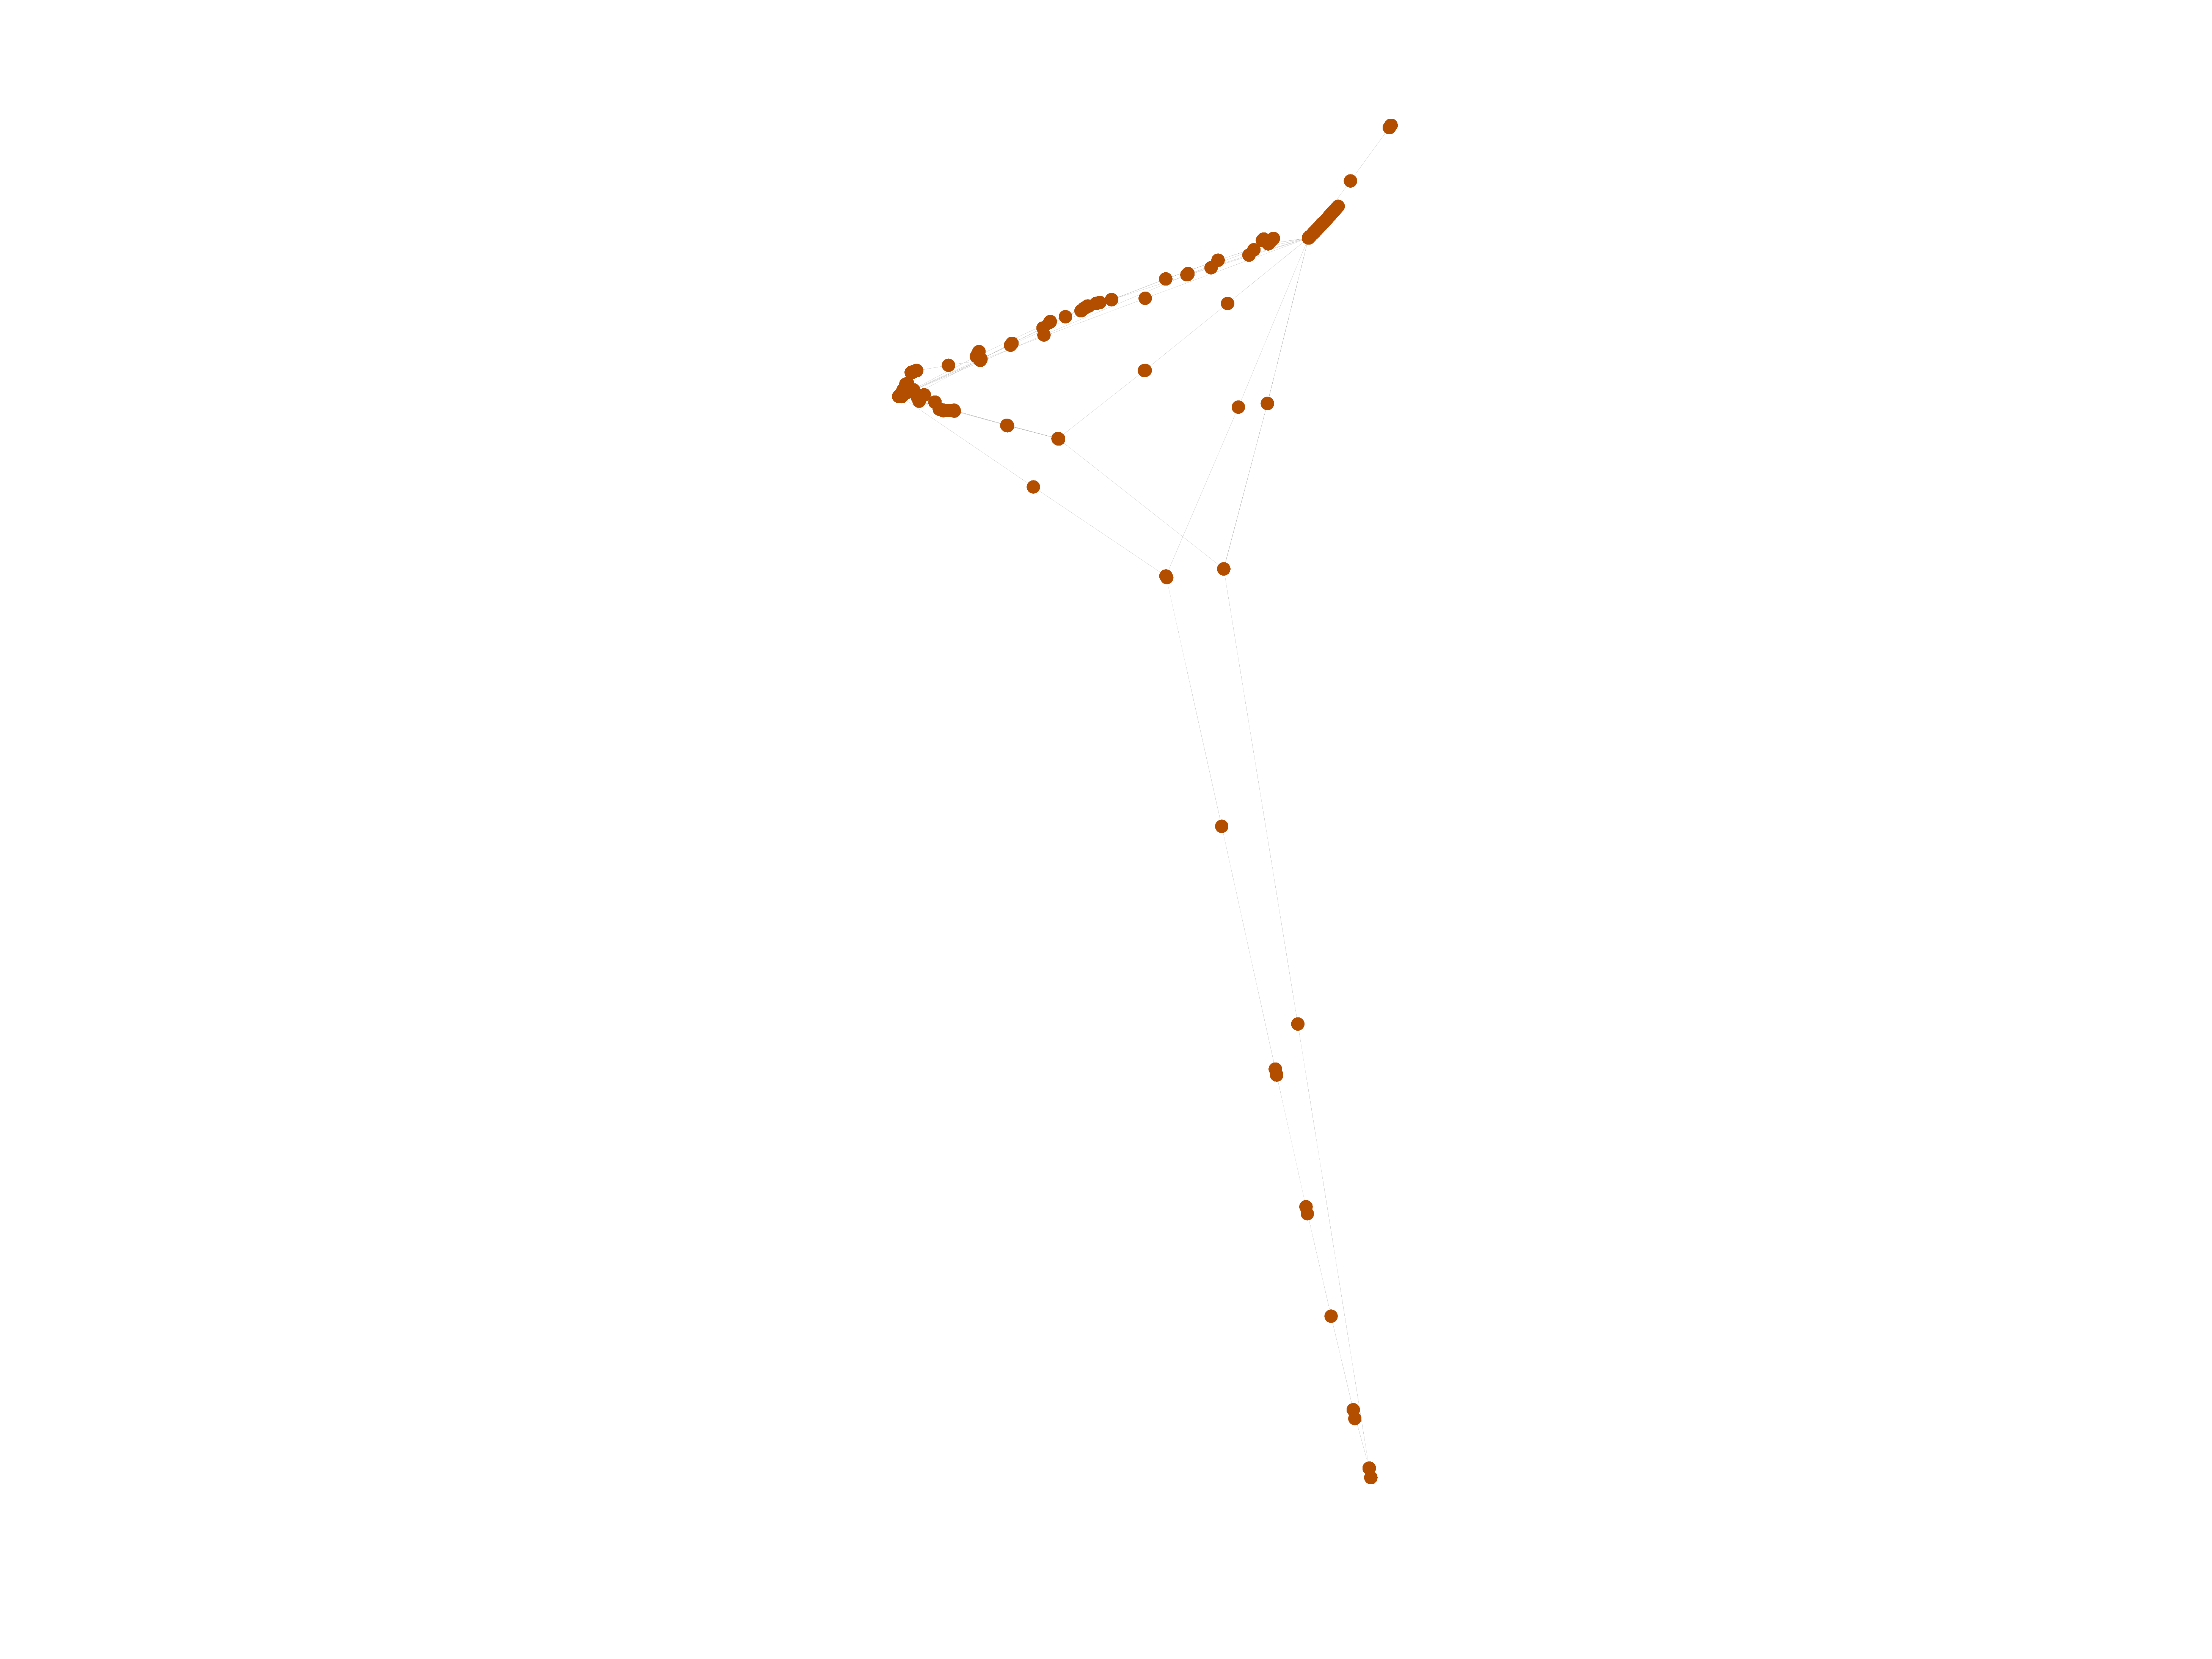
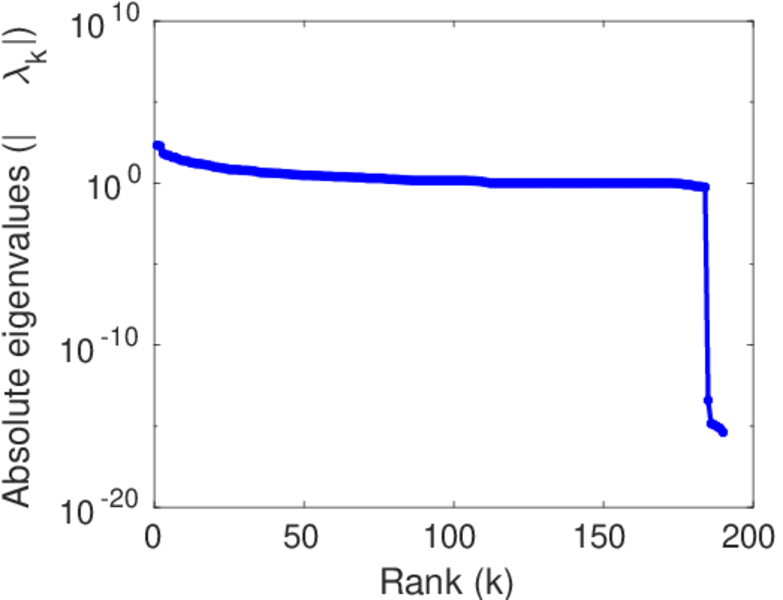
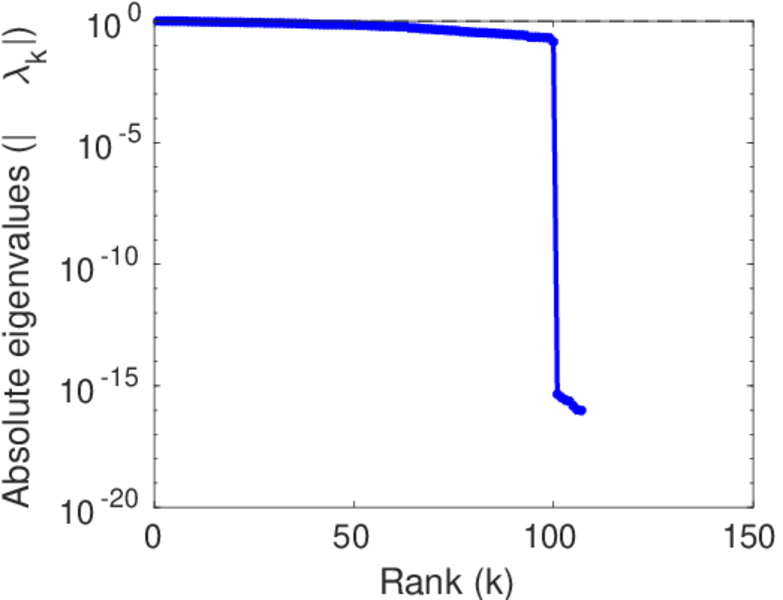
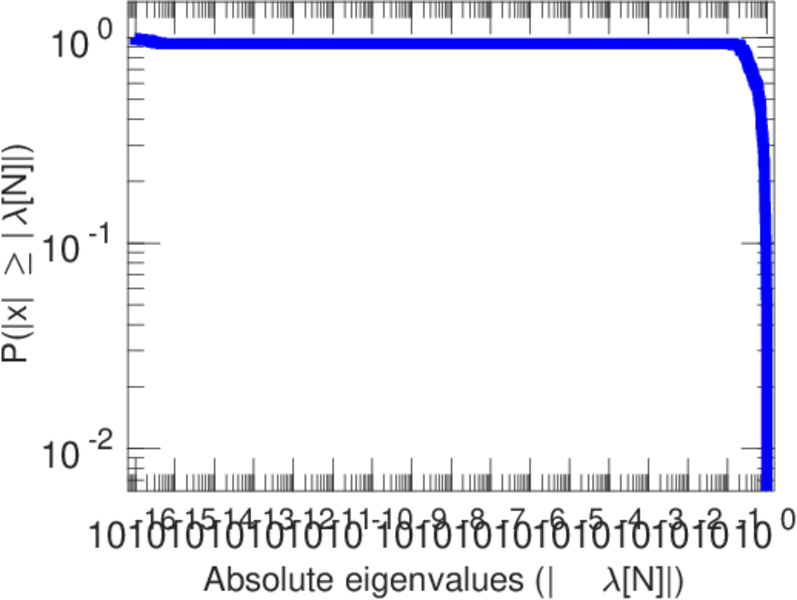
Matrix decompositions plots


Downloads
References
|
[1]
|
Jérôme Kunegis.
KONECT – The Koblenz Network Collection.
In Proc. Int. Conf. on World Wide Web Companion, pages
1343–1350, 2013.
[ http ]
|
|
[2]
|
Wikimedia Foundation.
Wikimedia downloads.
http://dumps.wikimedia.org/, January 2010.
|
 KONECT ‣ Networks ‣
Buy Me a Coffee
KONECT ‣ Networks ‣
Buy Me a Coffee