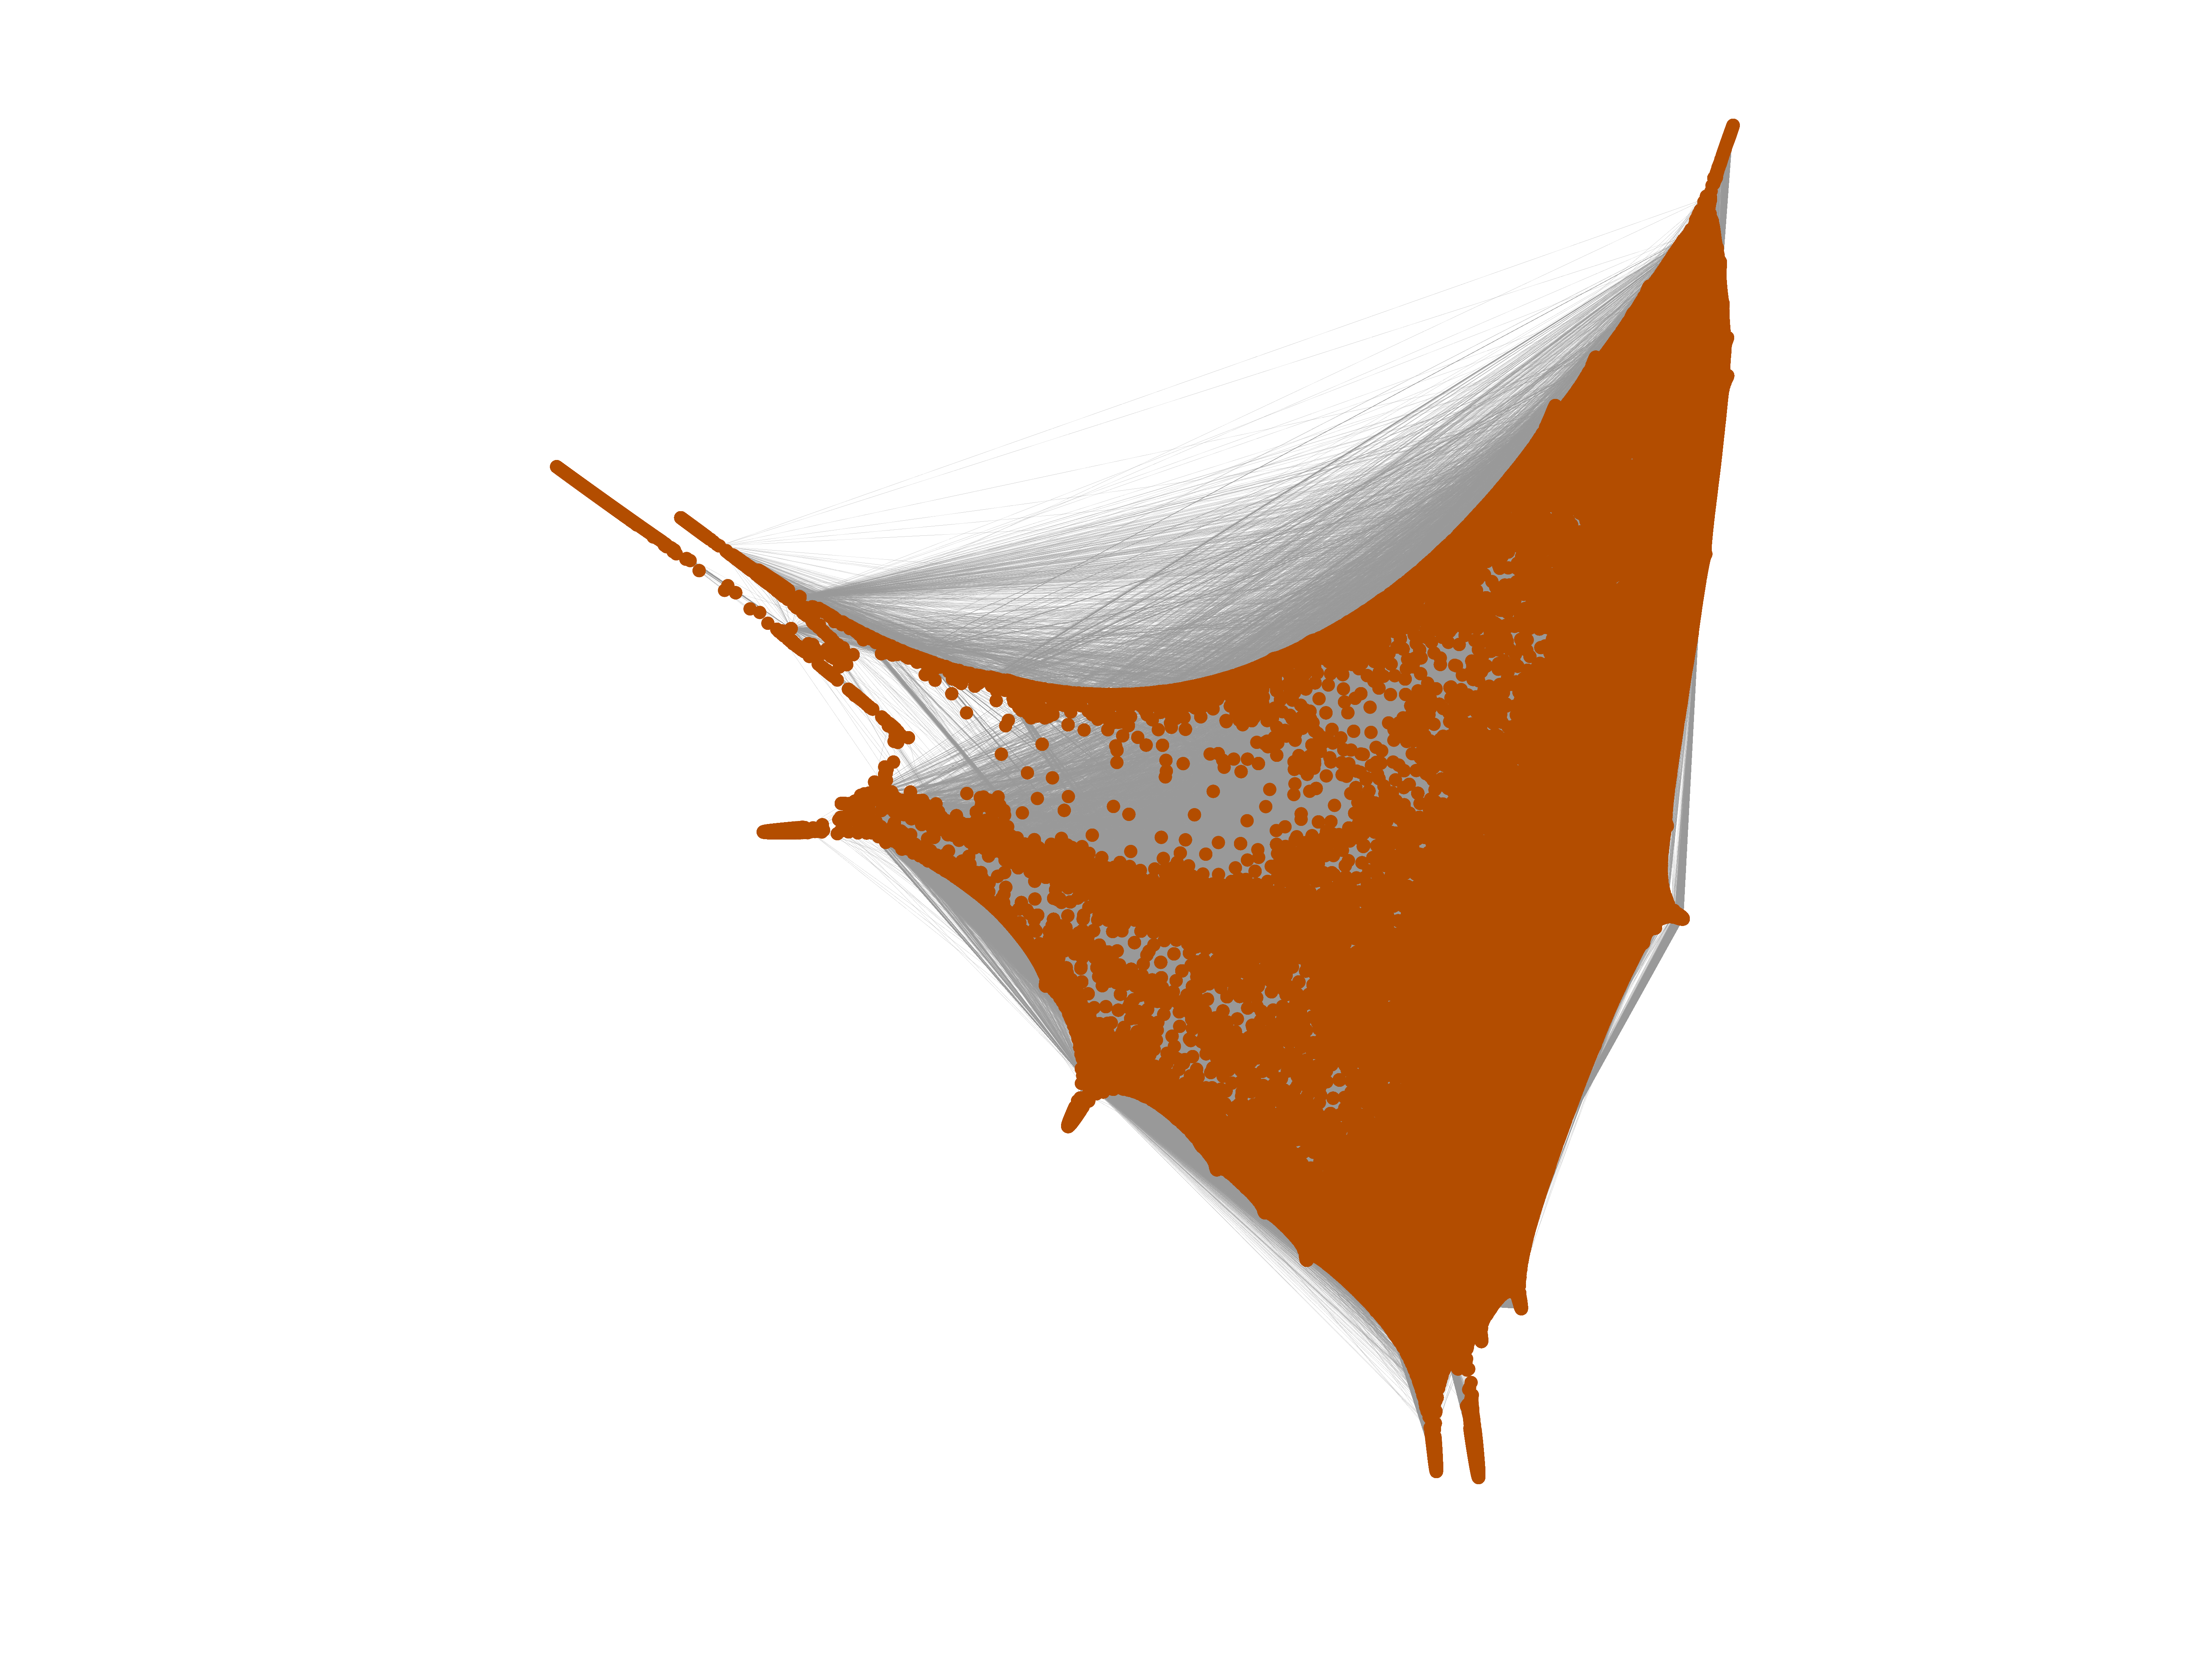
Wikipedia edits (sq)
This is the bipartite edit network of the Albanian Wikipedia. It contains users
and pages from the Albanian Wikipedia, connected by edit events. Each edge
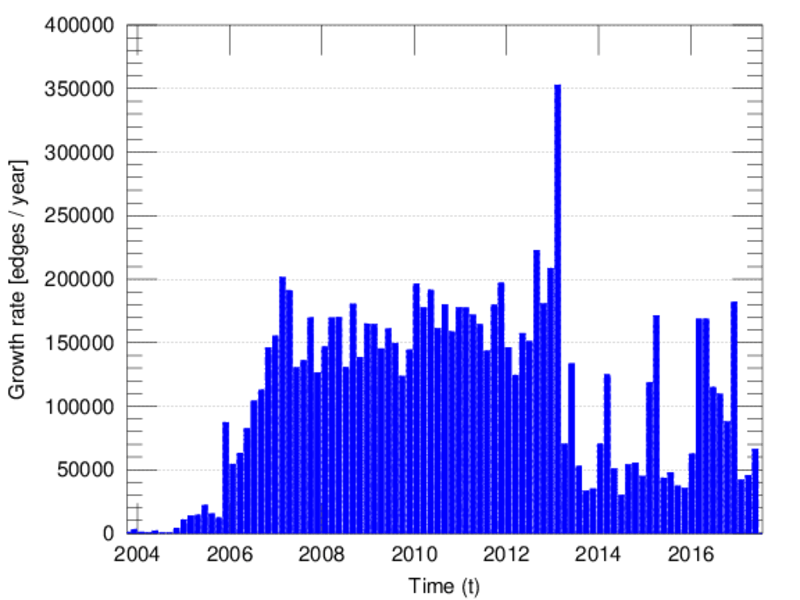
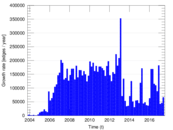
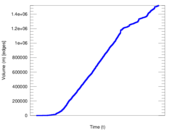
represents an edit. The dataset includes the timestamp of each edit.
Metadata
Statistics
| Size | n = | 197,191
|
| Left size | n1 = | 14,213
|
| Right size | n2 = | 182,978
|
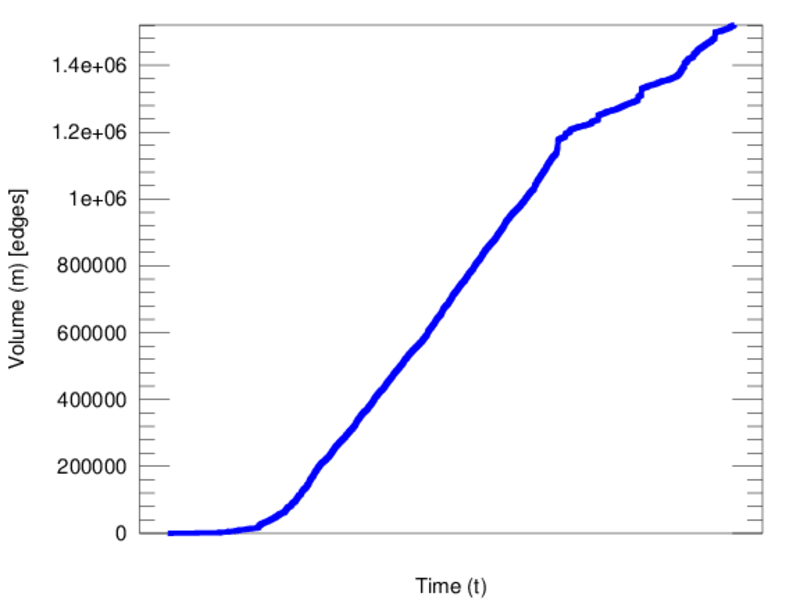
| Volume | m = | 1,520,527
|
| Unique edge count | m̿ = | 711,144
|
| Wedge count | s = | 3,852,092,478
|
| Claw count | z = | 23,202,023,042,777
|
| Square count | q = | 6,171,156,823
|
| 4-Tour count | T4 = | 64,779,314,160
|
| Maximum degree | dmax = | 86,224
|
| Maximum left degree | d1max = | 86,224
|
| Maximum right degree | d2max = | 9,299
|
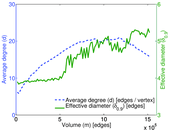
| Average degree | d = | 15.421 9
|
| Average left degree | d1 = | 106.981
|
| Average right degree | d2 = | 8.309 89
|
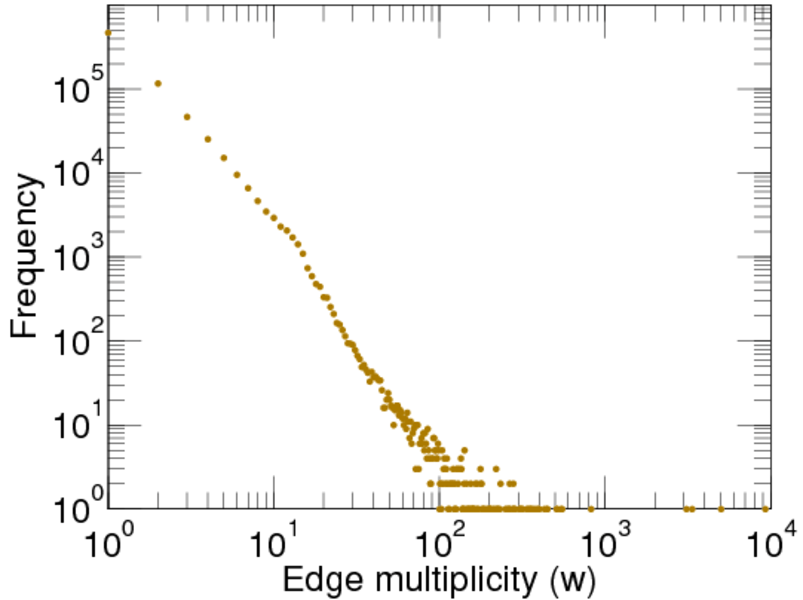
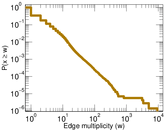
| Average edge multiplicity | m̃ = | 2.138 14
|
| Size of LCC | N = | 187,503
|
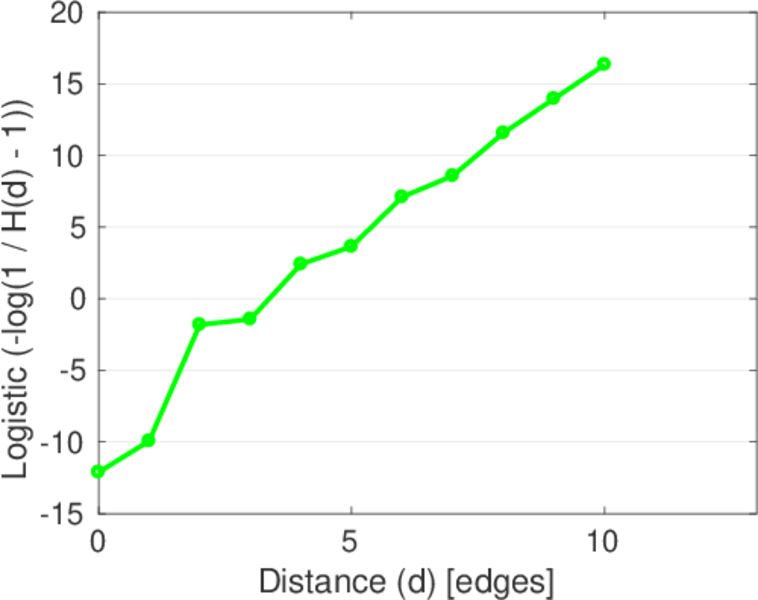
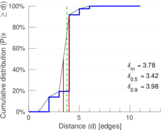
| Diameter | δ = | 13
|
| 50-Percentile effective diameter | δ0.5 = | 3.424 11
|
| 90-Percentile effective diameter | δ0.9 = | 3.976 09
|
| Median distance | δM = | 4
|
| Mean distance | δm = | 3.776 95
|
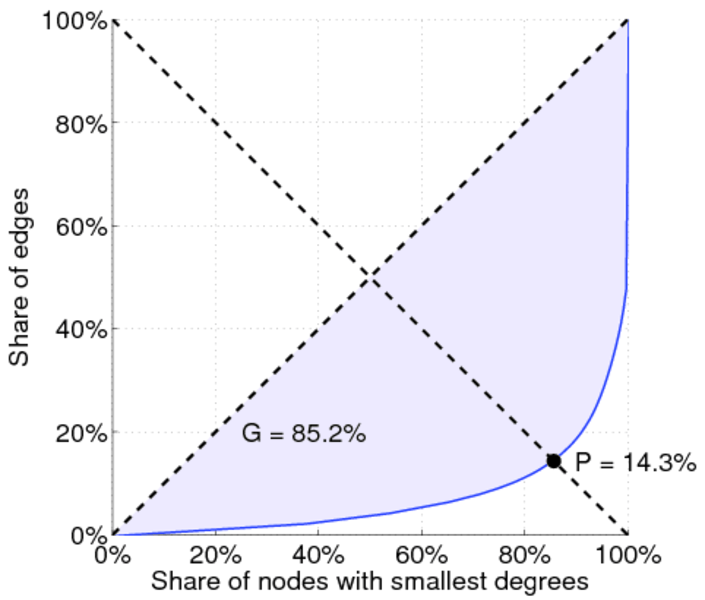
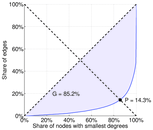
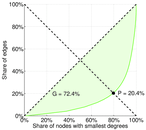
| Gini coefficient | G = | 0.854 785
|
| Balanced inequality ratio | P = | 0.144 646
|
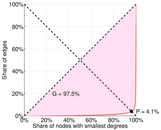
| Left balanced inequality ratio | P1 = | 0.040 705 6
|
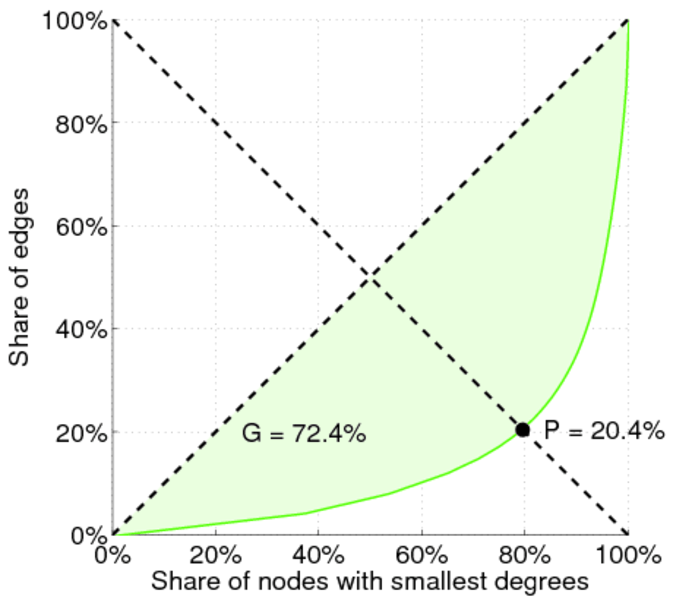
| Right balanced inequality ratio | P2 = | 0.204 116
|
| Relative edge distribution entropy | Her = | 0.730 386
|
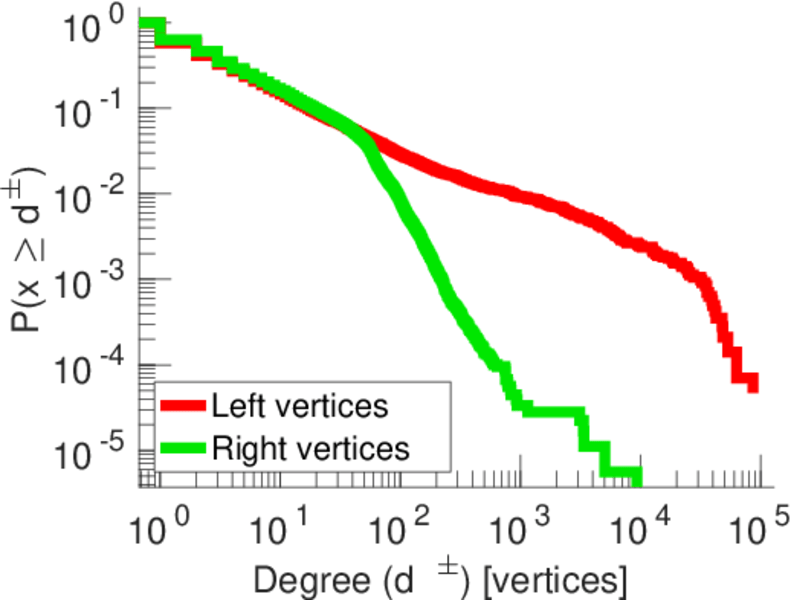
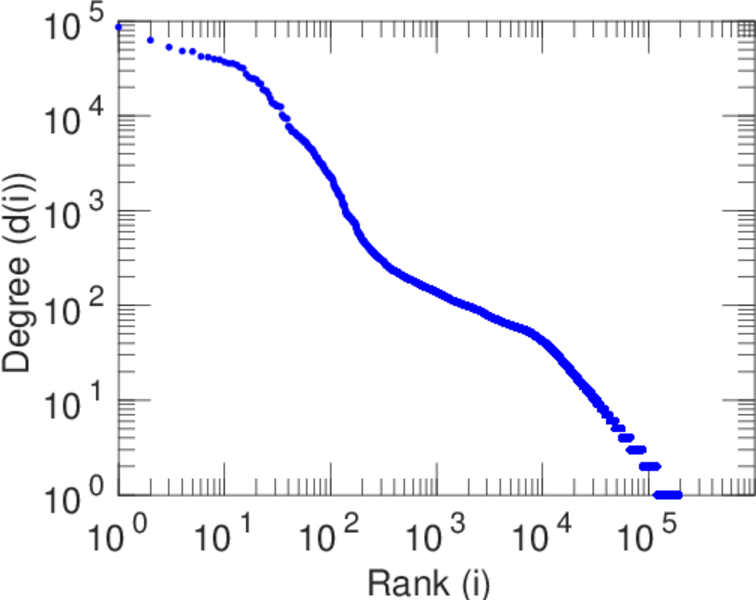
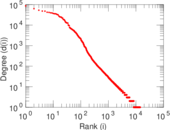
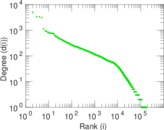
| Power law exponent | γ = | 2.320 47
|
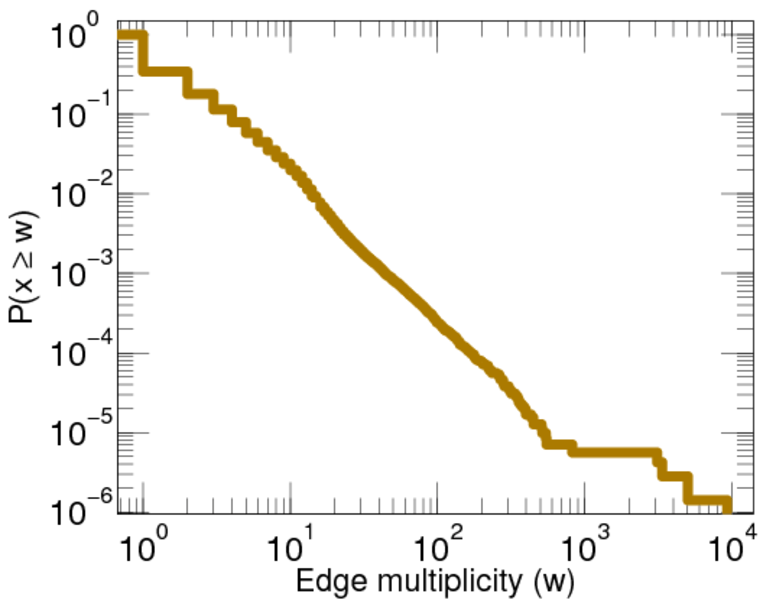
| Tail power law exponent with p | γ3 = | 1.991 00
|
| p-value | p = | 0.000 00
|
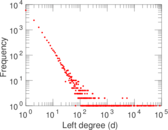
| Left tail power law exponent with p | γ3,1 = | 1.941 00
|
| Left p-value | p1 = | 0.000 00
|
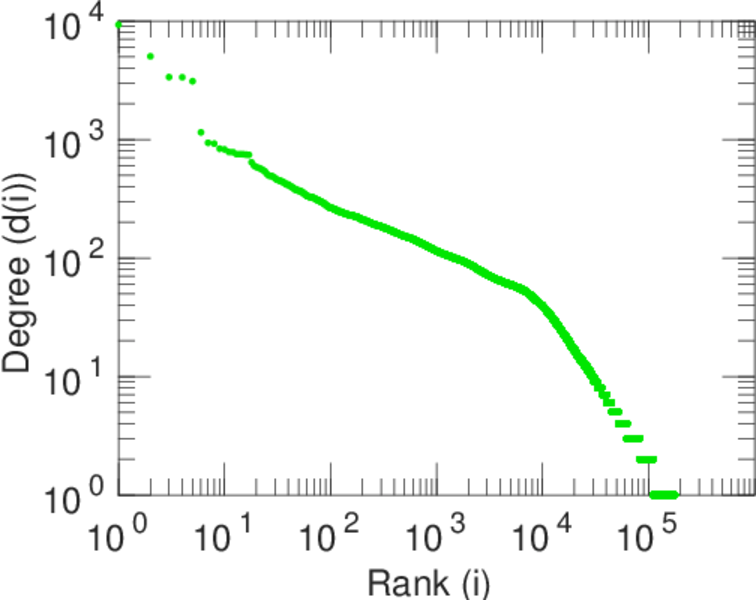
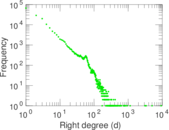
| Right tail power law exponent with p | γ3,2 = | 5.861 00
|
| Right p-value | p2 = | 0.526 000
|
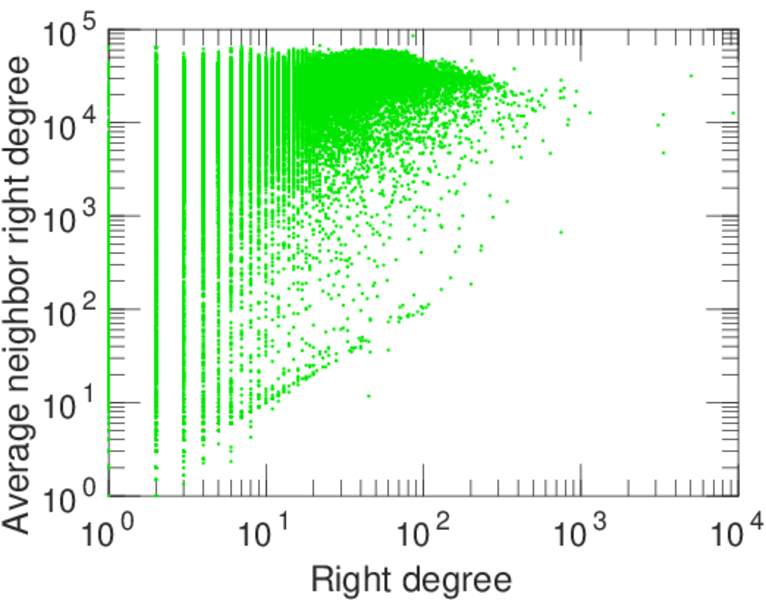
| Degree assortativity | ρ = | −0.163 464
|
| Degree assortativity p-value | pρ = | 0.000 00
|
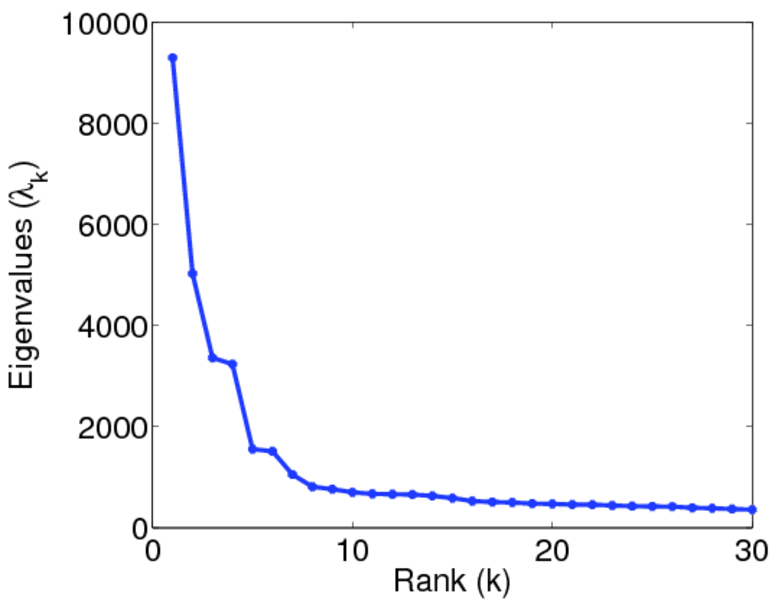
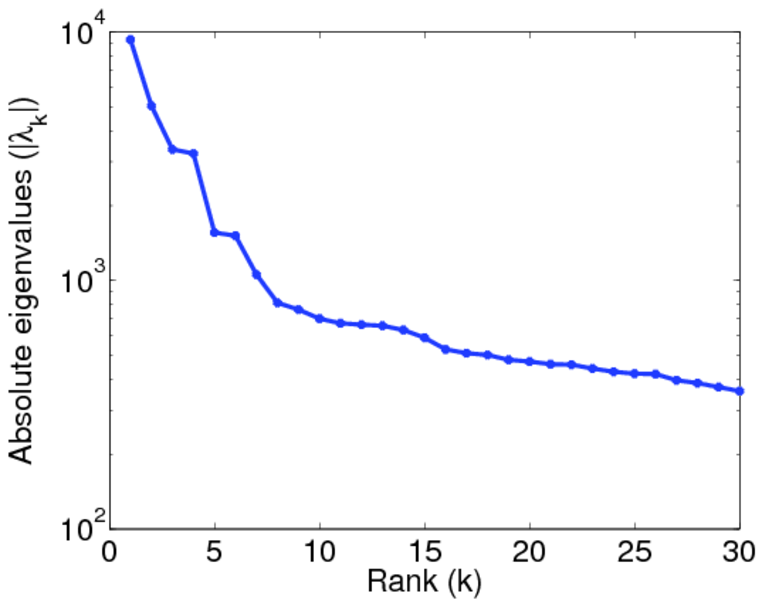
| Spectral norm | α = | 9,298.27
|
| Algebraic connectivity | a = | 0.018 734 4
|
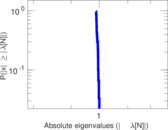
| Spectral separation | |λ1[A] / λ2[A]| = | 1.849 01
|
| Controllability | C = | 168,050
|
| Relative controllability | Cr = | 0.873 214
|
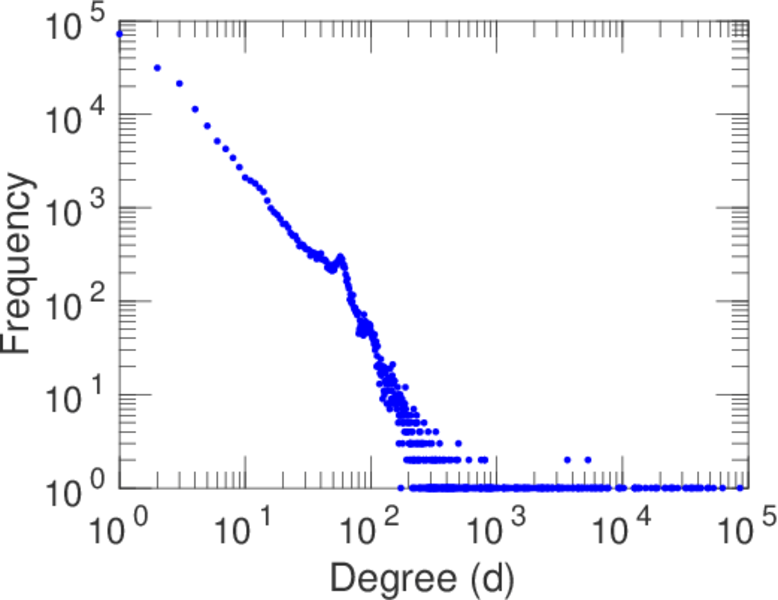
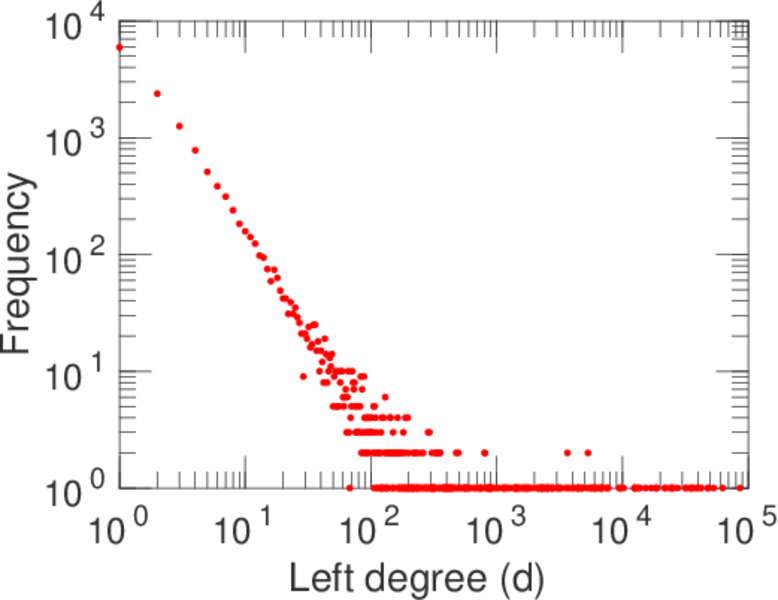
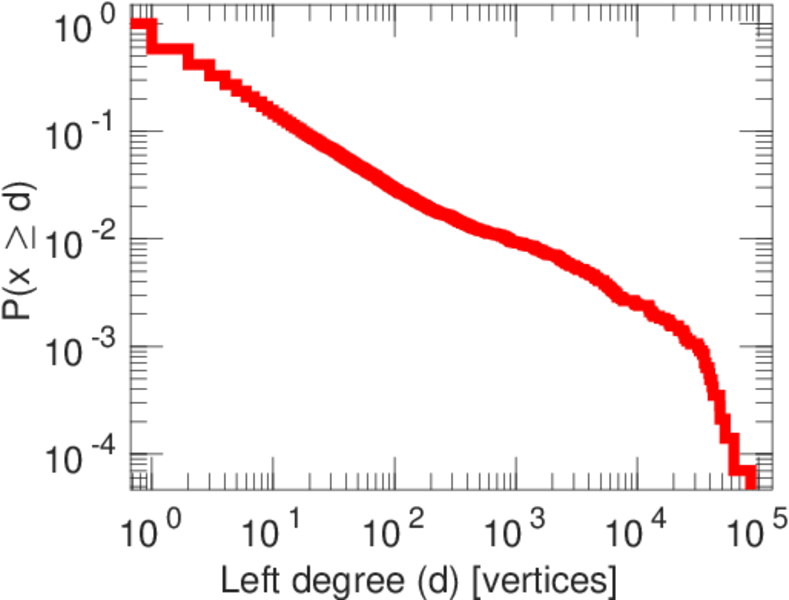
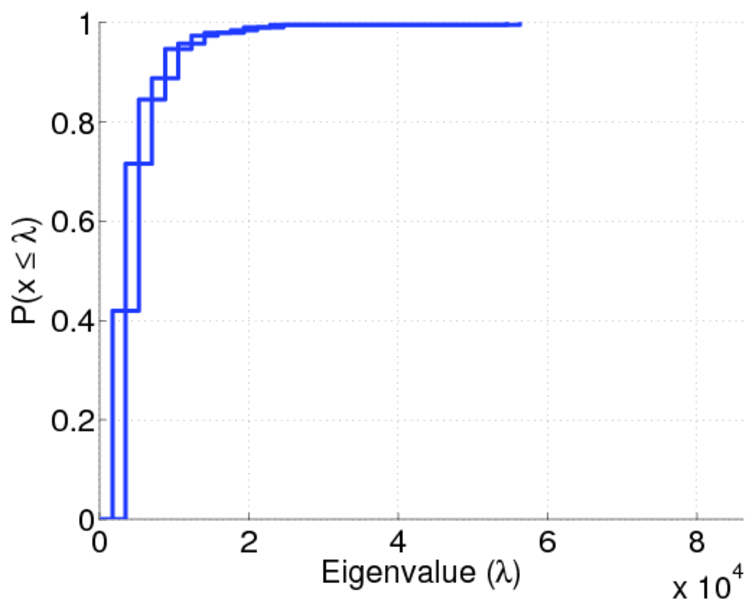
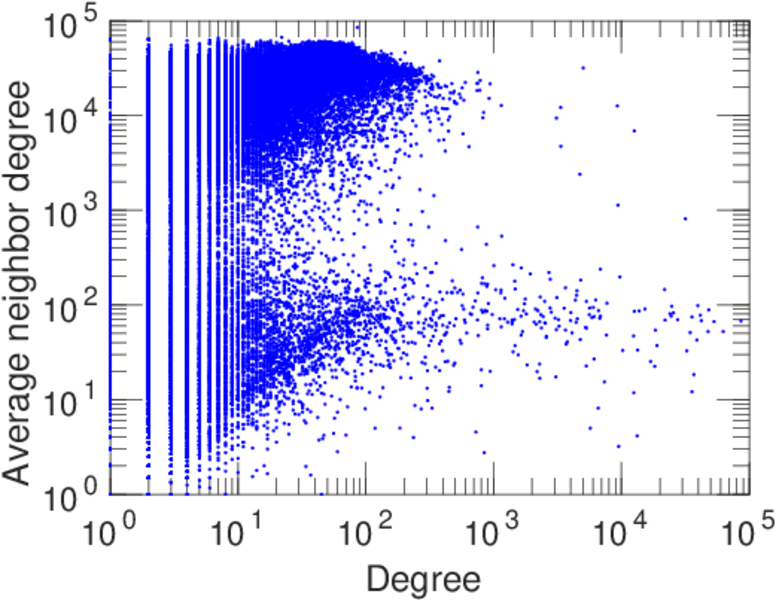
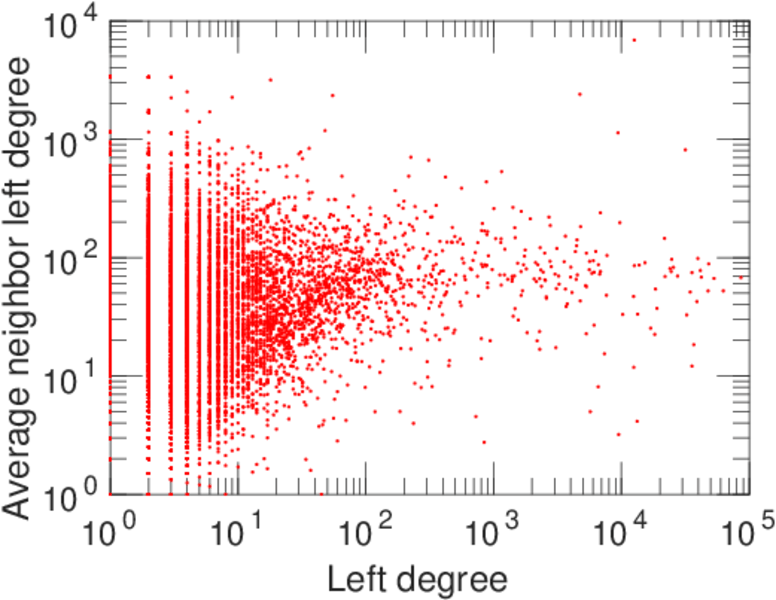
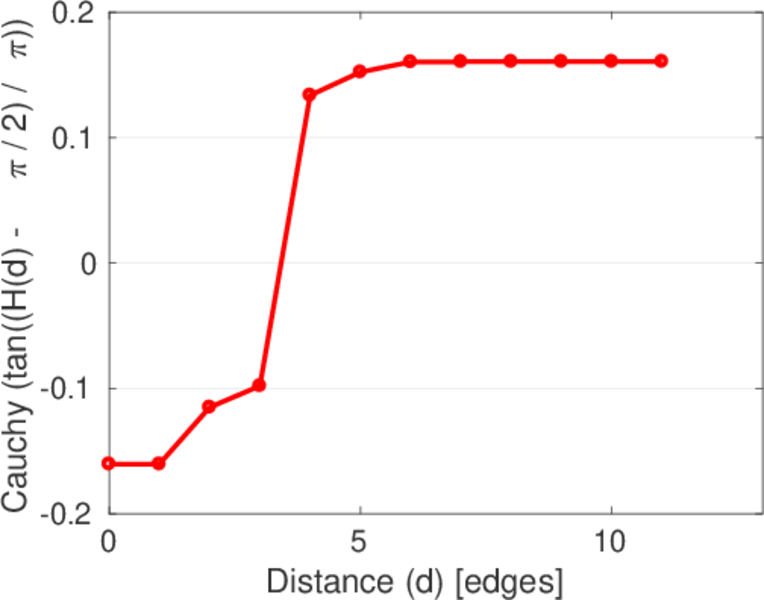
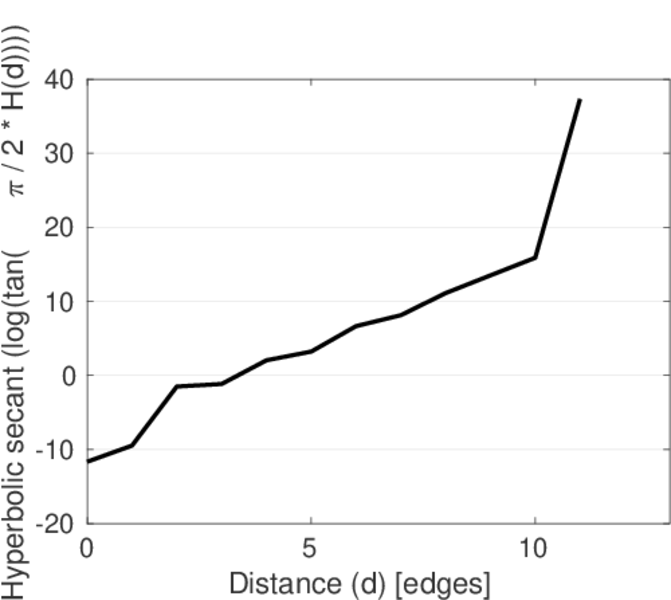
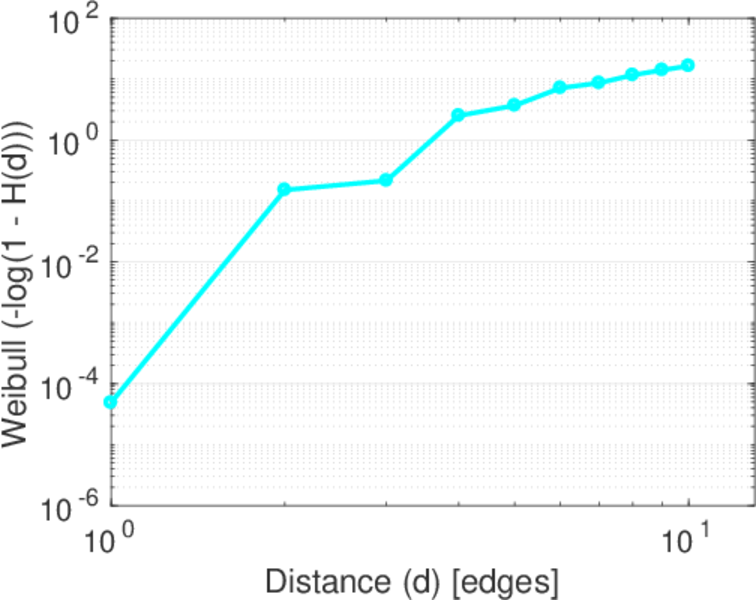
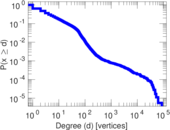
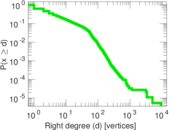
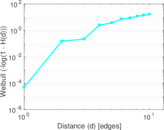
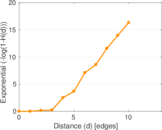
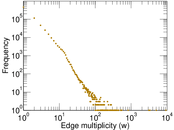
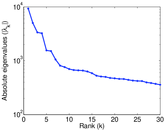
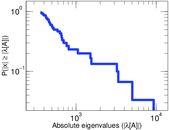
Plots


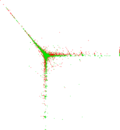
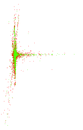


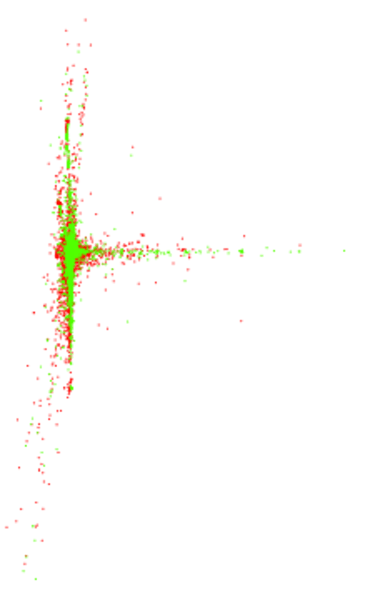
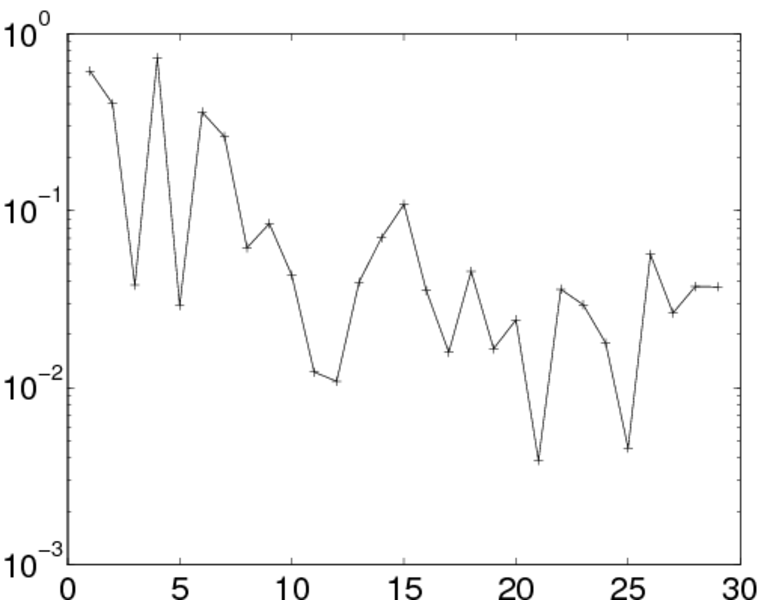
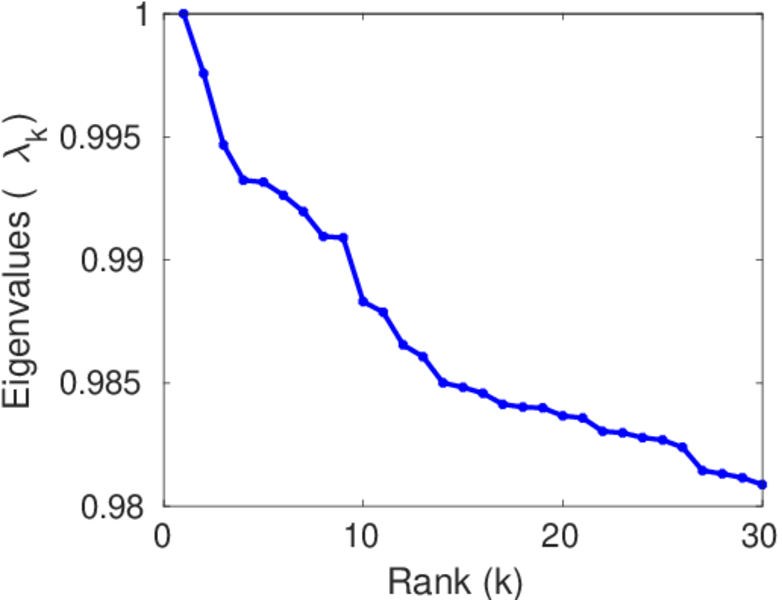
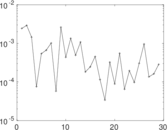
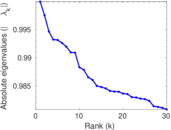
Matrix decompositions plots


Downloads
References
|
[1]
|
Jérôme Kunegis.
KONECT – The Koblenz Network Collection.
In Proc. Int. Conf. on World Wide Web Companion, pages
1343–1350, 2013.
[ http ]
|
|
[2]
|
Wikimedia Foundation.
Wikimedia downloads.
http://dumps.wikimedia.org/, January 2010.
|
 KONECT ‣ Networks ‣
Buy Me a Coffee
KONECT ‣ Networks ‣
Buy Me a Coffee