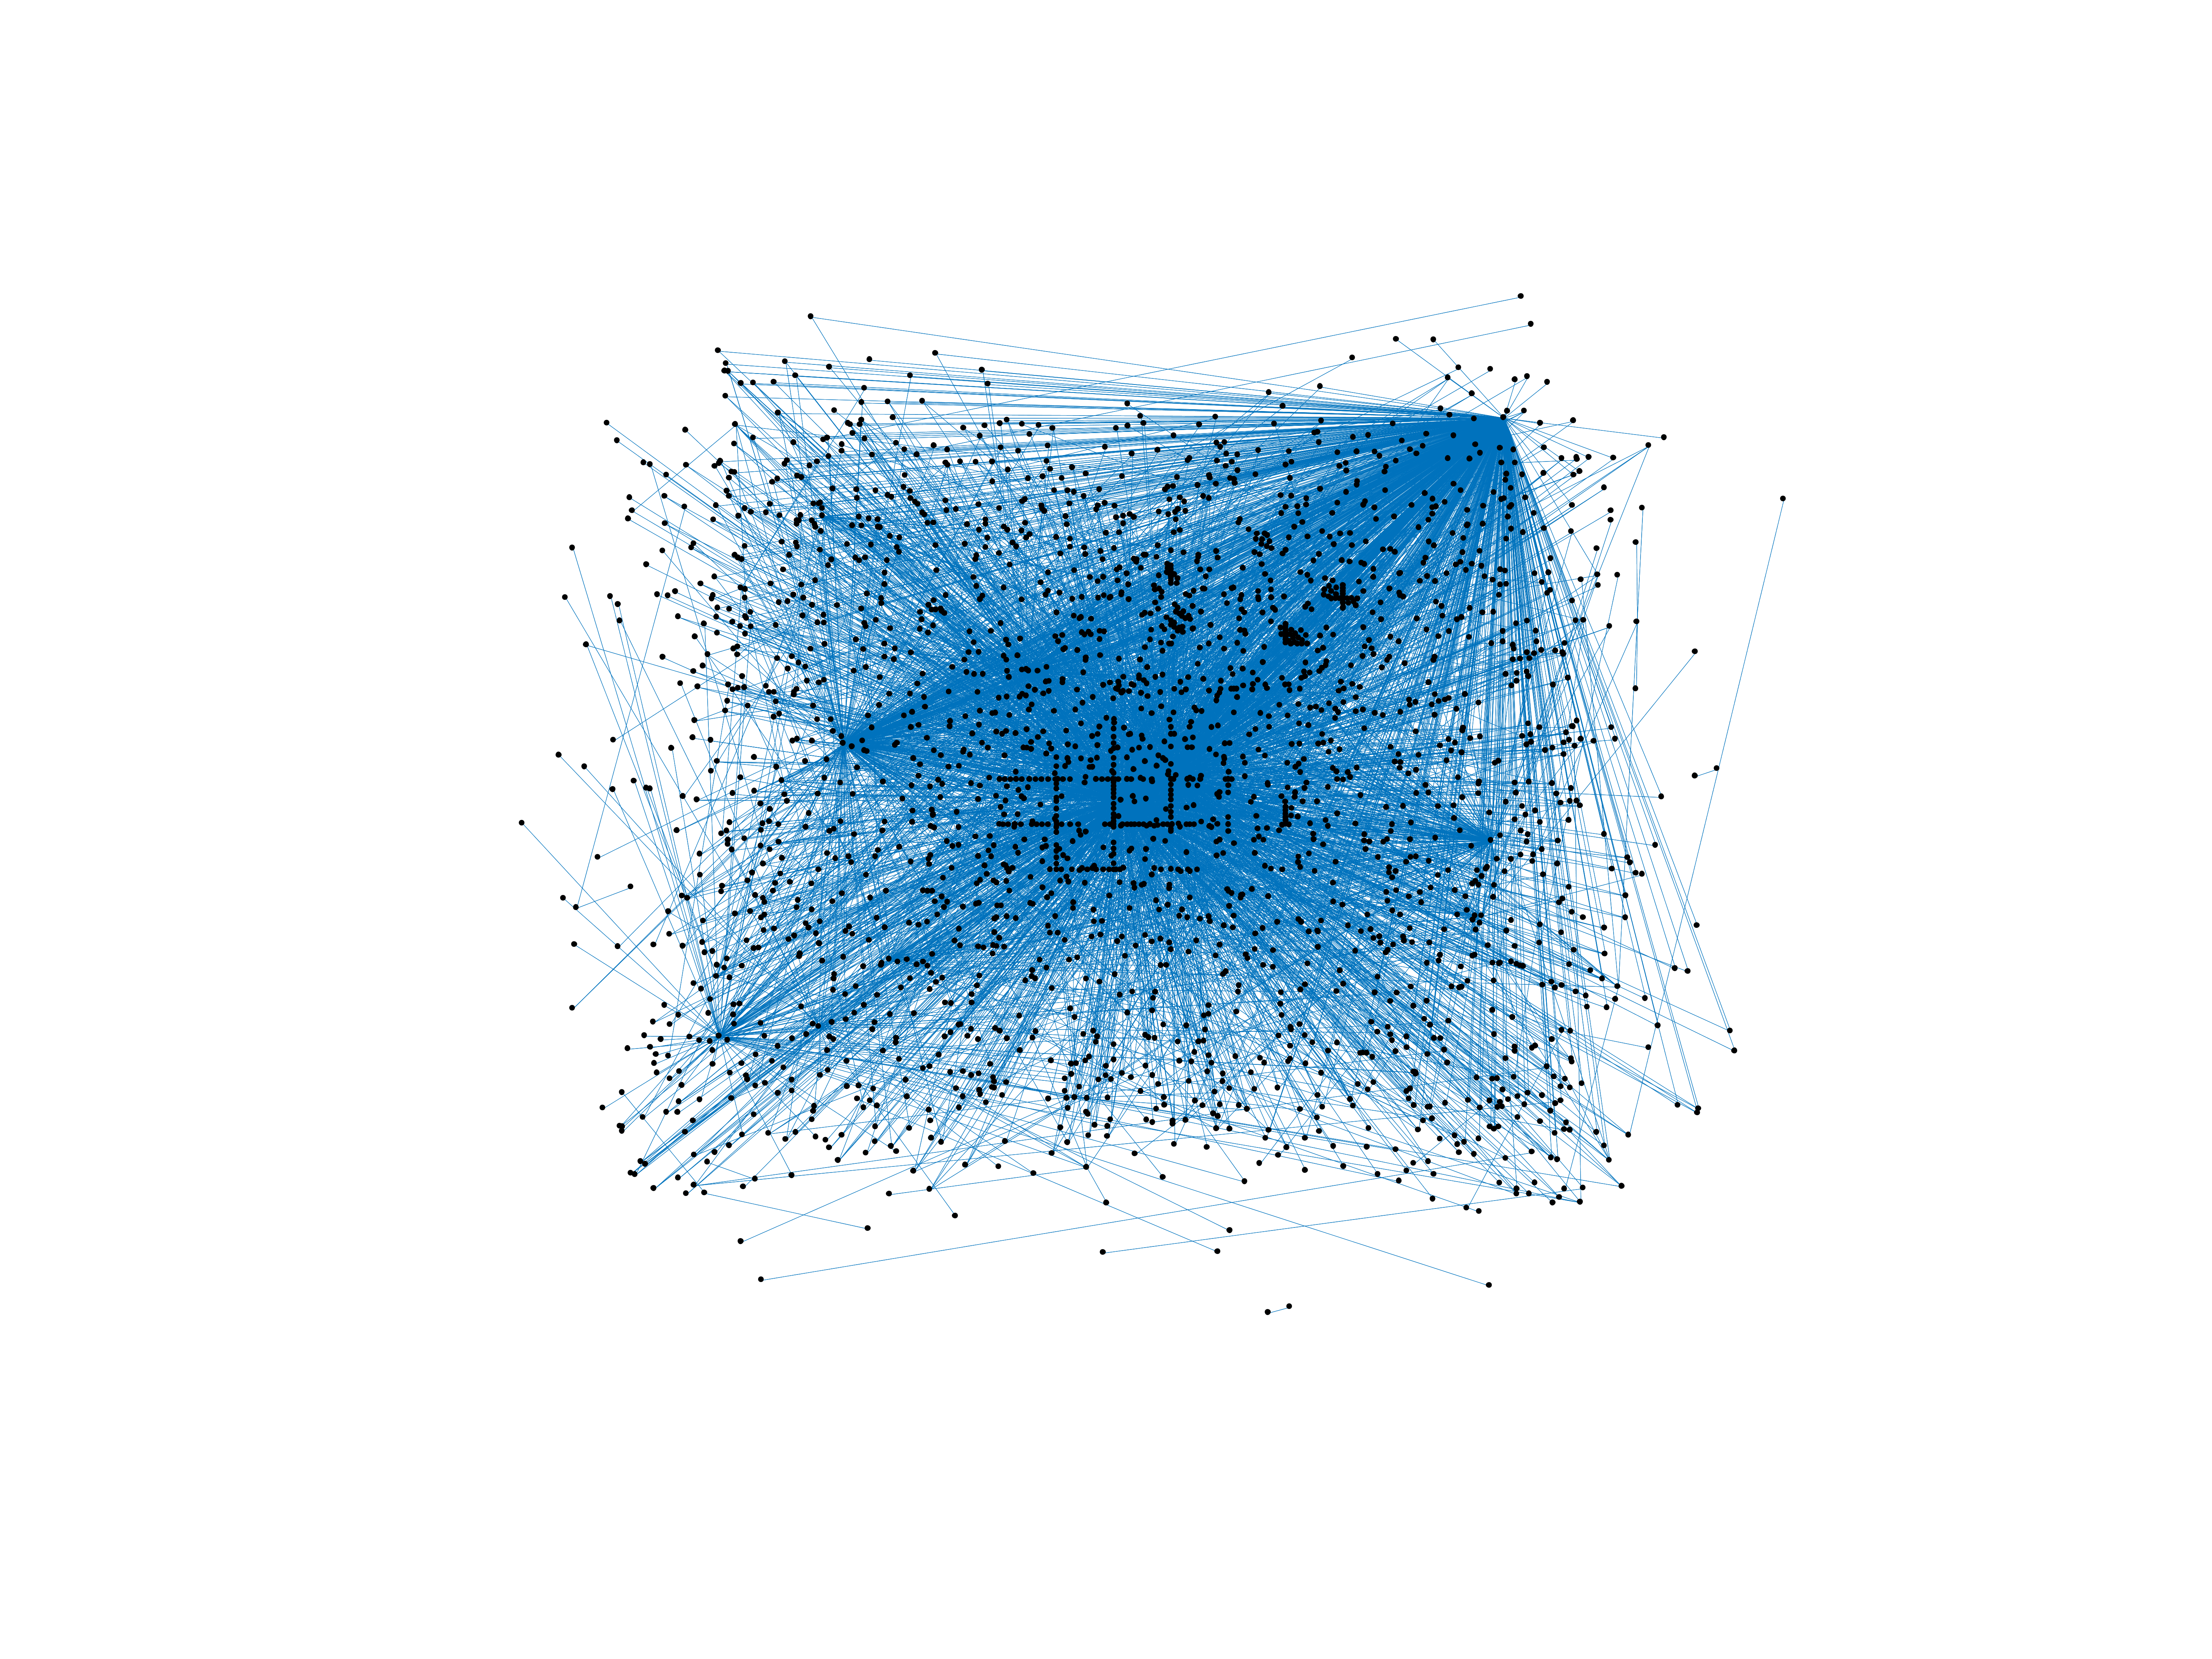
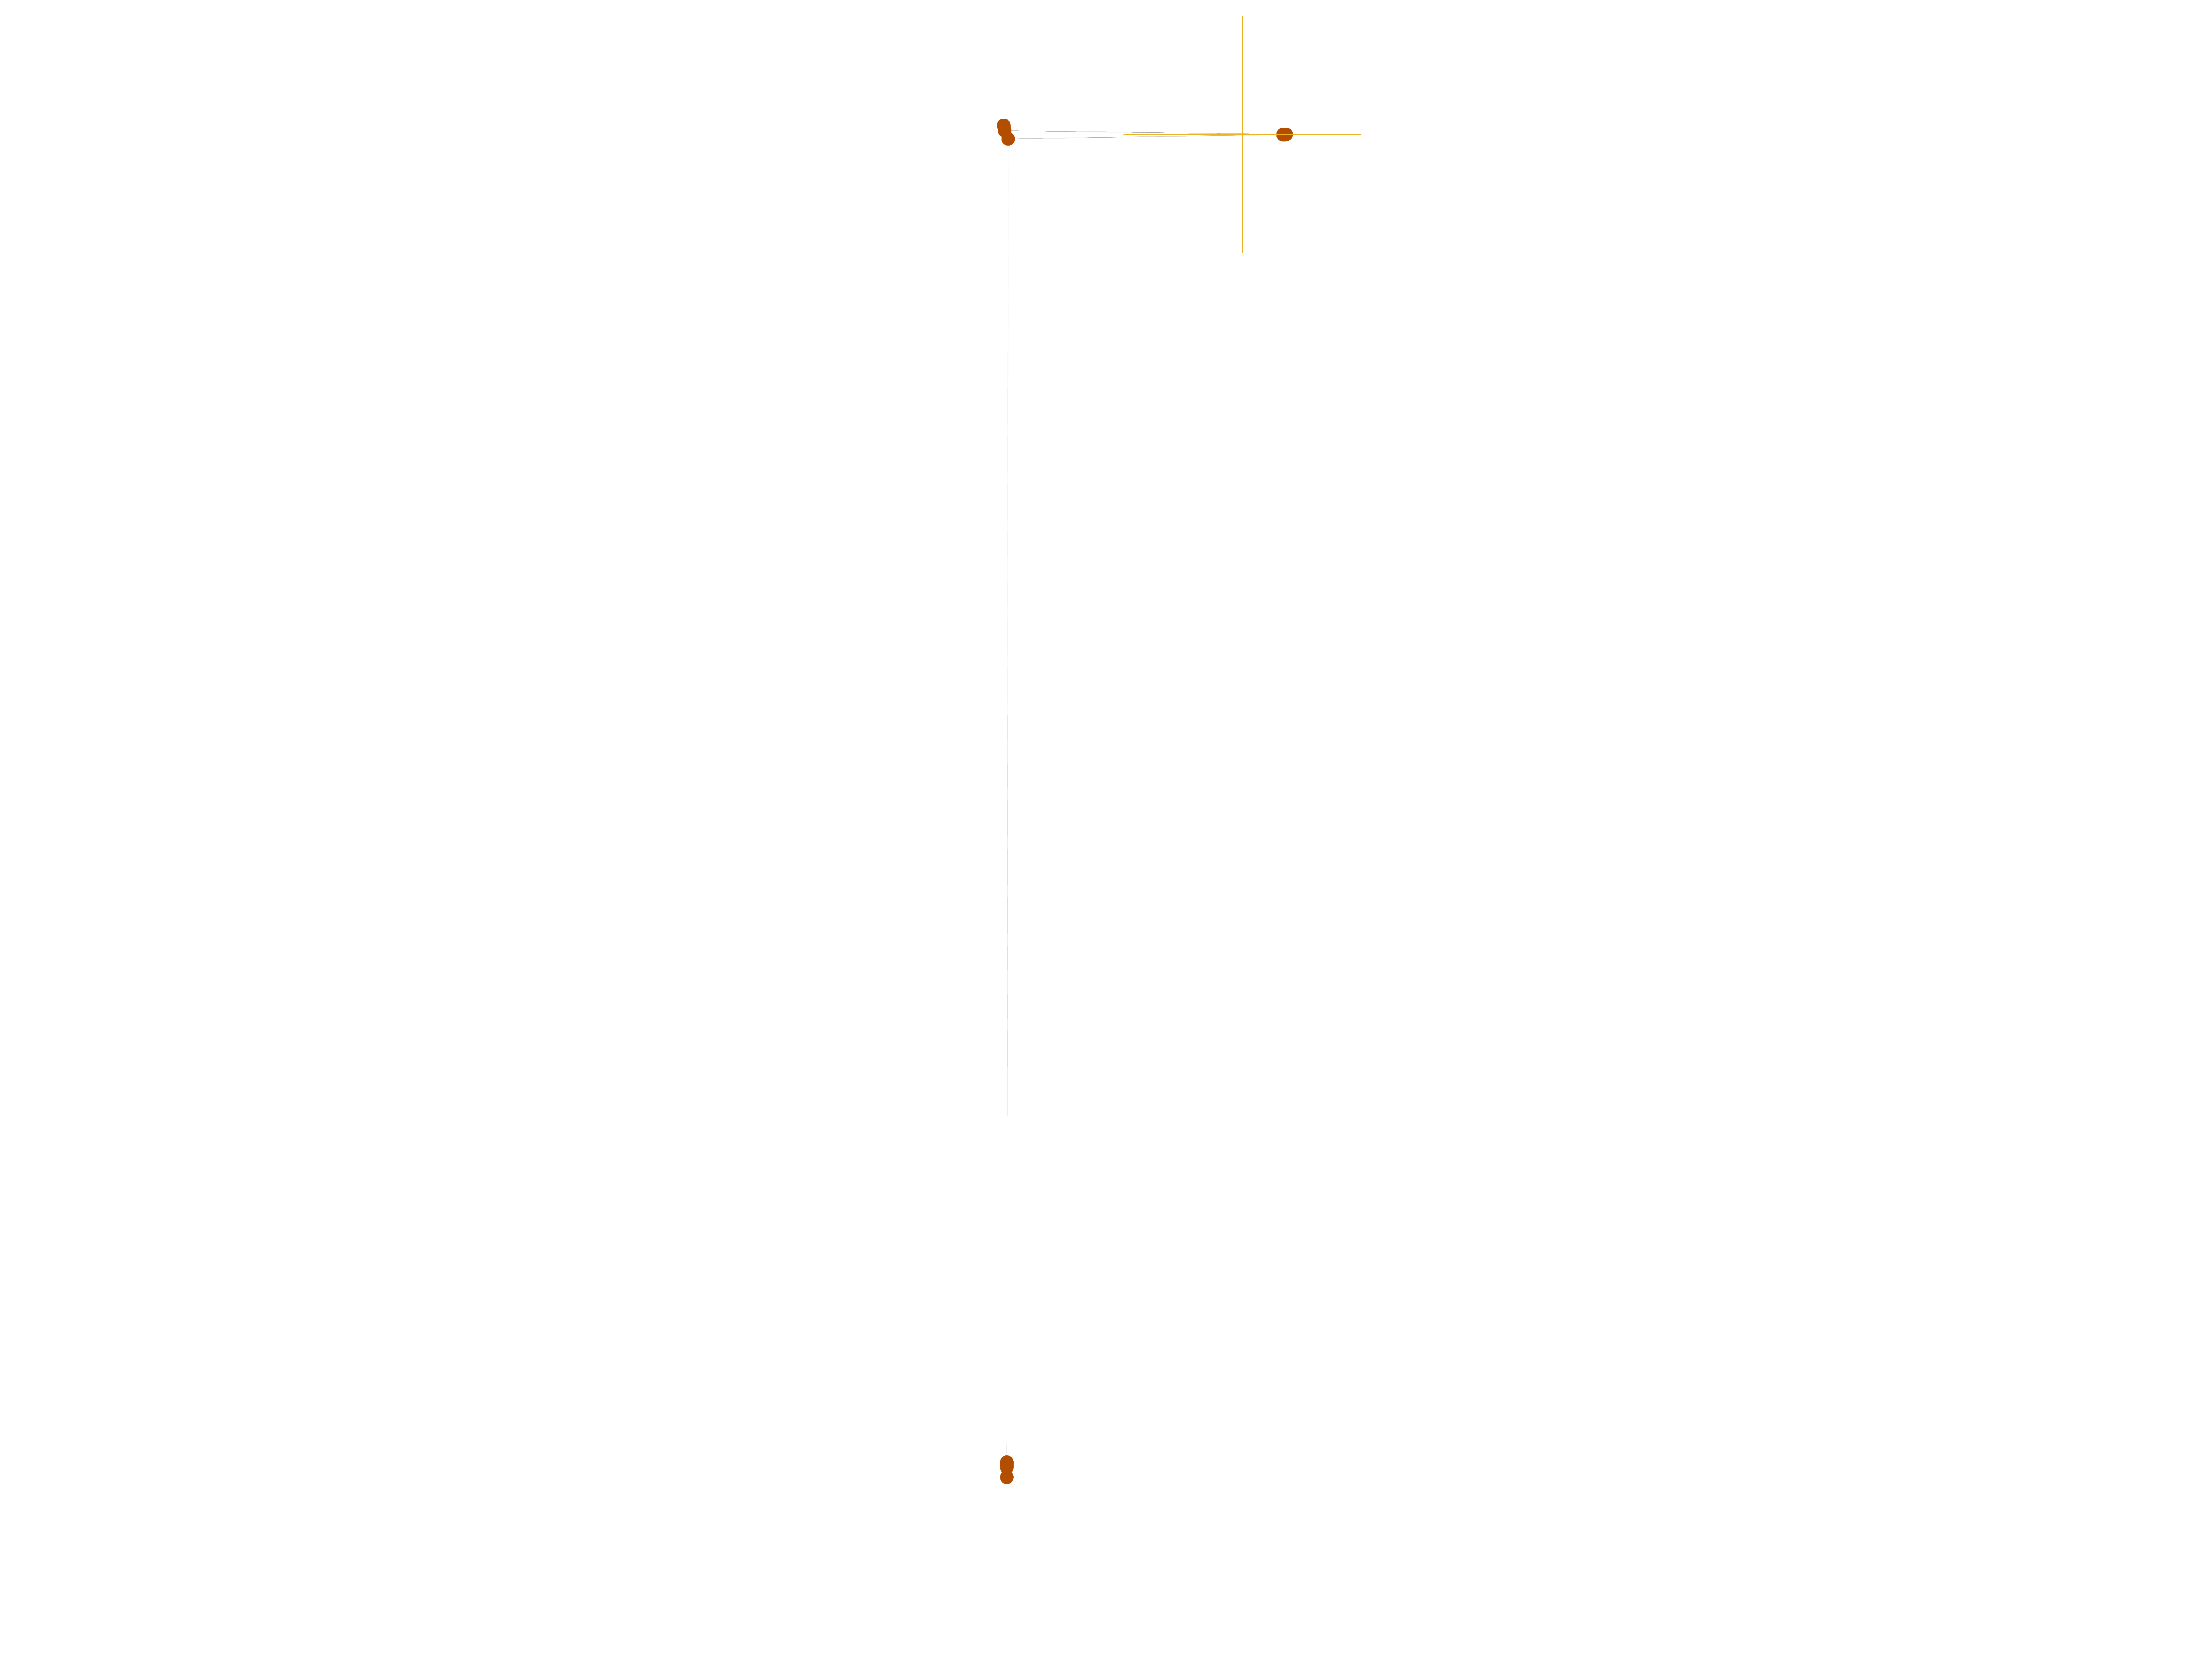
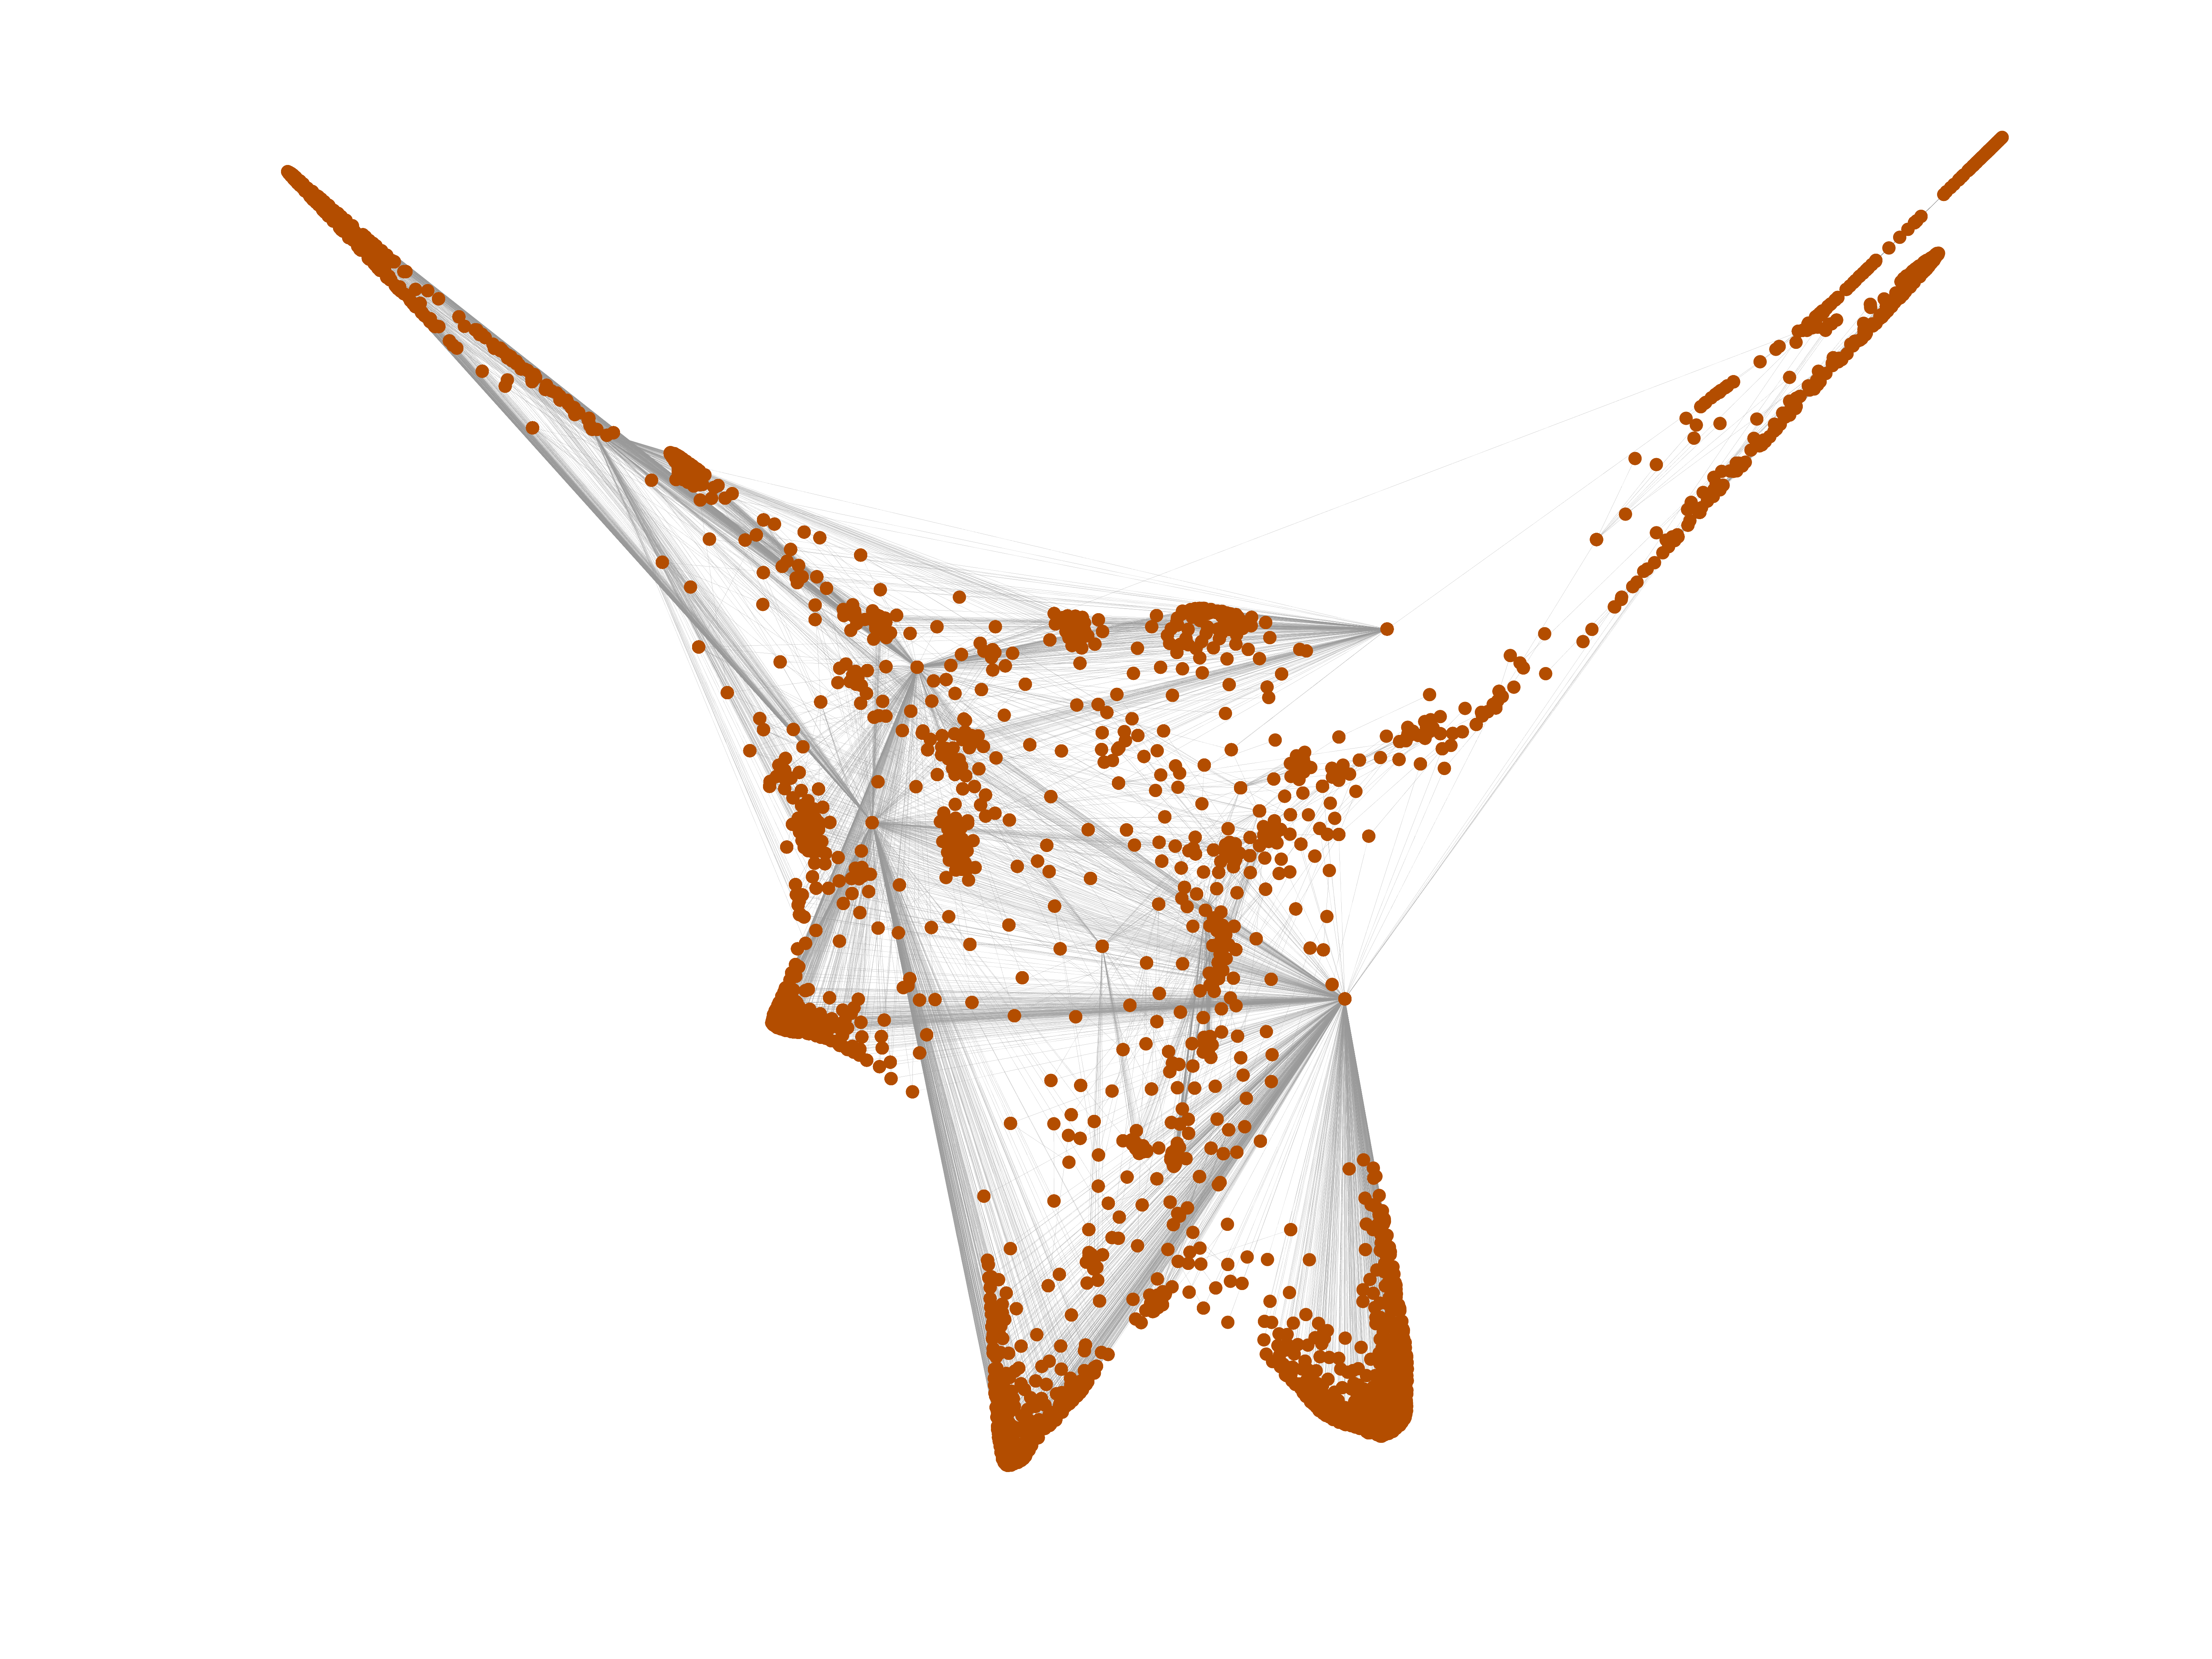
Wikinews edits (sq)
This is the bipartite edit network of the Albanian Wikinews. It contains users
and pages from the Albanian Wikinews, connected by edit events. Each edge
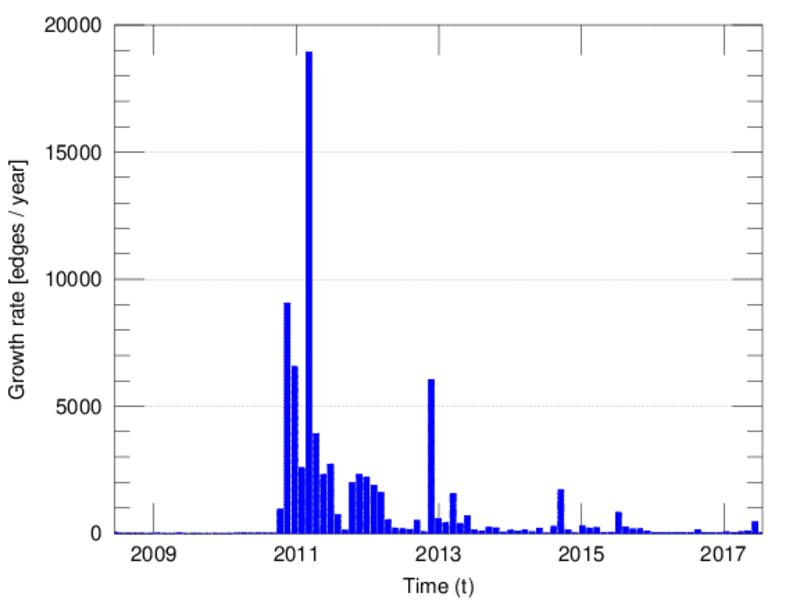
represents an edit. The dataset includes the timestamp of each edit.
Metadata
Statistics
| Size | n = | 2,511
|
| Left size | n1 = | 200
|
| Right size | n2 = | 2,311
|
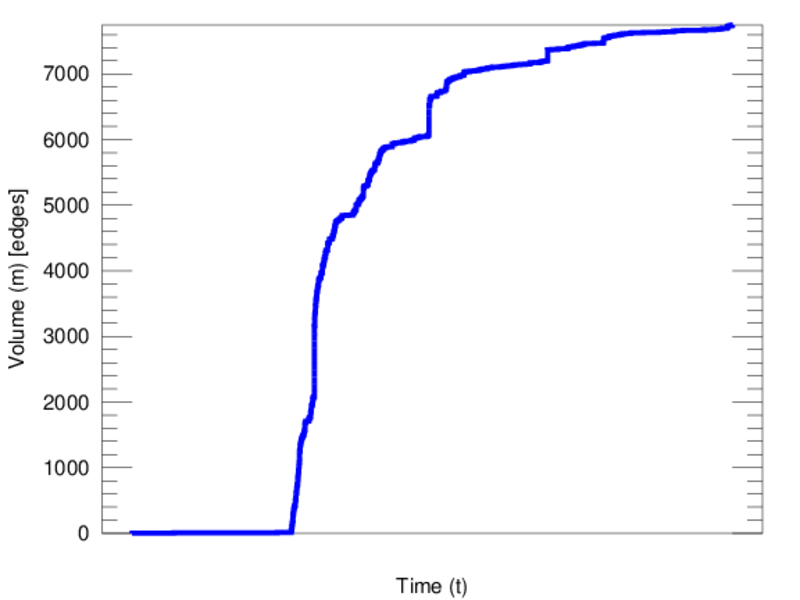
| Volume | m = | 7,745
|
| Unique edge count | m̿ = | 4,986
|
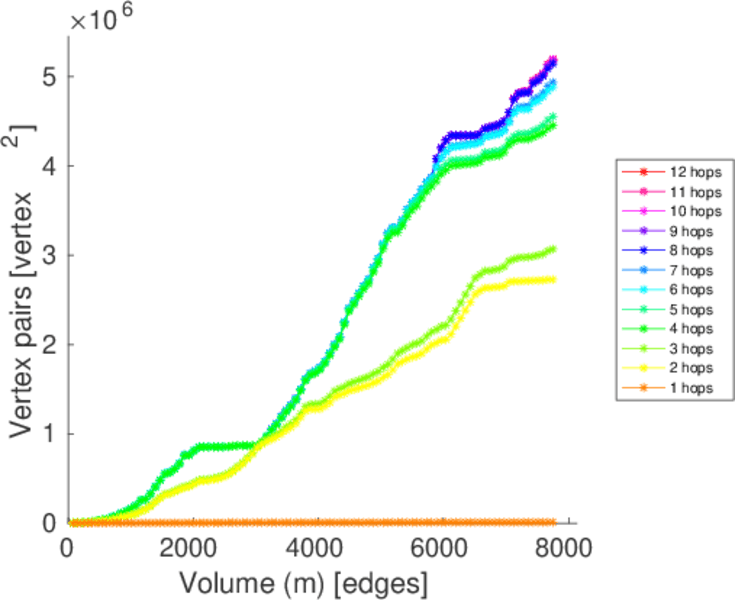
| Wedge count | s = | 1,808,578
|
| Claw count | z = | 617,618,660
|
| Cross count | x = | 169,131,895,143
|
| Square count | q = | 511,837
|
| 4-Tour count | T4 = | 11,350,268
|
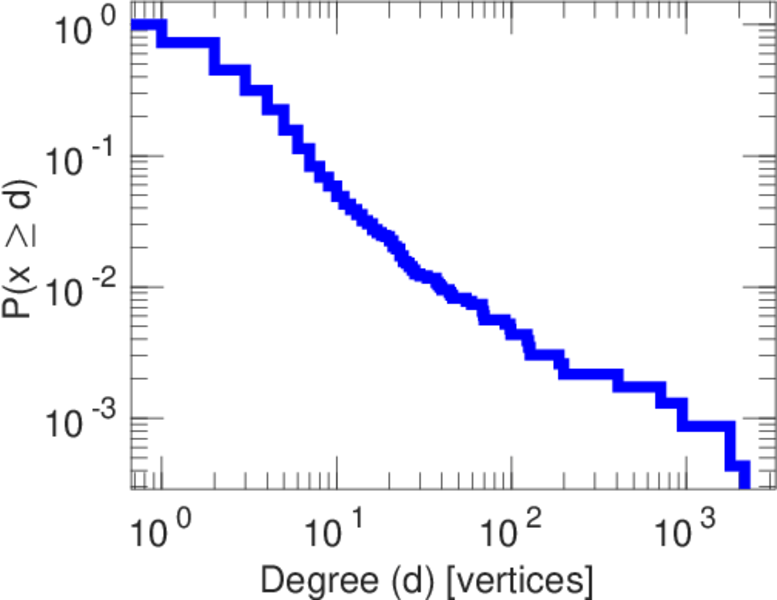
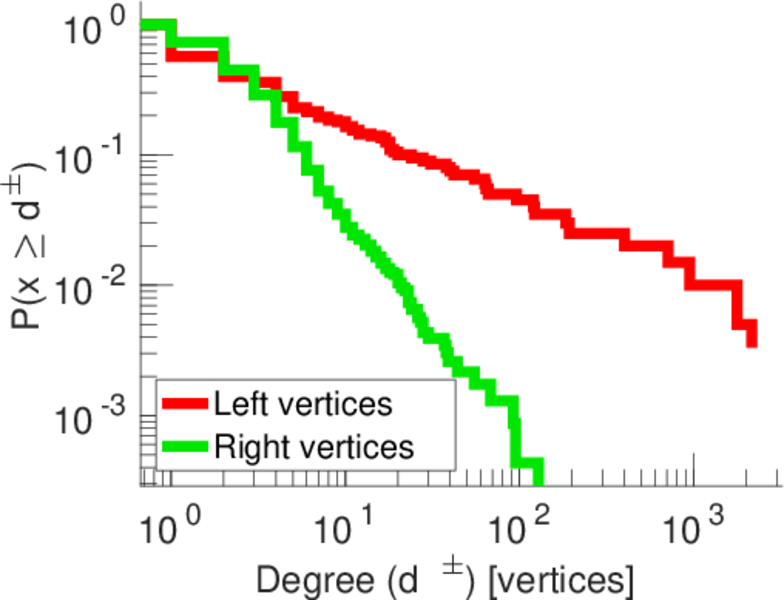
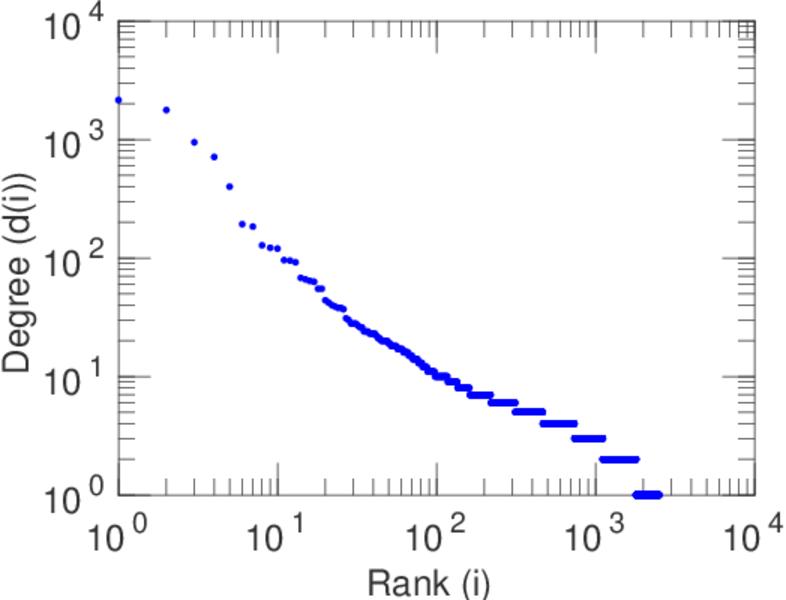
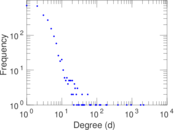
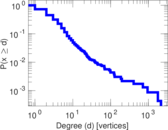
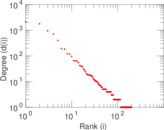
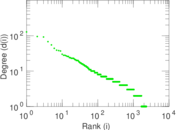
| Maximum degree | dmax = | 2,152
|
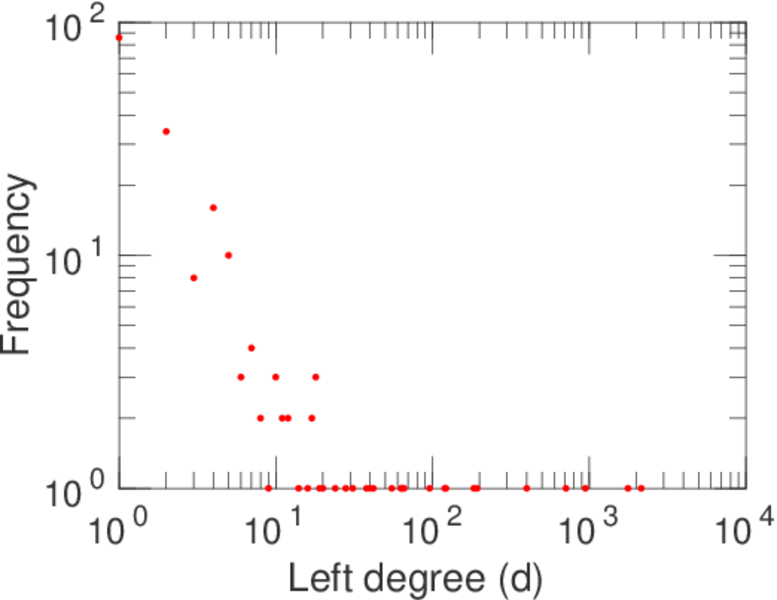
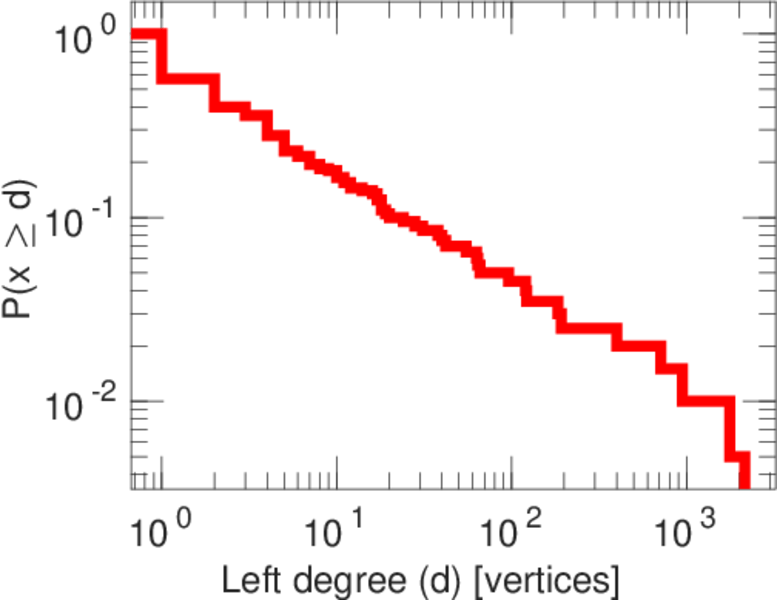
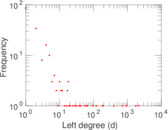
| Maximum left degree | d1max = | 2,152
|
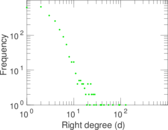
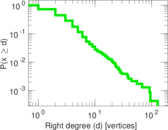
| Maximum right degree | d2max = | 128
|
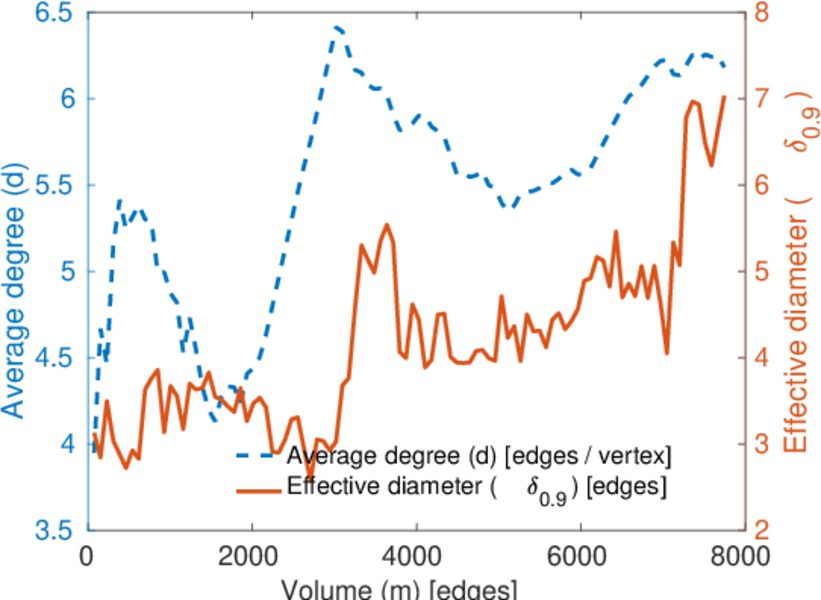
| Average degree | d = | 6.168 86
|
| Average left degree | d1 = | 38.725 0
|
| Average right degree | d2 = | 3.351 36
|
| Fill | p = | 0.010 787 5
|
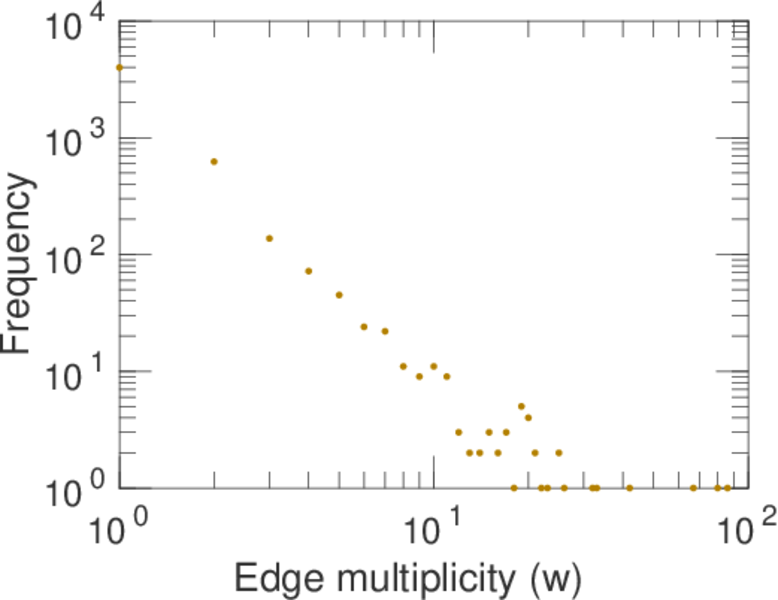
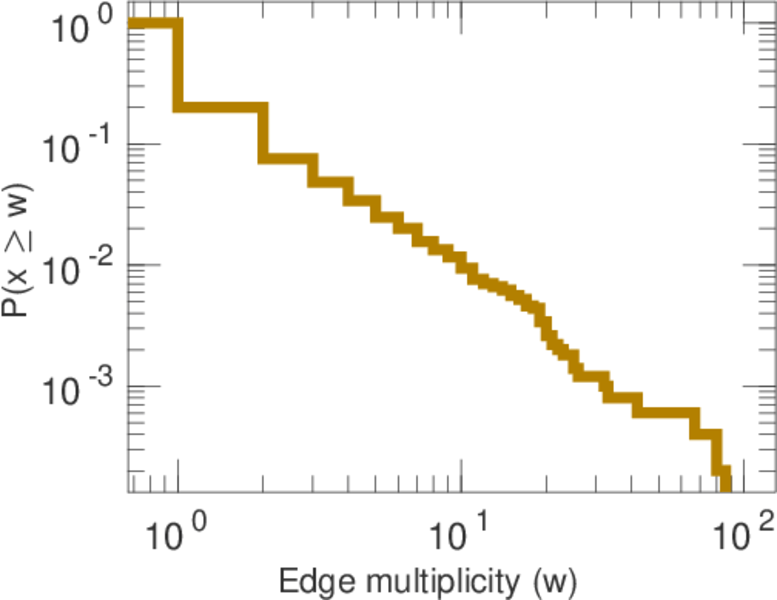
| Average edge multiplicity | m̃ = | 1.553 35
|
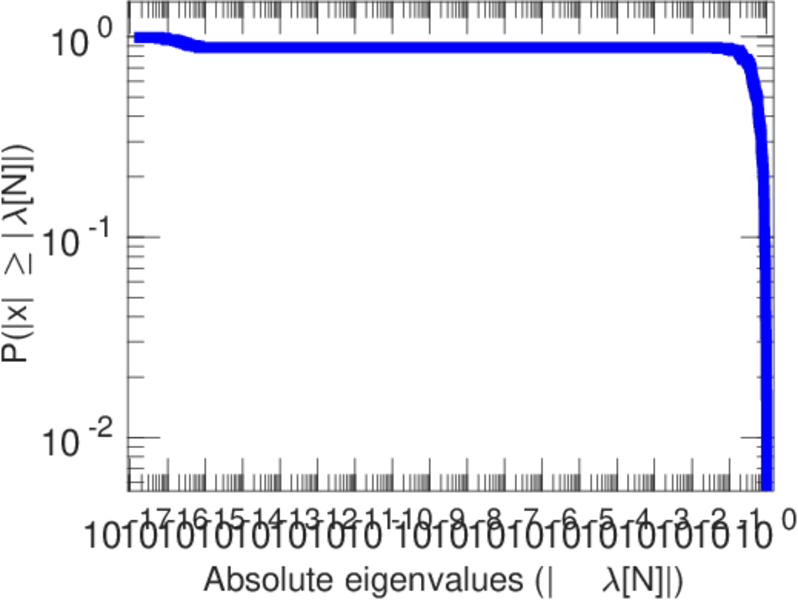
| Size of LCC | N = | 2,279
|
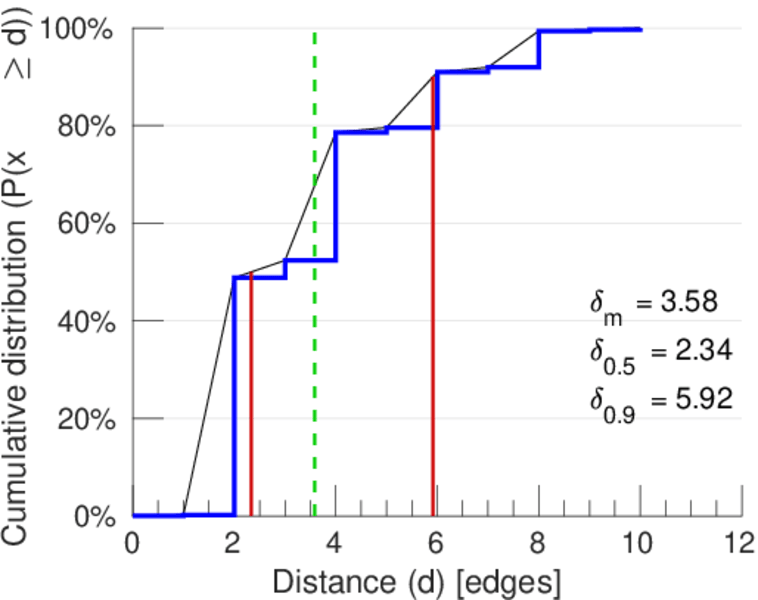
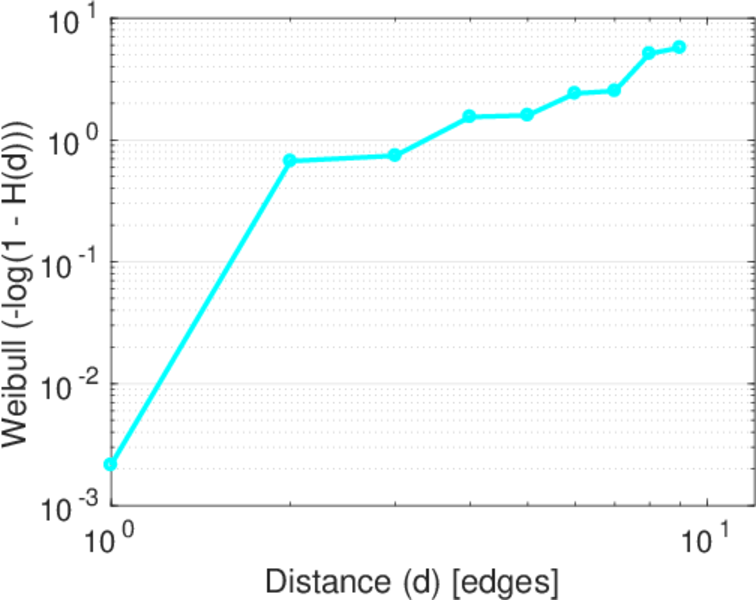
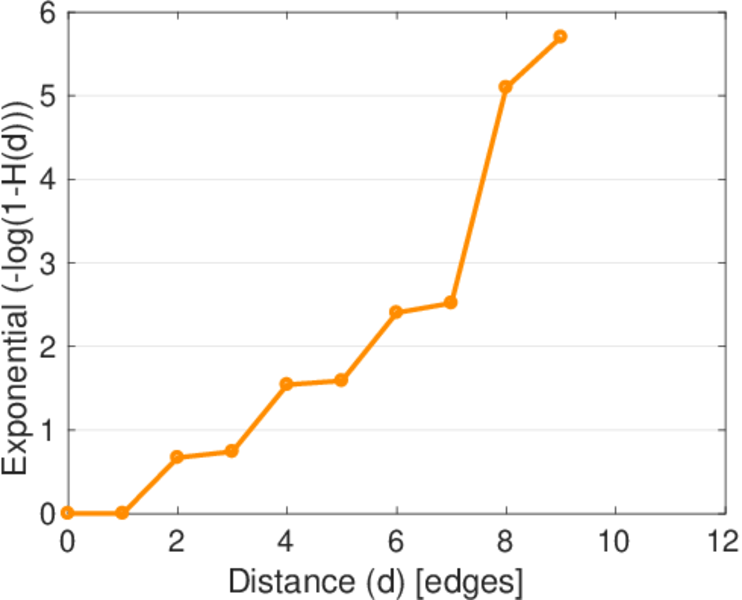
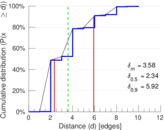
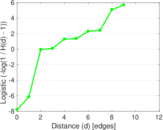
| Diameter | δ = | 12
|
| 50-Percentile effective diameter | δ0.5 = | 2.335 81
|
| 90-Percentile effective diameter | δ0.9 = | 5.916 07
|
| Median distance | δM = | 3
|
| Mean distance | δm = | 3.584 25
|
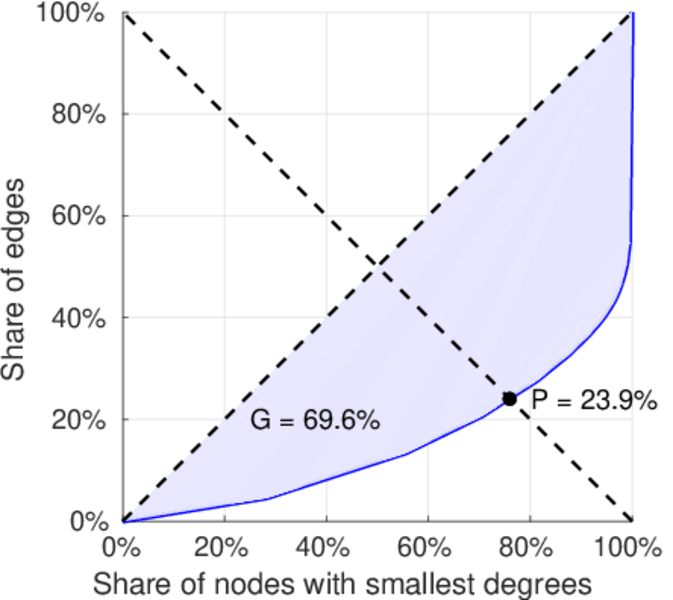
| Gini coefficient | G = | 0.707 878
|
| Balanced inequality ratio | P = | 0.231 698
|
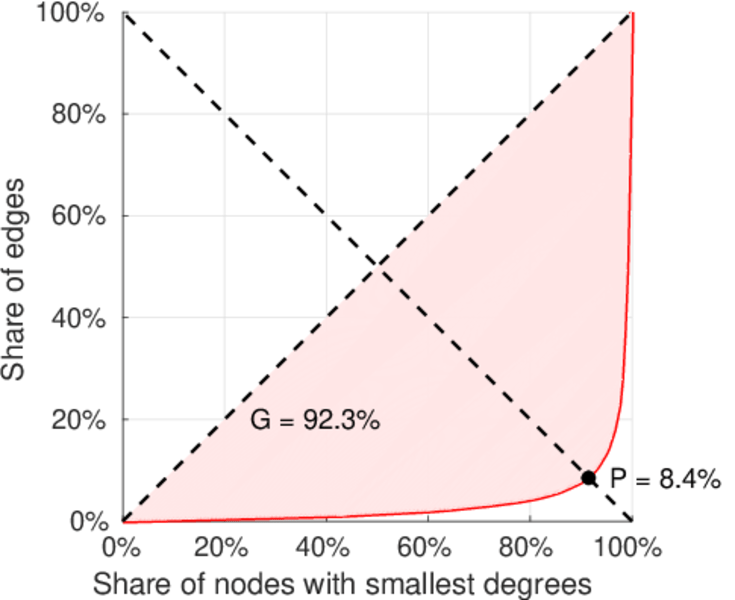
| Left balanced inequality ratio | P1 = | 0.083 666 9
|
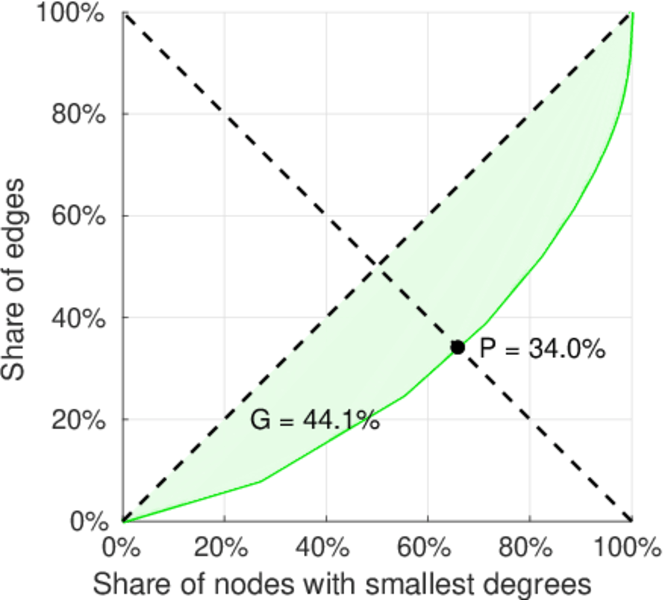
| Right balanced inequality ratio | P2 = | 0.339 961
|
| Relative edge distribution entropy | Her = | 0.741 017
|
| Power law exponent | γ = | 2.539 24
|
| Tail power law exponent | γt = | 3.521 00
|
| Tail power law exponent with p | γ3 = | 3.521 00
|
| p-value | p = | 0.000 00
|
| Left tail power law exponent with p | γ3,1 = | 1.741 00
|
| Left p-value | p1 = | 0.214 000
|
| Right tail power law exponent with p | γ3,2 = | 5.691 00
|
| Right p-value | p2 = | 0.080 000 0
|
| Degree assortativity | ρ = | −0.247 888
|
| Degree assortativity p-value | pρ = | 1.055 45 × 10−70
|
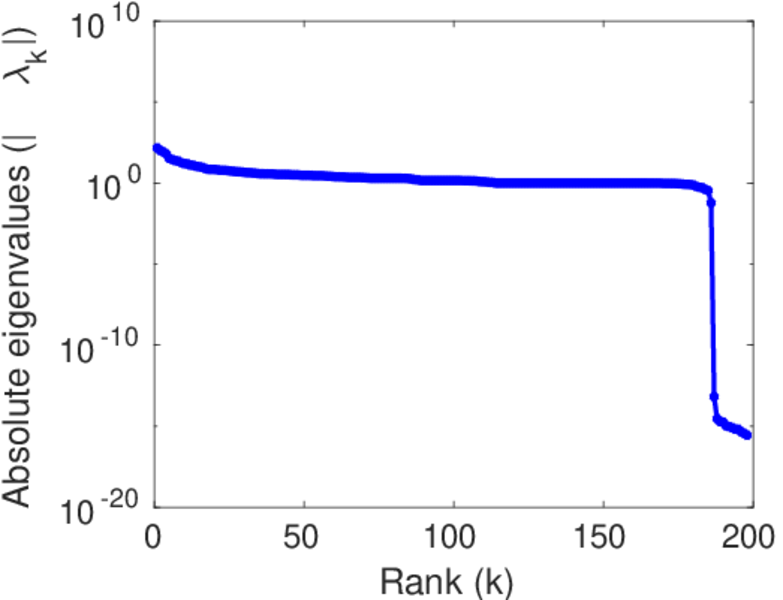
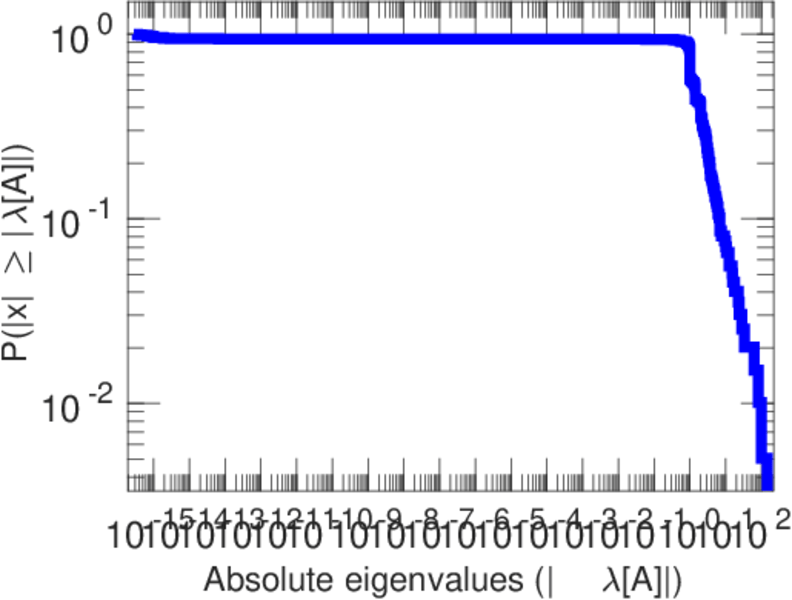
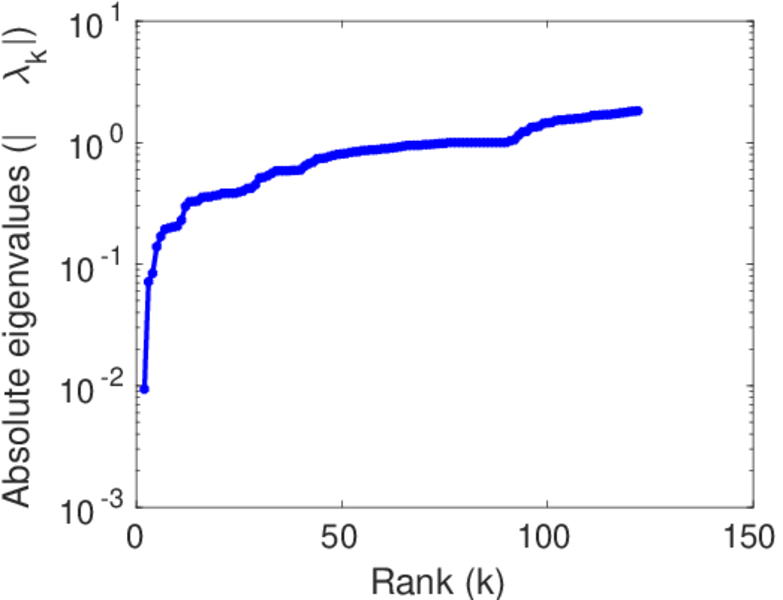
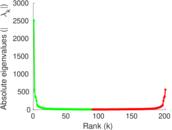
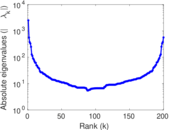
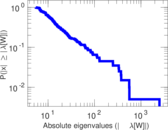
| Spectral norm | α = | 147.021
|
| Algebraic connectivity | a = | 0.009 379 87
|
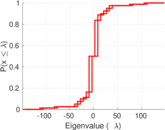
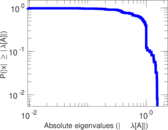
| Spectral separation | |λ1[A] / λ2[A]| = | 1.456 23
|
| Controllability | C = | 2,134
|
| Relative controllability | Cr = | 0.851 556
|
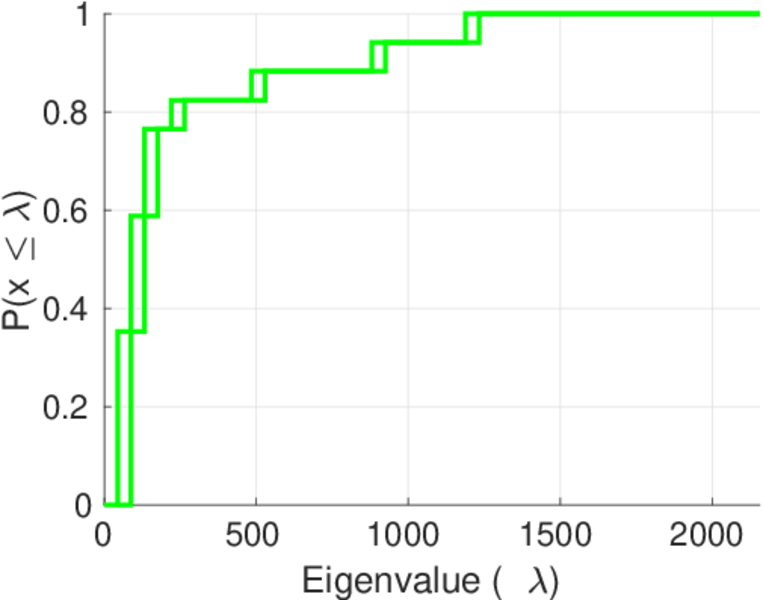
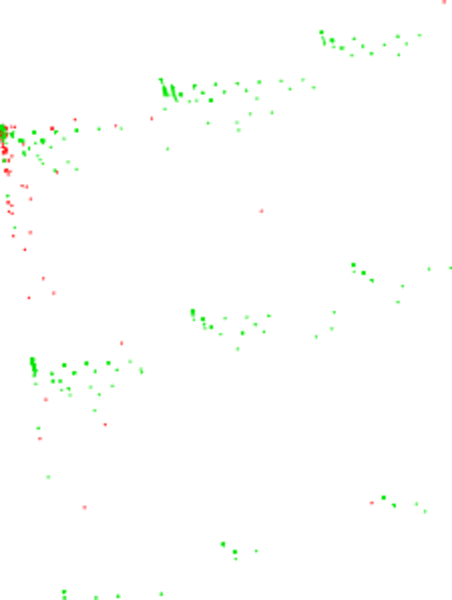
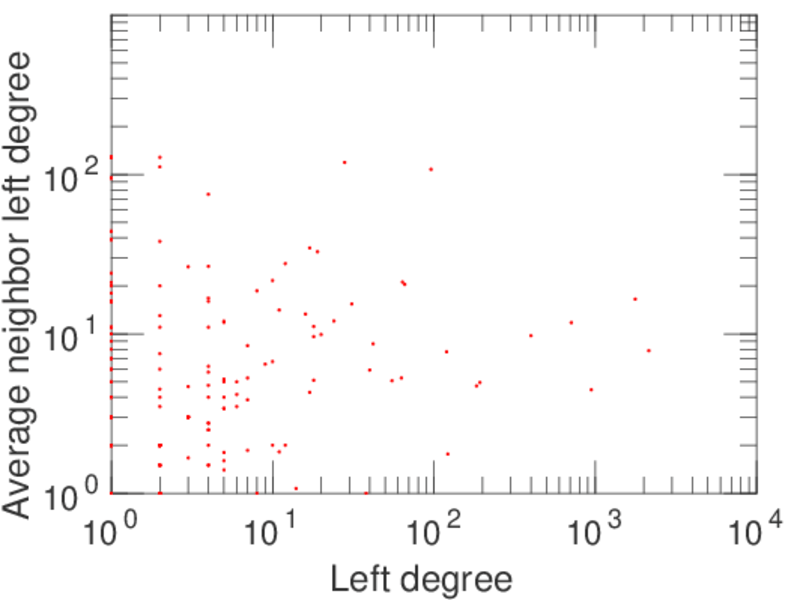
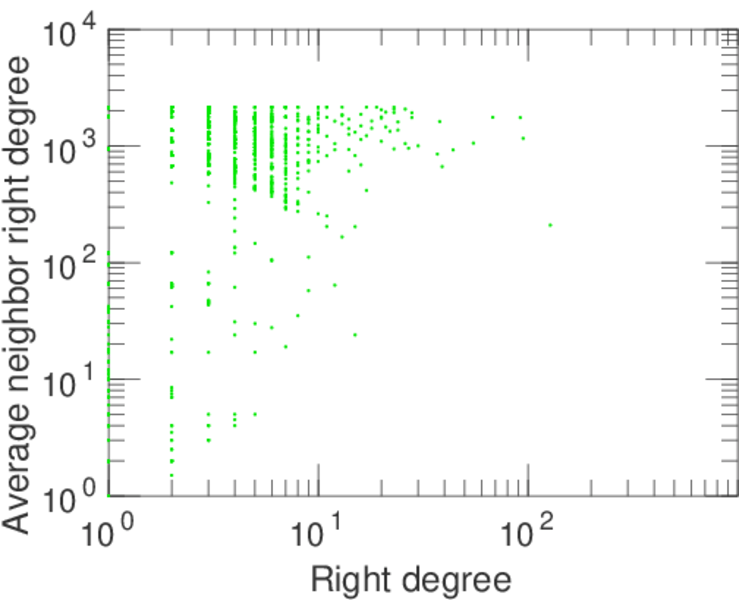
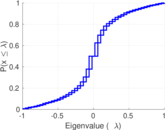
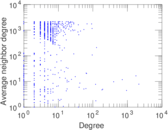
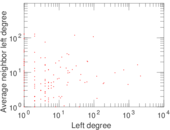
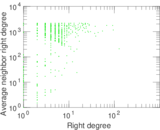
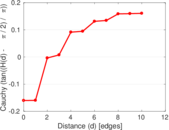
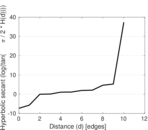
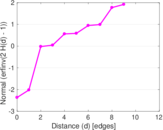
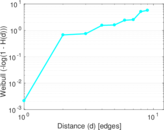
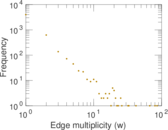
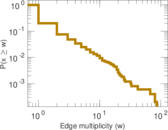
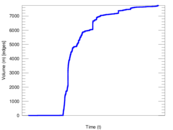
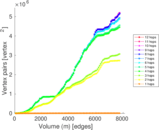
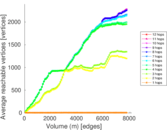
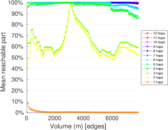
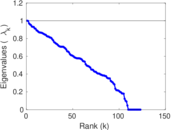
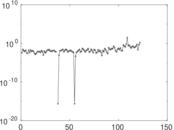
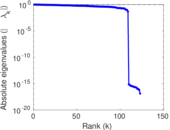
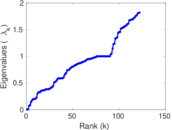
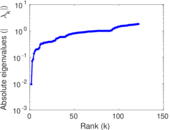
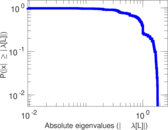
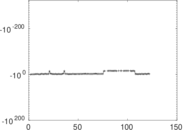
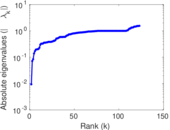
Plots


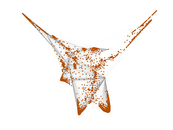
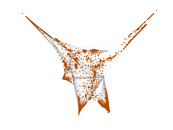


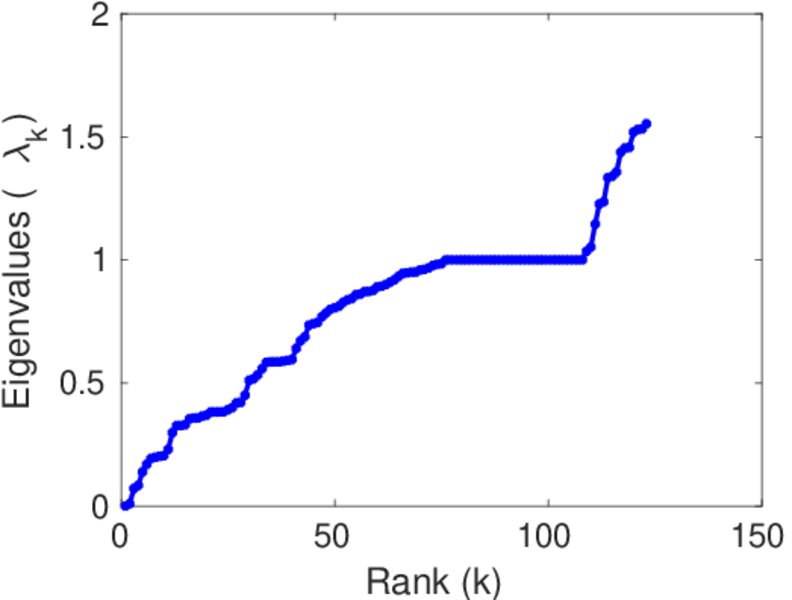
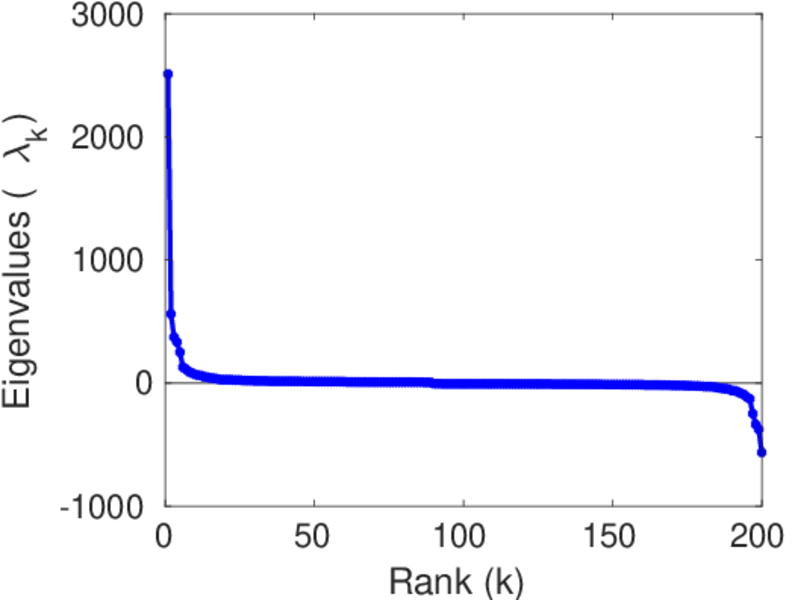
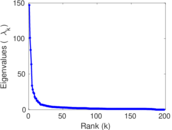
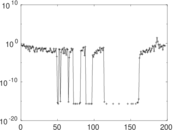
Matrix decompositions plots


Downloads
References
|
[1]
|
Jérôme Kunegis.
KONECT – The Koblenz Network Collection.
In Proc. Int. Conf. on World Wide Web Companion, pages
1343–1350, 2013.
[ http ]
|
|
[2]
|
Wikimedia Foundation.
Wikimedia downloads.
http://dumps.wikimedia.org/, January 2010.
|
 KONECT ‣ Networks ‣
Buy Me a Coffee
KONECT ‣ Networks ‣
Buy Me a Coffee