Wikiquote edits (sq)
This is the bipartite edit network of the Albanian Wikiquote. It contains users
and pages from the Albanian Wikiquote, connected by edit events. Each edge
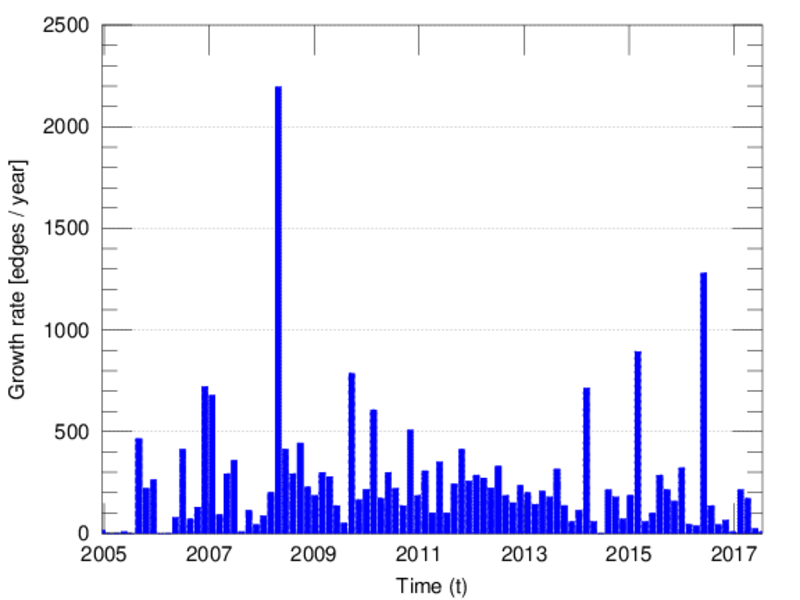
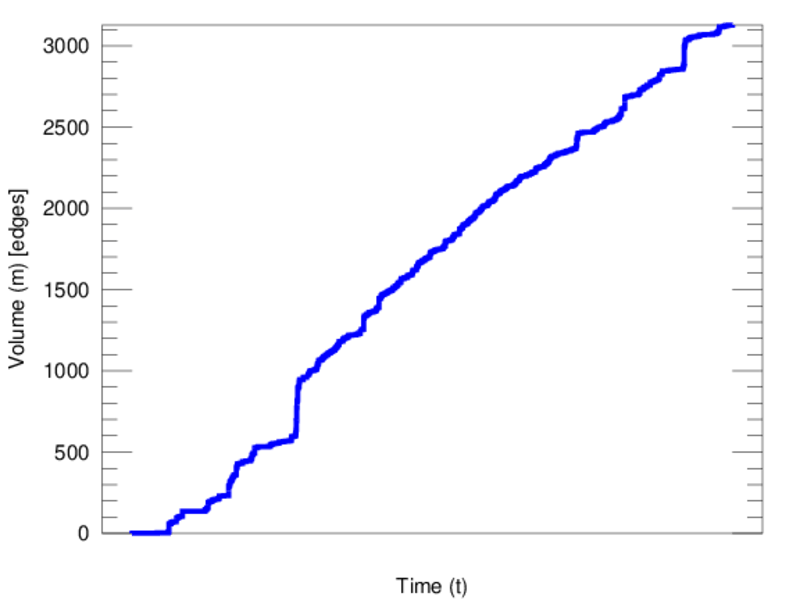
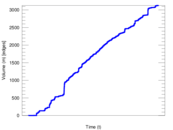
represents an edit. The dataset includes the timestamp of each edit.
Metadata
Statistics
| Size | n = | 1,200
|
| Left size | n1 = | 223
|
| Right size | n2 = | 977
|
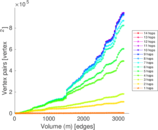
| Volume | m = | 3,128
|
| Unique edge count | m̿ = | 1,829
|
| Wedge count | s = | 62,240
|
| Claw count | z = | 2,707,293
|
| Cross count | x = | 110,395,485
|
| Square count | q = | 14,123
|
| 4-Tour count | T4 = | 366,854
|
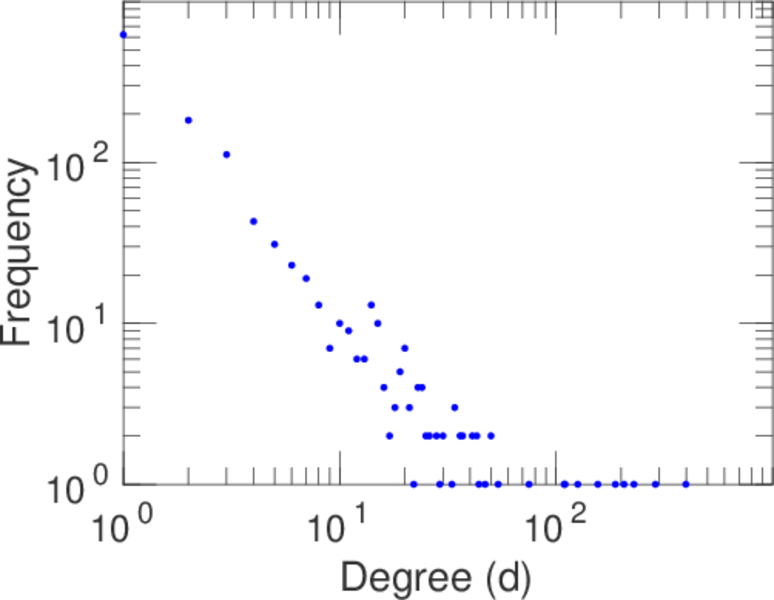
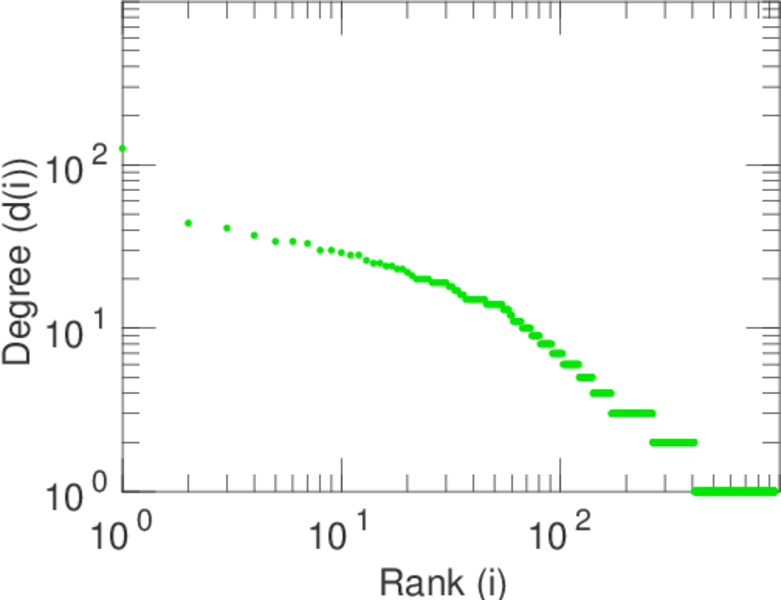
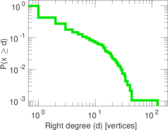
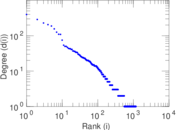
| Maximum degree | dmax = | 398
|
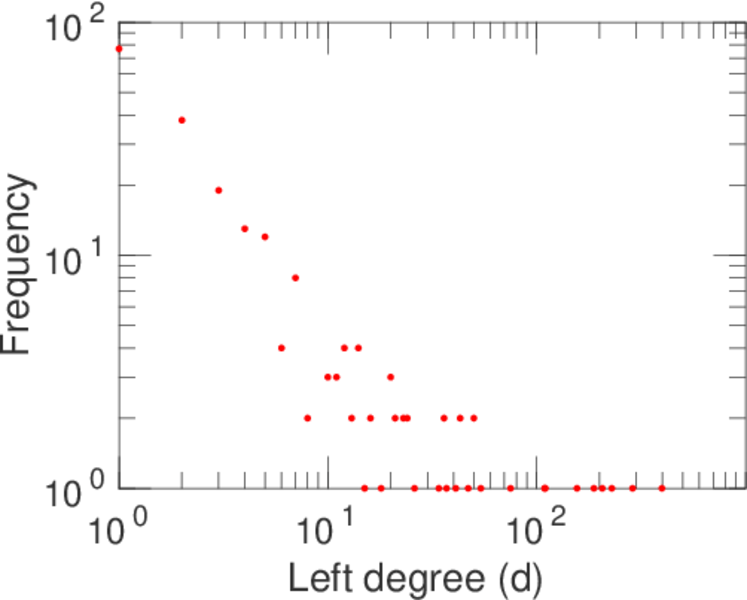
| Maximum left degree | d1max = | 398
|
| Maximum right degree | d2max = | 126
|
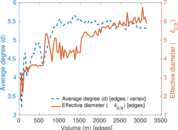
| Average degree | d = | 5.213 33
|
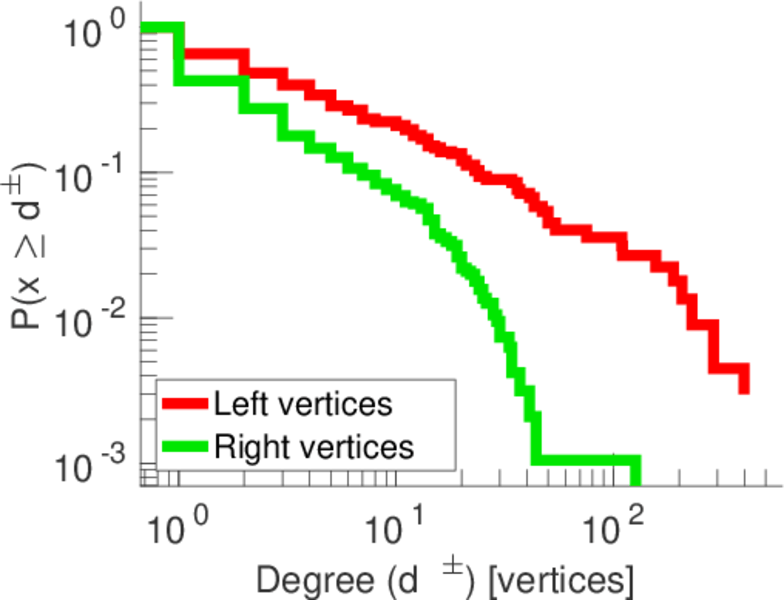
| Average left degree | d1 = | 14.026 9
|
| Average right degree | d2 = | 3.201 64
|
| Fill | p = | 0.008 394 88
|
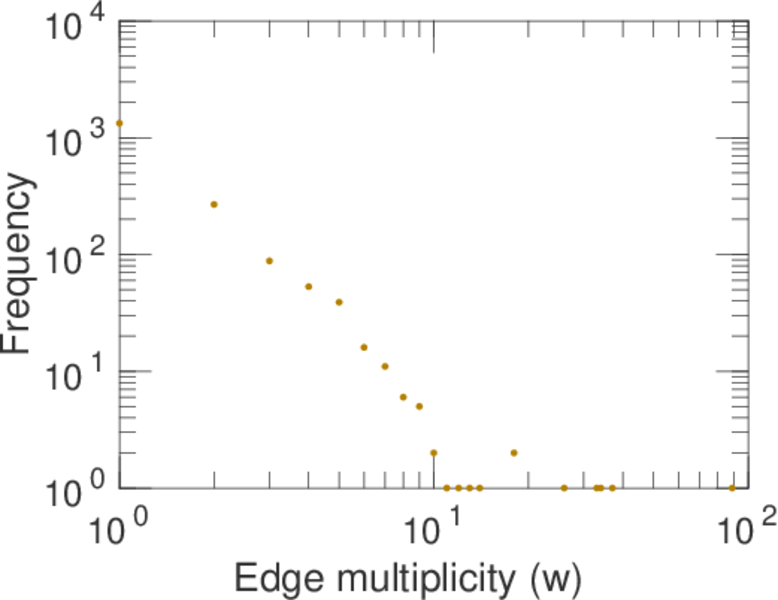
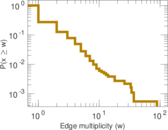
| Average edge multiplicity | m̃ = | 1.710 22
|
| Size of LCC | N = | 971
|
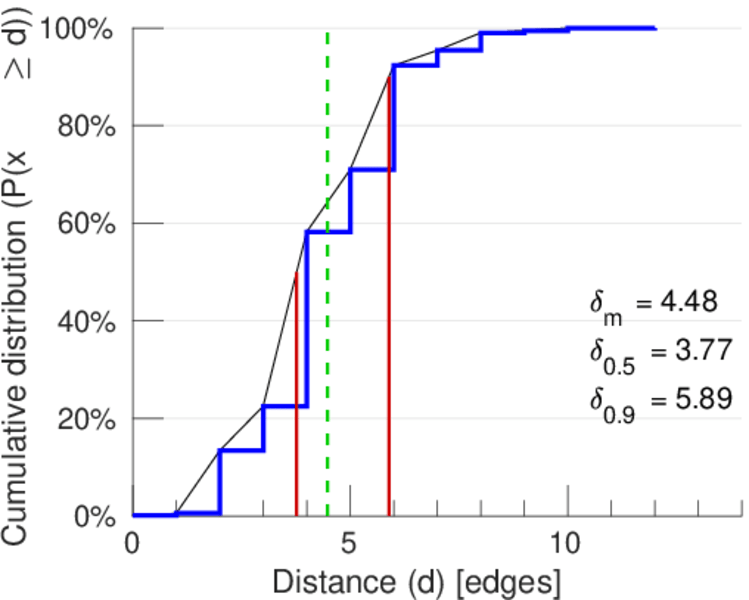
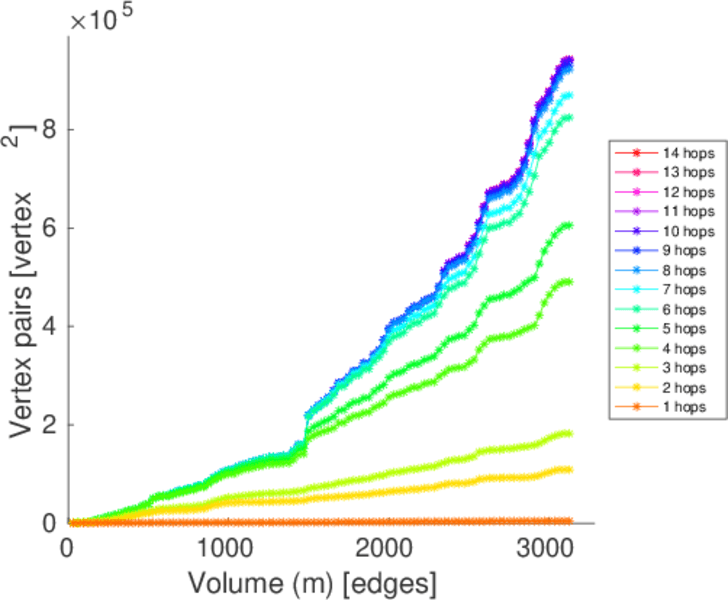
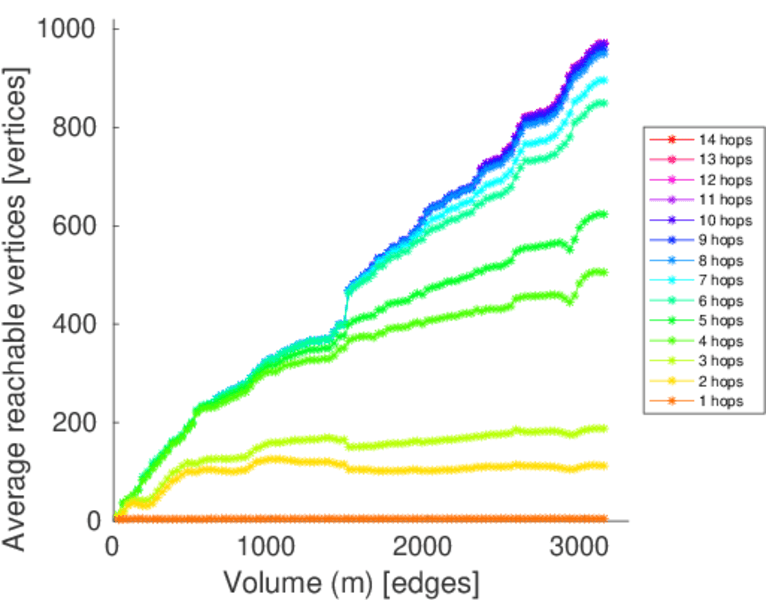
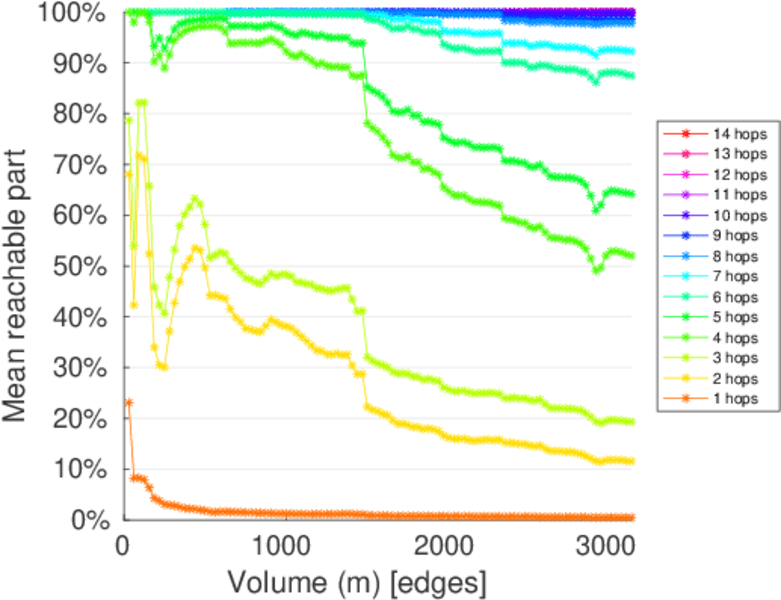
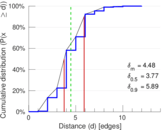
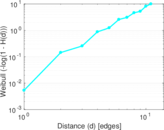
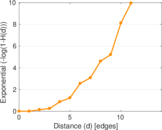
| Diameter | δ = | 14
|
| 50-Percentile effective diameter | δ0.5 = | 3.769 99
|
| 90-Percentile effective diameter | δ0.9 = | 5.891 95
|
| Median distance | δM = | 4
|
| Mean distance | δm = | 4.481 28
|
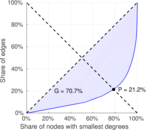
| Gini coefficient | G = | 0.734 396
|
| Balanced inequality ratio | P = | 0.198 529
|
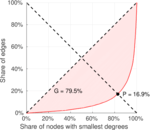
| Left balanced inequality ratio | P1 = | 0.169 118
|
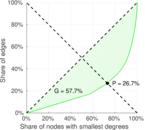
| Right balanced inequality ratio | P2 = | 0.266 944
|
| Relative edge distribution entropy | Her = | 0.849 736
|
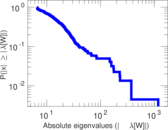
| Power law exponent | γ = | 3.052 36
|
| Tail power law exponent | γt = | 2.101 00
|
| Tail power law exponent with p | γ3 = | 2.101 00
|
| p-value | p = | 0.062 000 0
|
| Left tail power law exponent with p | γ3,1 = | 1.681 00
|
| Left p-value | p1 = | 0.047 000 0
|
| Right tail power law exponent with p | γ3,2 = | 2.311 00
|
| Right p-value | p2 = | 0.064 000 0
|
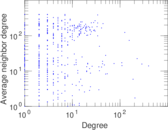
| Degree assortativity | ρ = | −0.248 740
|
| Degree assortativity p-value | pρ = | 3.414 49 × 10−27
|
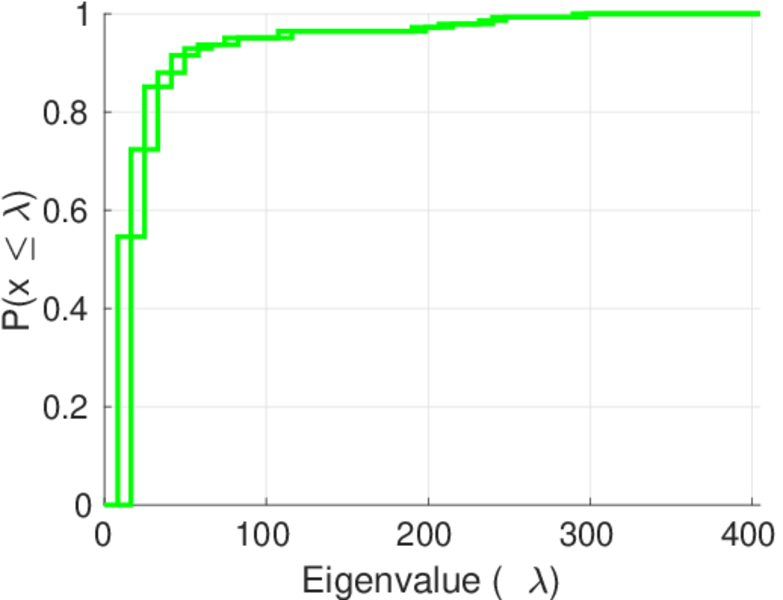
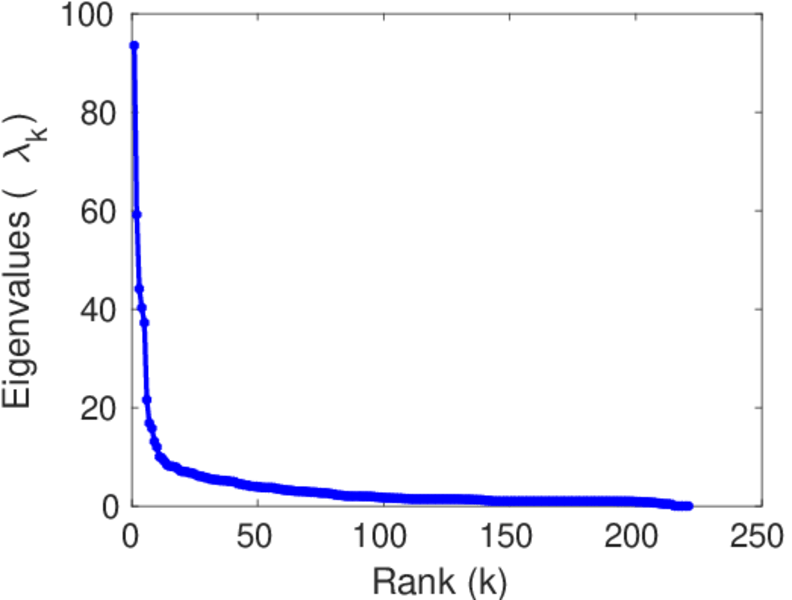
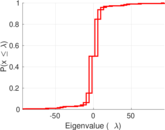
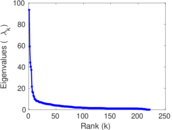
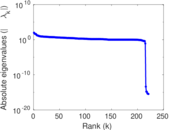
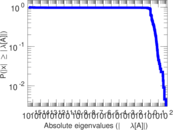
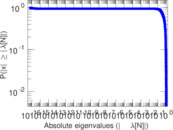
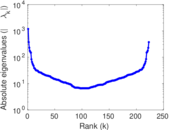
| Spectral norm | α = | 93.518 4
|
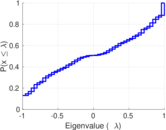
| Algebraic connectivity | a = | 0.014 070 5
|
| Spectral separation | |λ1[A] / λ2[A]| = | 1.580 37
|
| Controllability | C = | 746
|
| Relative controllability | Cr = | 0.634 354
|
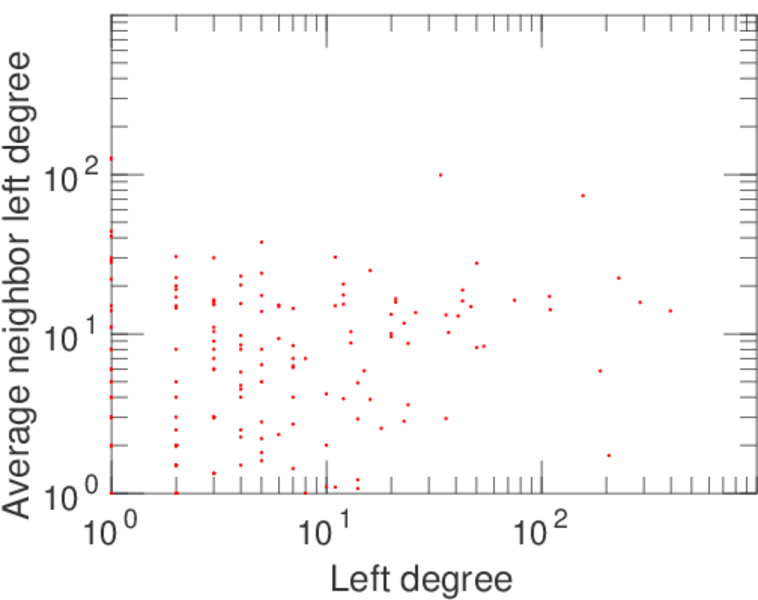
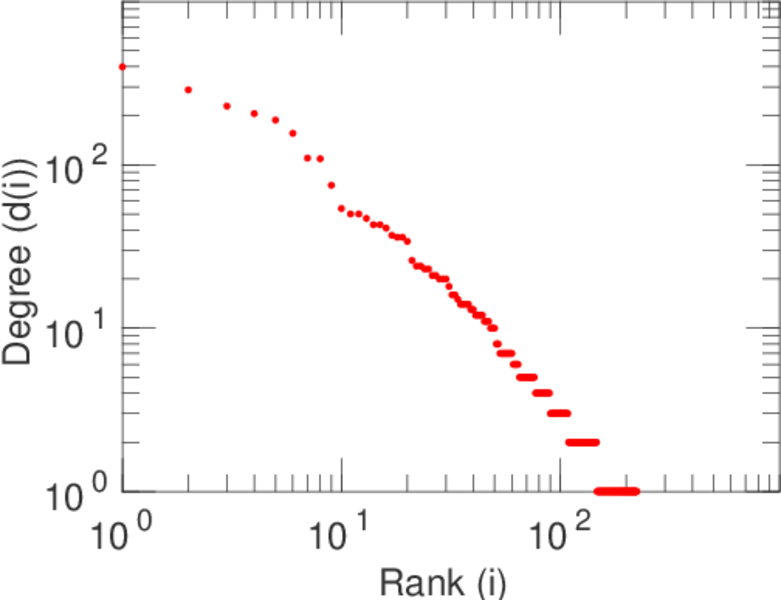
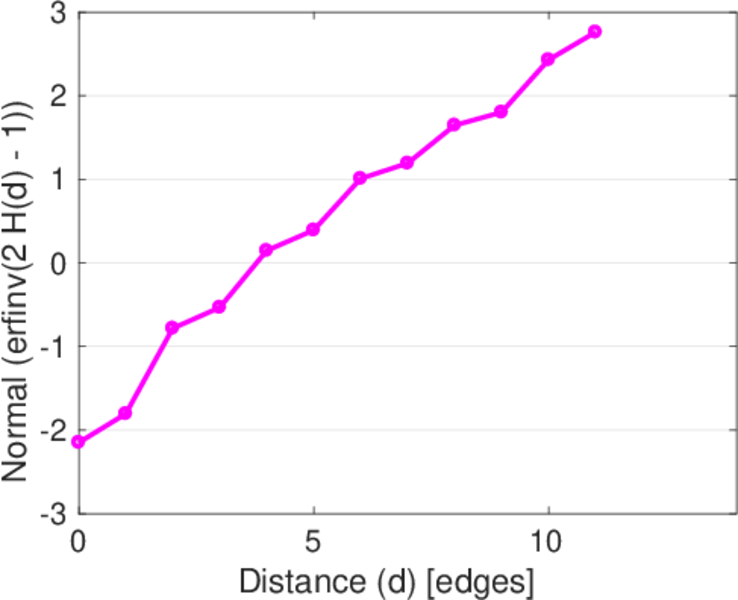
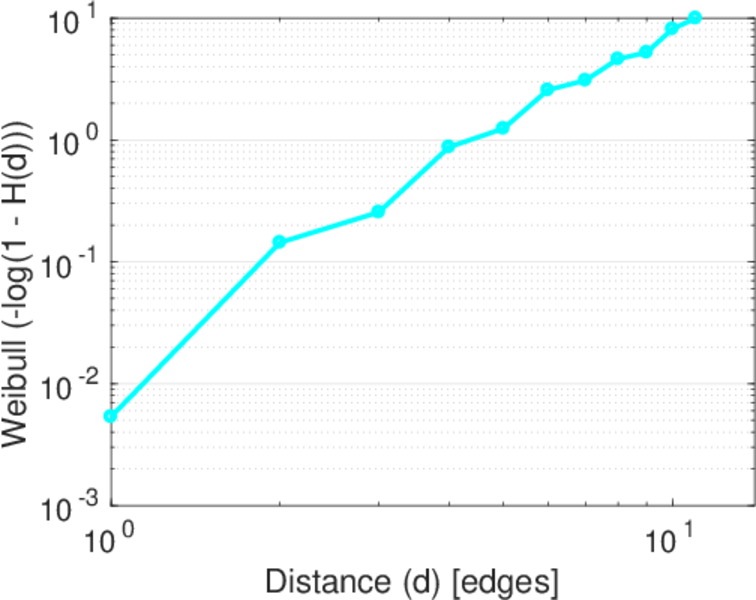
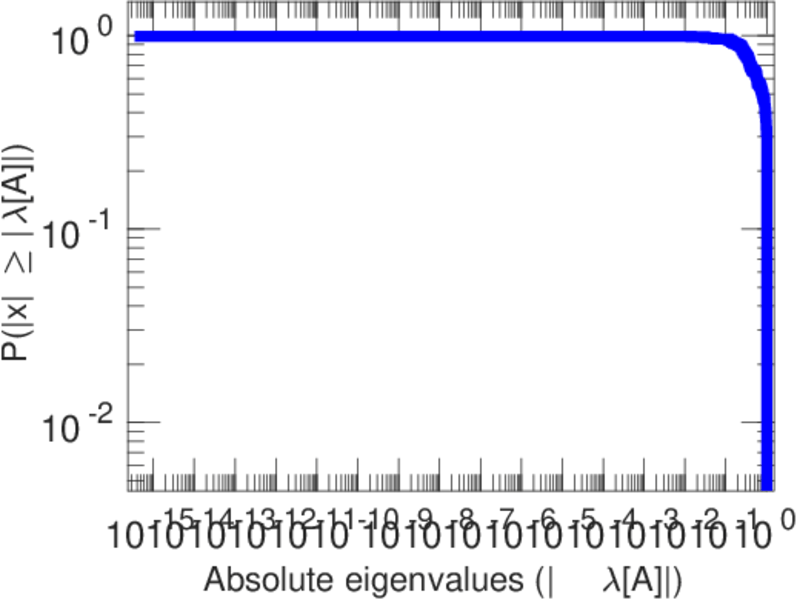
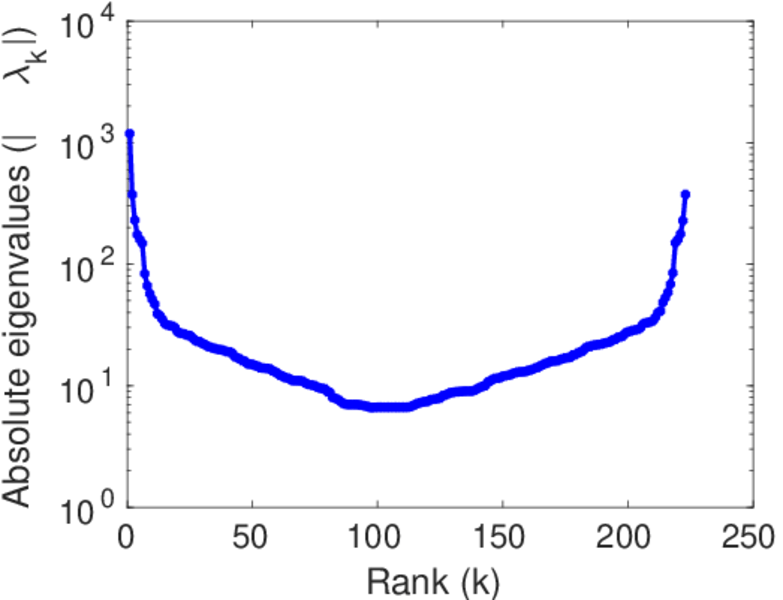
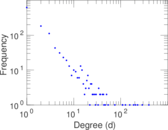
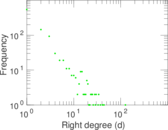
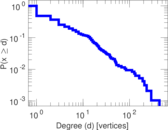
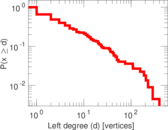
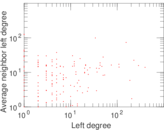
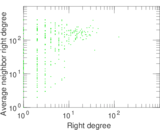
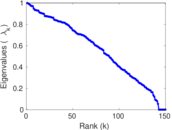
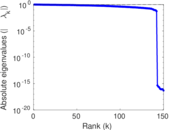
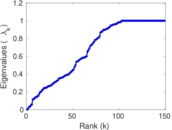
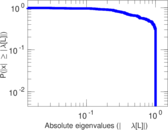
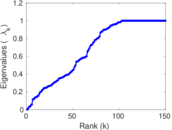
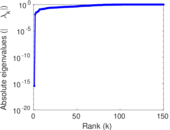
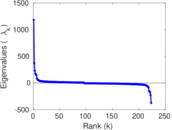
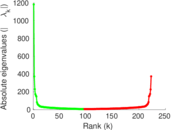
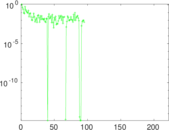
Plots


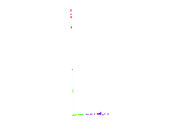


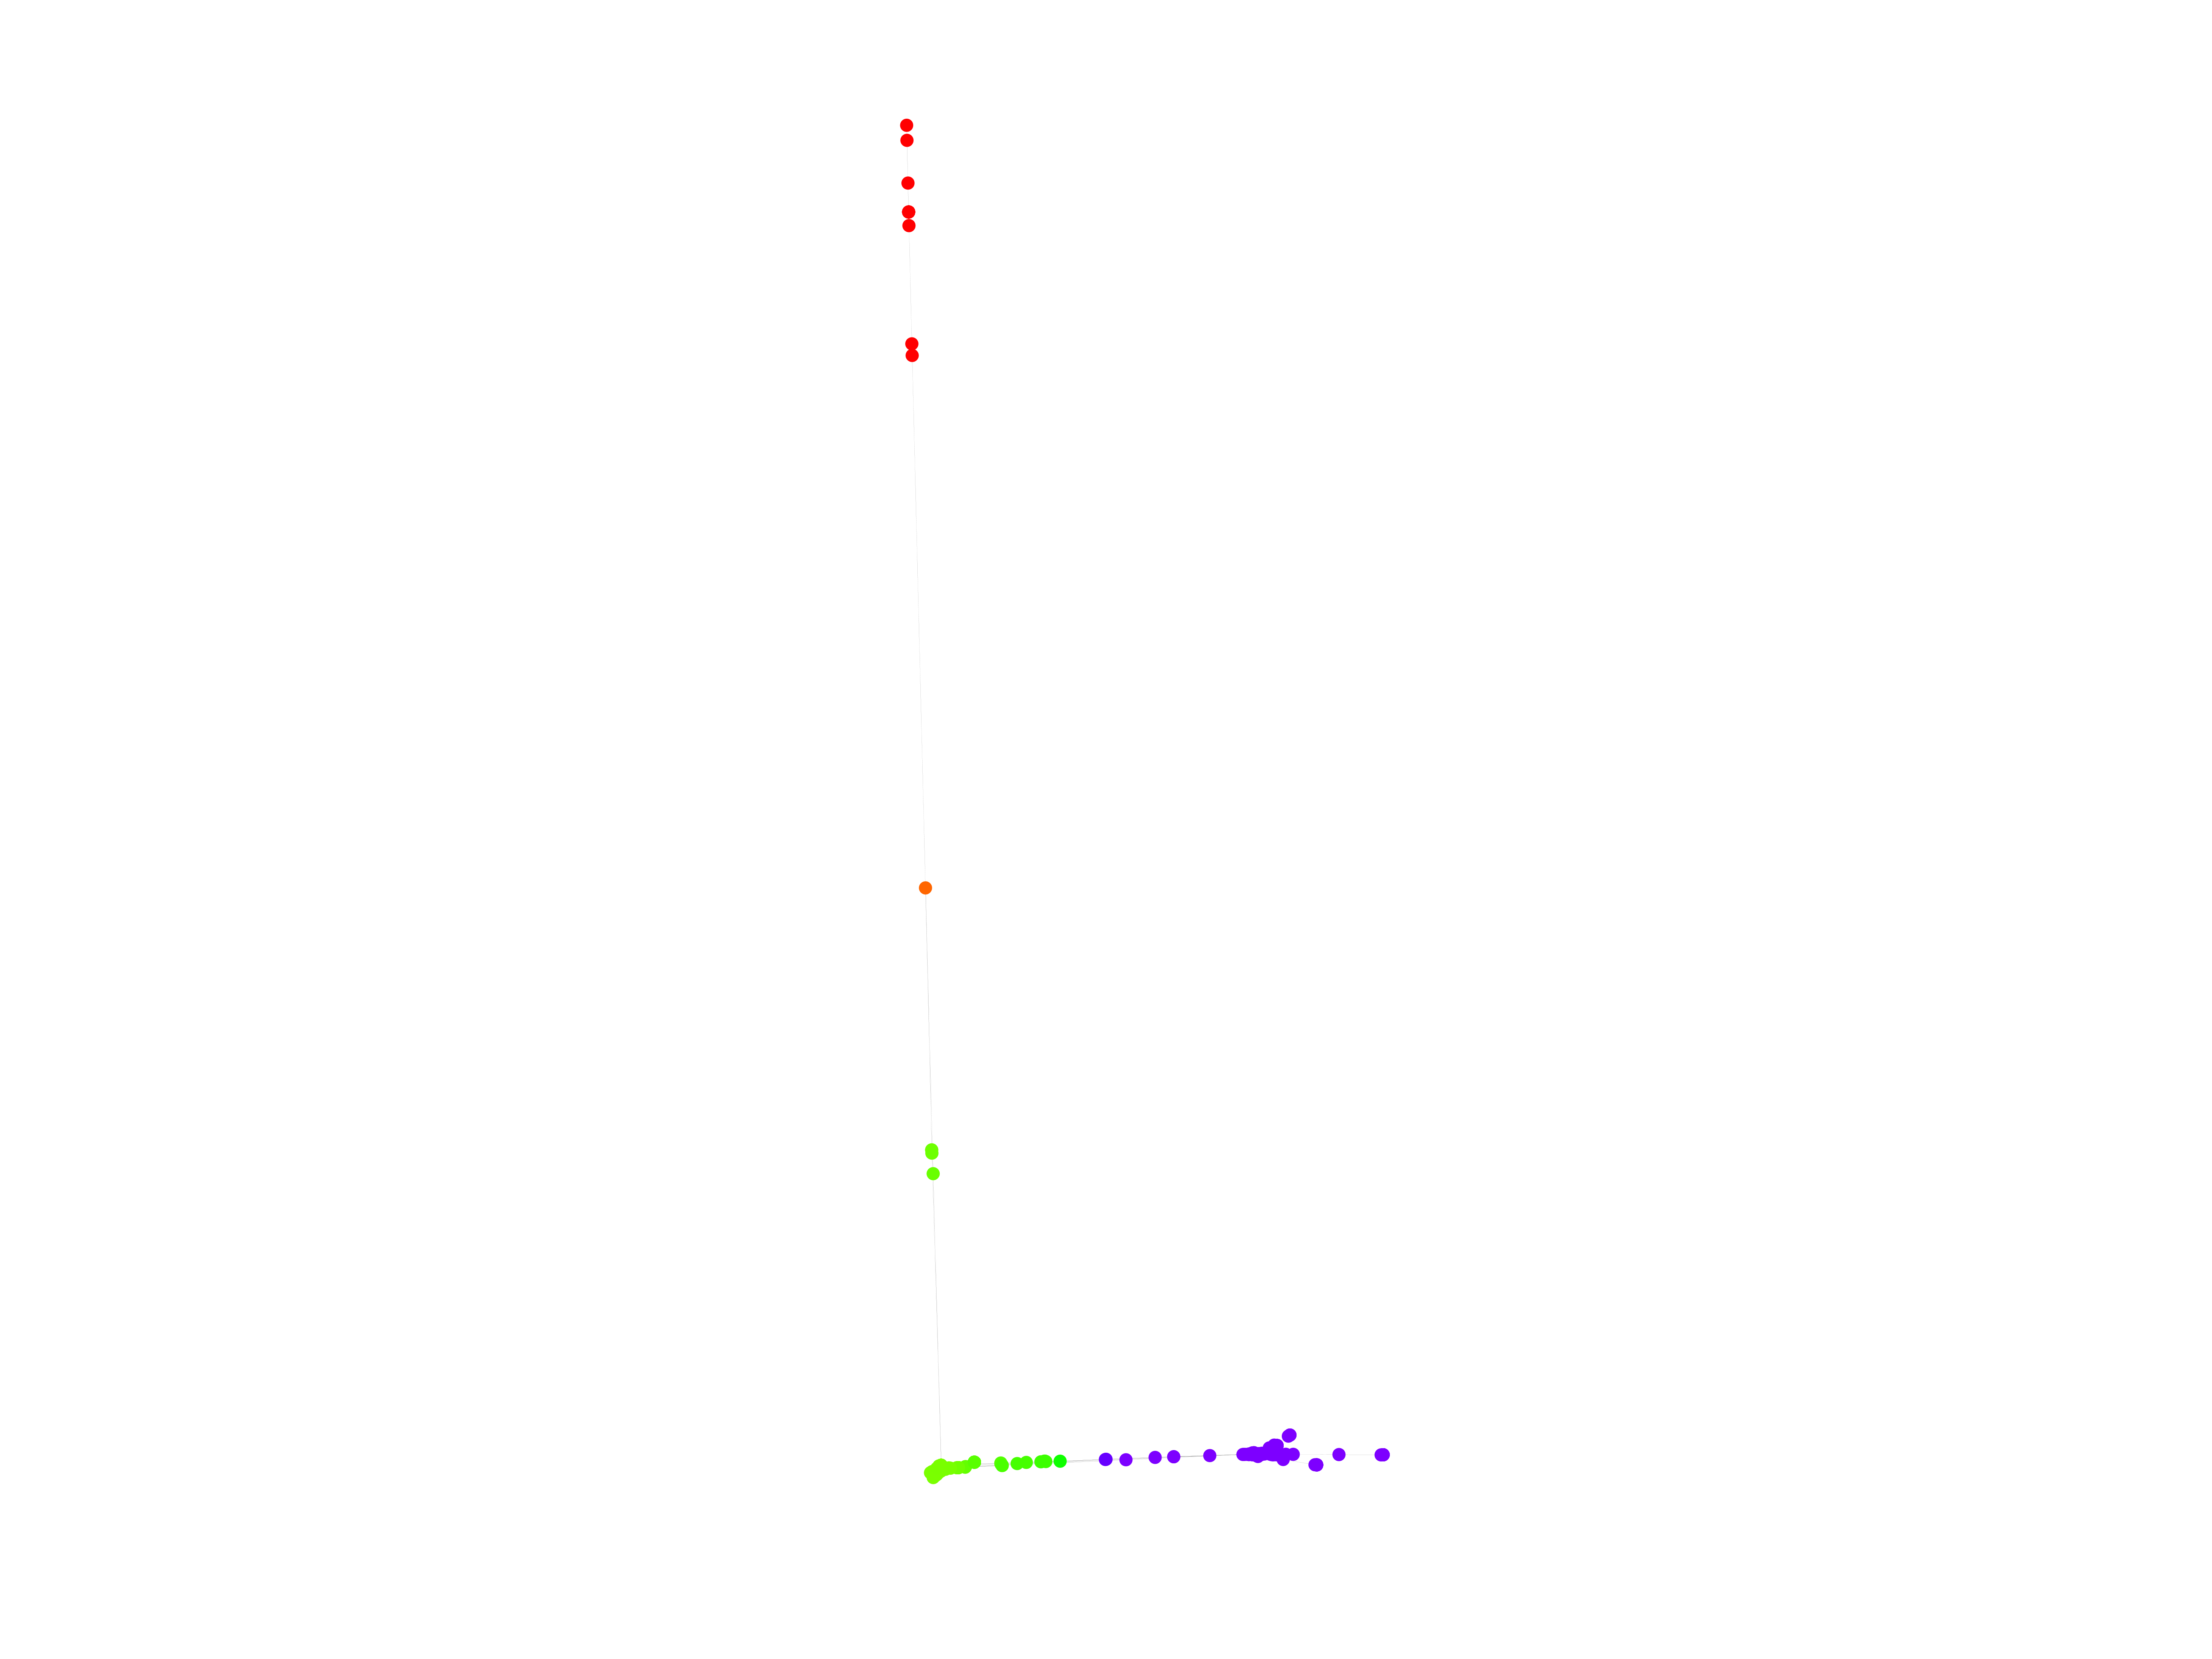
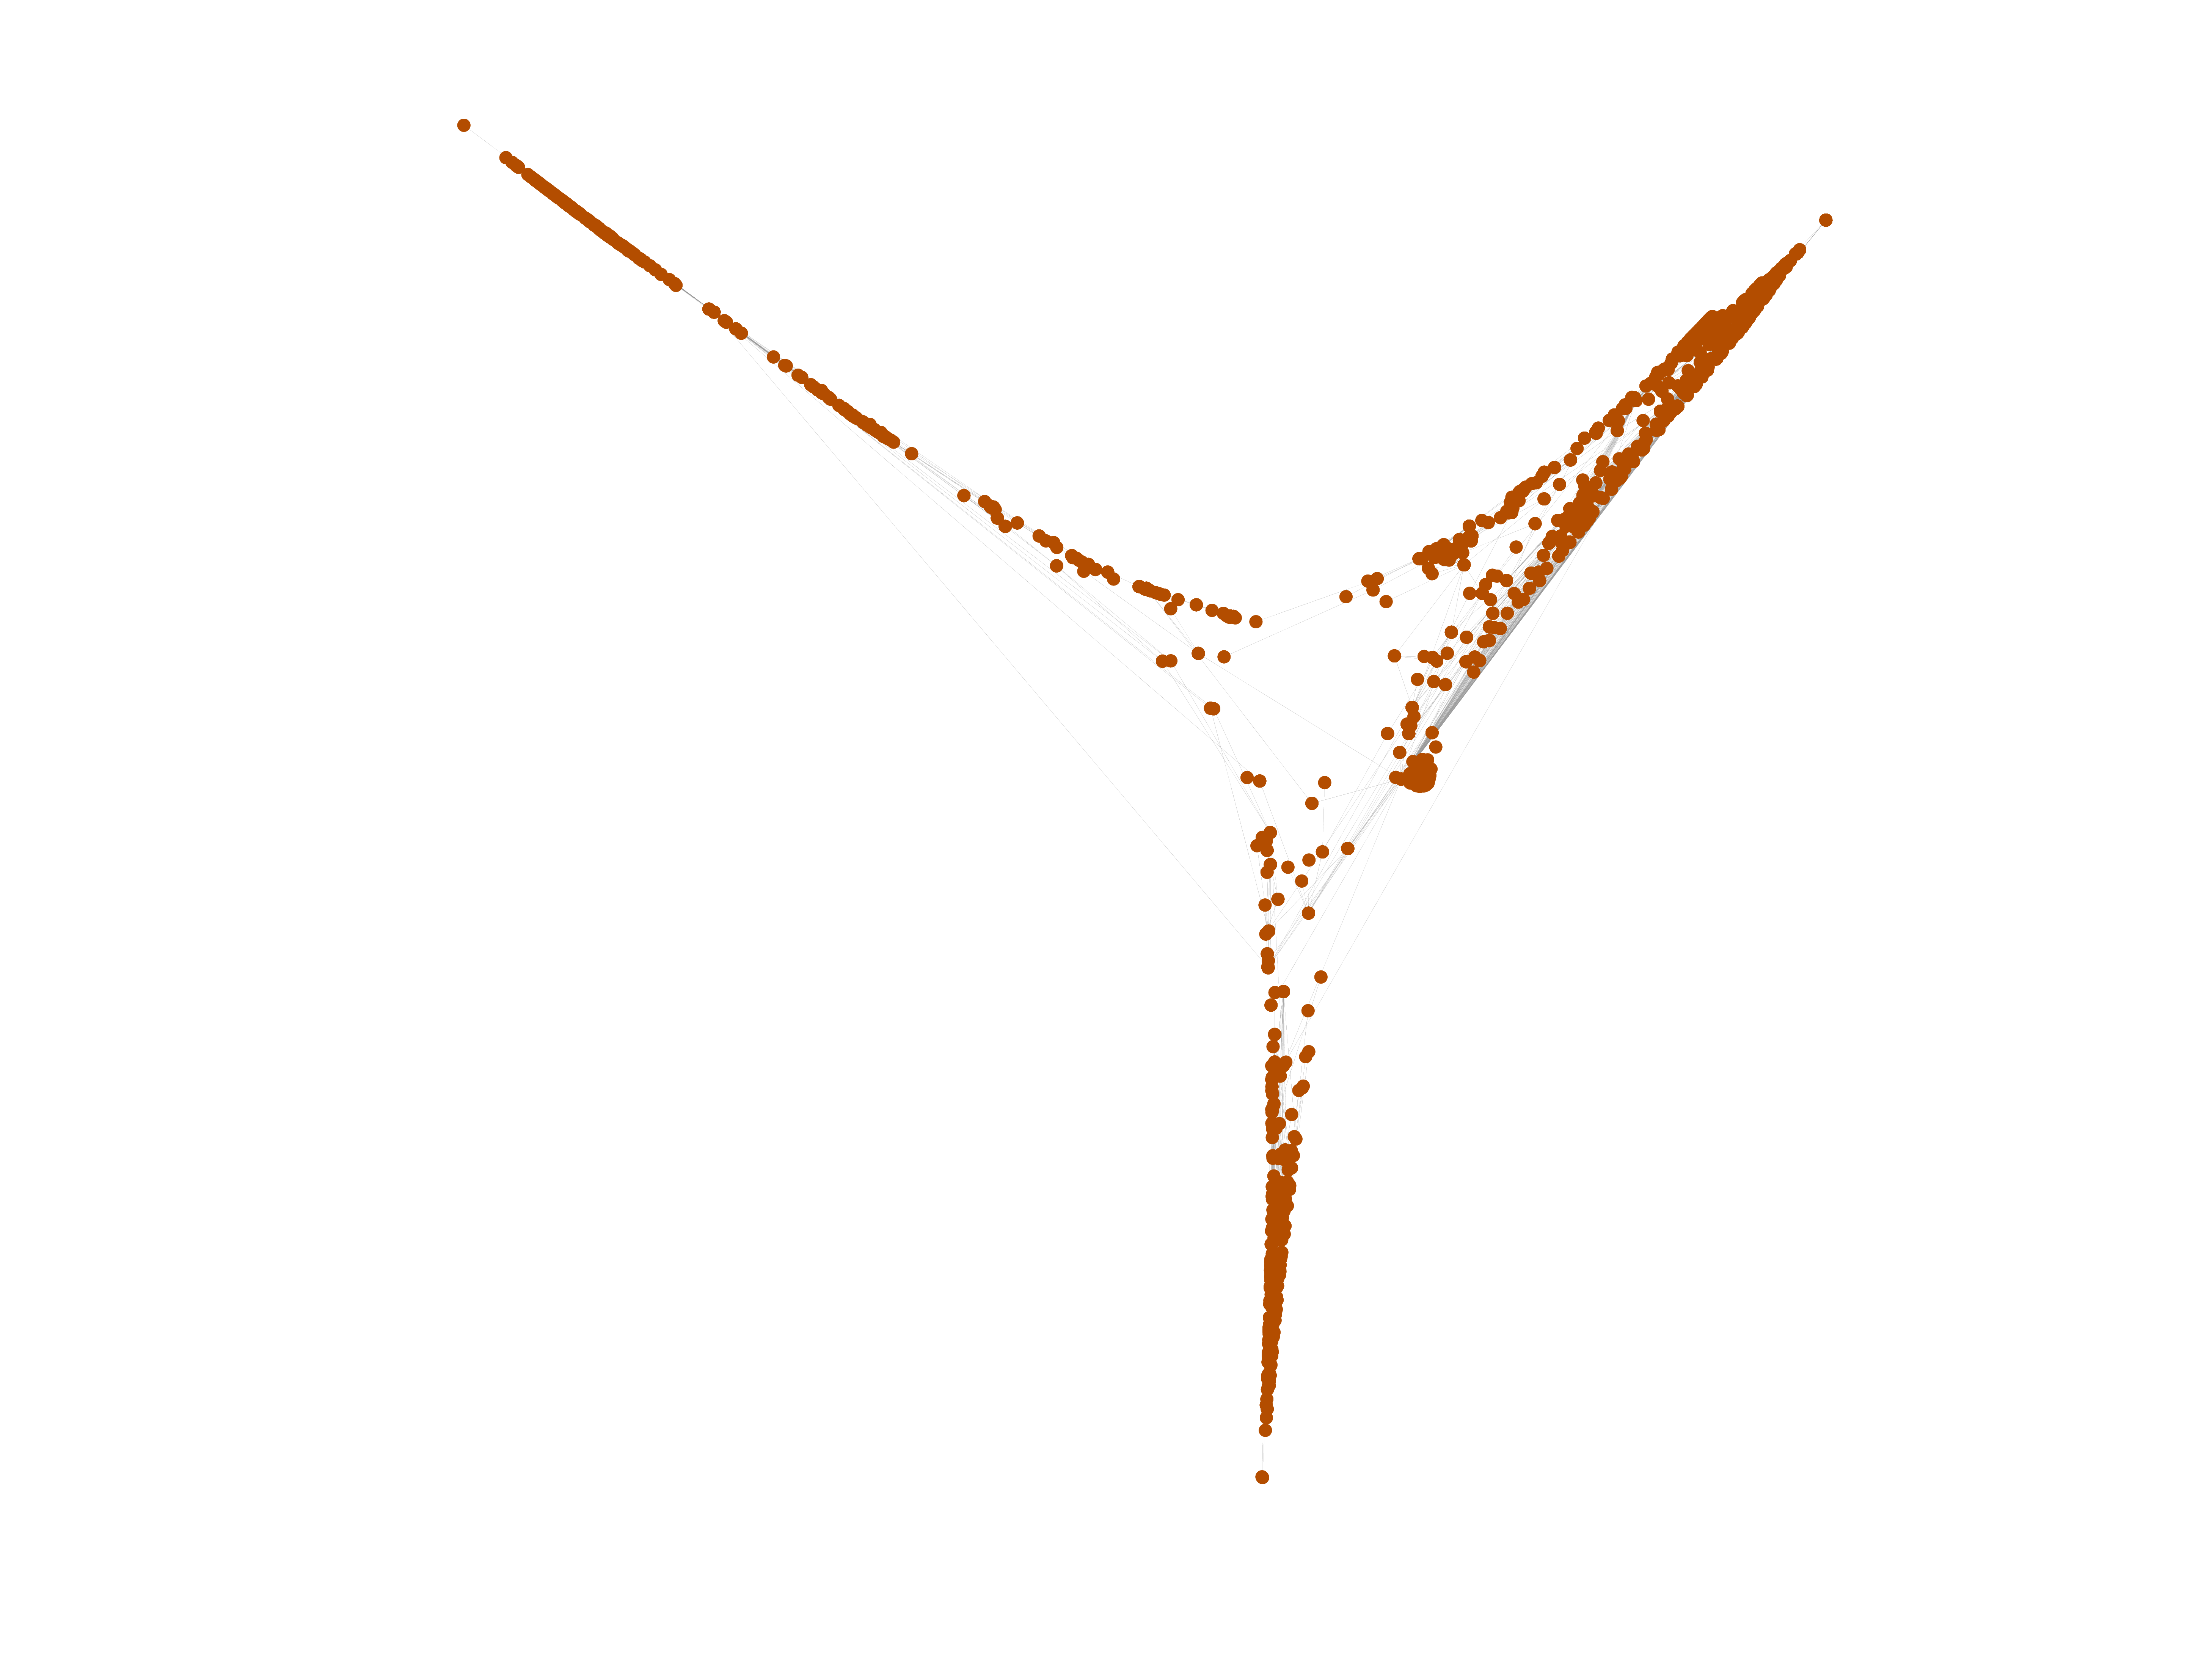
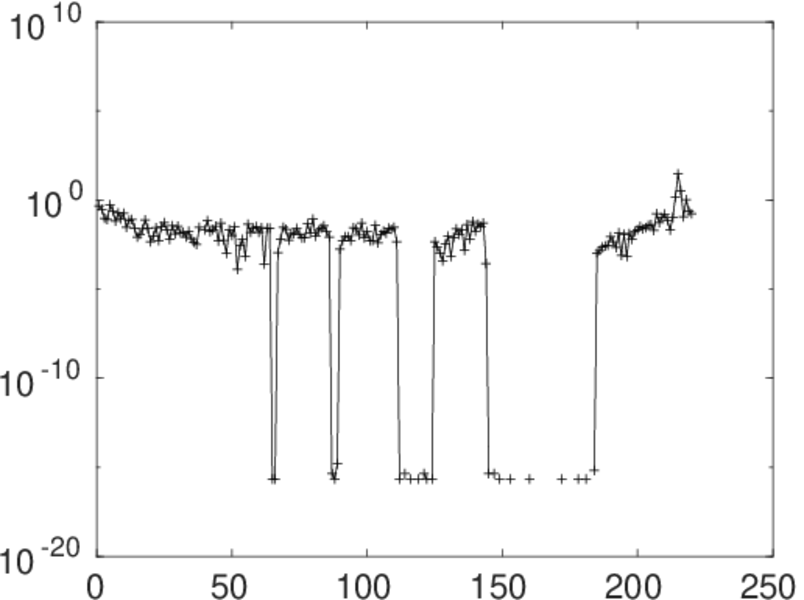
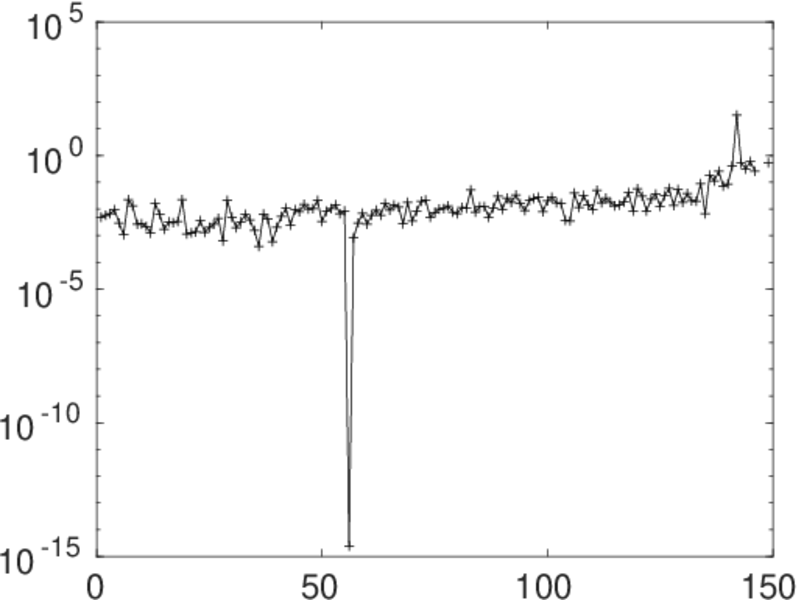
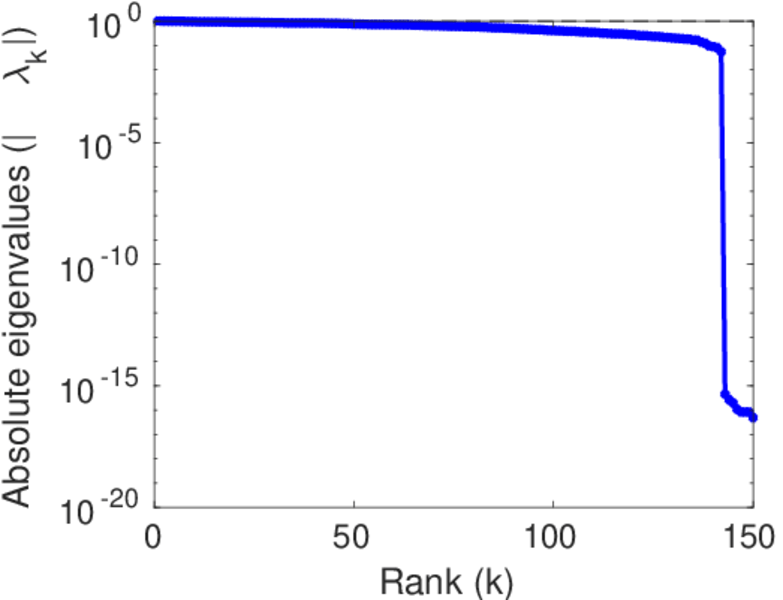
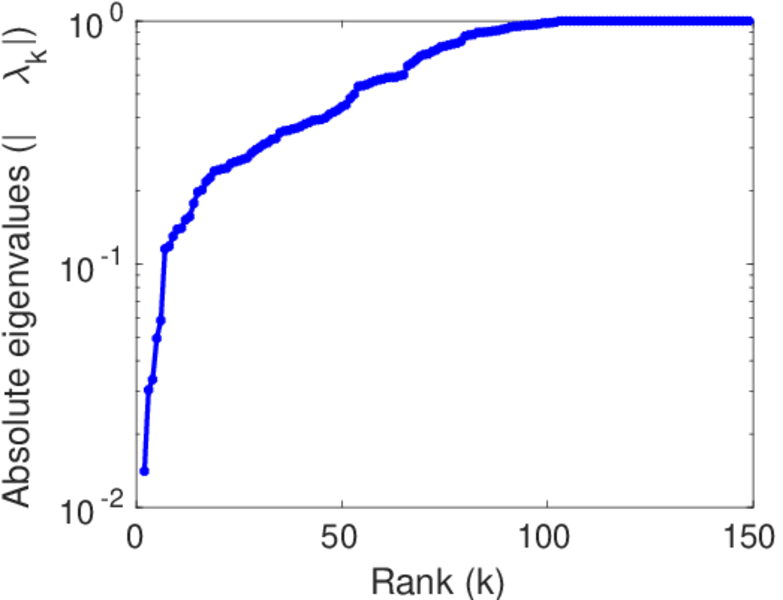
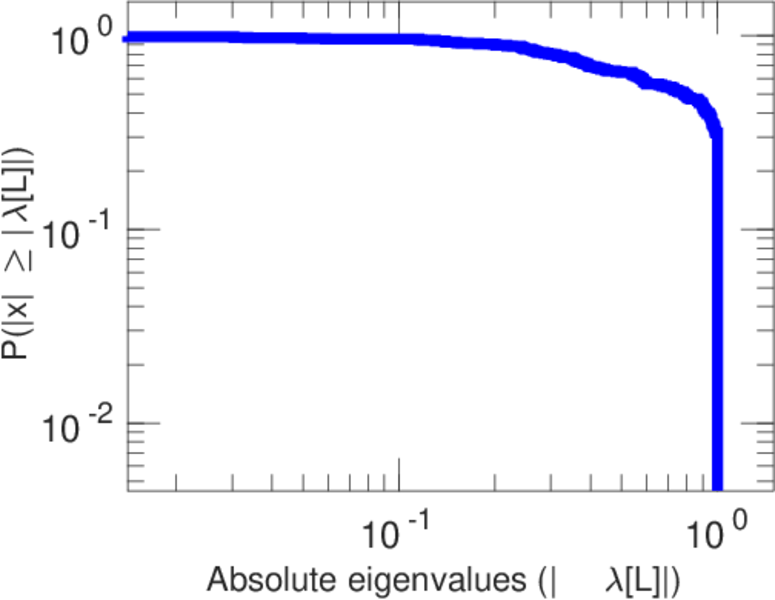
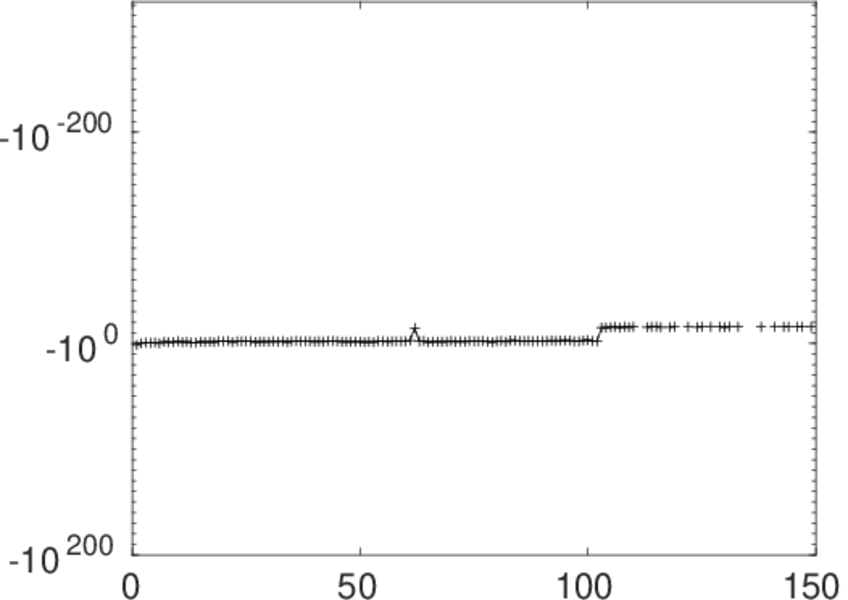
Matrix decompositions plots


Downloads
References
|
[1]
|
Jérôme Kunegis.
KONECT – The Koblenz Network Collection.
In Proc. Int. Conf. on World Wide Web Companion, pages
1343–1350, 2013.
[ http ]
|
|
[2]
|
Wikimedia Foundation.
Wikimedia downloads.
http://dumps.wikimedia.org/, January 2010.
|
 KONECT ‣ Networks ‣
Buy Me a Coffee
KONECT ‣ Networks ‣
Buy Me a Coffee