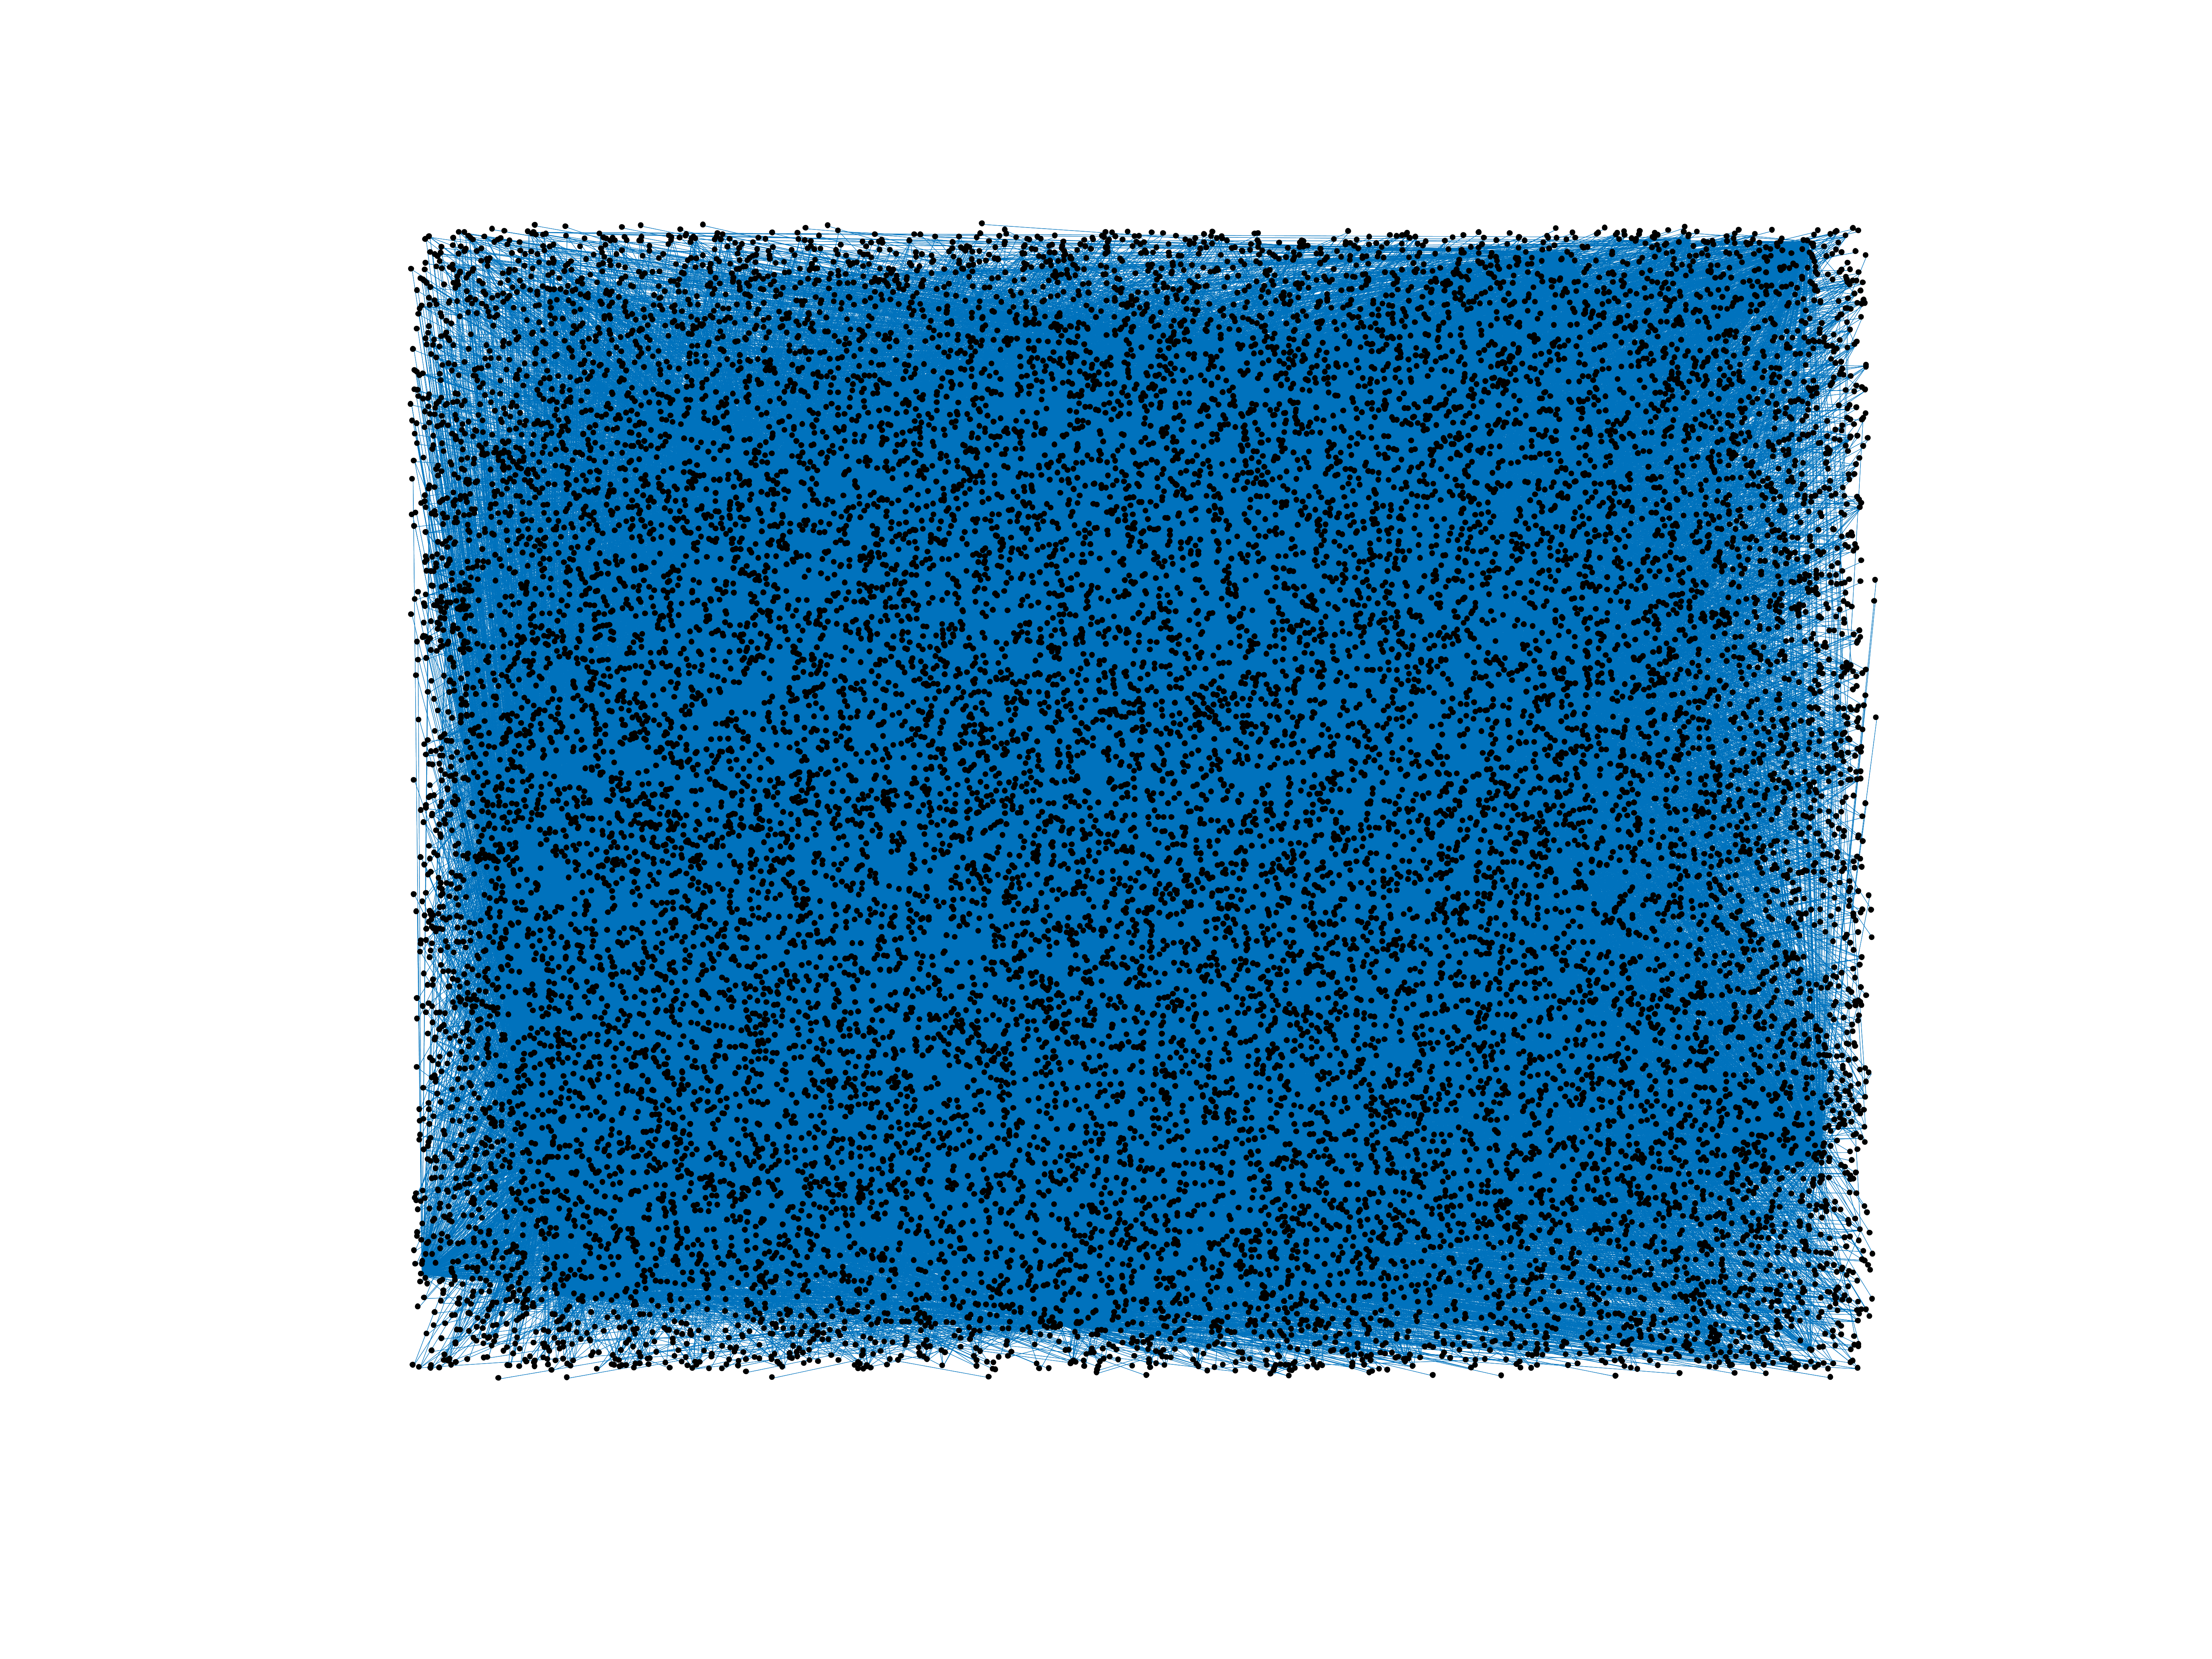
Wiktionary edits (sq)
This is the bipartite edit network of the Albanian Wiktionary. It contains
users and pages from the Albanian Wiktionary, connected by edit events. Each
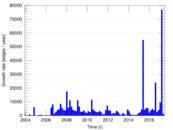
edge represents an edit. The dataset includes the timestamp of each edit.
Metadata
Statistics
| Size | n = | 42,932
|
| Left size | n1 = | 368
|
| Right size | n2 = | 42,564
|
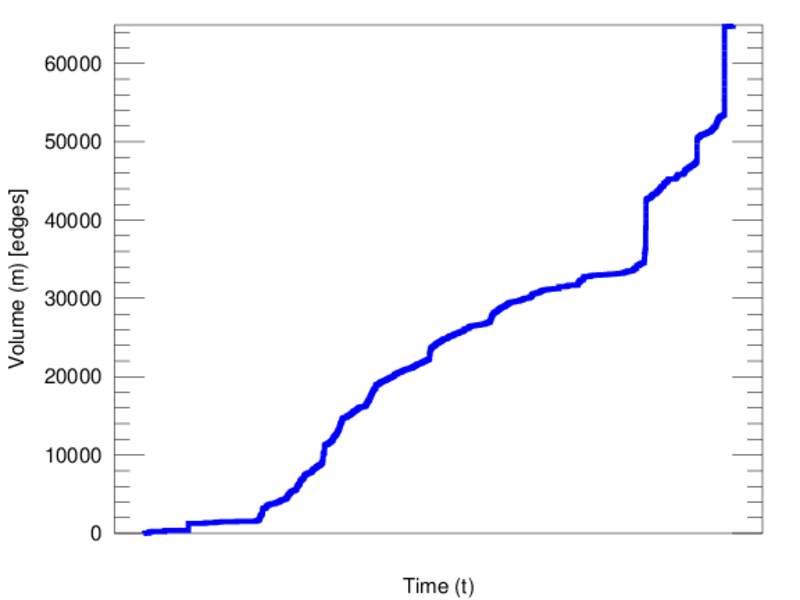
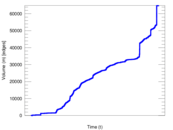
| Volume | m = | 64,908
|
| Unique edge count | m̿ = | 45,270
|
| Wedge count | s = | 133,402,180
|
| Claw count | z = | 399,517,661,956
|
| Cross count | x = | 987,781,424,644,622
|
| Square count | q = | 63,078,403
|
| 4-Tour count | T4 = | 1,038,327,492
|
| Maximum degree | dmax = | 15,183
|
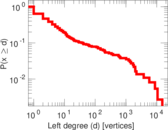
| Maximum left degree | d1max = | 15,183
|
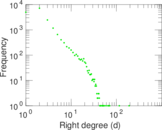
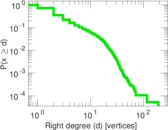
| Maximum right degree | d2max = | 191
|
| Average degree | d = | 3.023 76
|
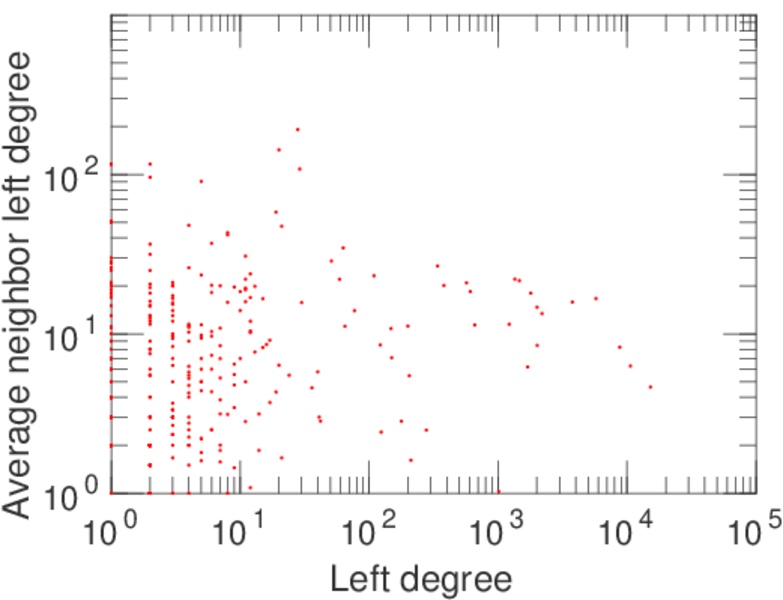
| Average left degree | d1 = | 176.380
|
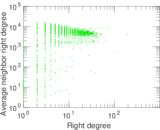
| Average right degree | d2 = | 1.524 95
|
| Fill | p = | 0.002 890 15
|
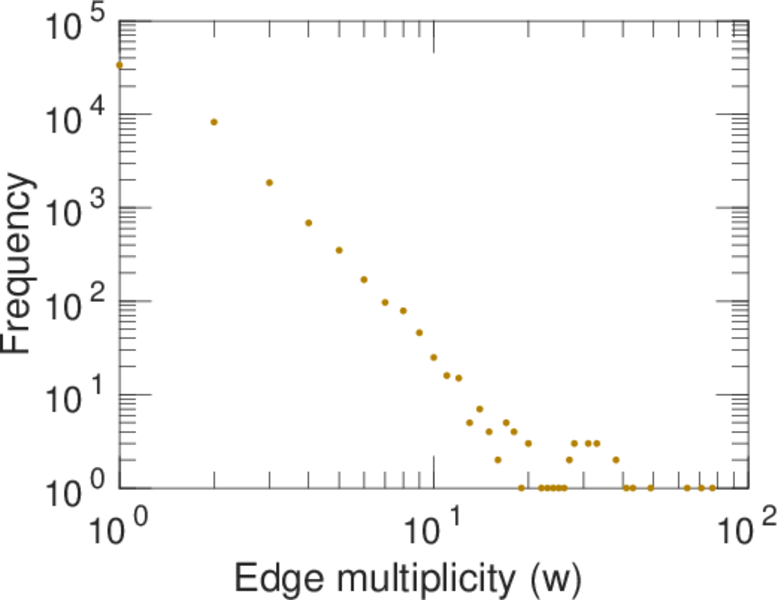
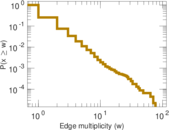
| Average edge multiplicity | m̃ = | 1.433 80
|
| Size of LCC | N = | 18,861
|
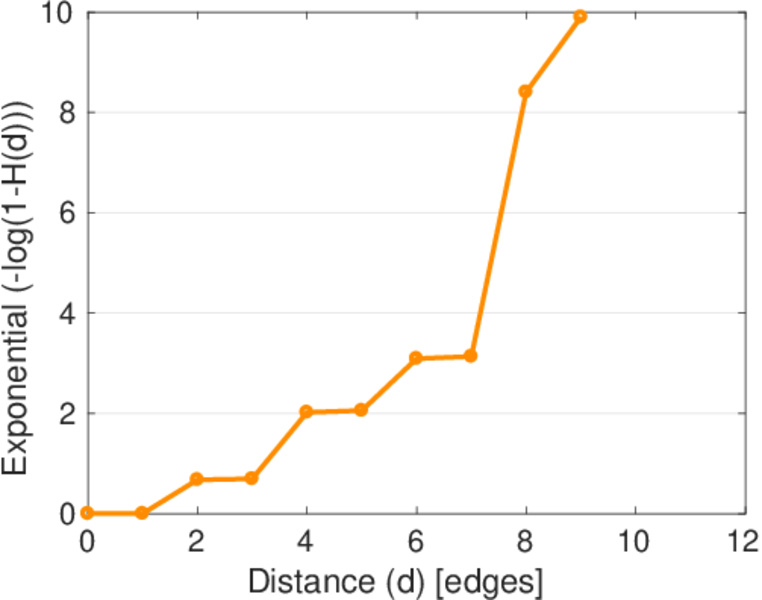
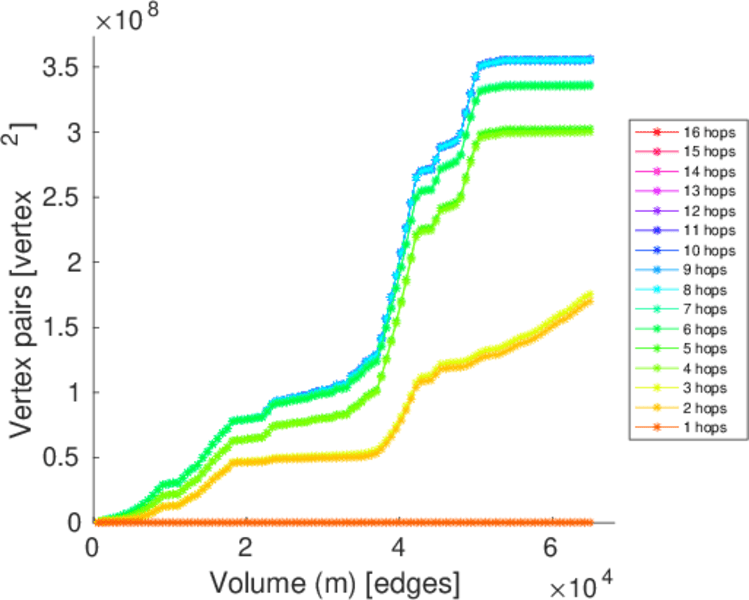
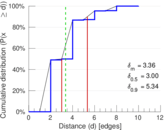
| Diameter | δ = | 13
|
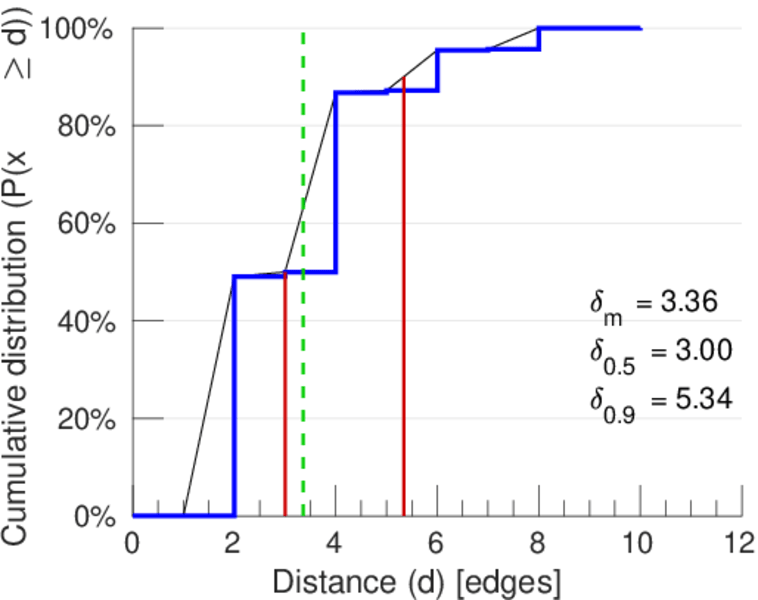
| 50-Percentile effective diameter | δ0.5 = | 3.000 40
|
| 90-Percentile effective diameter | δ0.9 = | 5.340 45
|
| Median distance | δM = | 4
|
| Mean distance | δm = | 3.359 36
|
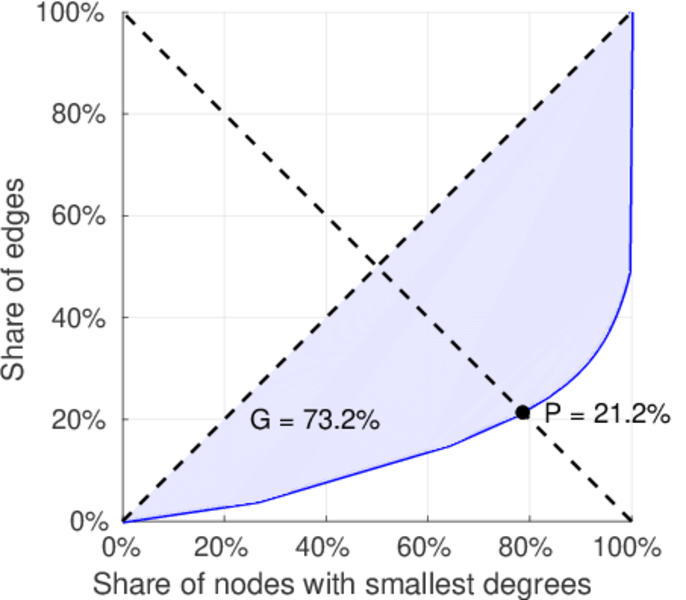
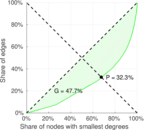
| Gini coefficient | G = | 0.731 044
|
| Balanced inequality ratio | P = | 0.213 379
|
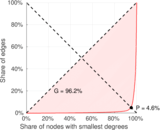
| Left balanced inequality ratio | P1 = | 0.046 111 4
|
| Right balanced inequality ratio | P2 = | 0.322 872
|
| Relative edge distribution entropy | Her = | 0.689 919
|
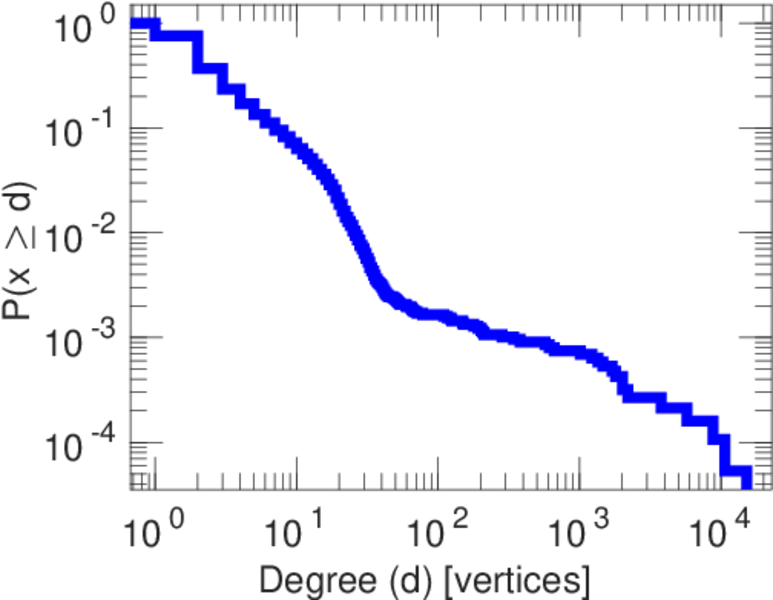
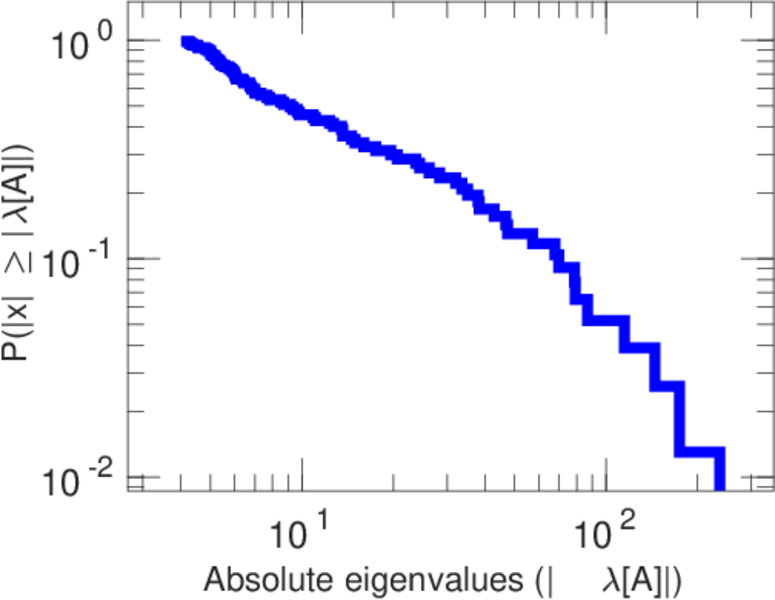
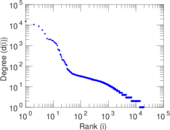
| Power law exponent | γ = | 2.547 86
|
| Tail power law exponent | γt = | 2.701 00
|
| Tail power law exponent with p | γ3 = | 2.701 00
|
| p-value | p = | 0.000 00
|
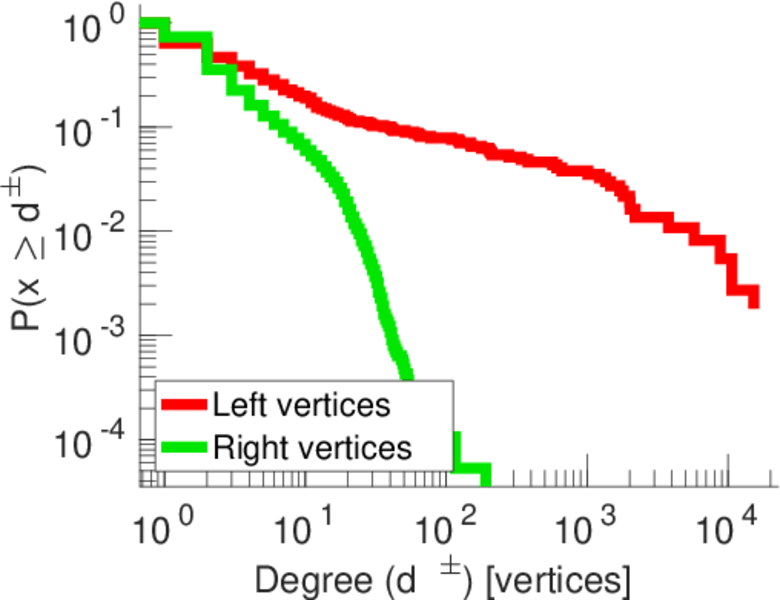
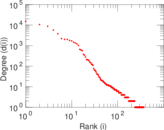
| Left tail power law exponent with p | γ3,1 = | 1.621 00
|
| Left p-value | p1 = | 0.011 000 0
|
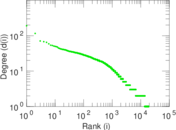
| Right tail power law exponent with p | γ3,2 = | 8.991 00
|
| Right p-value | p2 = | 0.492 000
|
| Degree assortativity | ρ = | −0.348 080
|
| Degree assortativity p-value | pρ = | 0.000 00
|
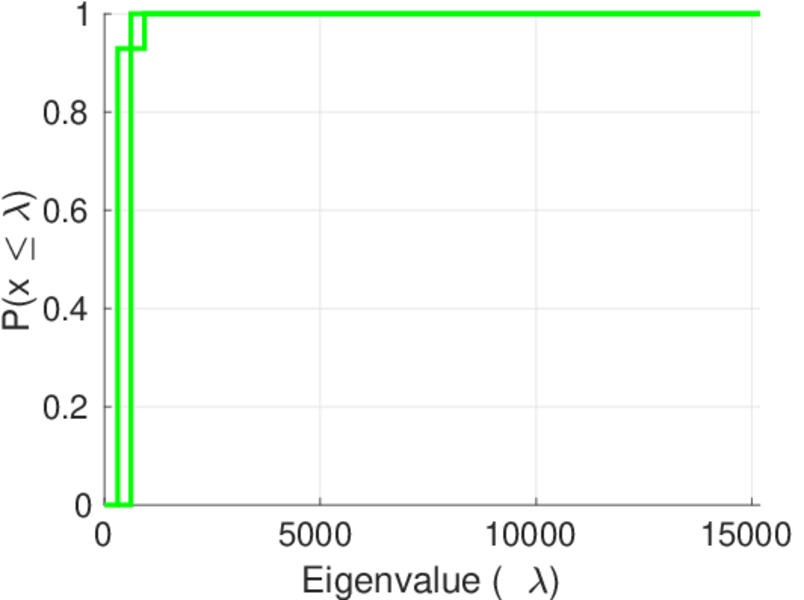
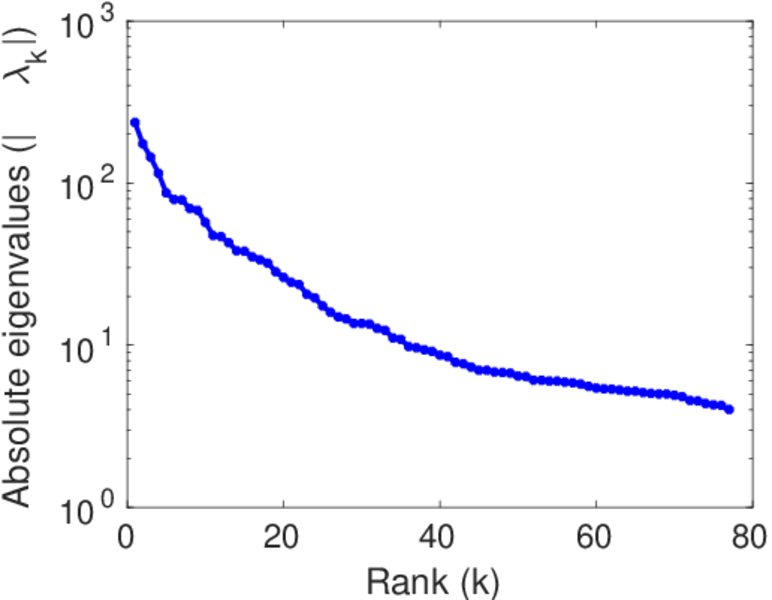
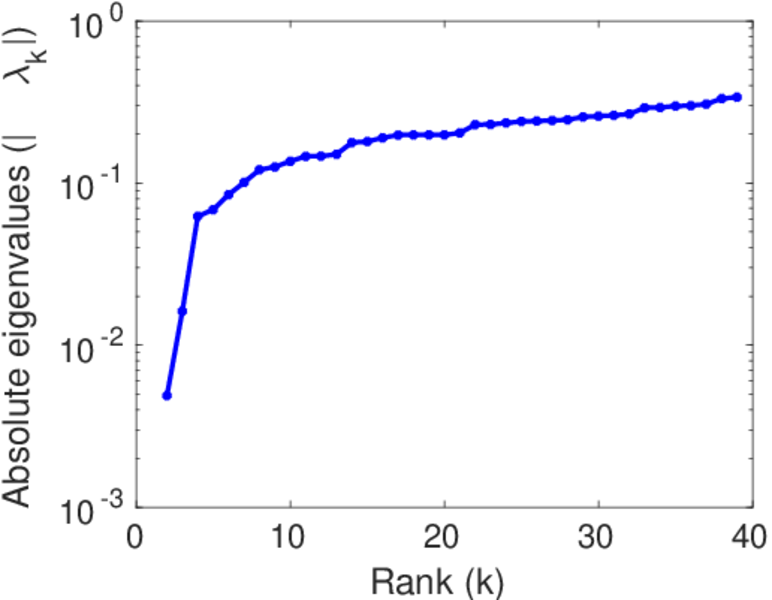
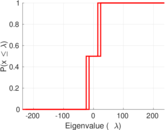
| Spectral norm | α = | 236.609
|
| Algebraic connectivity | a = | 0.004 882 97
|
| Spectral separation | |λ1[A] / λ2[A]| = | 1.356 85
|
| Controllability | C = | 18,440
|
| Relative controllability | Cr = | 0.962 975
|
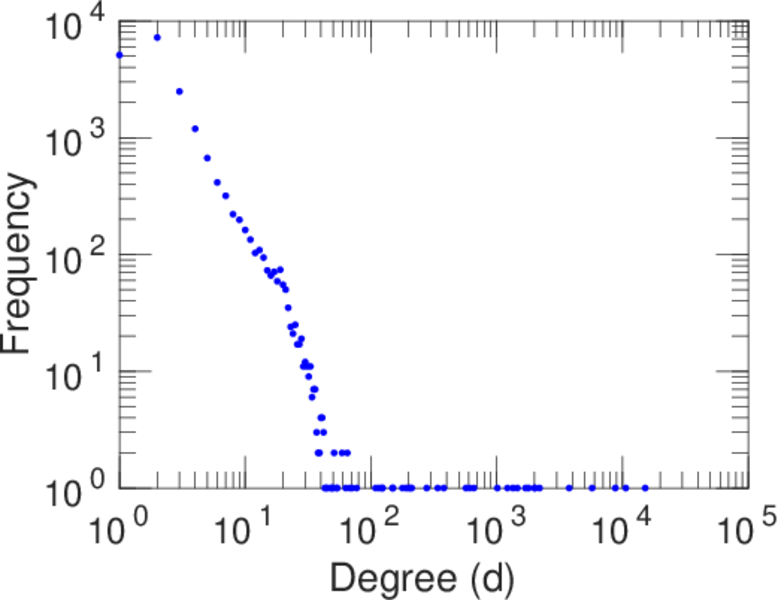
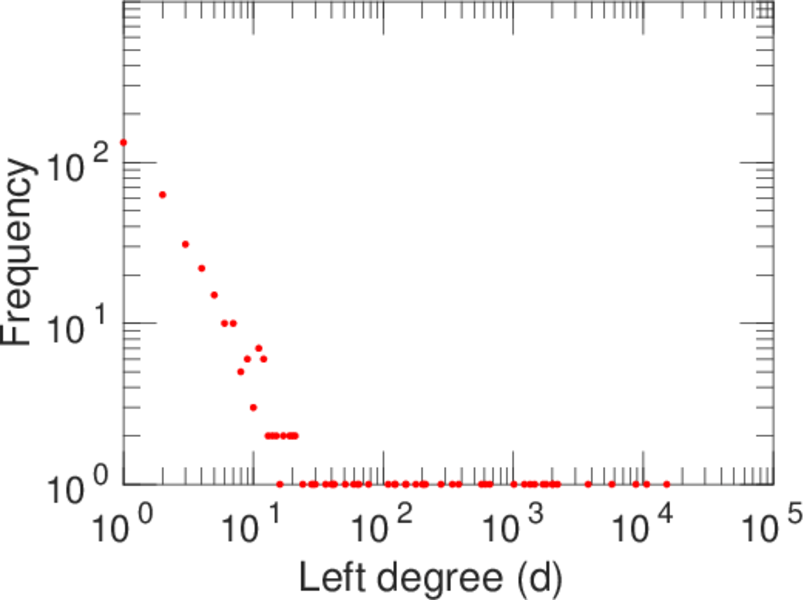
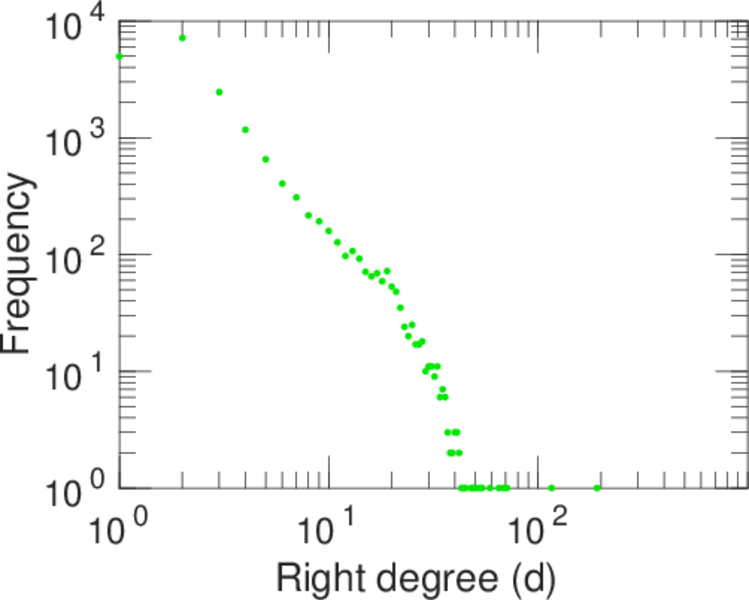
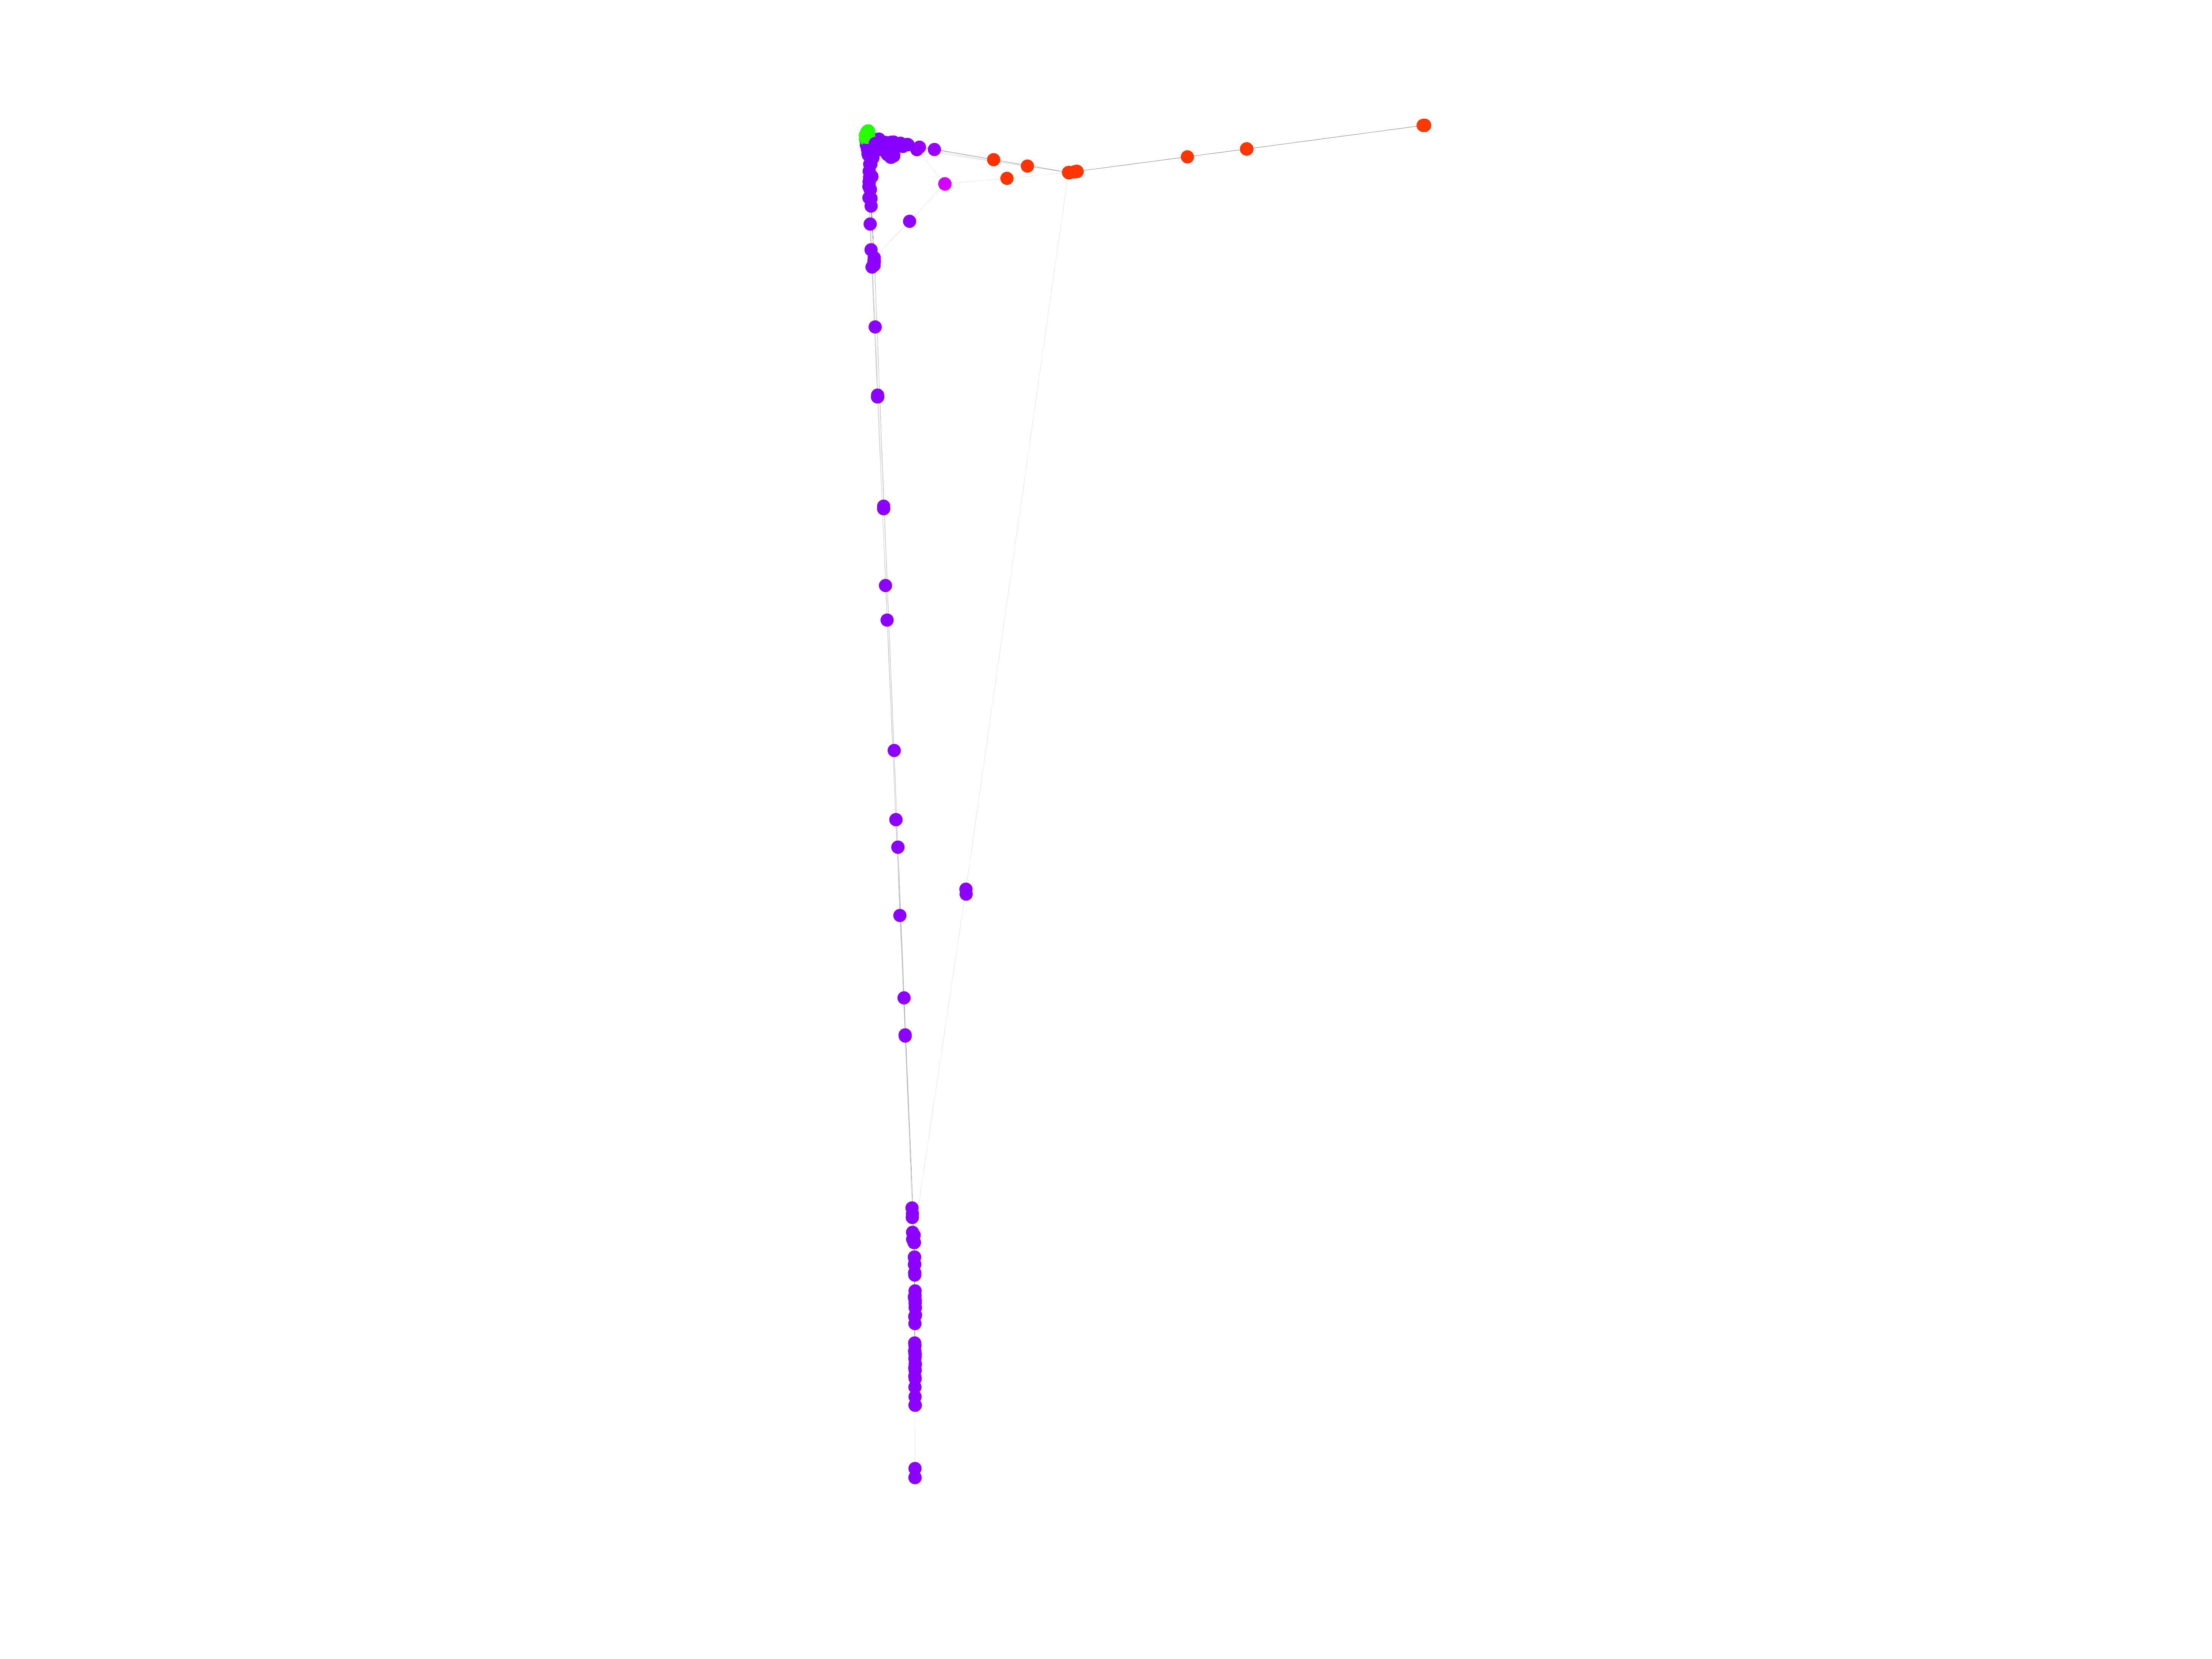
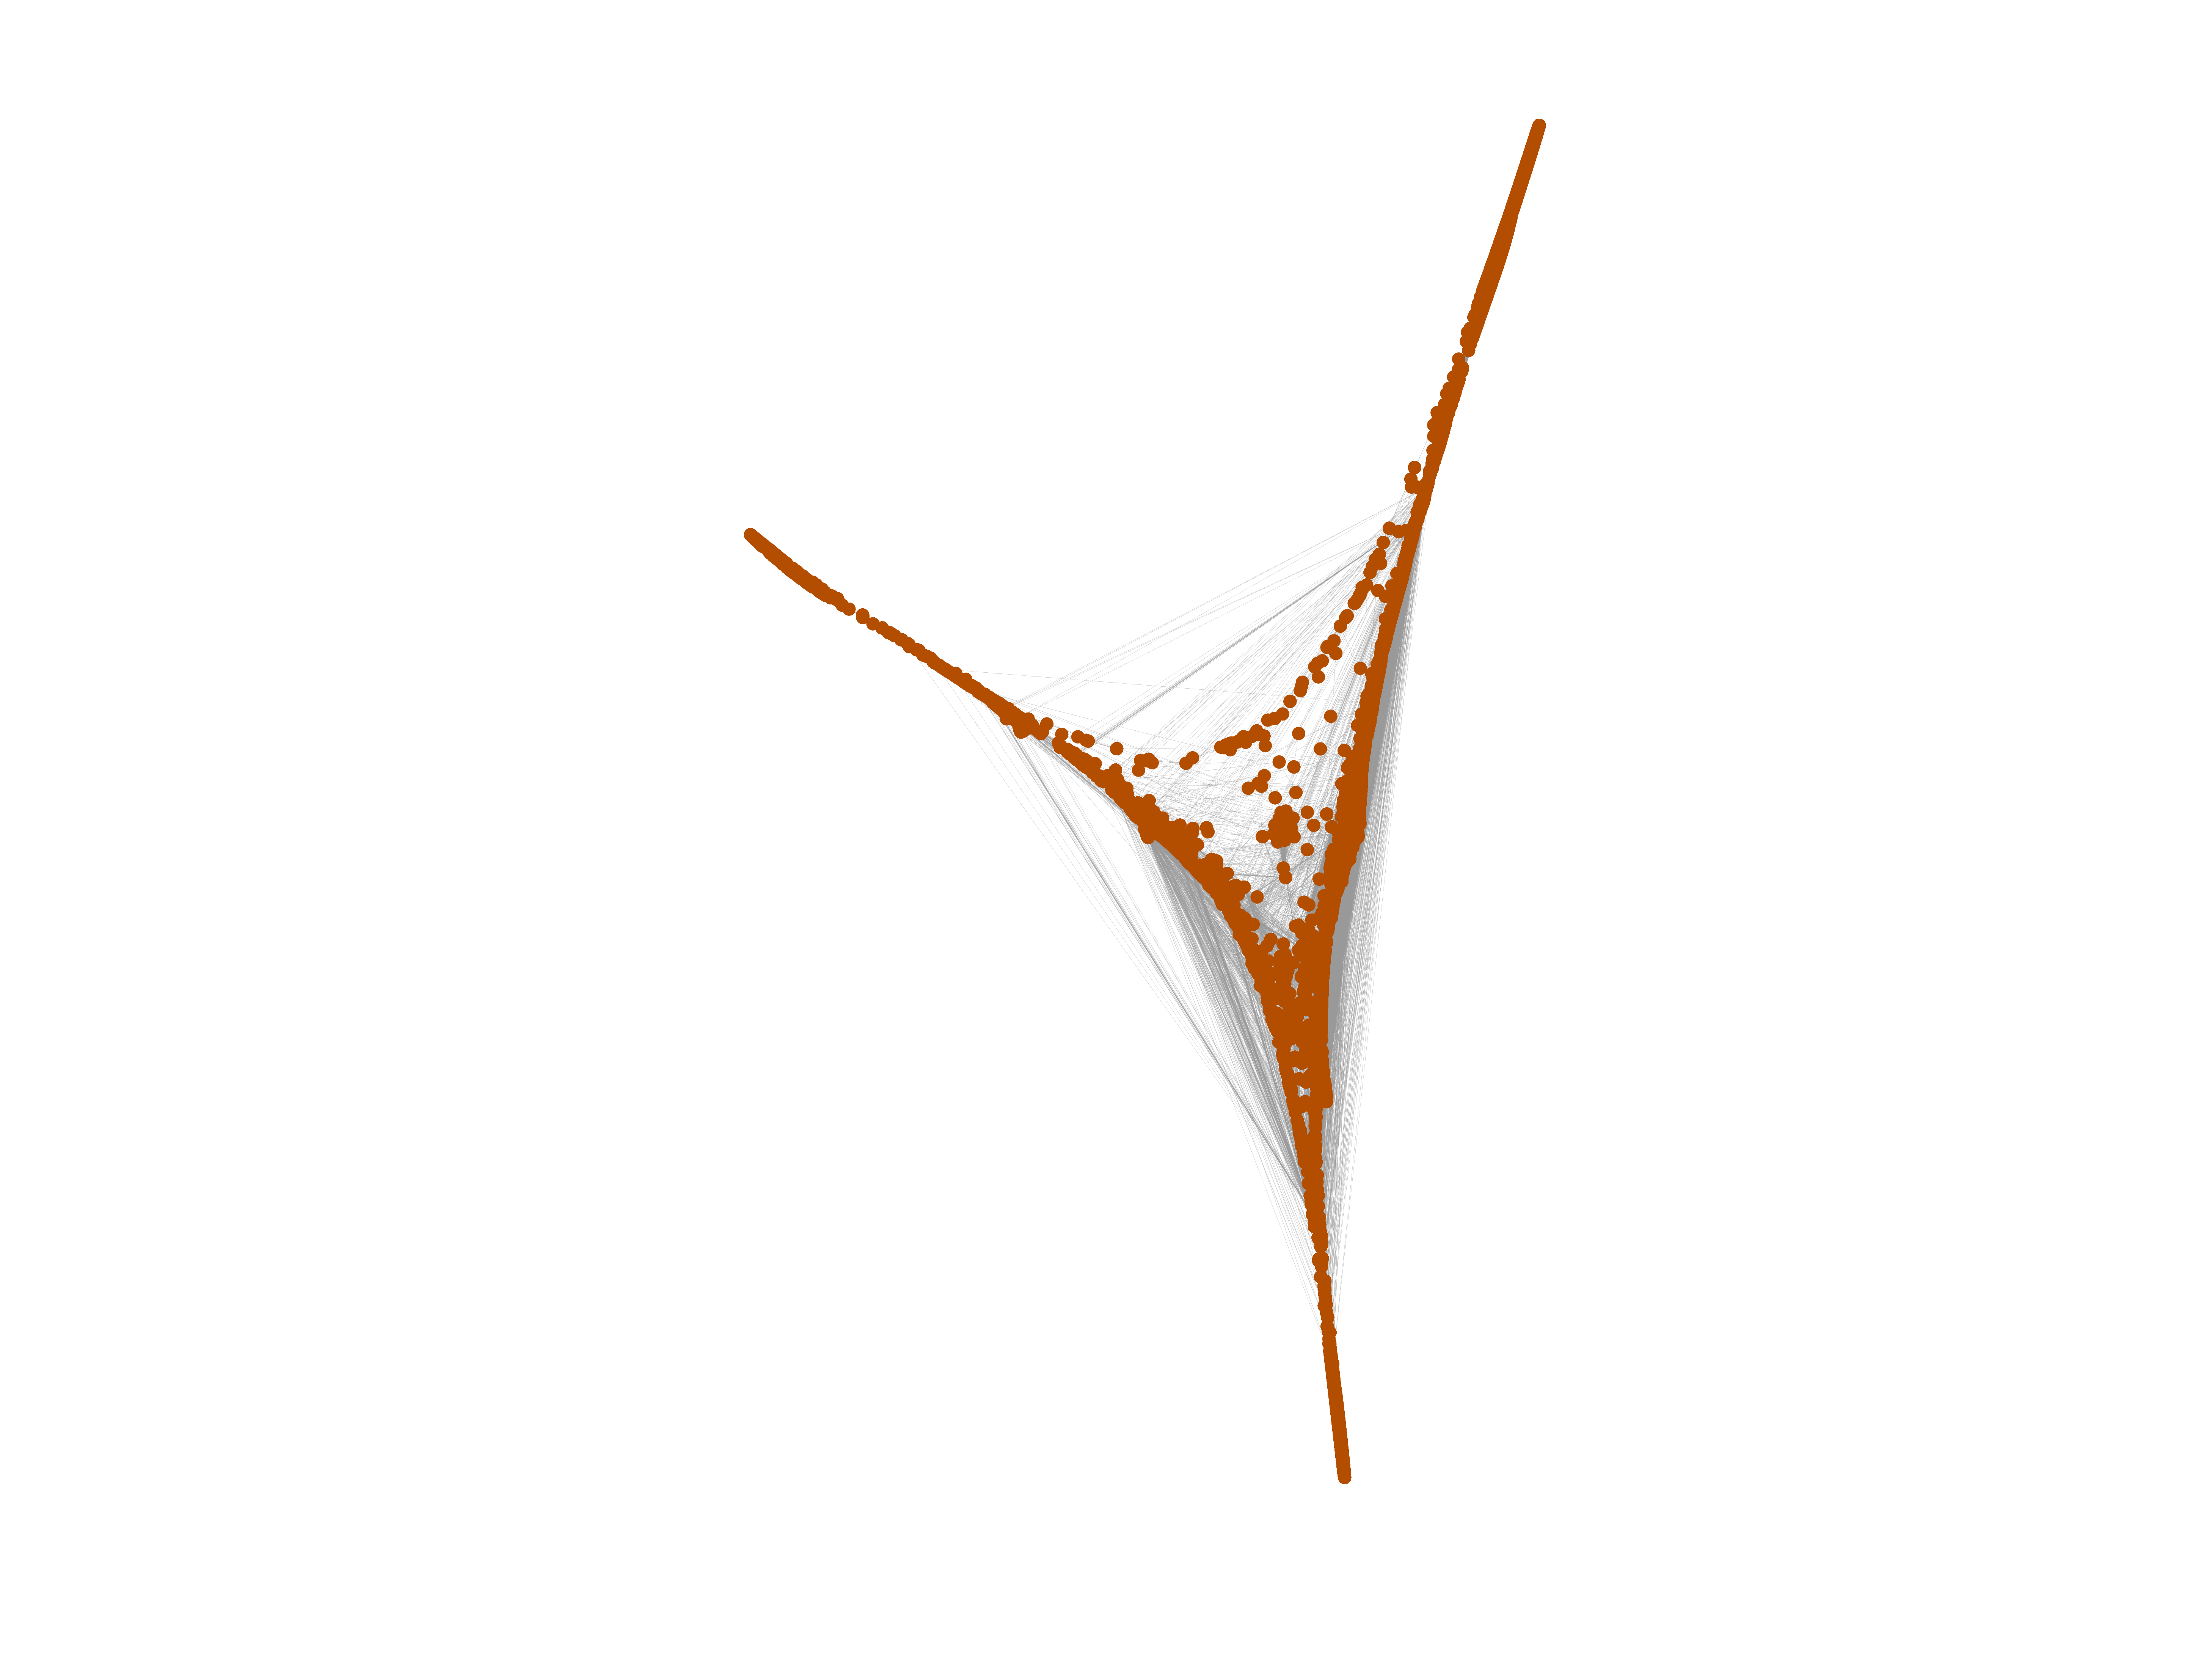
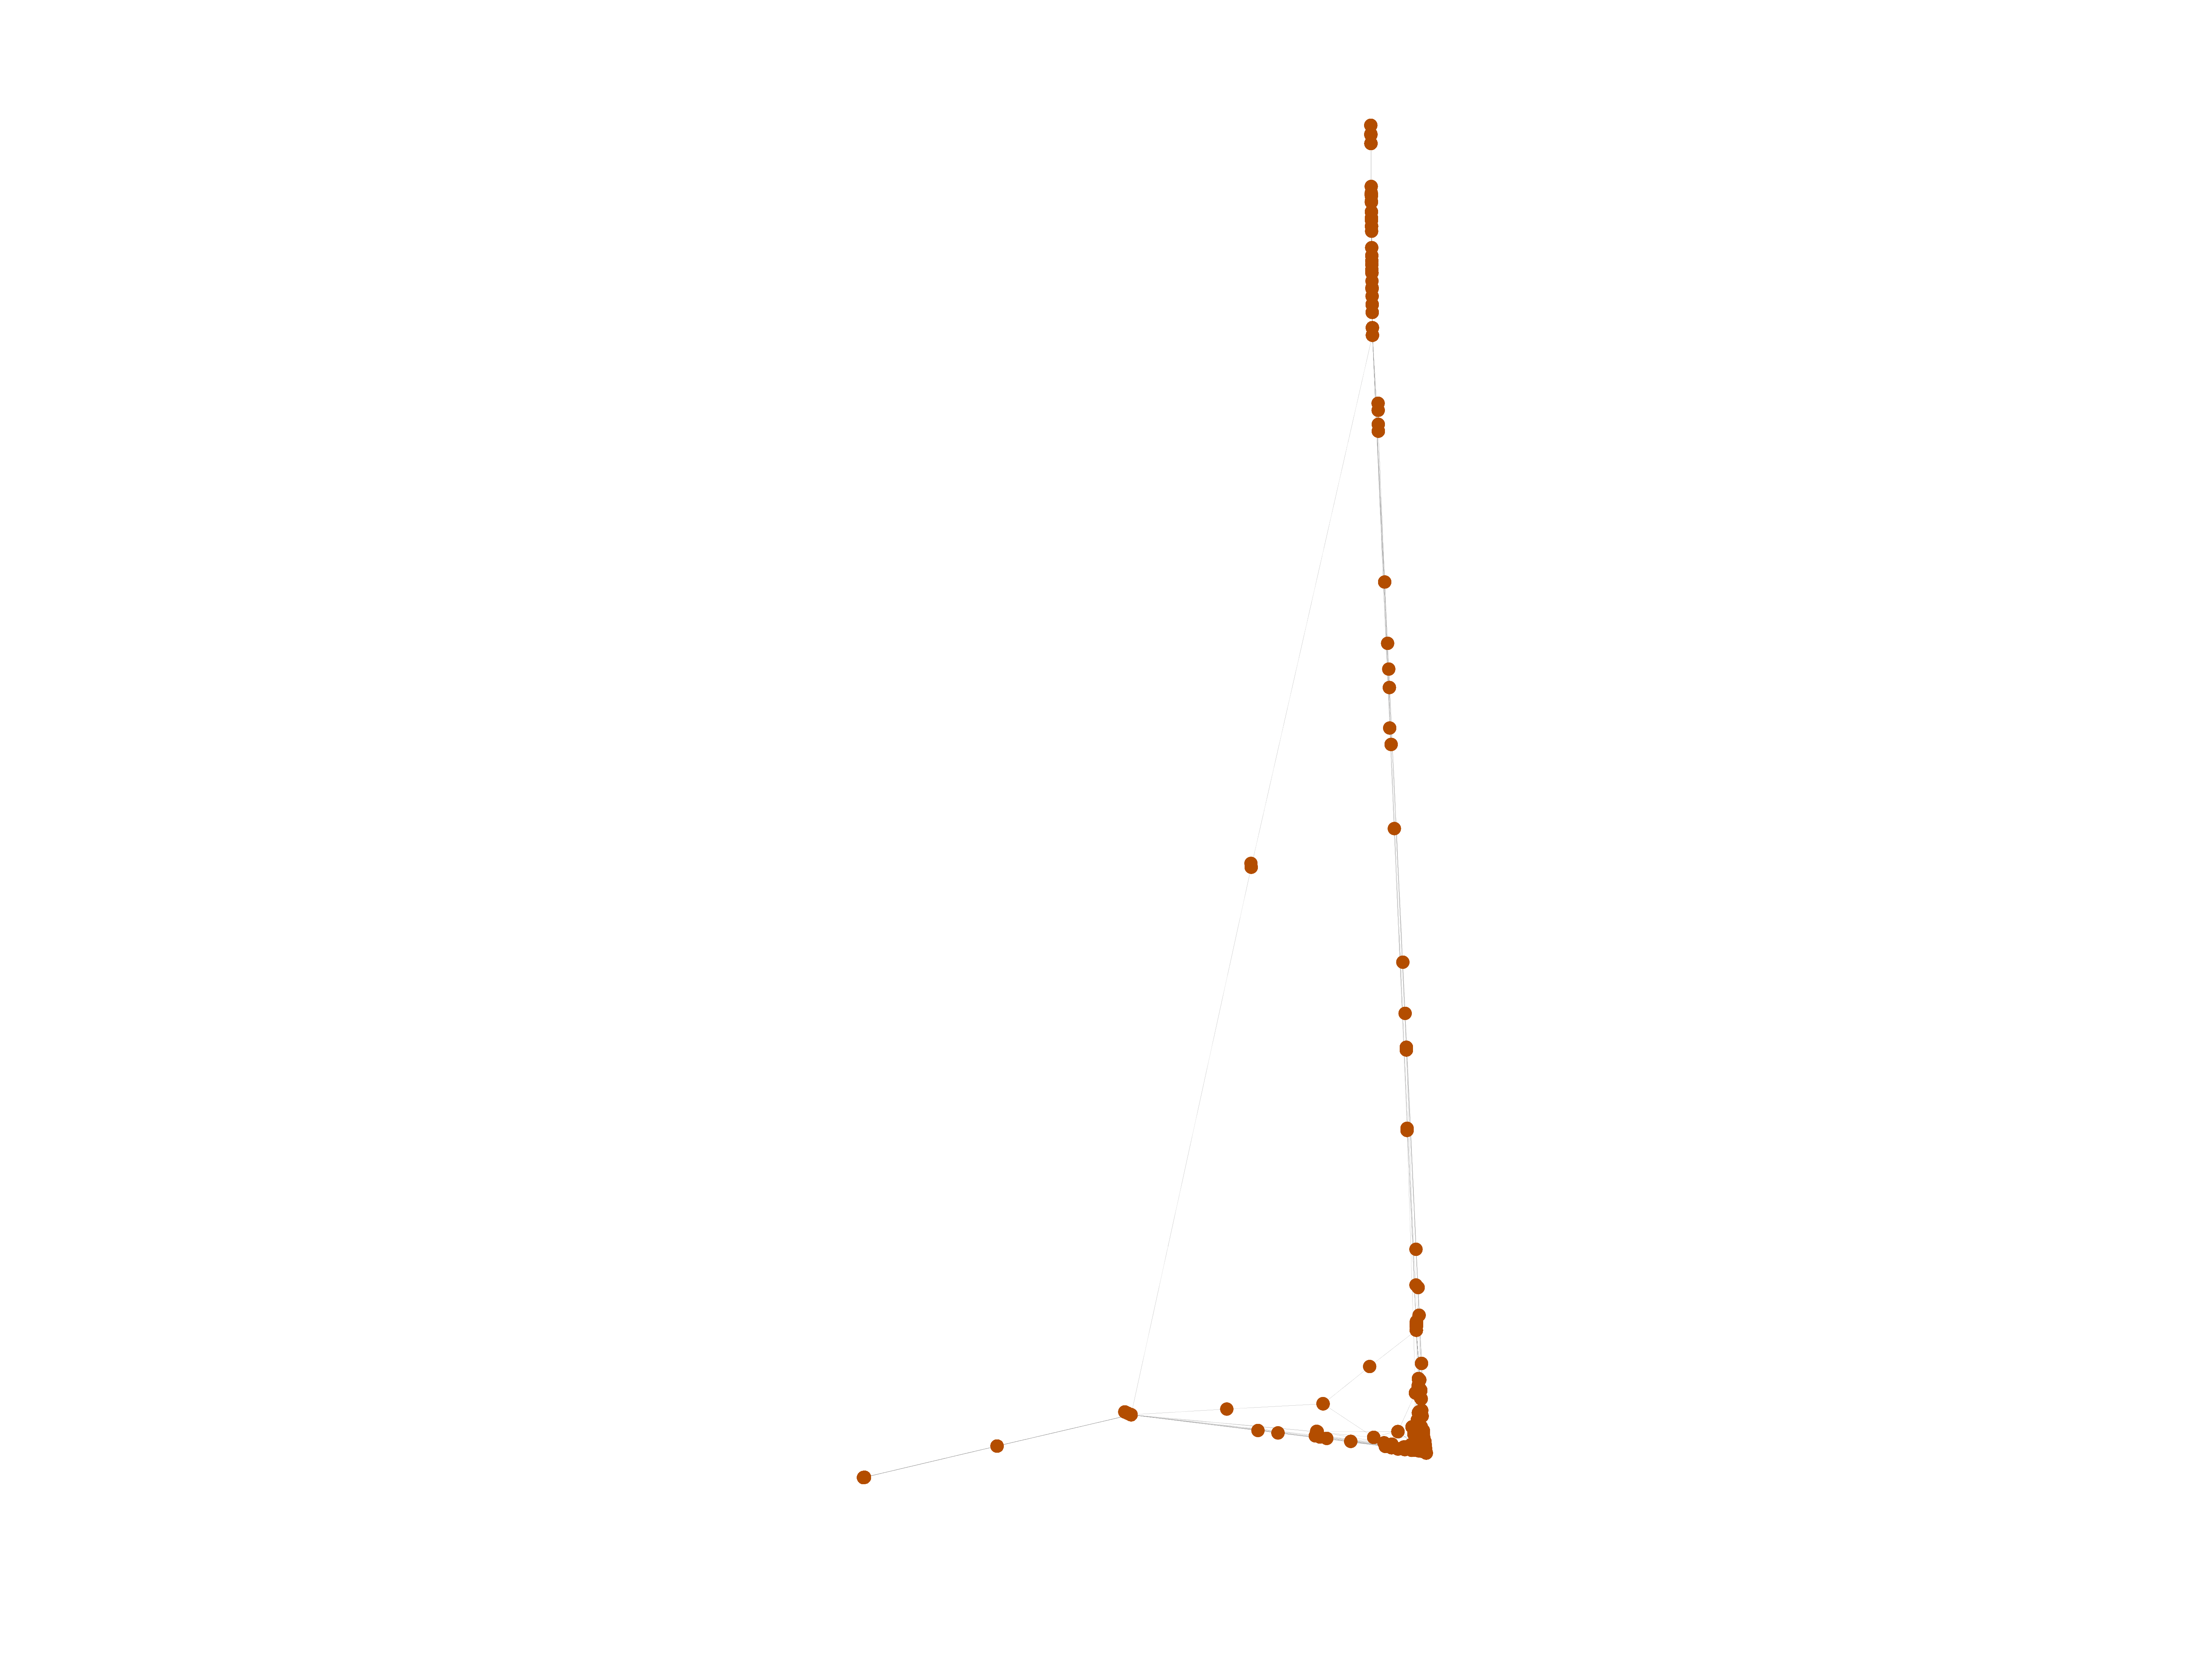
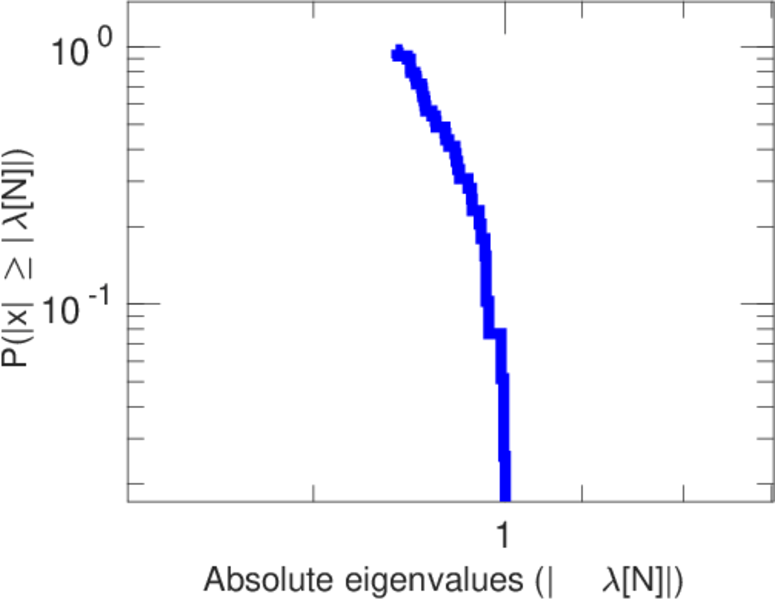
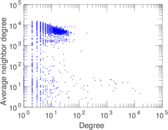
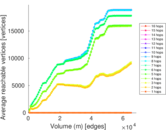
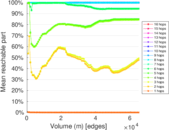
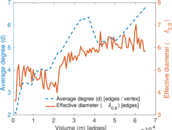
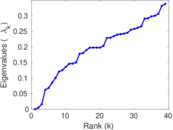
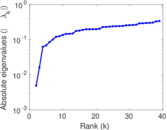
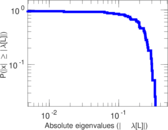
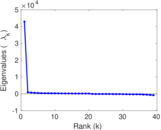
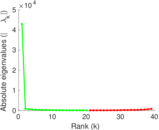
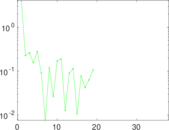
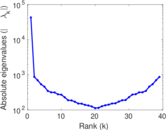
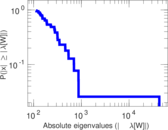
Plots


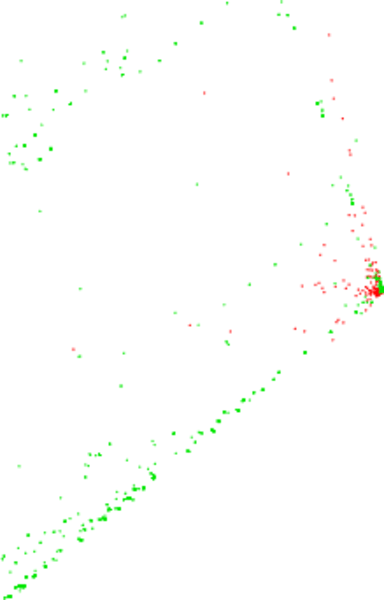
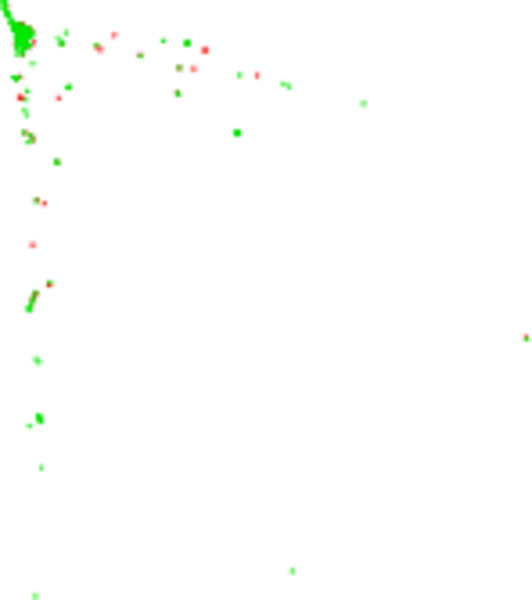
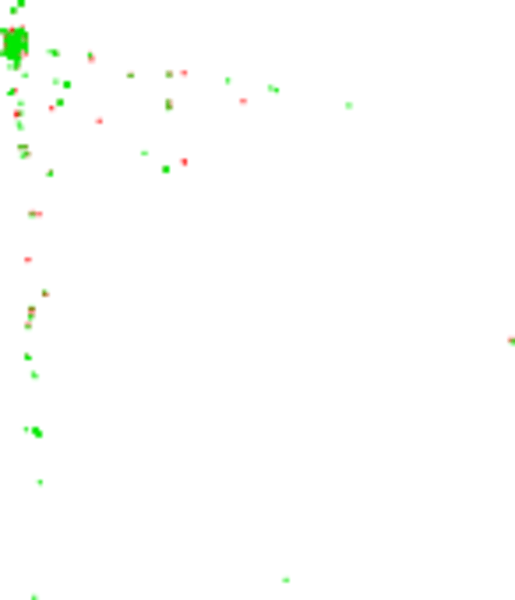
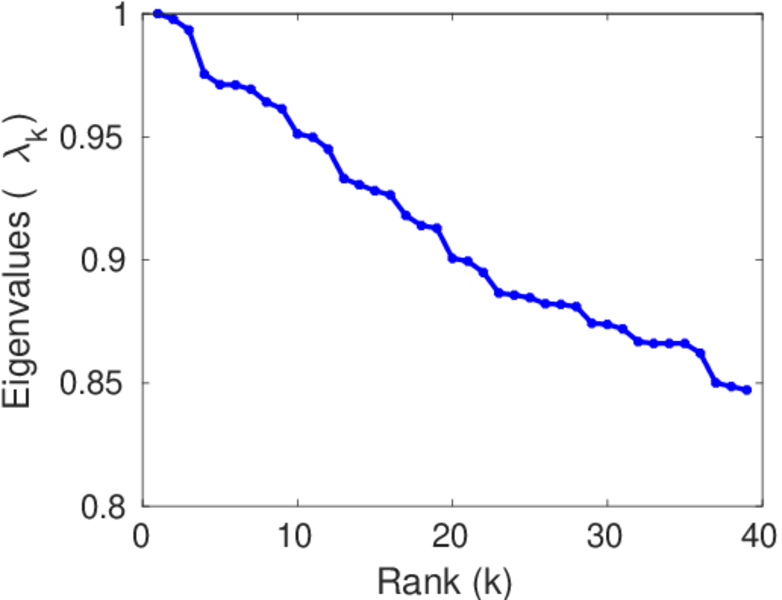
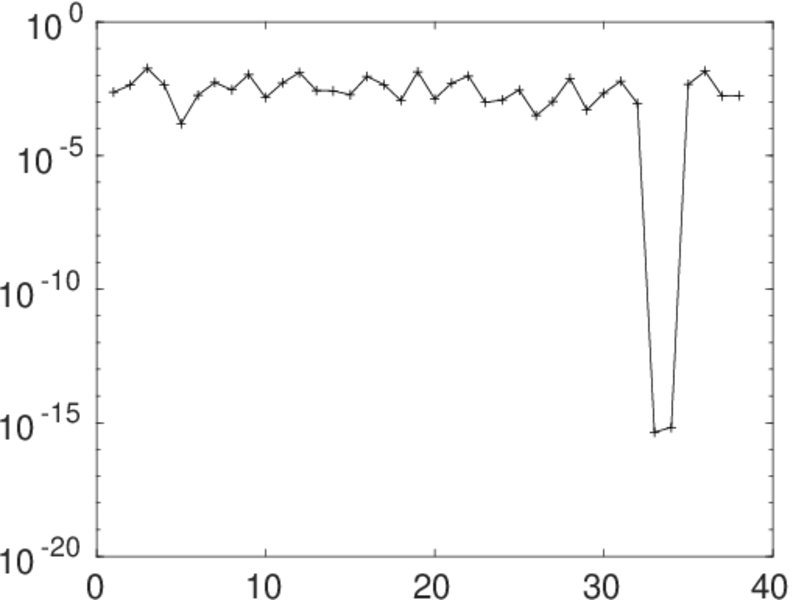
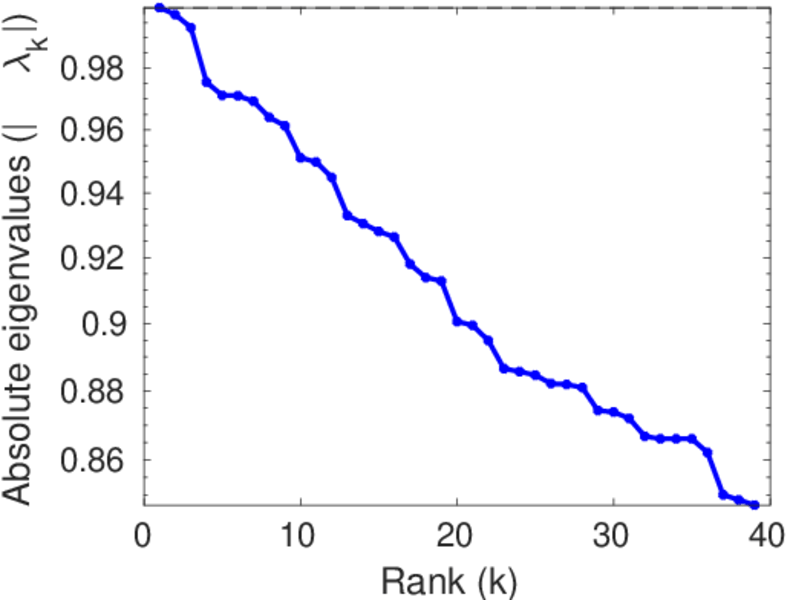
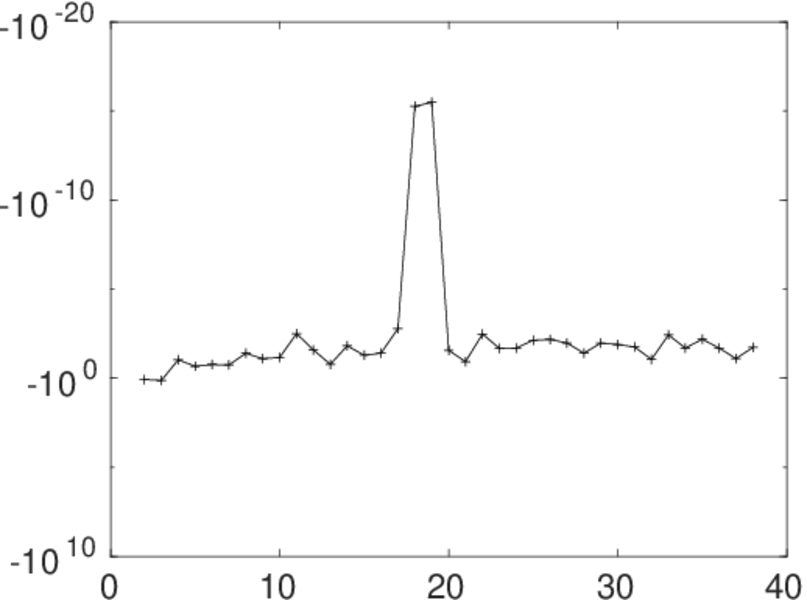
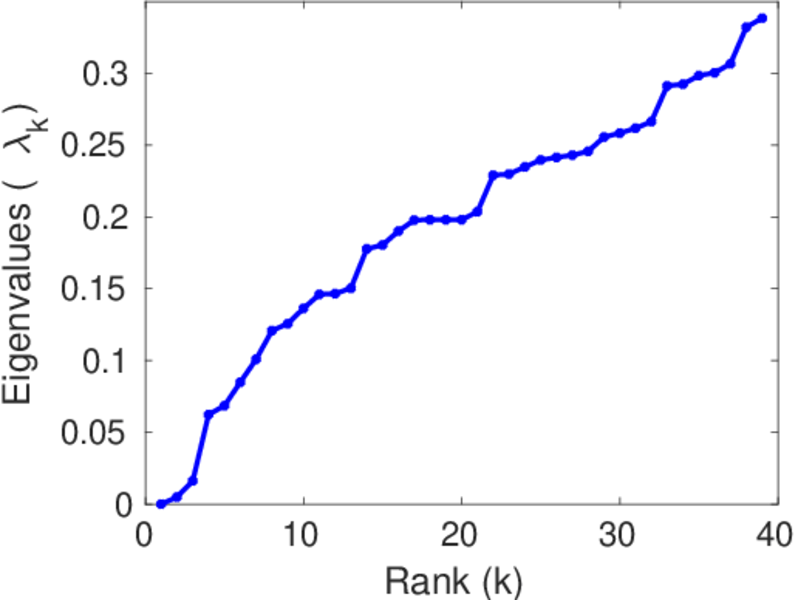
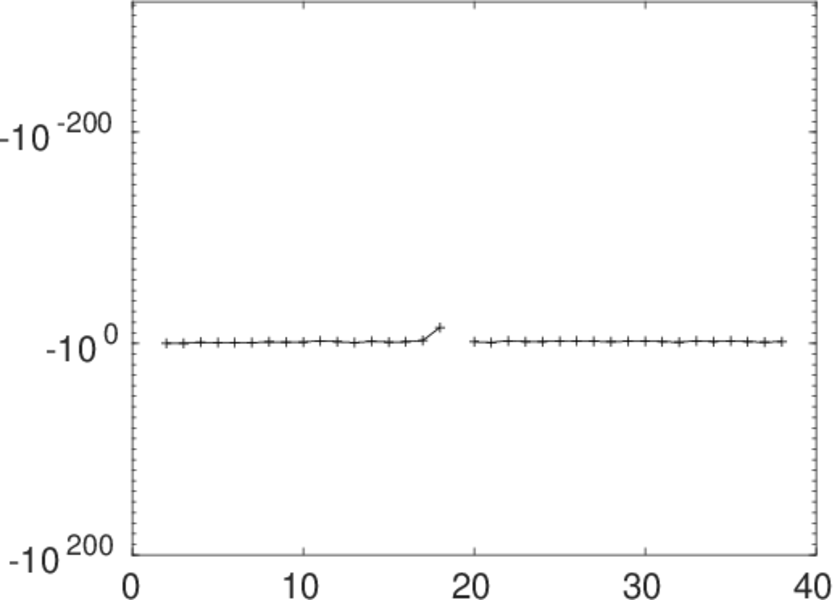
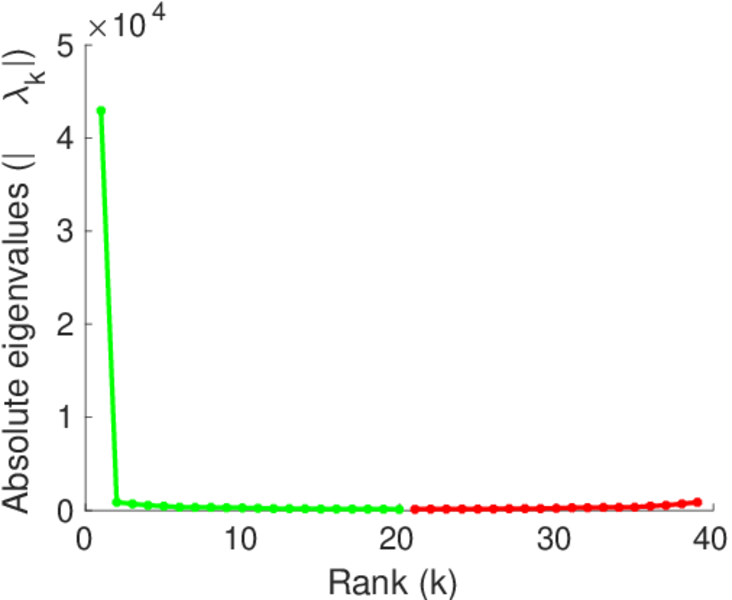
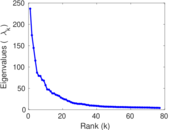
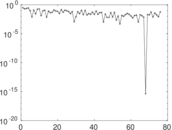
Matrix decompositions plots


Downloads
References
|
[1]
|
Jérôme Kunegis.
KONECT – The Koblenz Network Collection.
In Proc. Int. Conf. on World Wide Web Companion, pages
1343–1350, 2013.
[ http ]
|
|
[2]
|
Wikimedia Foundation.
Wikimedia downloads.
http://dumps.wikimedia.org/, January 2010.
|
 KONECT ‣ Networks ‣
Buy Me a Coffee
KONECT ‣ Networks ‣
Buy Me a Coffee