Wikipedia edits (srn)
This is the bipartite edit network of the Sranan Tongo Wikipedia. It contains
users and pages from the Sranan Tongo Wikipedia, connected by edit events. Each
edge represents an edit. The dataset includes the timestamp of each edit.
Metadata
Statistics
| Size | n = | 3,150
|
| Left size | n1 = | 534
|
| Right size | n2 = | 2,616
|
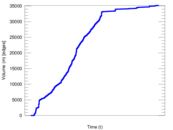
| Volume | m = | 35,199
|
| Unique edge count | m̿ = | 18,244
|
| Wedge count | s = | 3,654,034
|
| Claw count | z = | 700,346,741
|
| Cross count | x = | 125,480,777,965
|
| Square count | q = | 12,923,562
|
| 4-Tour count | T4 = | 118,065,052
|
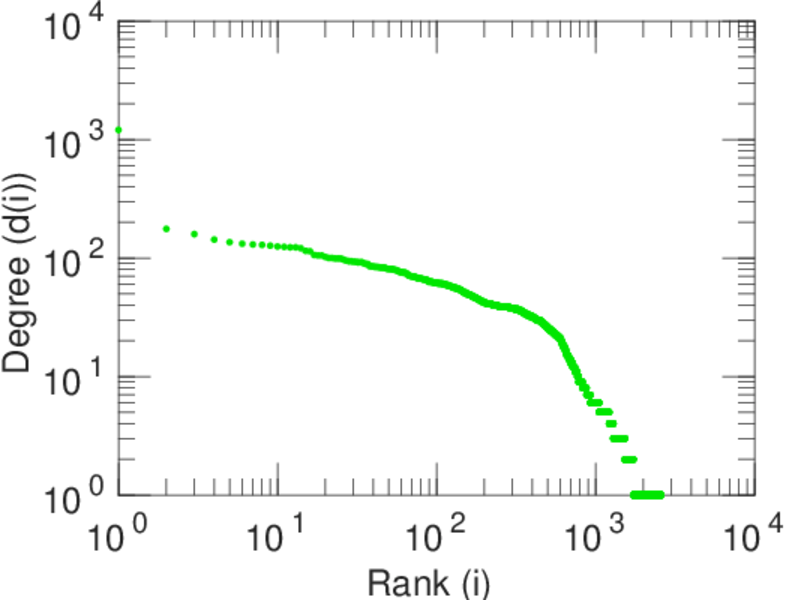
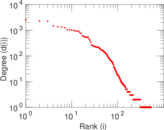
| Maximum degree | dmax = | 2,562
|
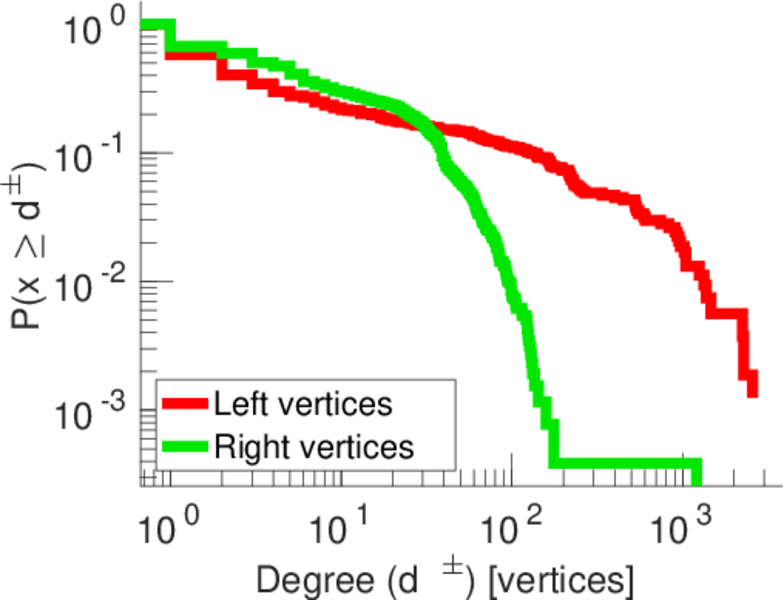
| Maximum left degree | d1max = | 2,562
|
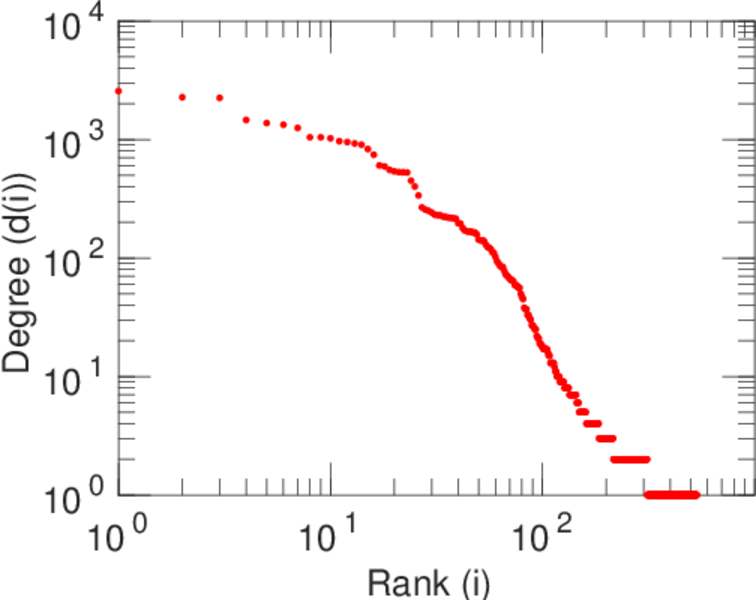
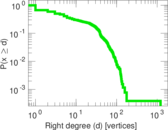
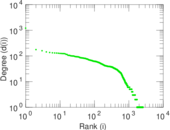
| Maximum right degree | d2max = | 1,205
|
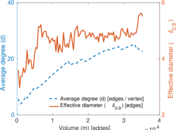
| Average degree | d = | 22.348 6
|
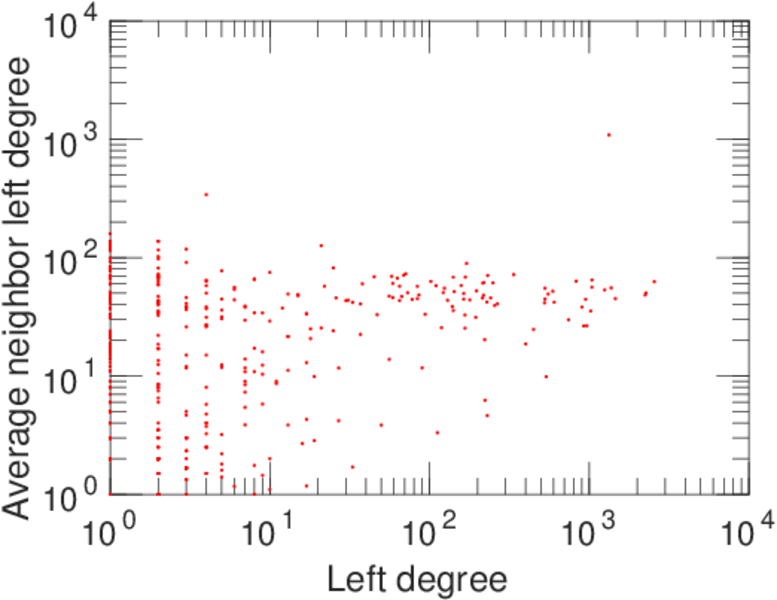
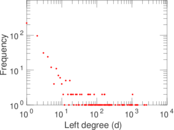
| Average left degree | d1 = | 65.915 7
|
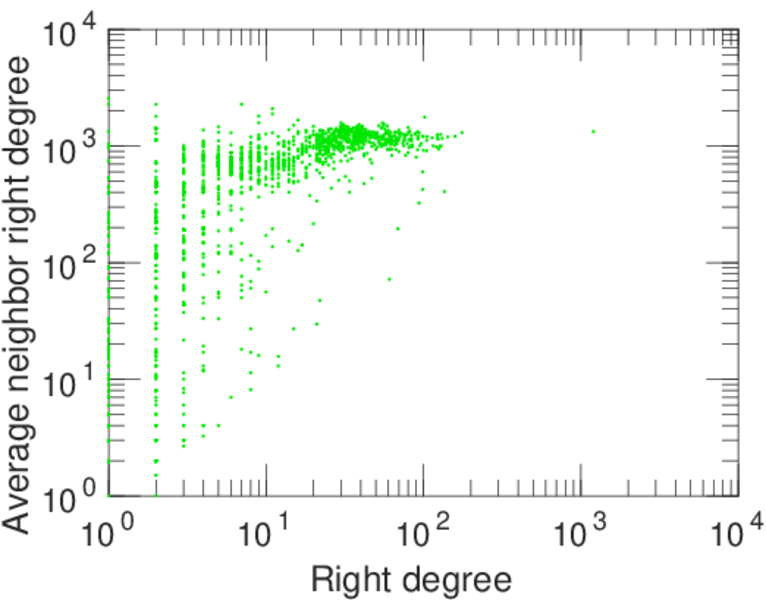
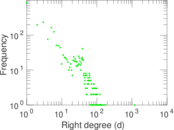
| Average right degree | d2 = | 13.455 3
|
| Fill | p = | 0.013 059 9
|
| Average edge multiplicity | m̃ = | 1.929 35
|
| Size of LCC | N = | 2,723
|
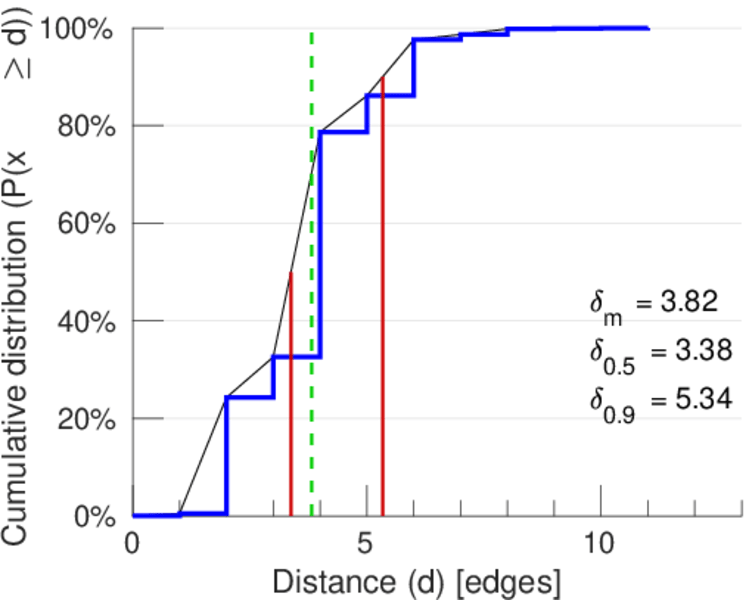
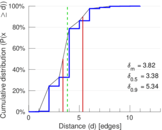
| Diameter | δ = | 14
|
| 50-Percentile effective diameter | δ0.5 = | 3.378 46
|
| 90-Percentile effective diameter | δ0.9 = | 5.337 31
|
| Median distance | δM = | 4
|
| Mean distance | δm = | 3.819 22
|
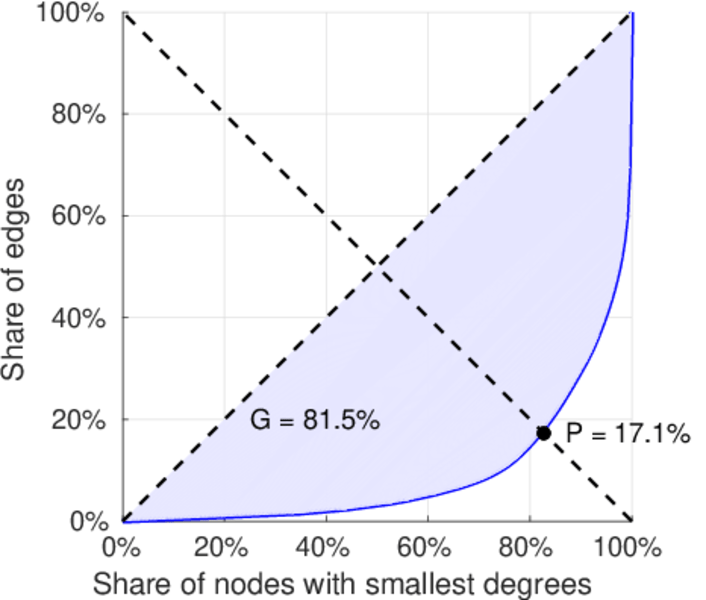
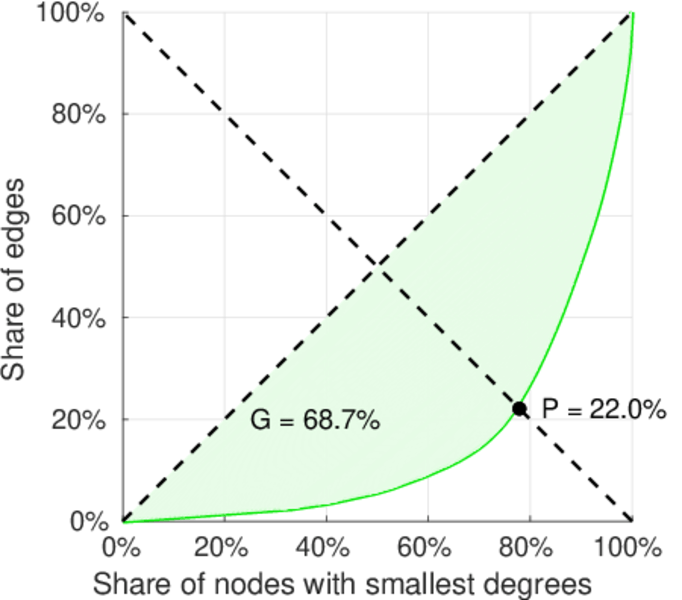
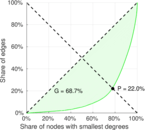
| Gini coefficient | G = | 0.812 173
|
| Balanced inequality ratio | P = | 0.179 451
|
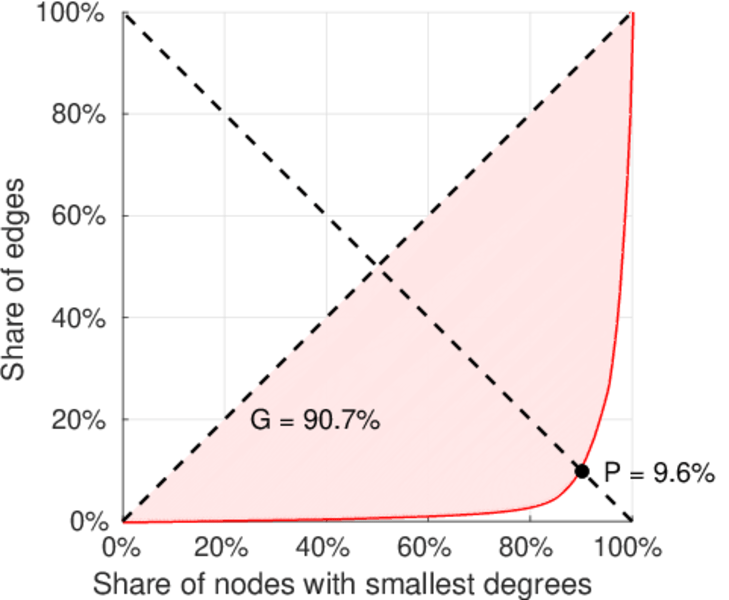
| Left balanced inequality ratio | P1 = | 0.096 451 6
|
| Right balanced inequality ratio | P2 = | 0.219 580
|
| Relative edge distribution entropy | Her = | 0.806 740
|
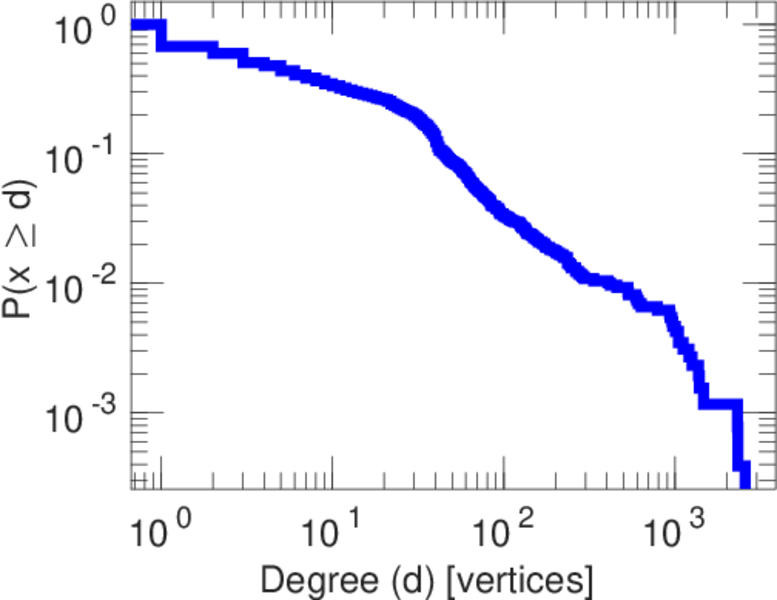
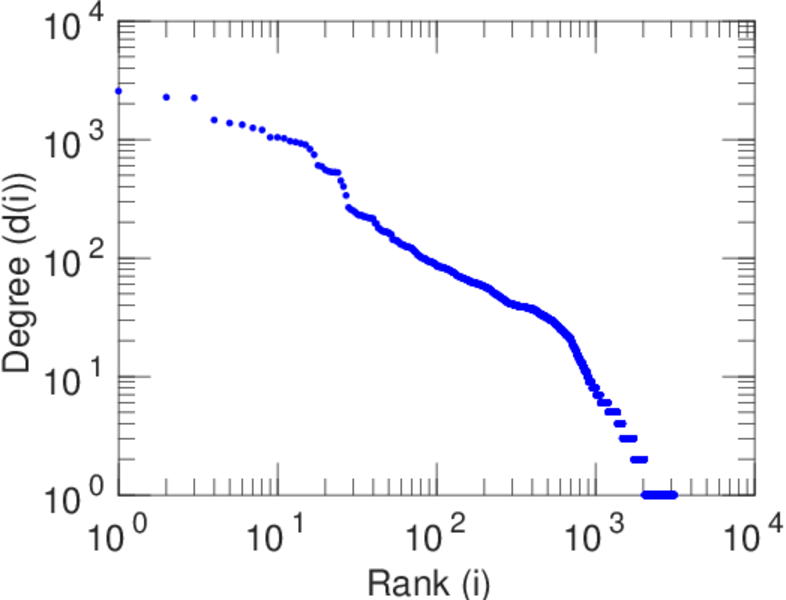
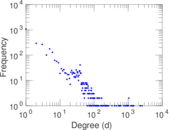
| Power law exponent | γ = | 1.827 04
|
| Tail power law exponent | γt = | 1.591 00
|
| Tail power law exponent with p | γ3 = | 1.591 00
|
| p-value | p = | 0.000 00
|
| Left tail power law exponent with p | γ3,1 = | 1.591 00
|
| Left p-value | p1 = | 0.000 00
|
| Right tail power law exponent with p | γ3,2 = | 6.231 00
|
| Right p-value | p2 = | 0.882 000
|
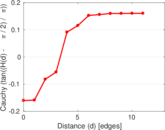
| Degree assortativity | ρ = | −0.010 485 2
|
| Degree assortativity p-value | pρ = | 0.156 722
|
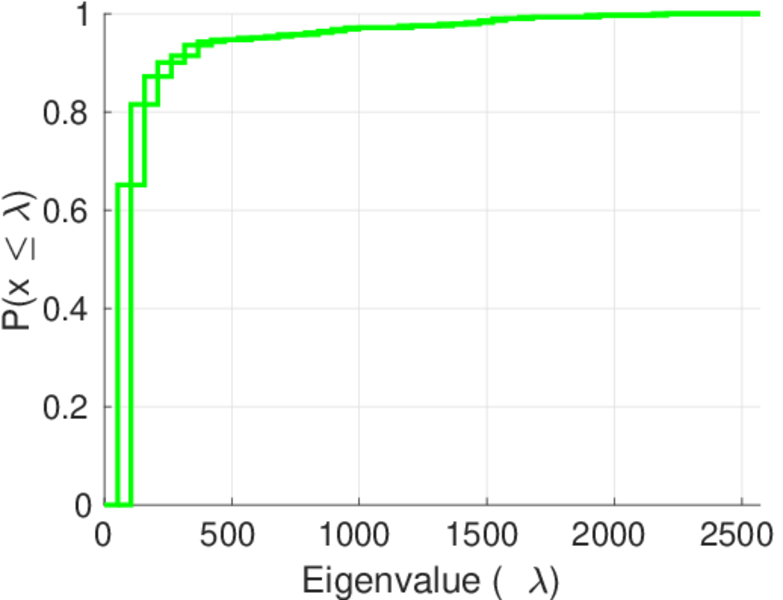
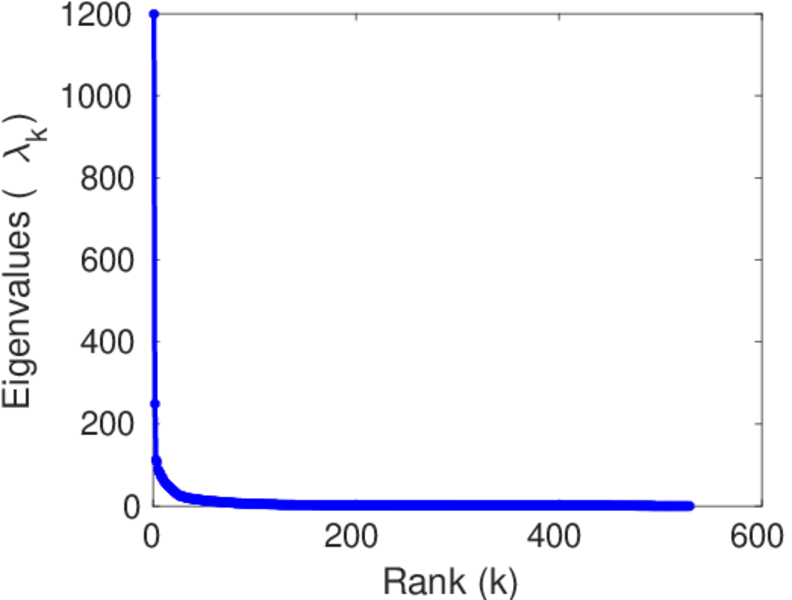
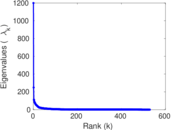
| Spectral norm | α = | 1,198.85
|
| Algebraic connectivity | a = | 0.039 927 6
|
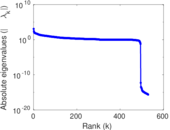
| Spectral separation | |λ1[A] / λ2[A]| = | 4.813 85
|
| Controllability | C = | 2,125
|
| Relative controllability | Cr = | 0.682 183
|
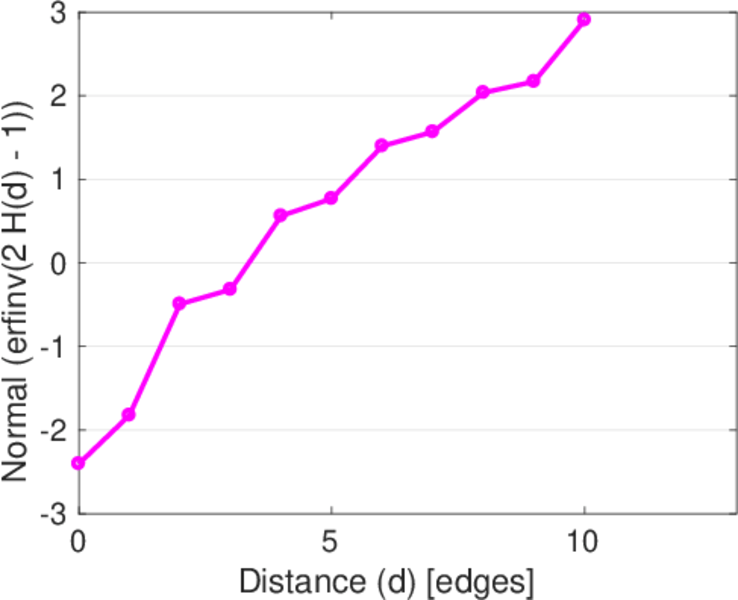
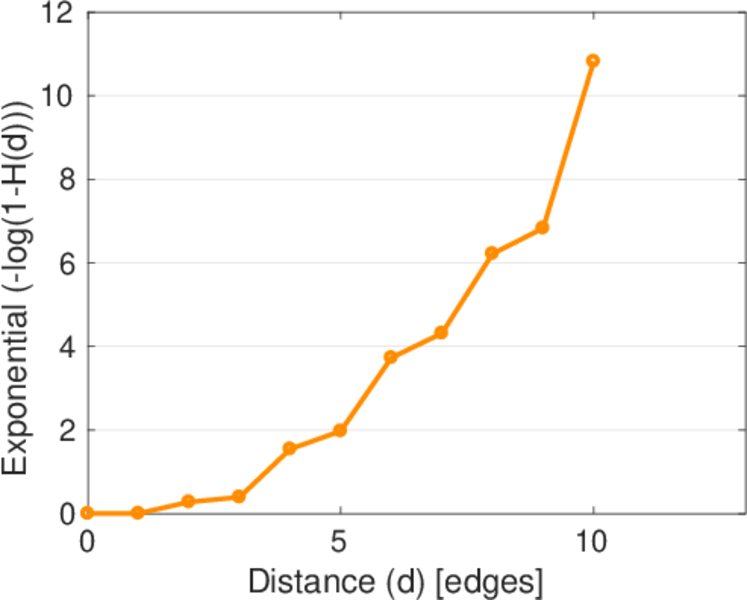
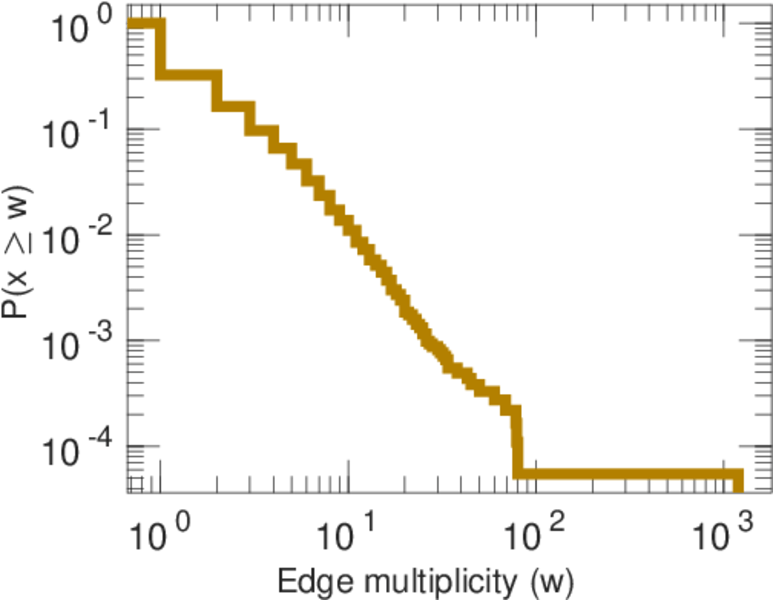
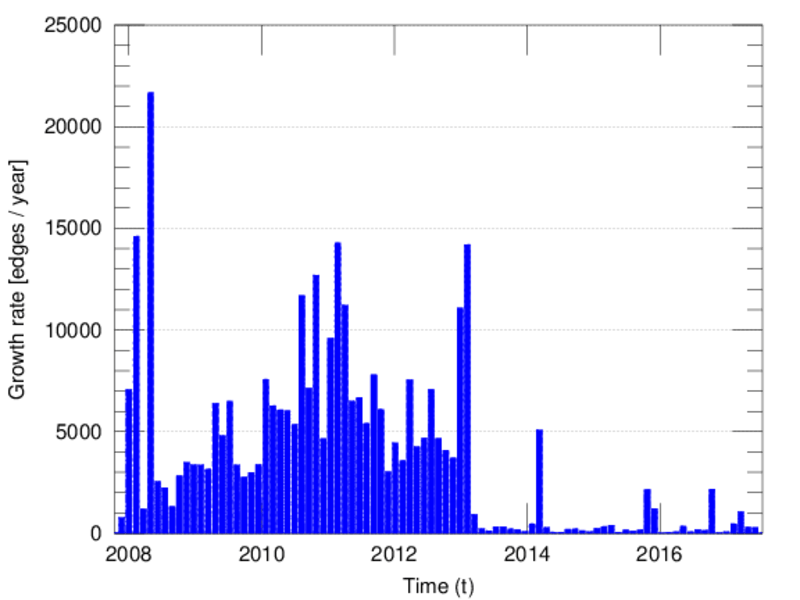
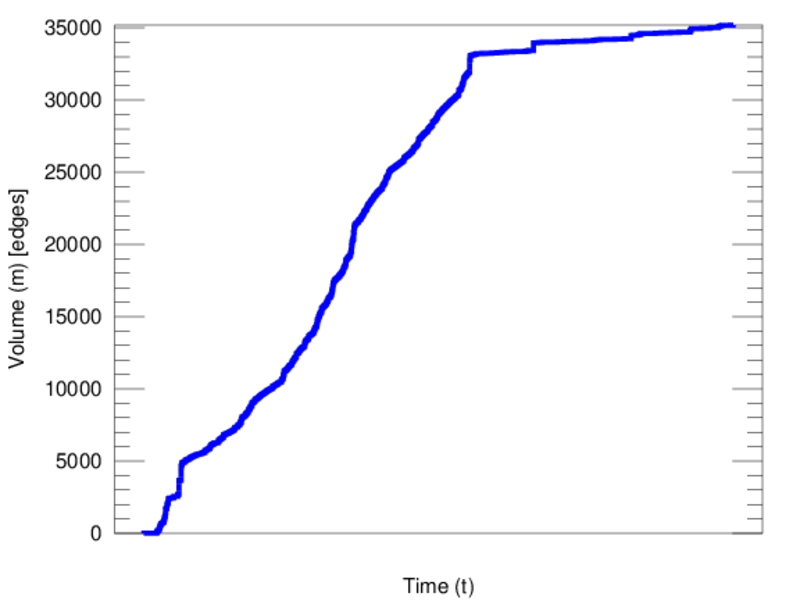
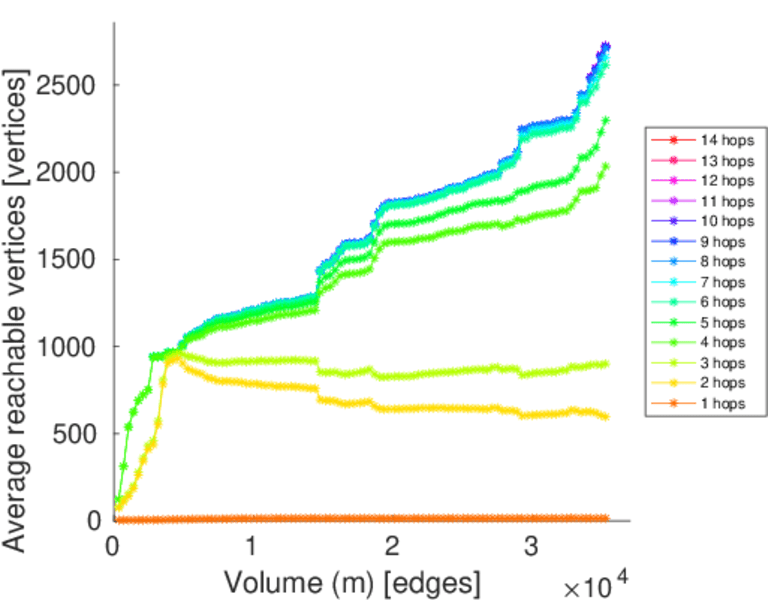
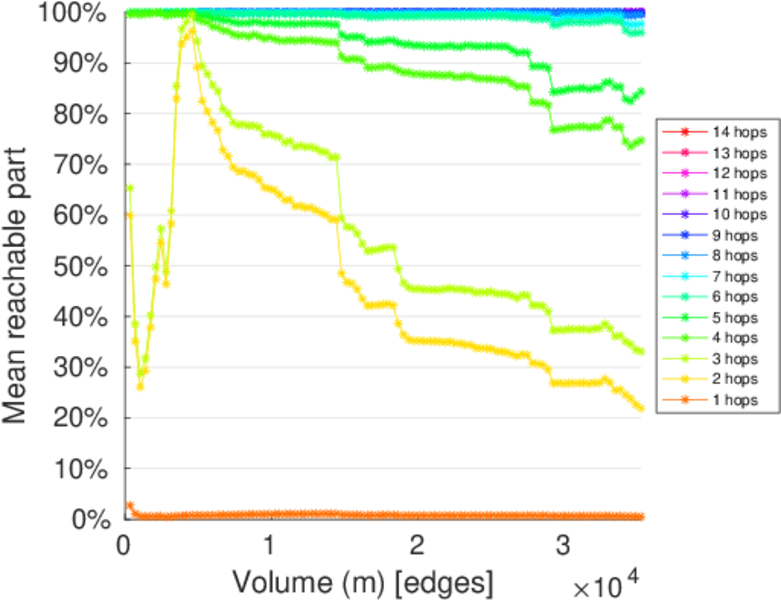
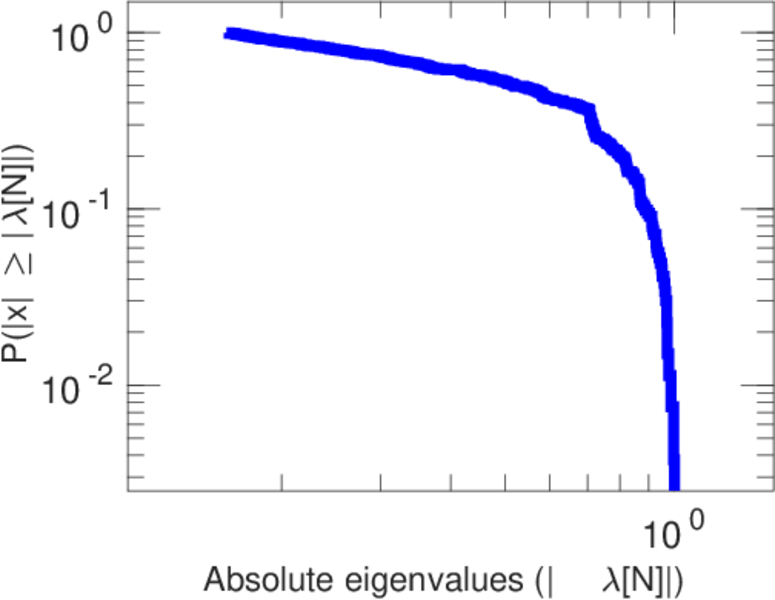
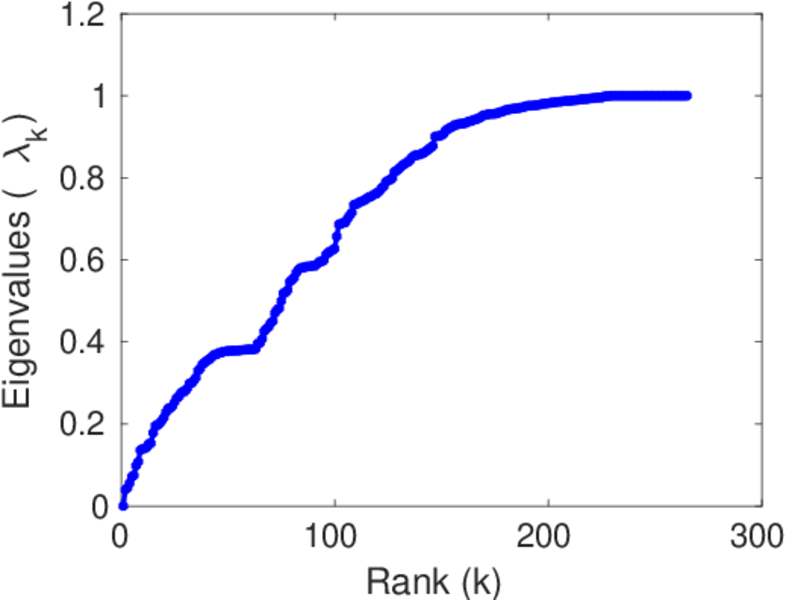
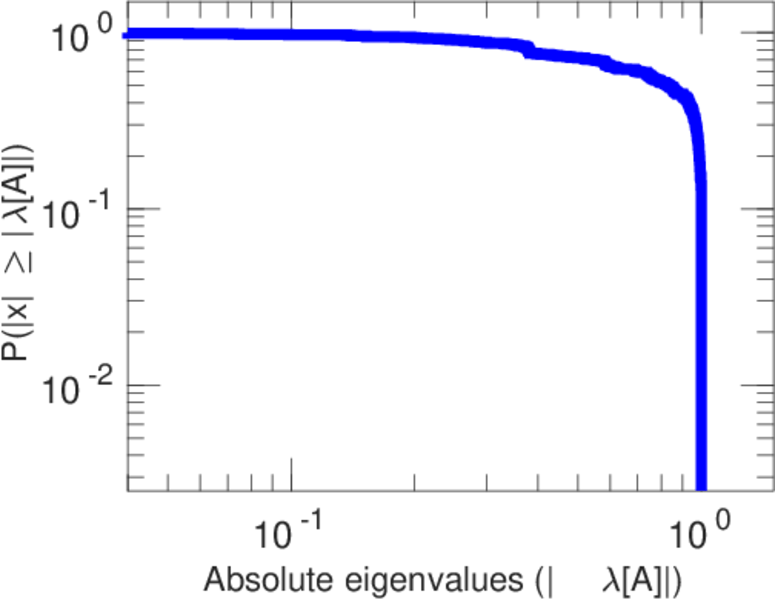
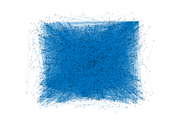
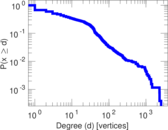
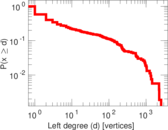
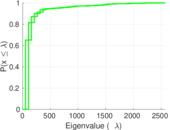
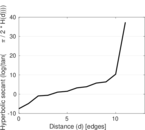
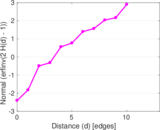
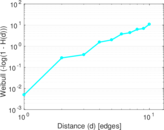
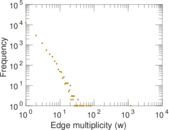
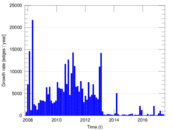
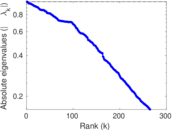
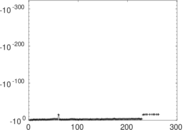
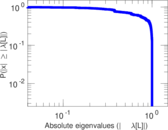
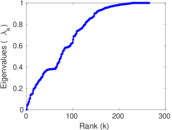
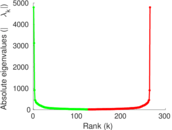
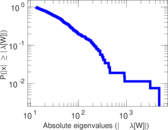
Plots


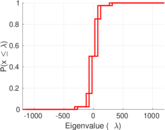
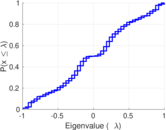


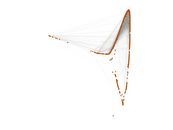


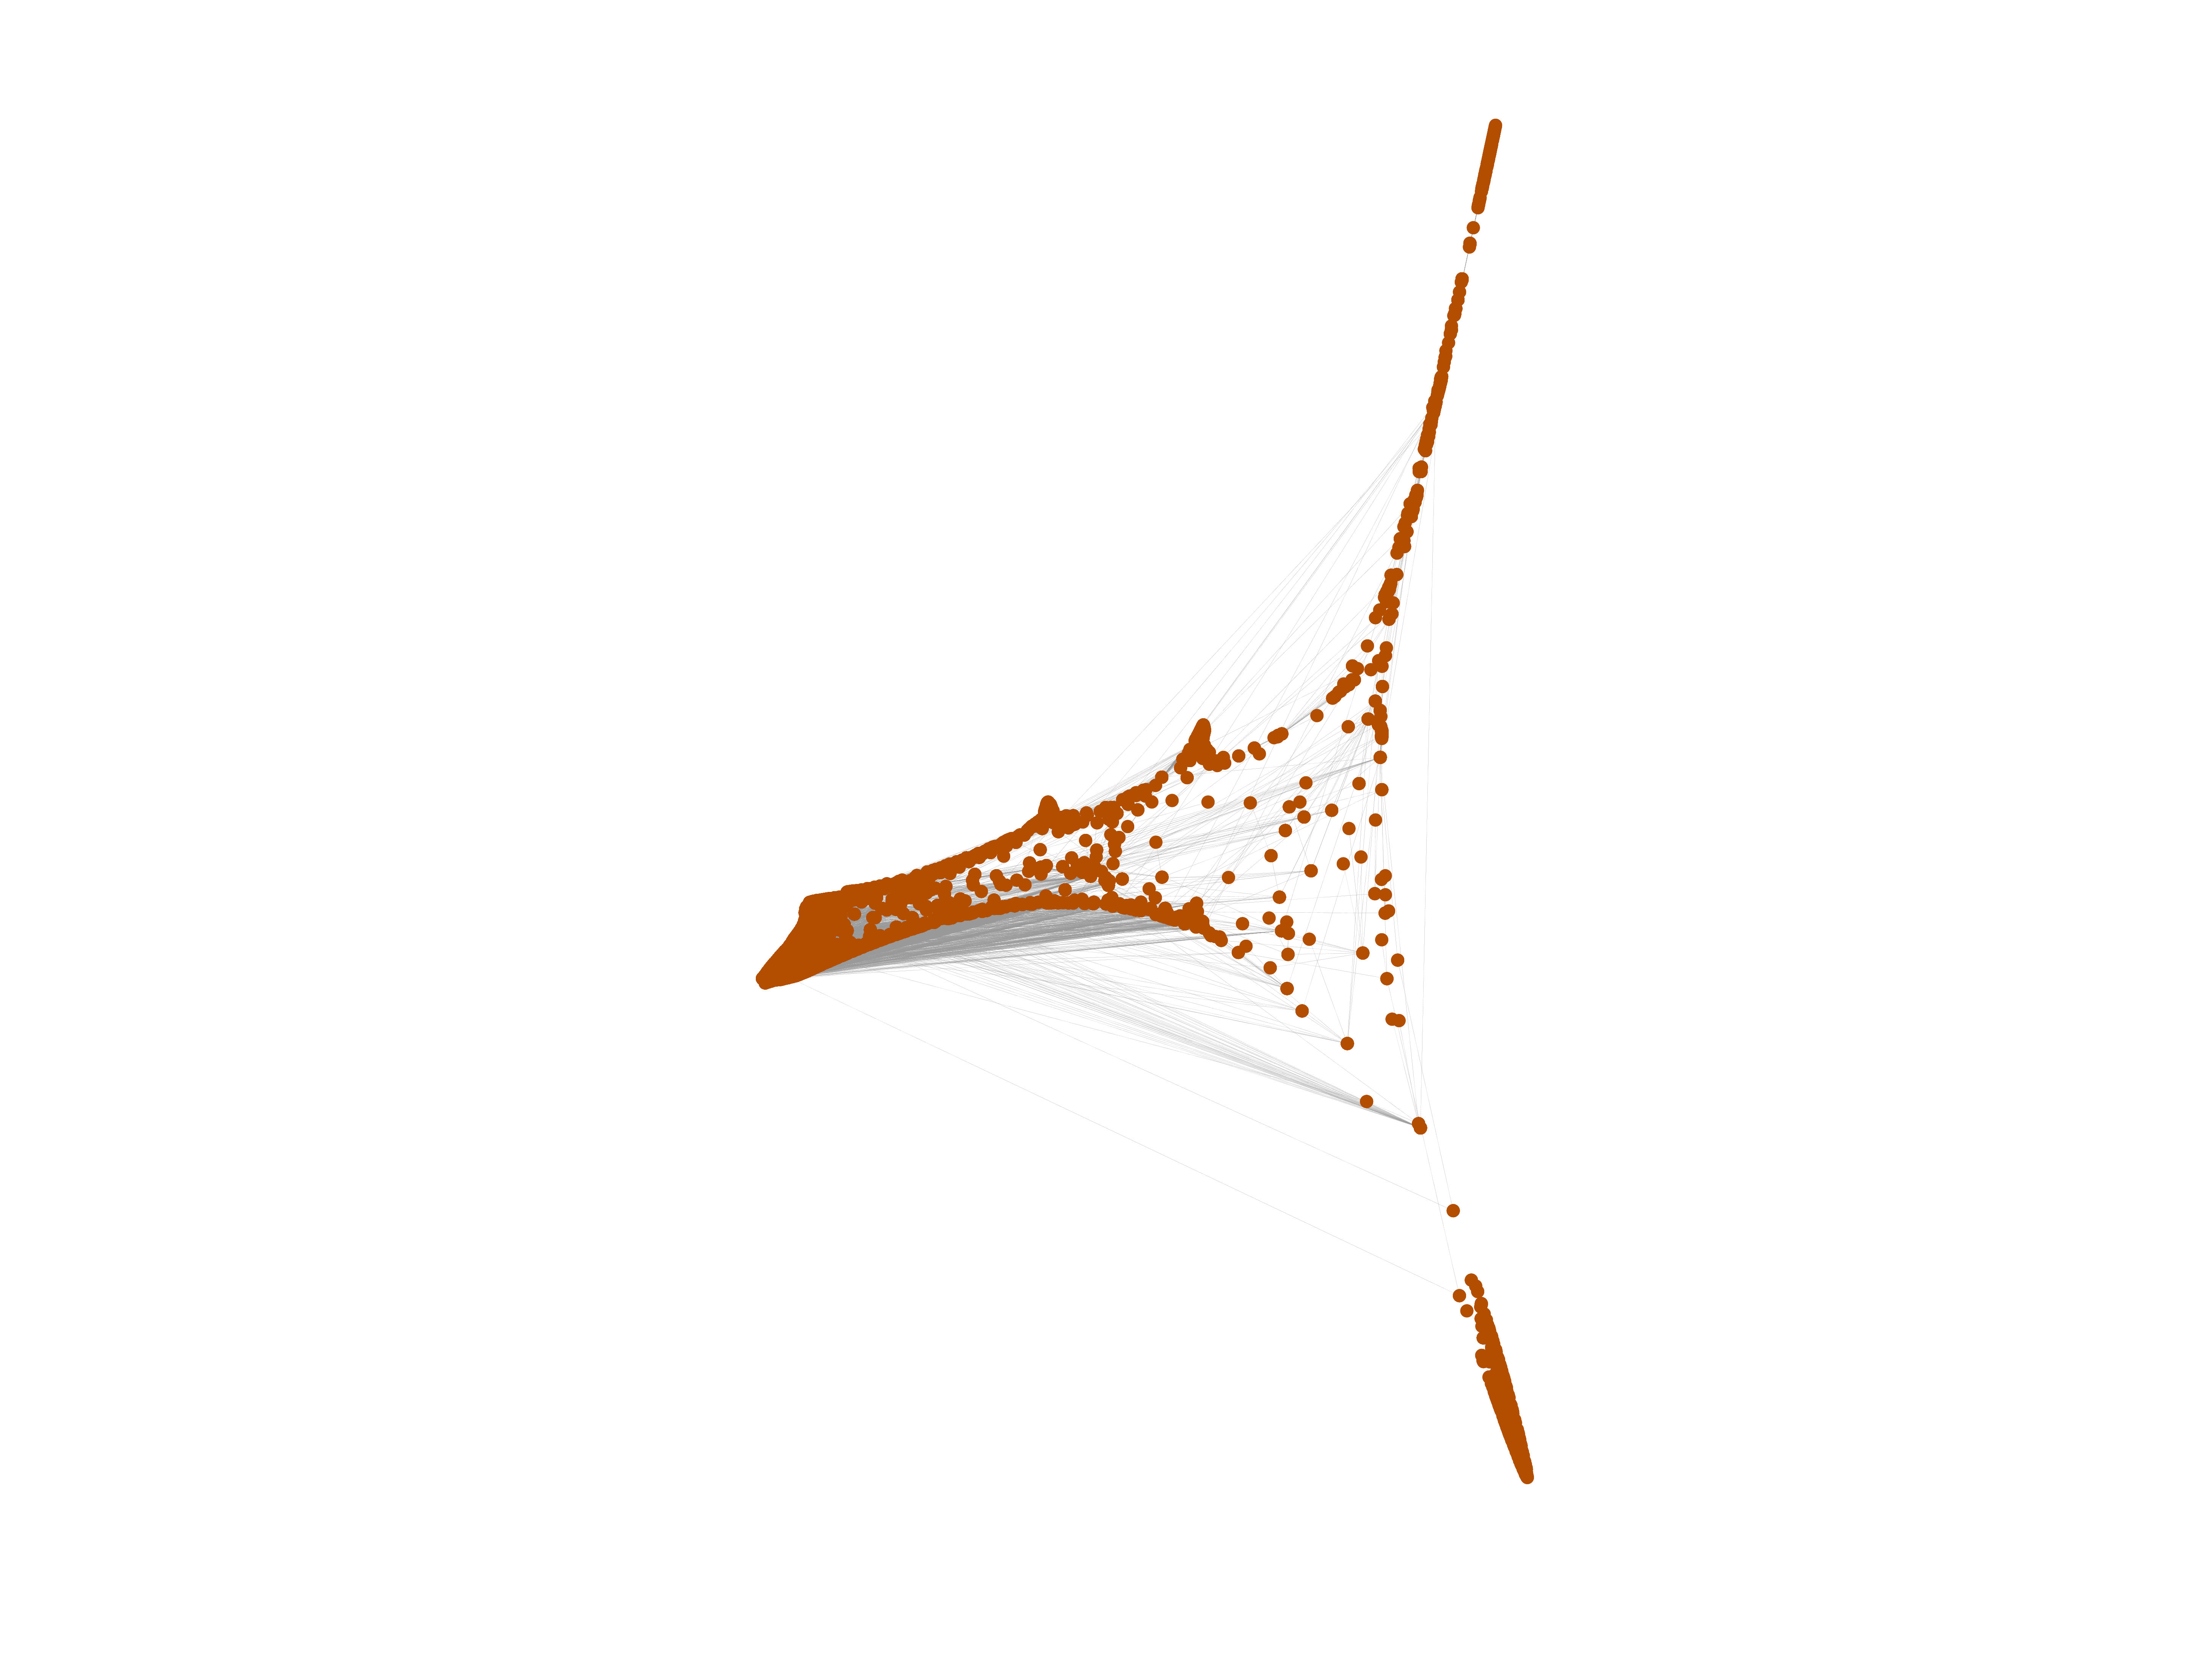
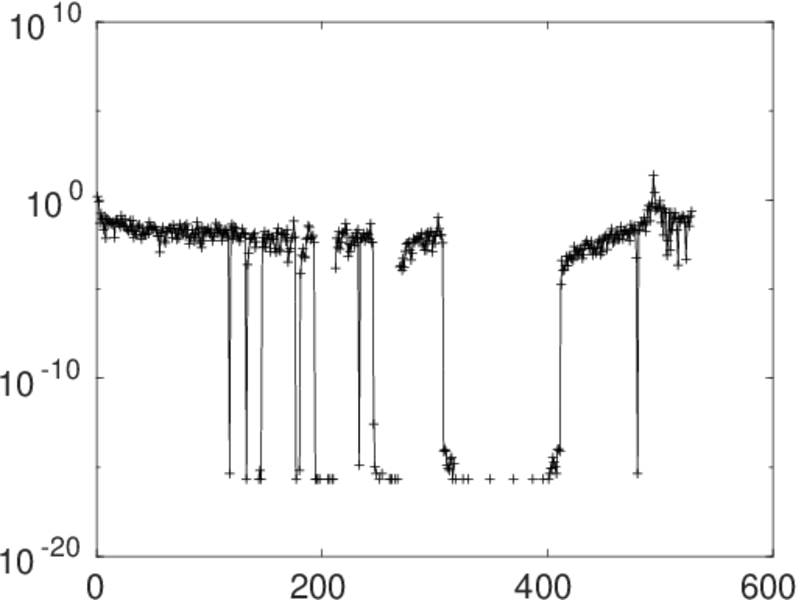
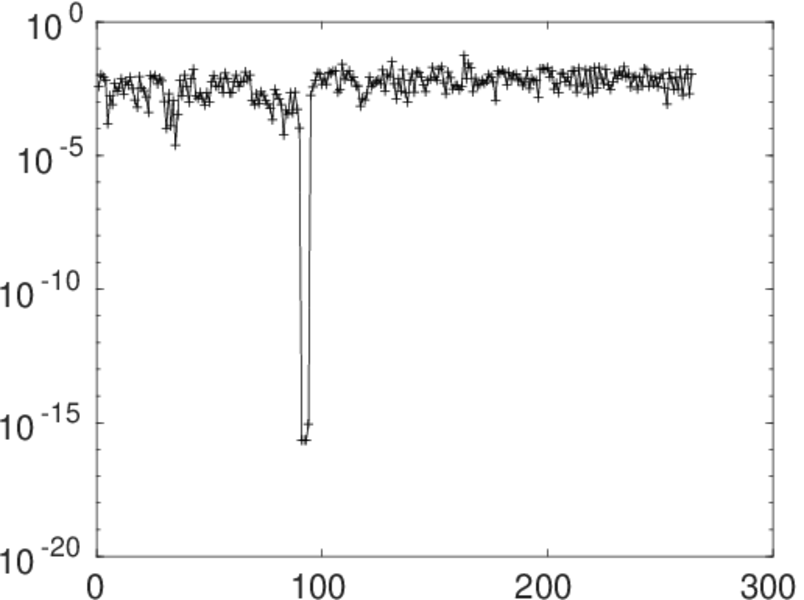
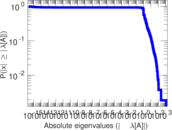
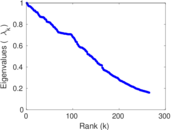
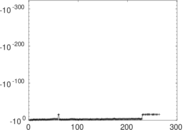
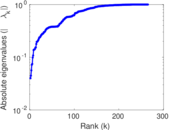
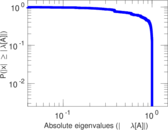
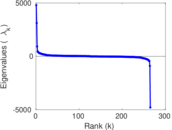
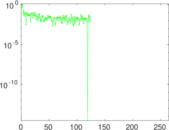
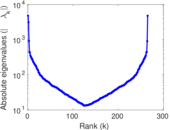
Matrix decompositions plots


Downloads
References
|
[1]
|
Jérôme Kunegis.
KONECT – The Koblenz Network Collection.
In Proc. Int. Conf. on World Wide Web Companion, pages
1343–1350, 2013.
[ http ]
|
|
[2]
|
Wikimedia Foundation.
Wikimedia downloads.
http://dumps.wikimedia.org/, January 2010.
|
 KONECT ‣ Networks ‣
Buy Me a Coffee
KONECT ‣ Networks ‣
Buy Me a Coffee