Wikipedia edits (ss)
This is the bipartite edit network of the Swati Wikipedia. It contains users
and pages from the Swati Wikipedia, connected by edit events. Each edge
represents an edit. The dataset includes the timestamp of each edit.
Metadata
Statistics
| Size | n = | 2,752
|
| Left size | n1 = | 712
|
| Right size | n2 = | 2,040
|
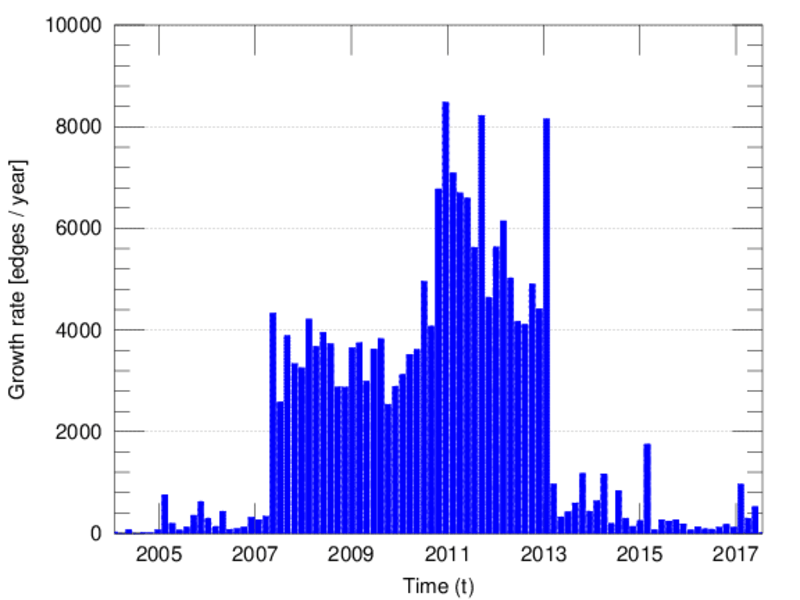
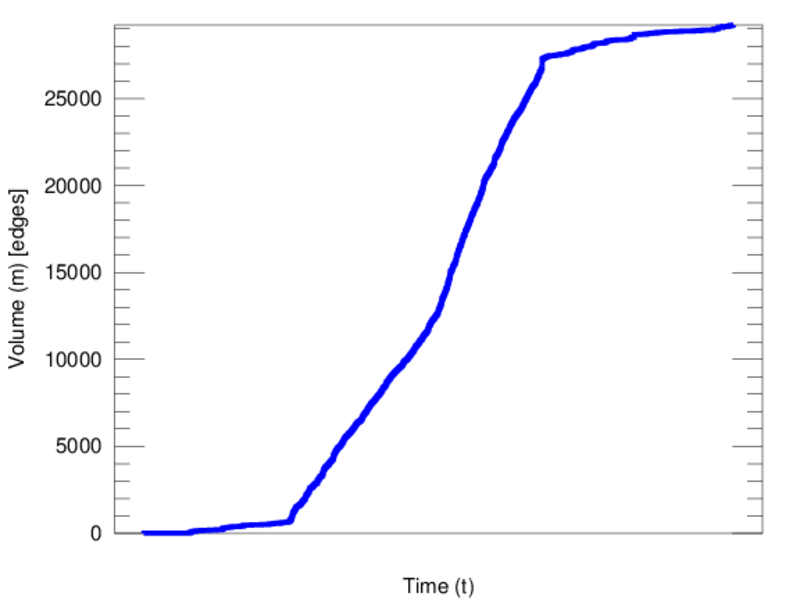
| Volume | m = | 29,222
|
| Unique edge count | m̿ = | 11,148
|
| Wedge count | s = | 1,202,424
|
| Claw count | z = | 123,212,909
|
| Cross count | x = | 12,757,226,144
|
| Square count | q = | 4,219,590
|
| 4-Tour count | T4 = | 38,589,744
|
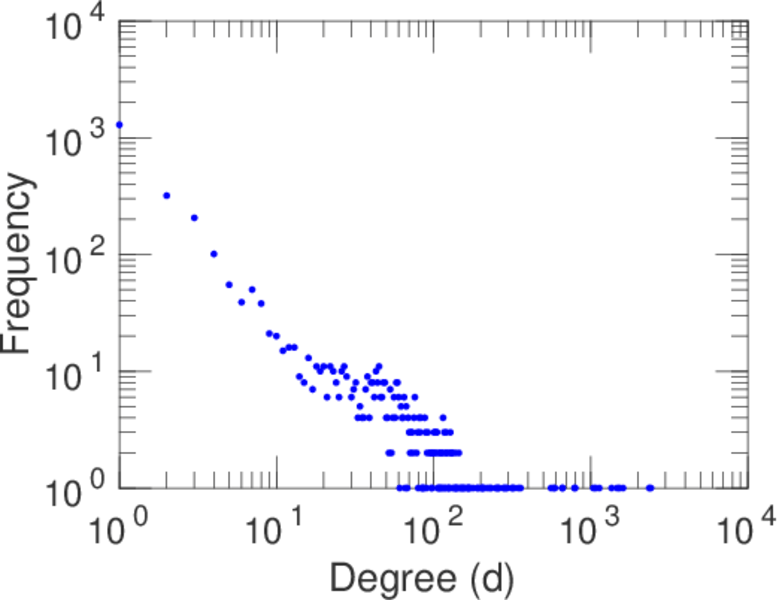
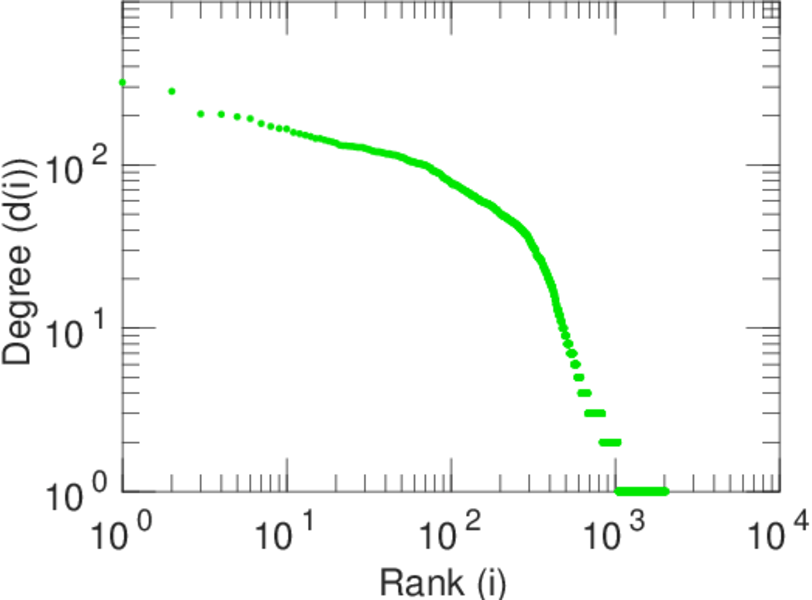
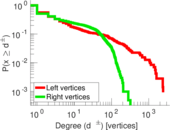
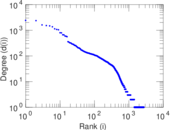
| Maximum degree | dmax = | 2,418
|
| Maximum left degree | d1max = | 2,418
|
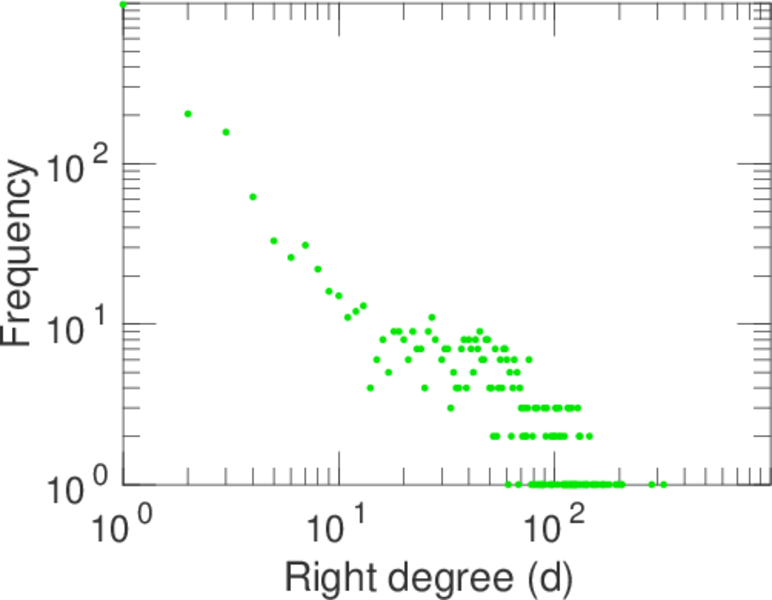
| Maximum right degree | d2max = | 320
|
| Average degree | d = | 21.236 9
|
| Average left degree | d1 = | 41.042 1
|
| Average right degree | d2 = | 14.324 5
|
| Fill | p = | 0.007 675 15
|
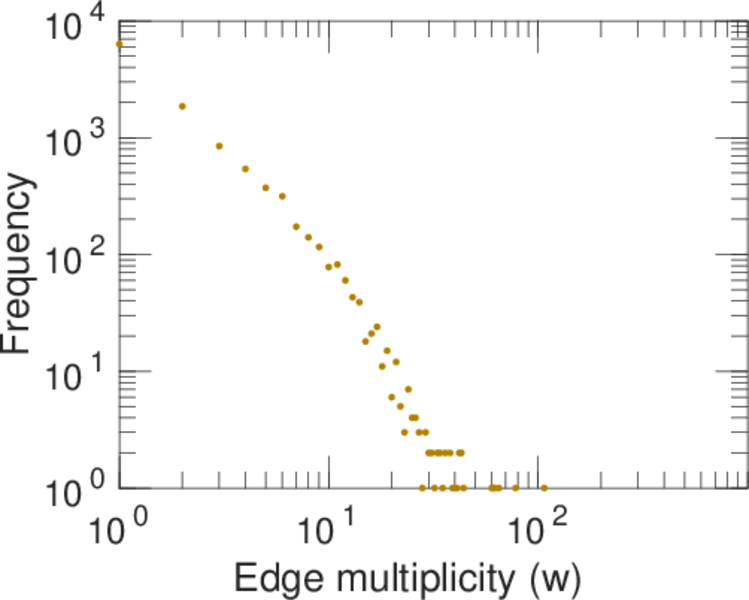
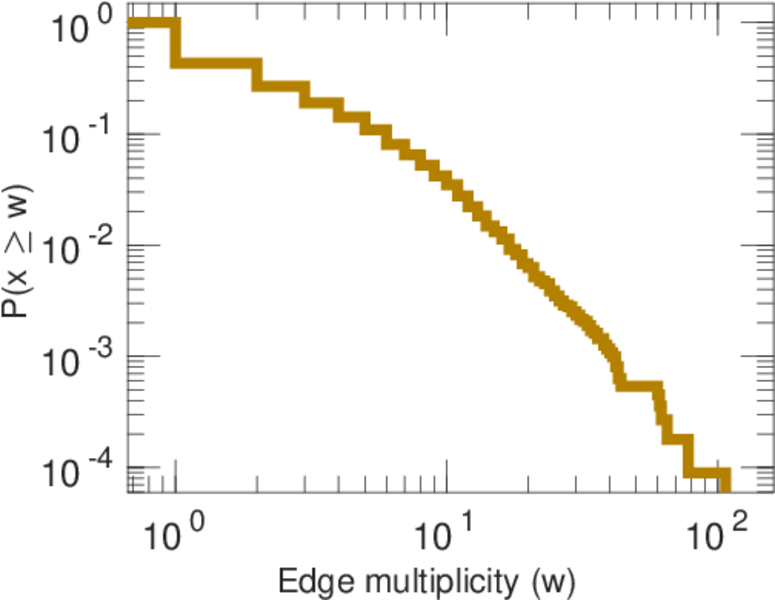
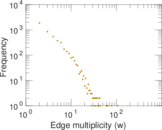
| Average edge multiplicity | m̃ = | 2.621 28
|
| Size of LCC | N = | 2,296
|
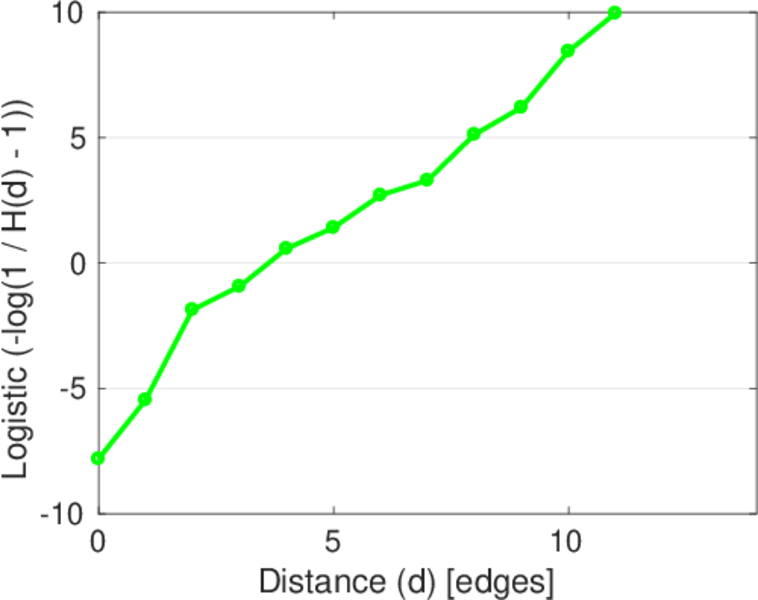
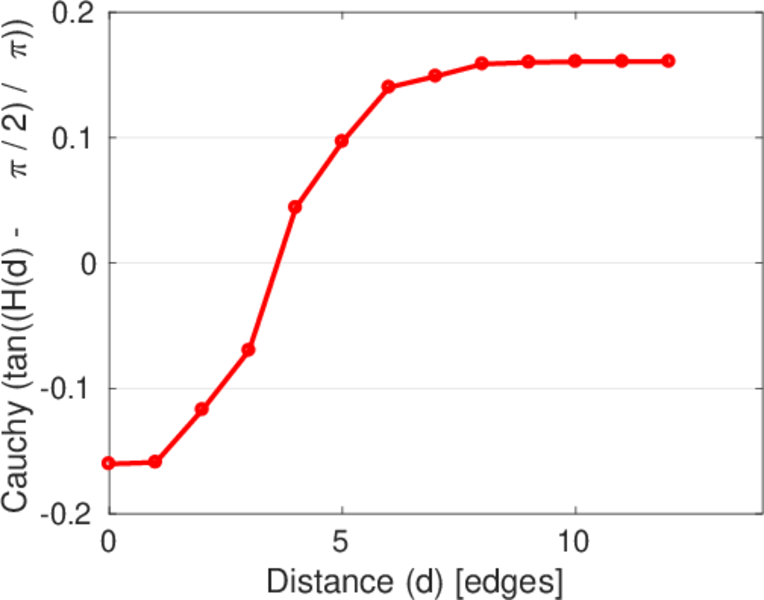
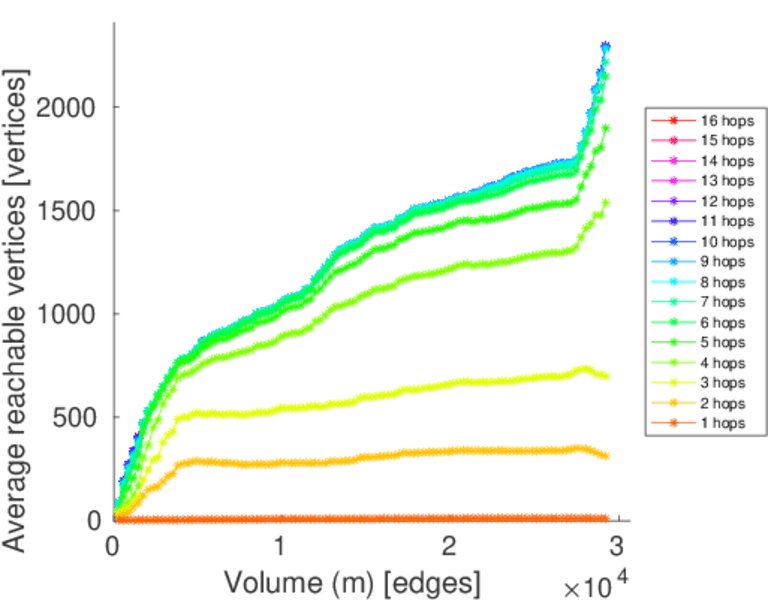
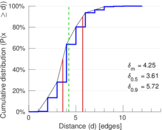
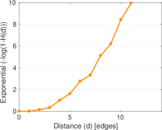
| Diameter | δ = | 14
|
| 50-Percentile effective diameter | δ0.5 = | 3.613 39
|
| 90-Percentile effective diameter | δ0.9 = | 5.724 70
|
| Median distance | δM = | 4
|
| Mean distance | δm = | 4.247 34
|
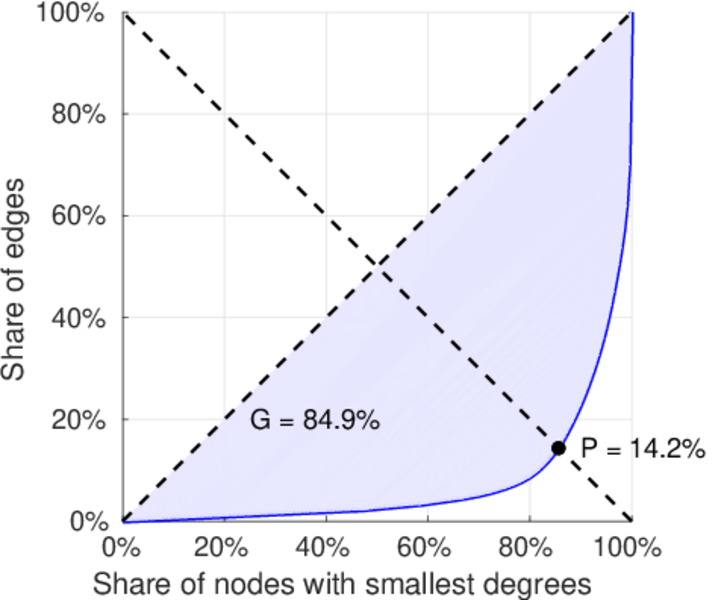
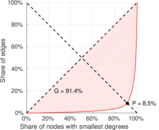
| Gini coefficient | G = | 0.835 107
|
| Balanced inequality ratio | P = | 0.155 465
|
| Left balanced inequality ratio | P1 = | 0.085 346 7
|
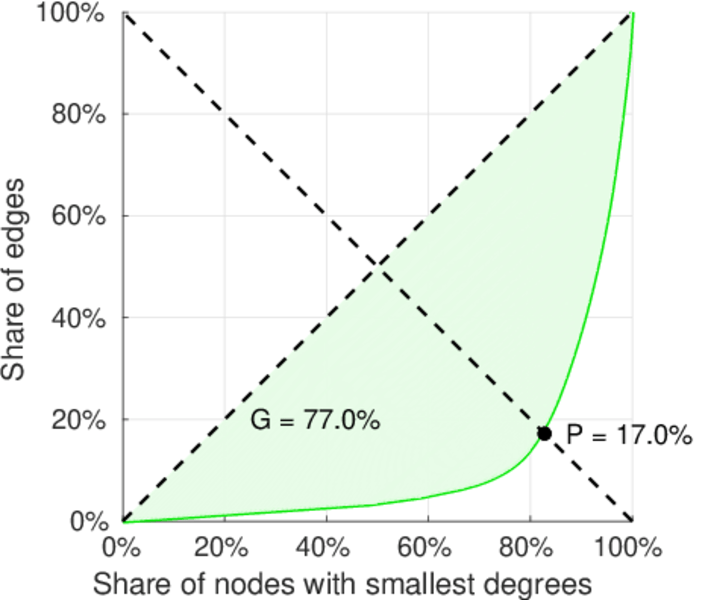
| Right balanced inequality ratio | P2 = | 0.170 488
|
| Relative edge distribution entropy | Her = | 0.809 331
|
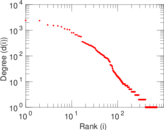
| Power law exponent | γ = | 2.174 46
|
| Tail power law exponent | γt = | 2.511 00
|
| Tail power law exponent with p | γ3 = | 2.511 00
|
| p-value | p = | 0.000 00
|
| Left tail power law exponent with p | γ3,1 = | 1.721 00
|
| Left p-value | p1 = | 0.000 00
|
| Right tail power law exponent with p | γ3,2 = | 4.571 00
|
| Right p-value | p2 = | 0.000 00
|
| Degree assortativity | ρ = | −0.056 619 0
|
| Degree assortativity p-value | pρ = | 2.201 47 × 10−9
|
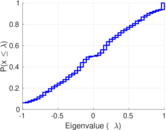
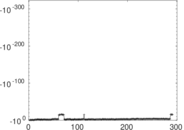
| Spectral norm | α = | 297.685
|
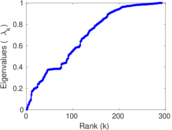
| Algebraic connectivity | a = | 0.014 405 1
|
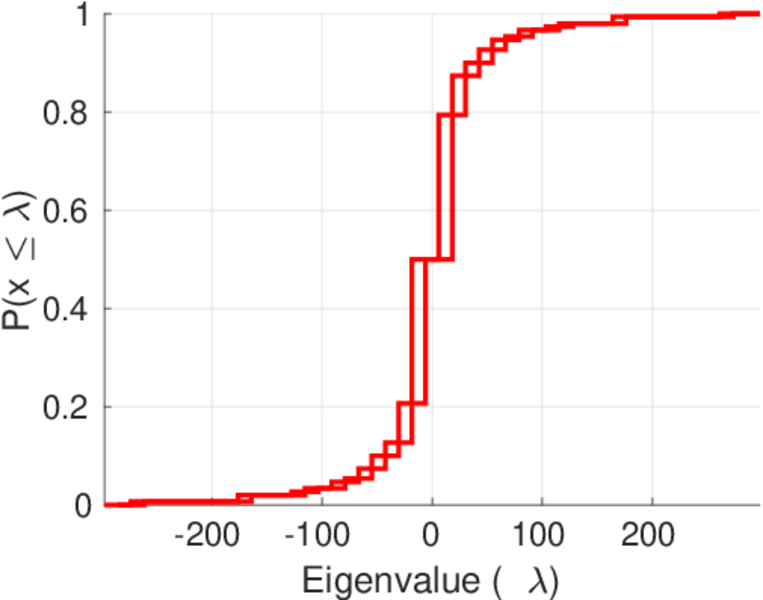
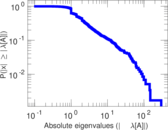
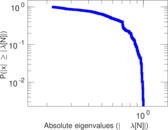
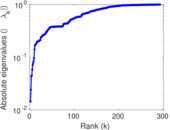
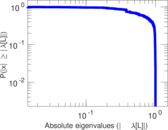
| Spectral separation | |λ1[A] / λ2[A]| = | 1.993 81
|
| Controllability | C = | 1,555
|
| Relative controllability | Cr = | 0.568 972
|
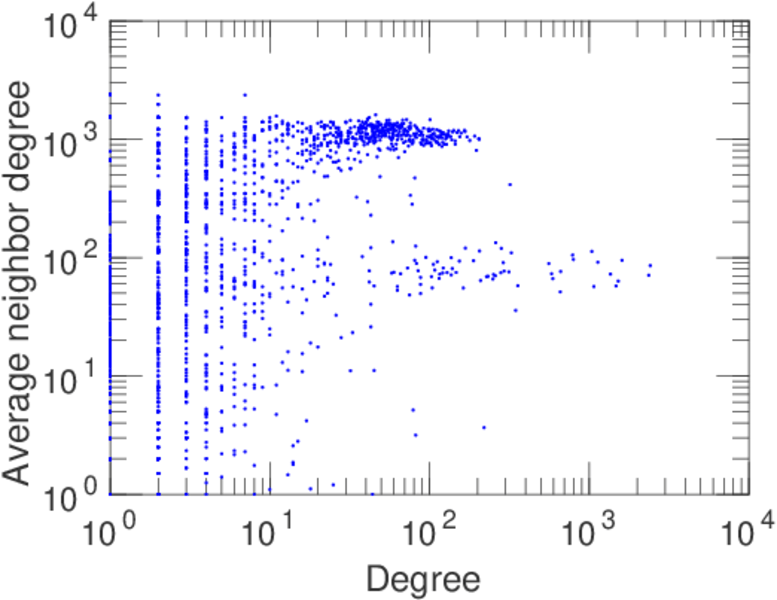
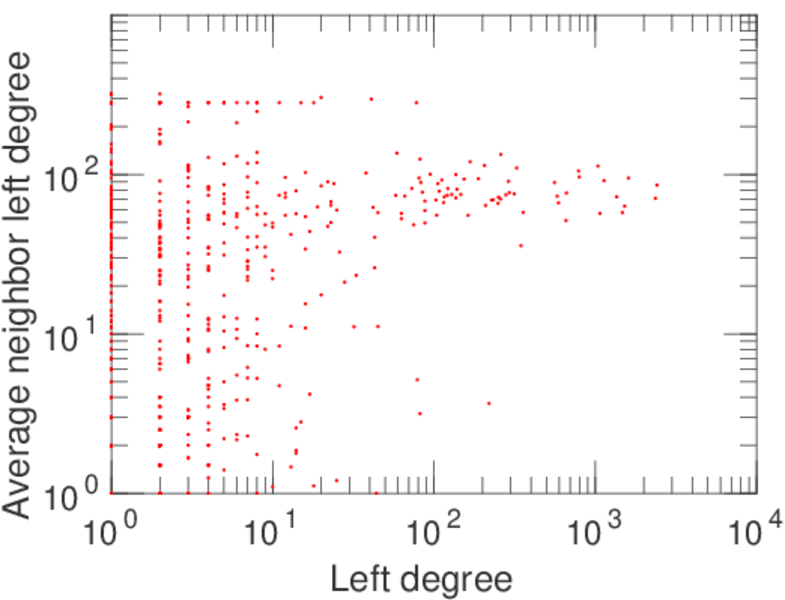
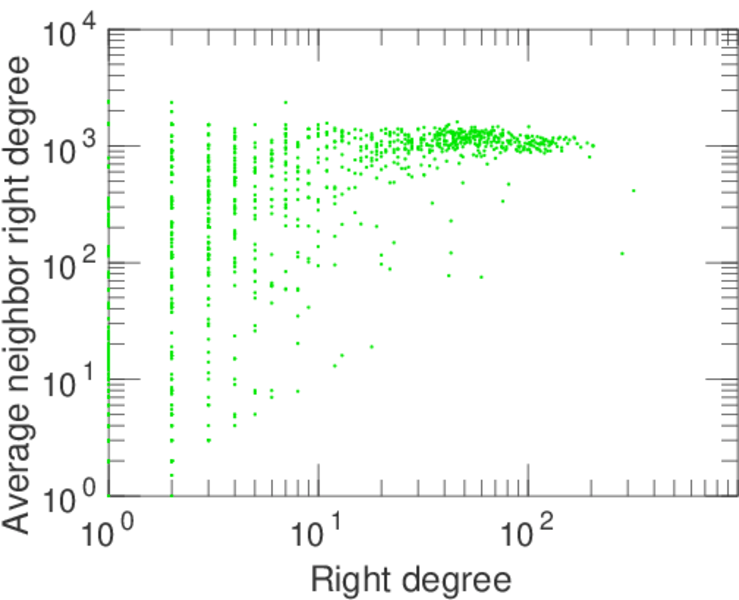
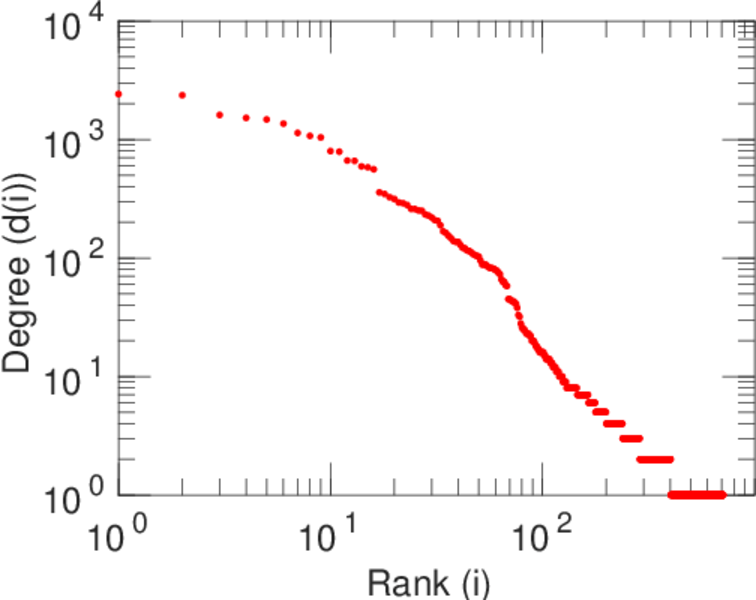
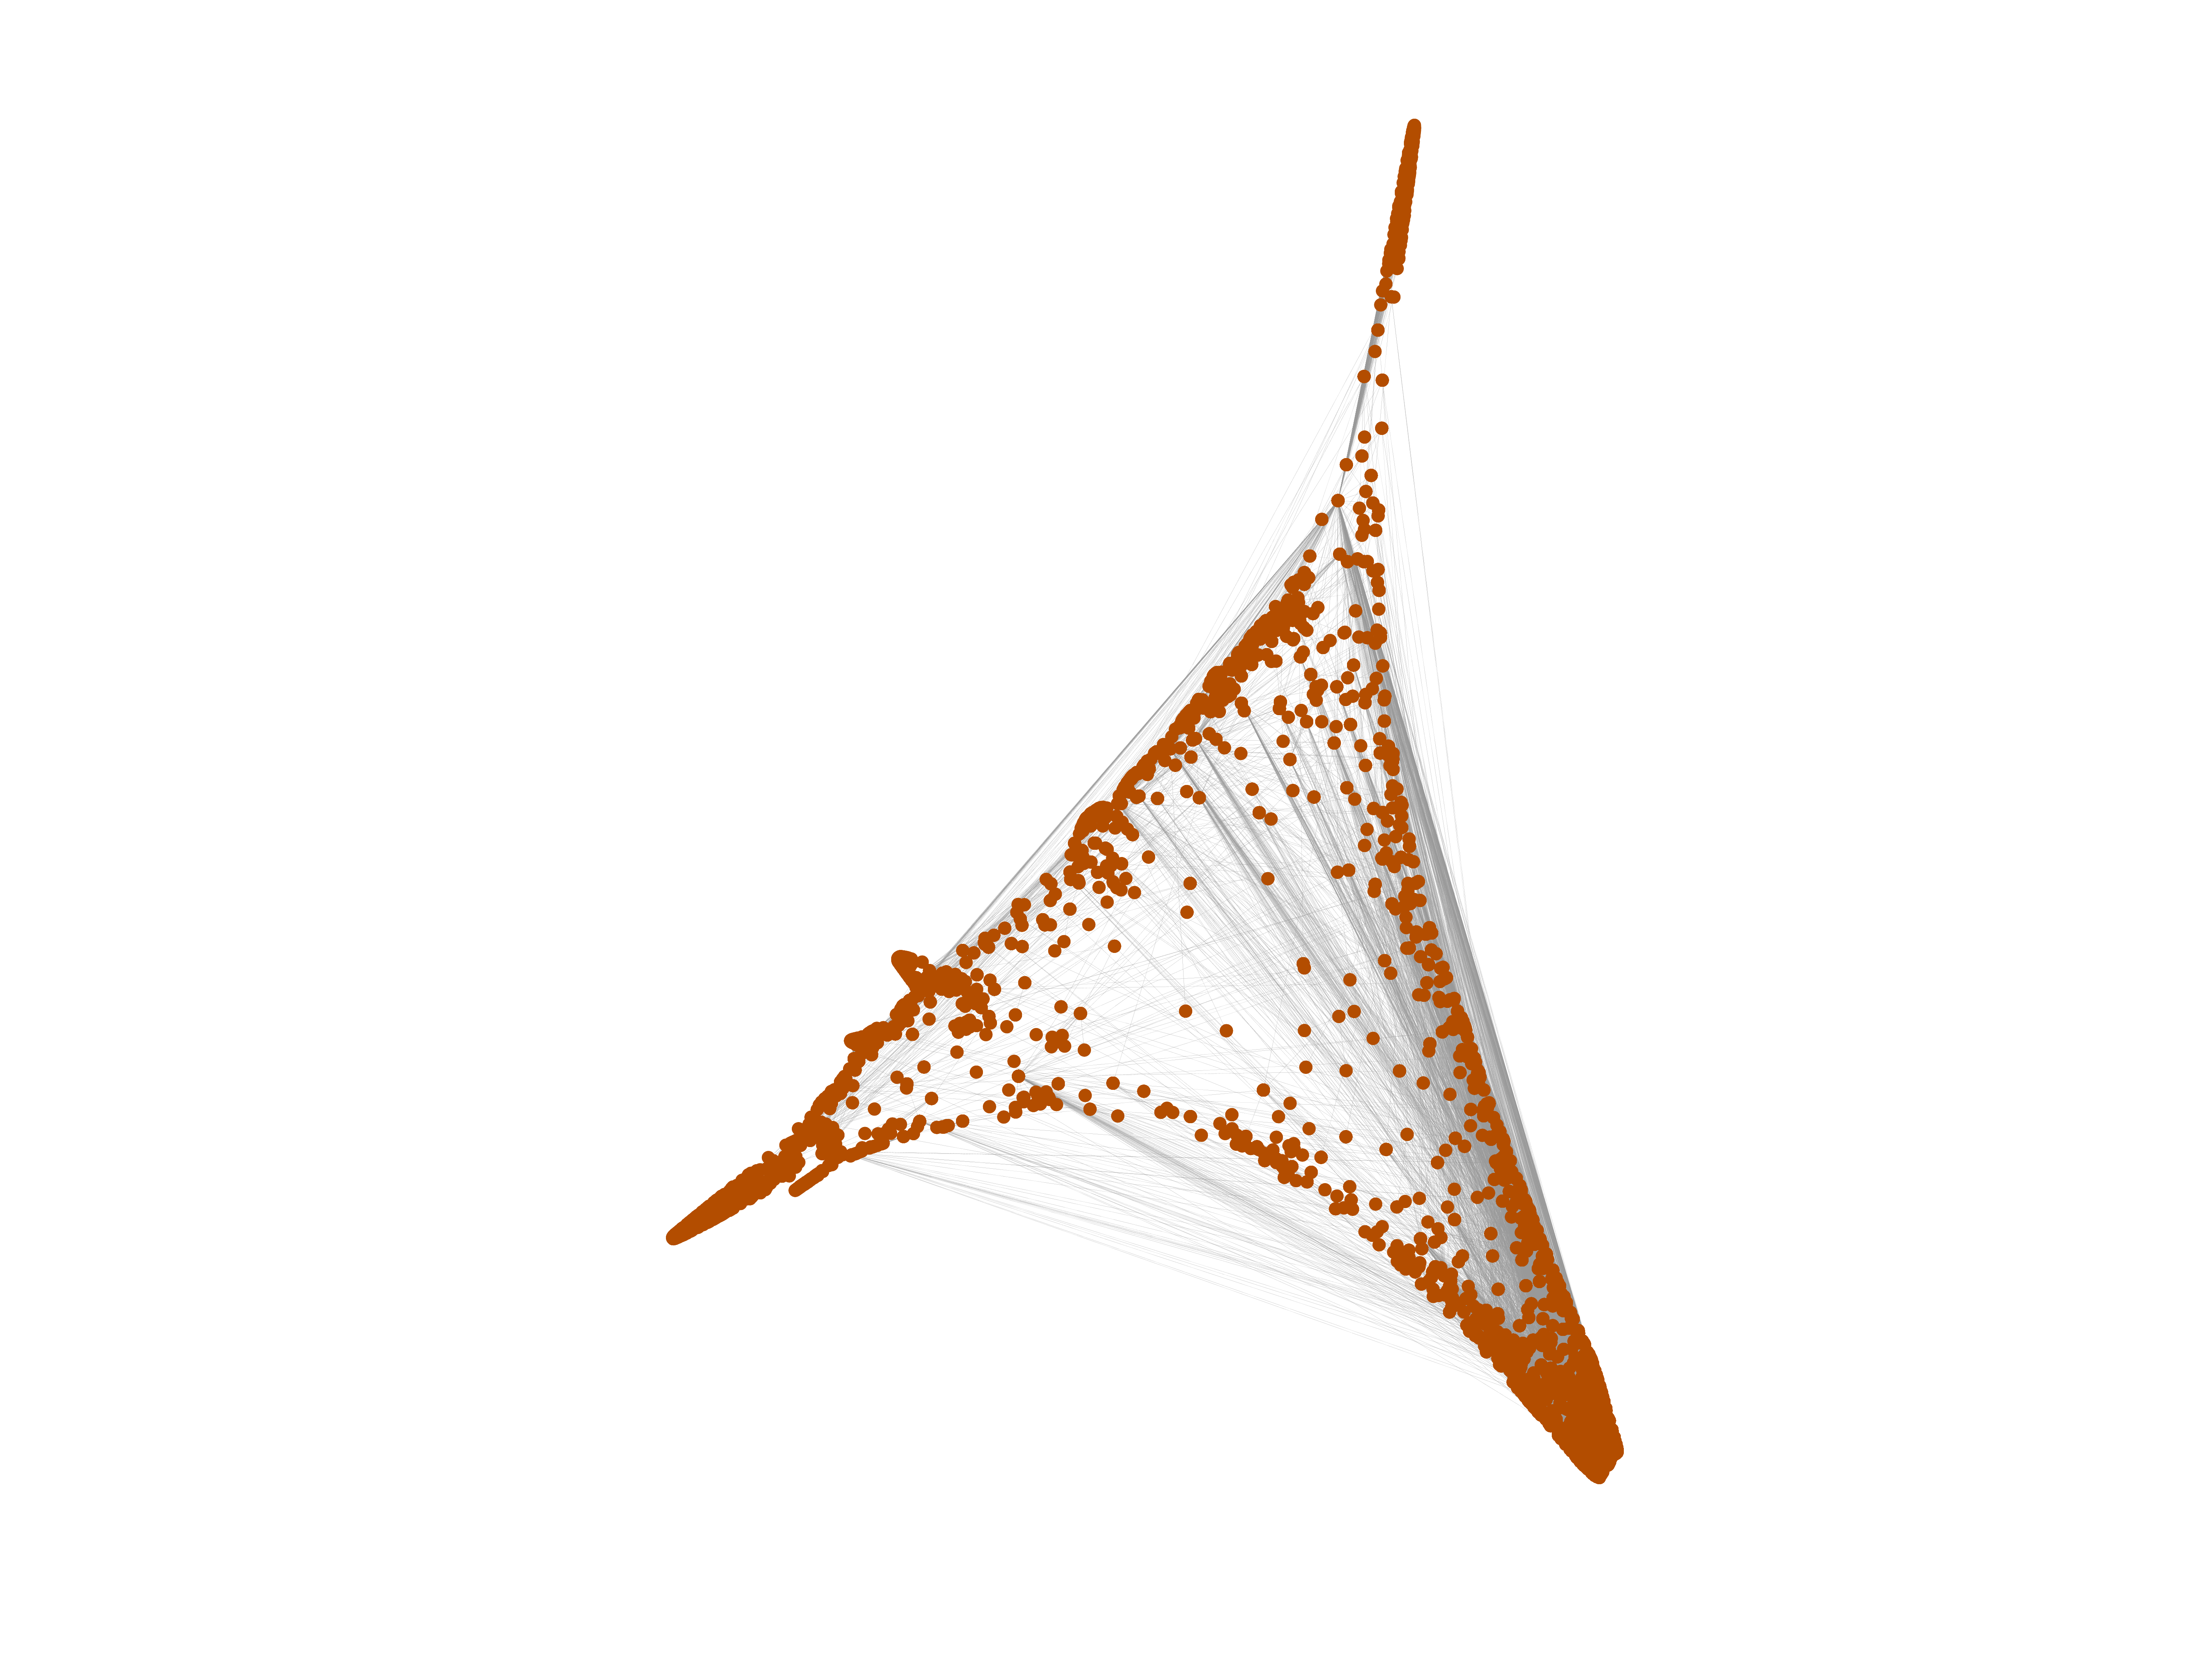
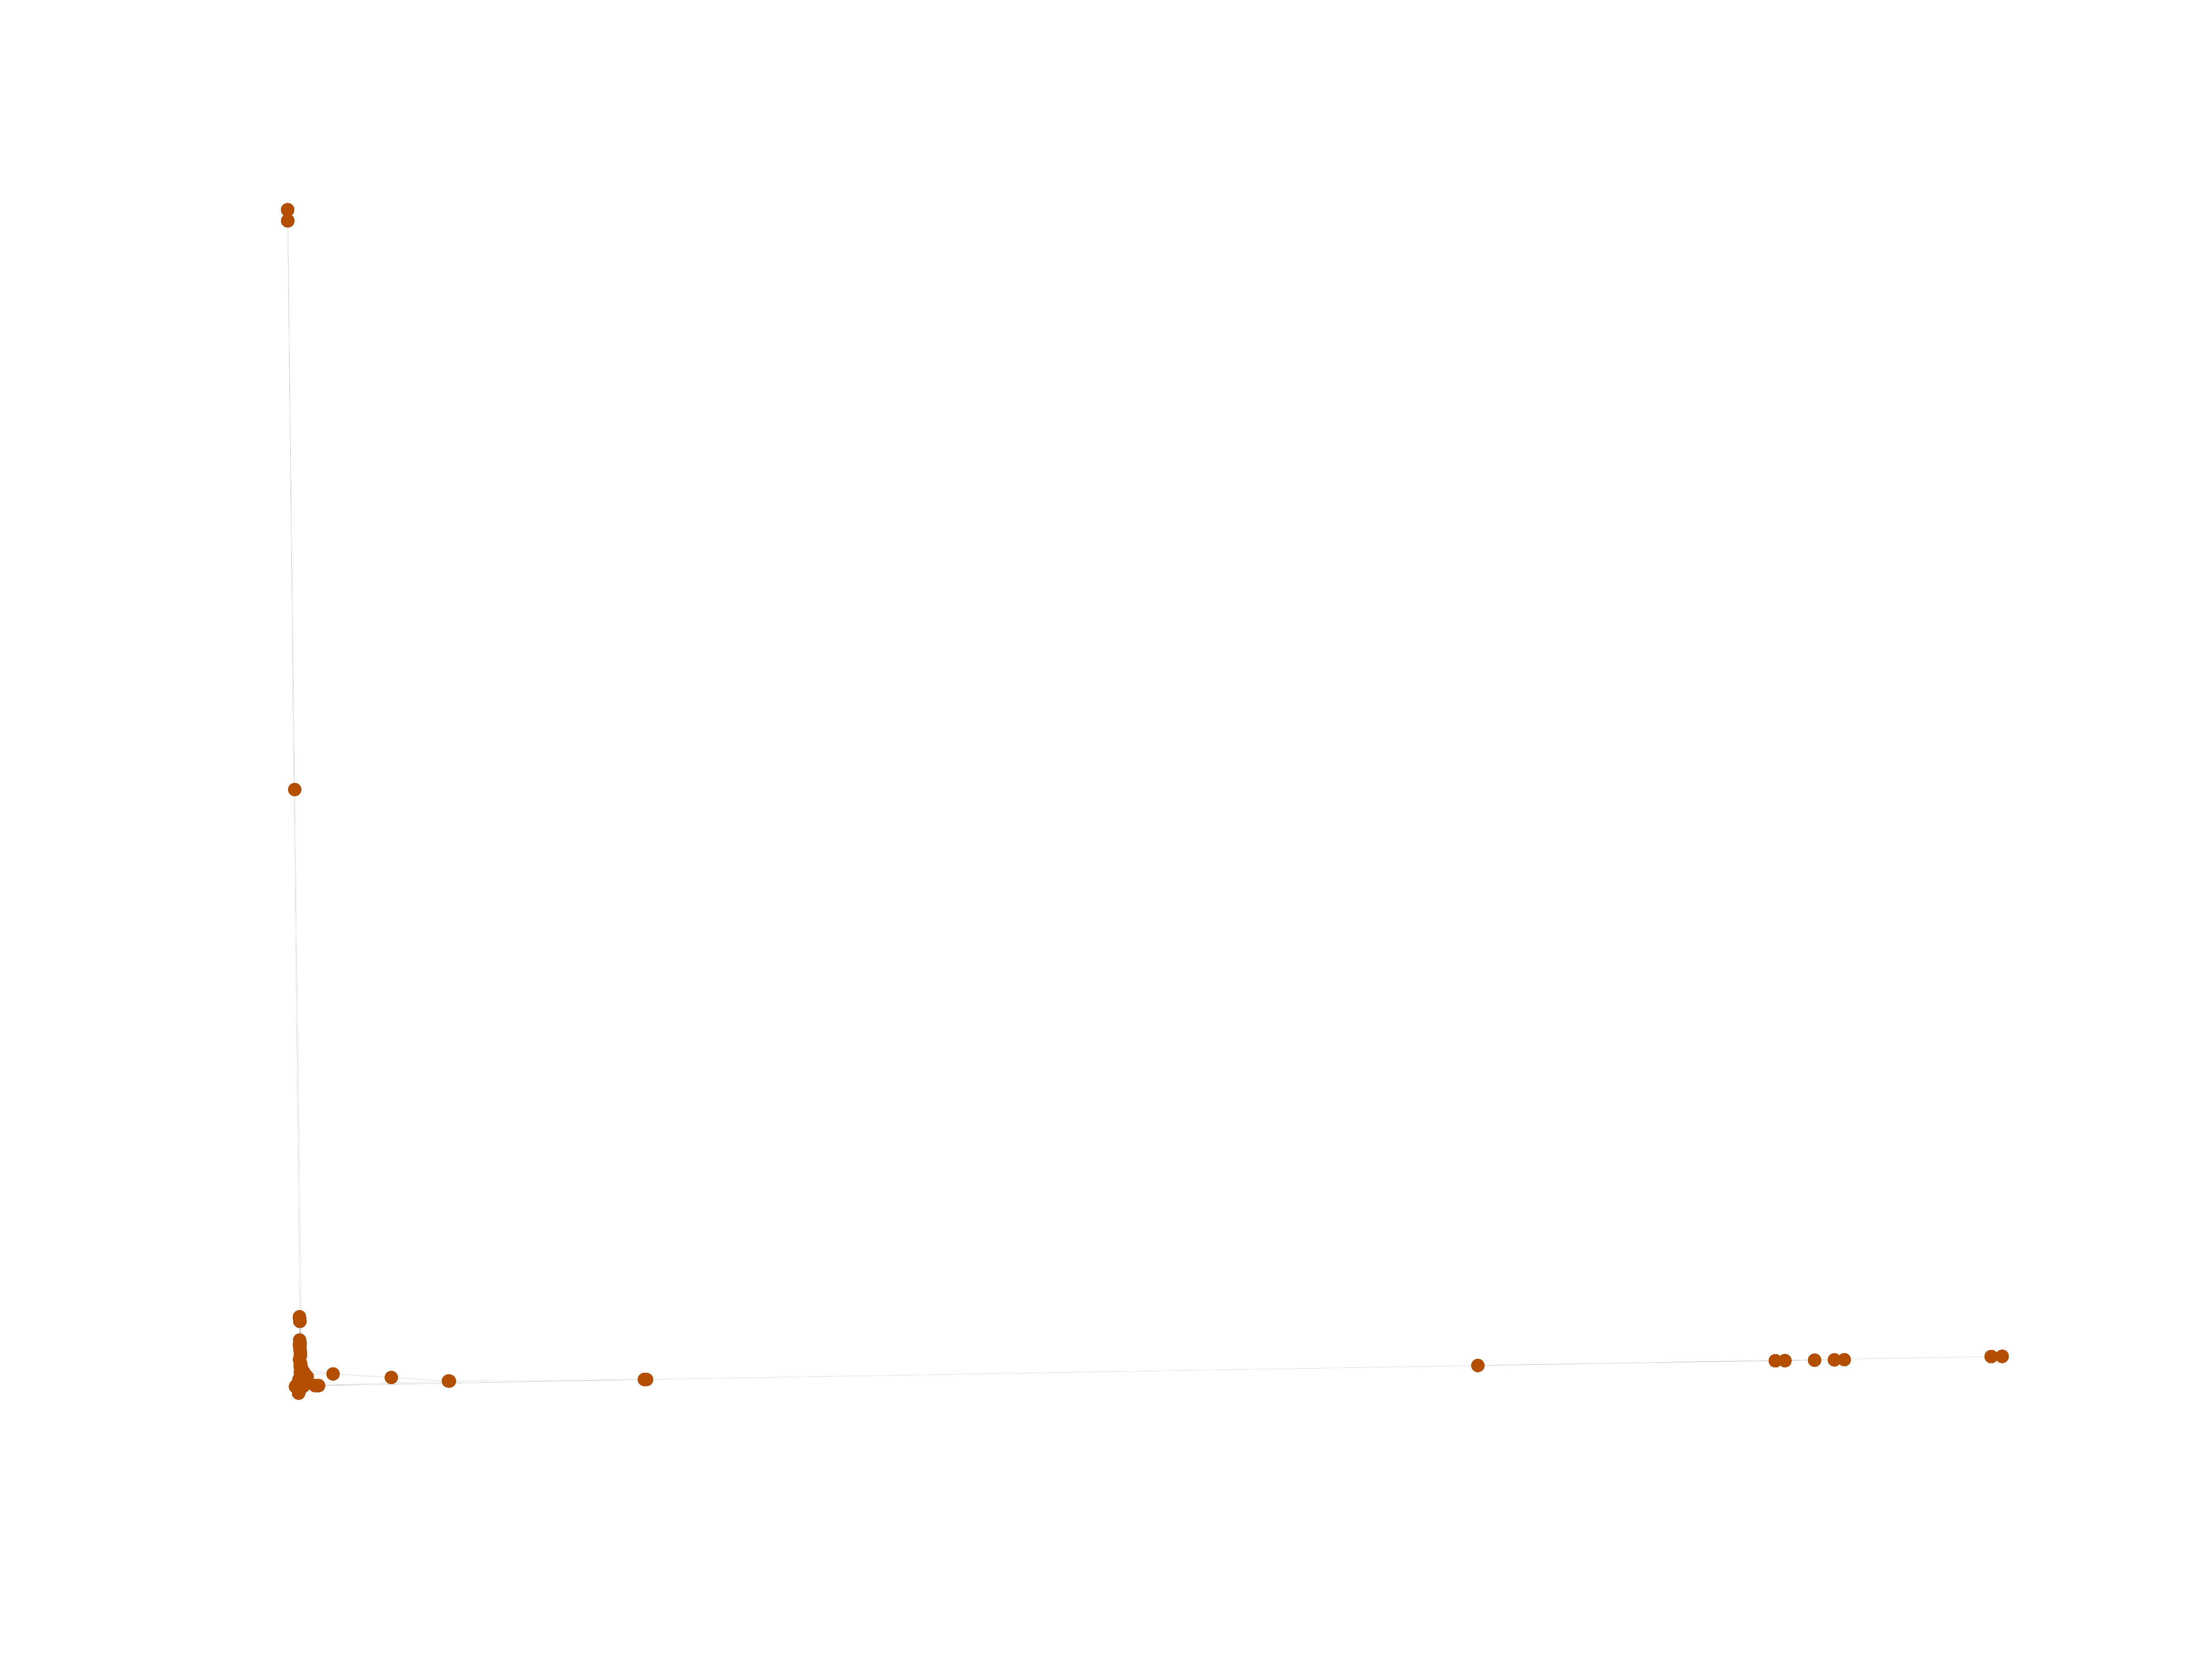
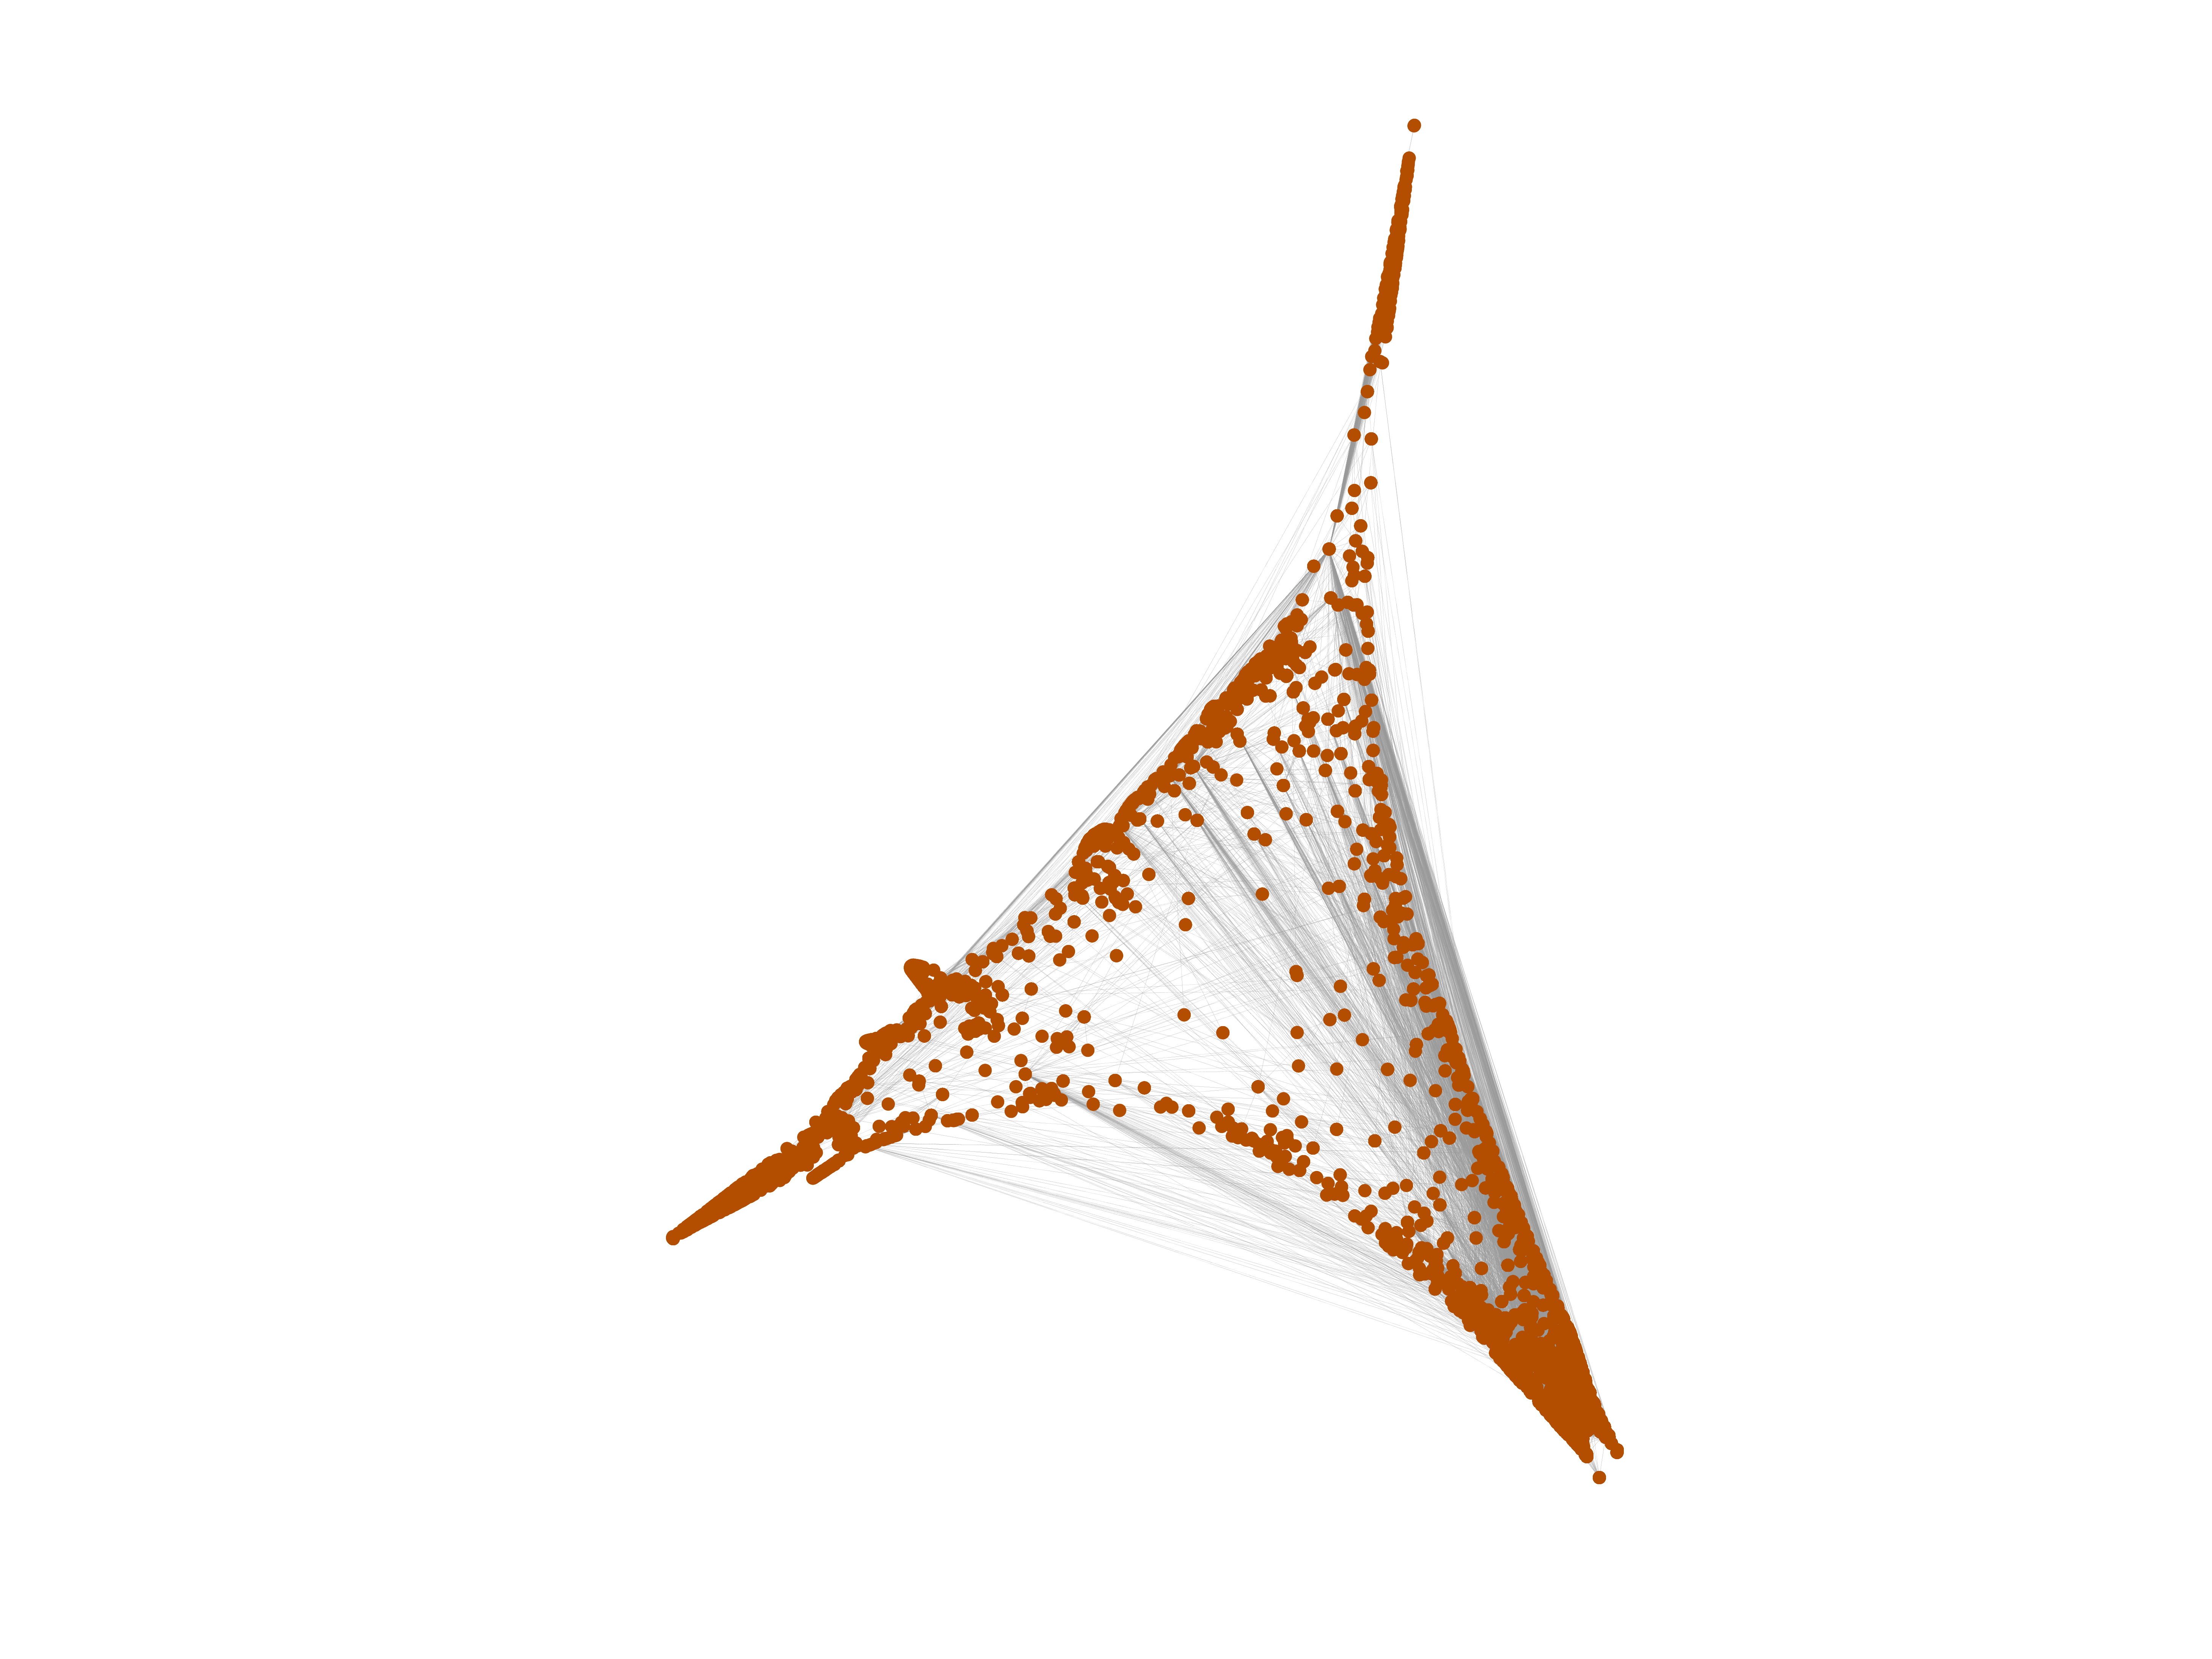
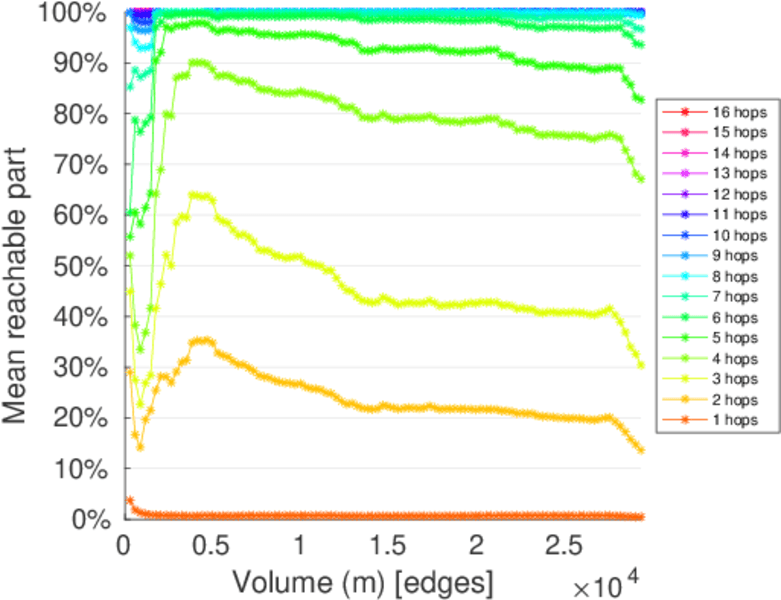
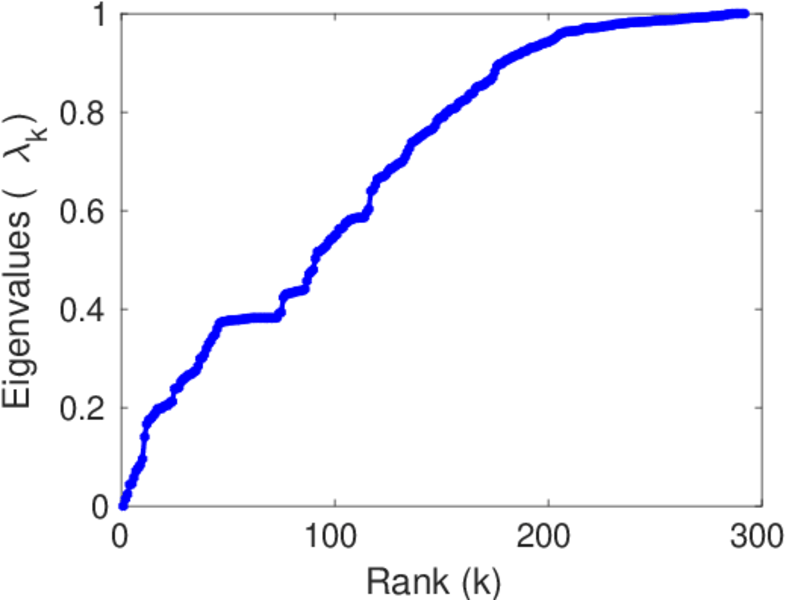
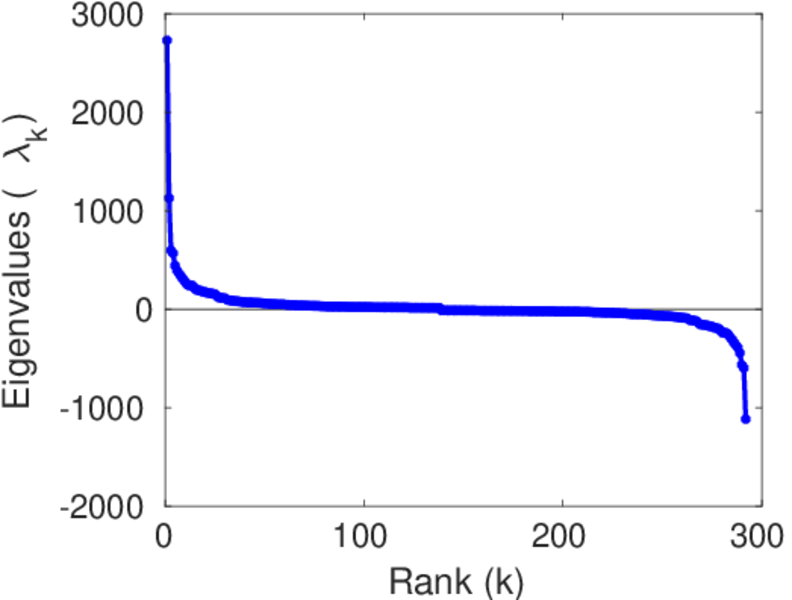
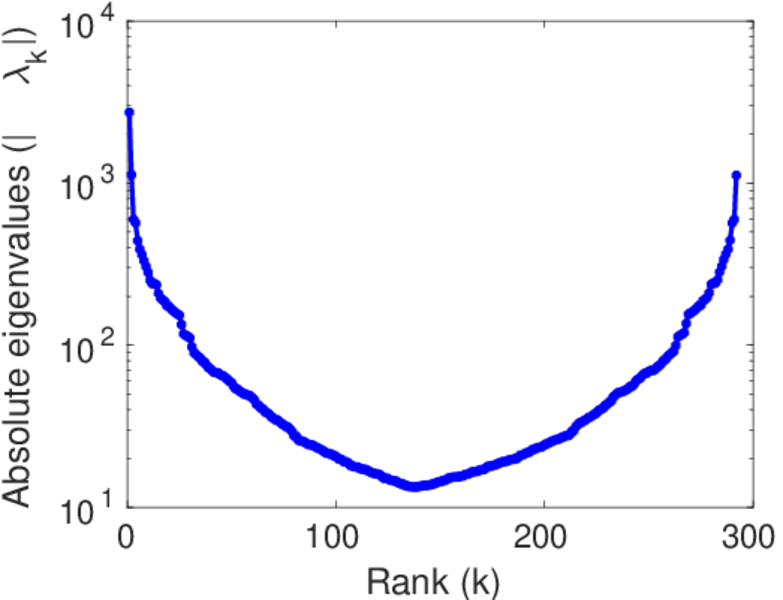
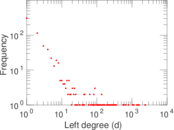
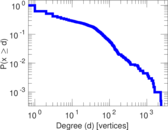
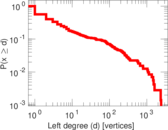
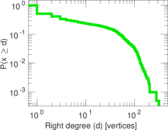
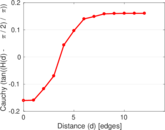
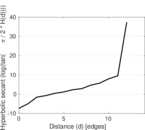
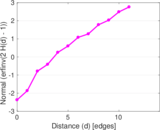
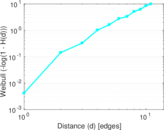
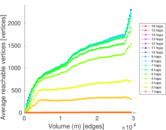
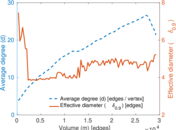
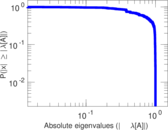
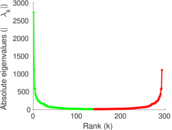
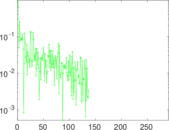
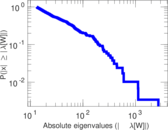
Plots


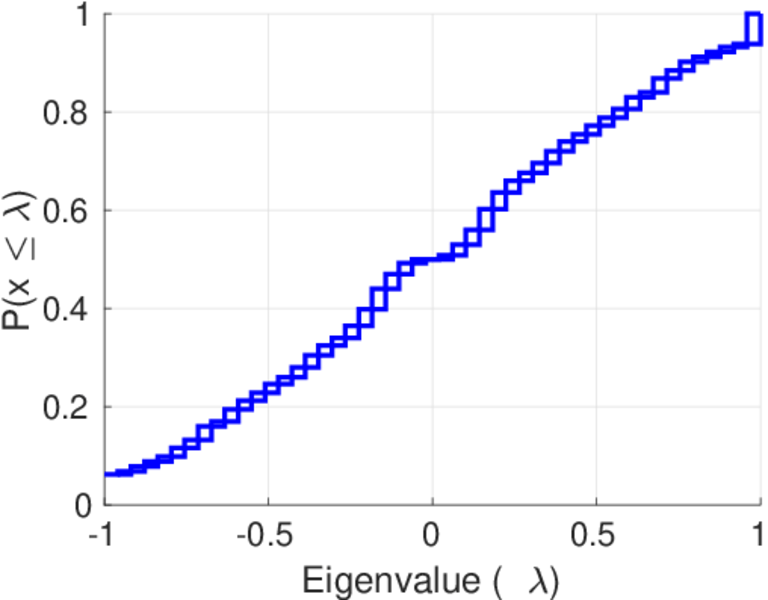
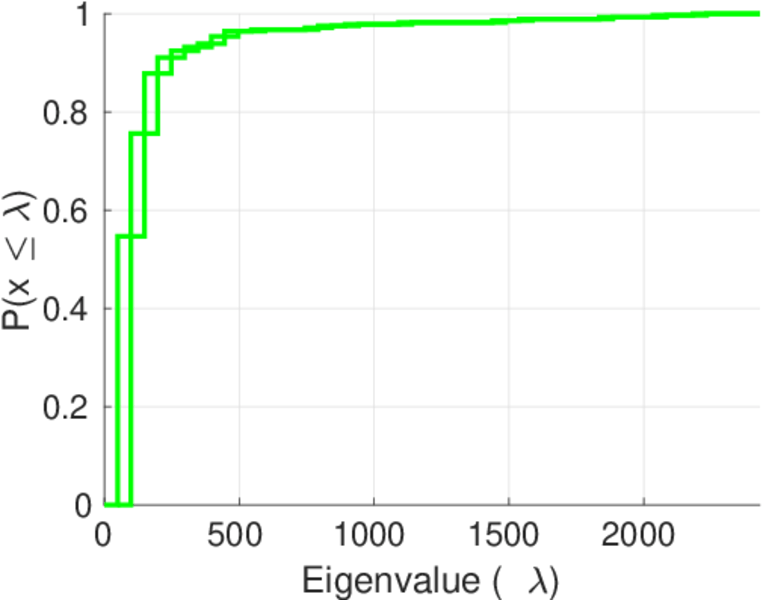
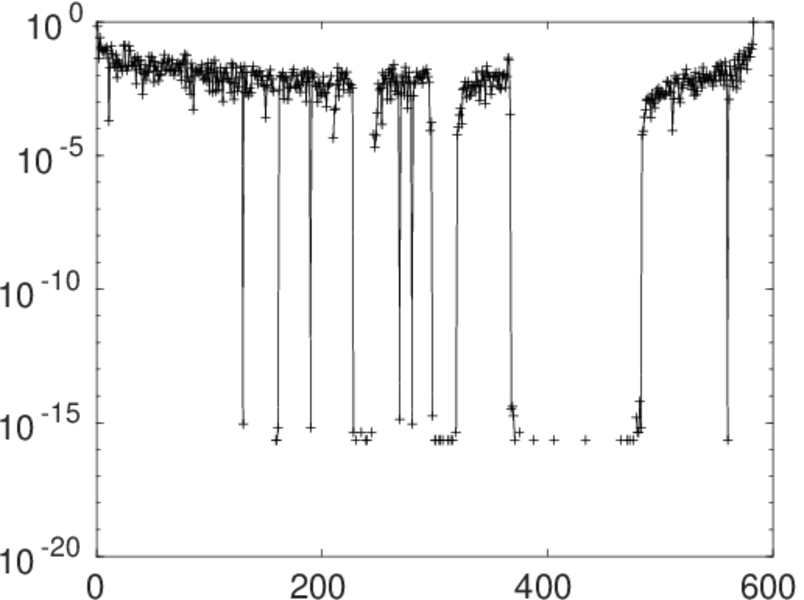
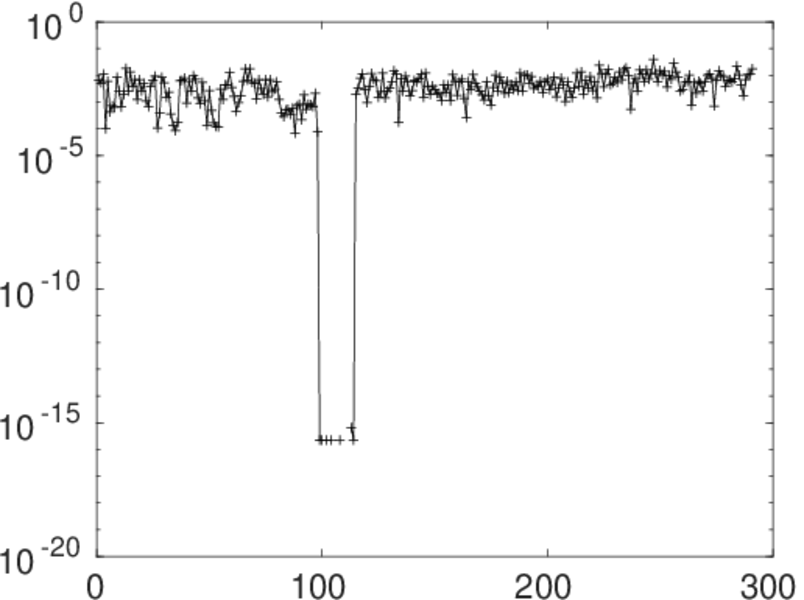
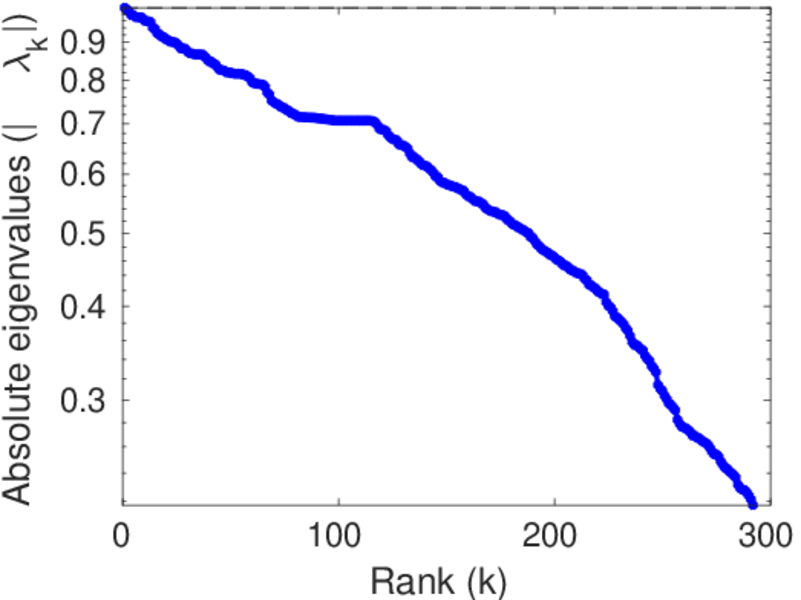
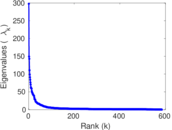
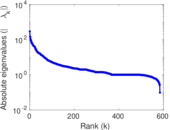
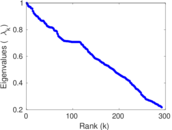
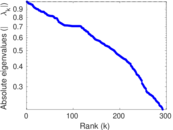
Matrix decompositions plots


Downloads
References
|
[1]
|
Jérôme Kunegis.
KONECT – The Koblenz Network Collection.
In Proc. Int. Conf. on World Wide Web Companion, pages
1343–1350, 2013.
[ http ]
|
|
[2]
|
Wikimedia Foundation.
Wikimedia downloads.
http://dumps.wikimedia.org/, January 2010.
|
 KONECT ‣ Networks ‣
Buy Me a Coffee
KONECT ‣ Networks ‣
Buy Me a Coffee