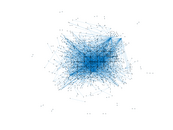
Wiktionary edits (ss)
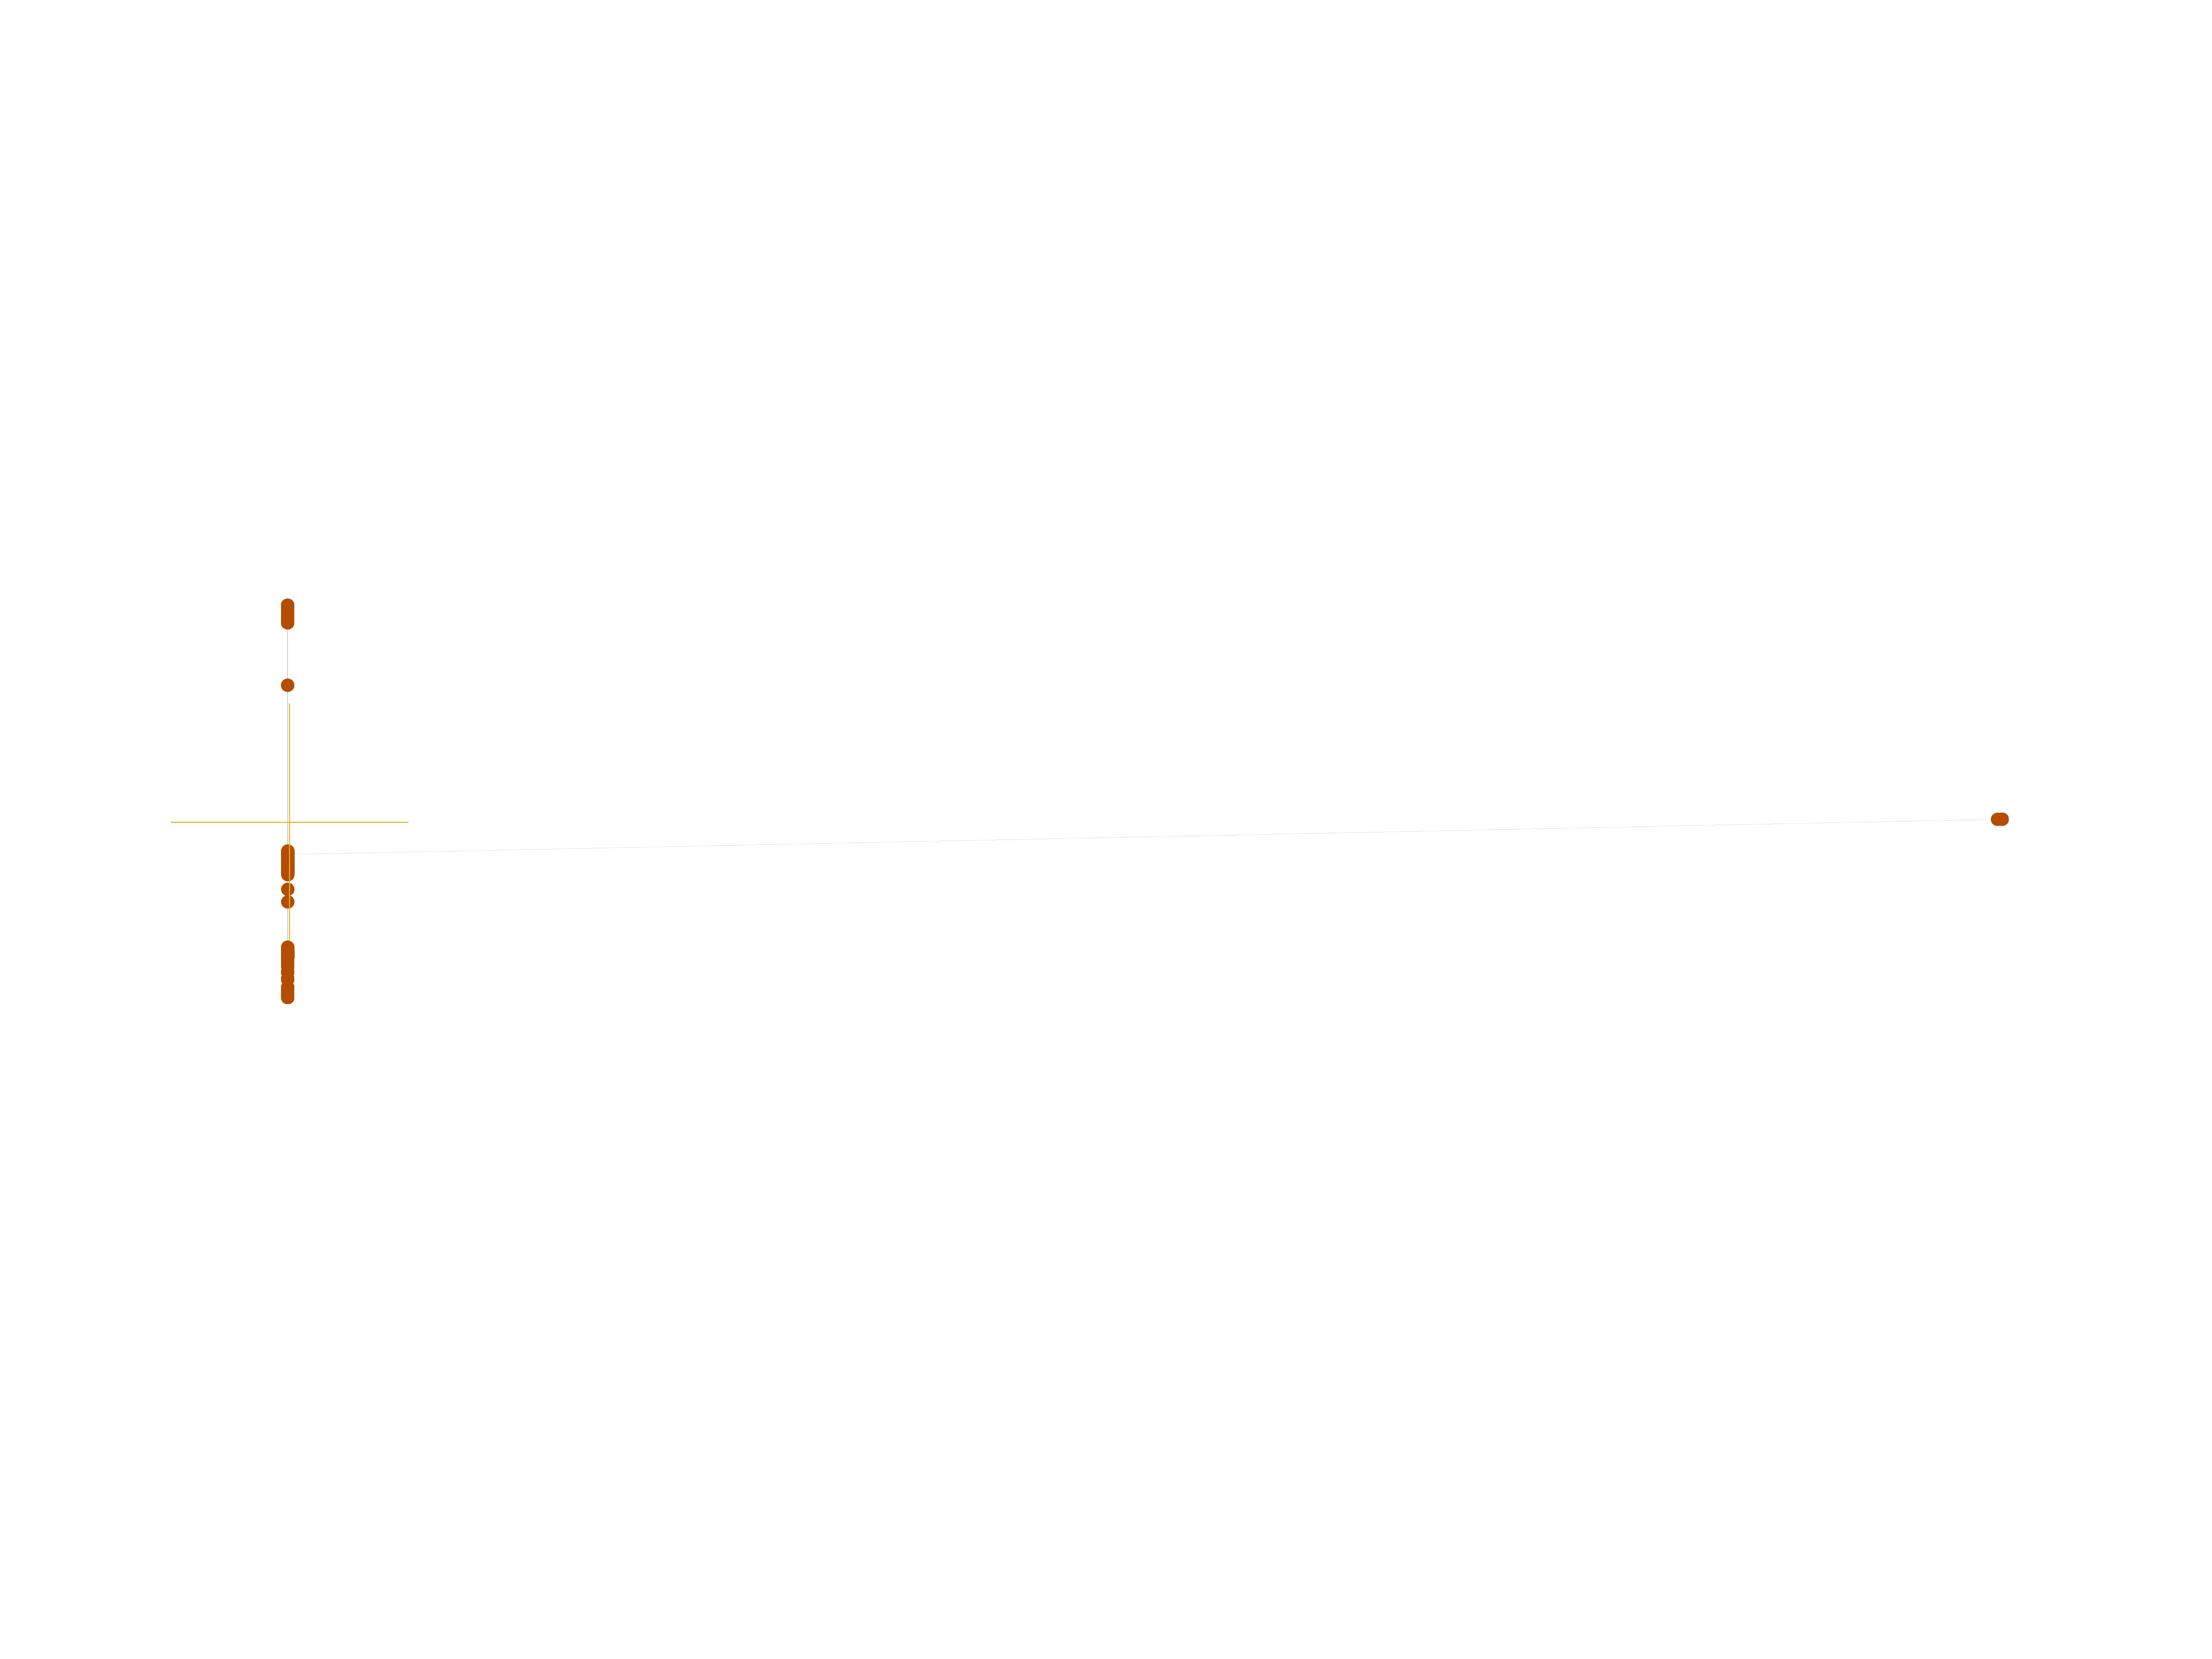
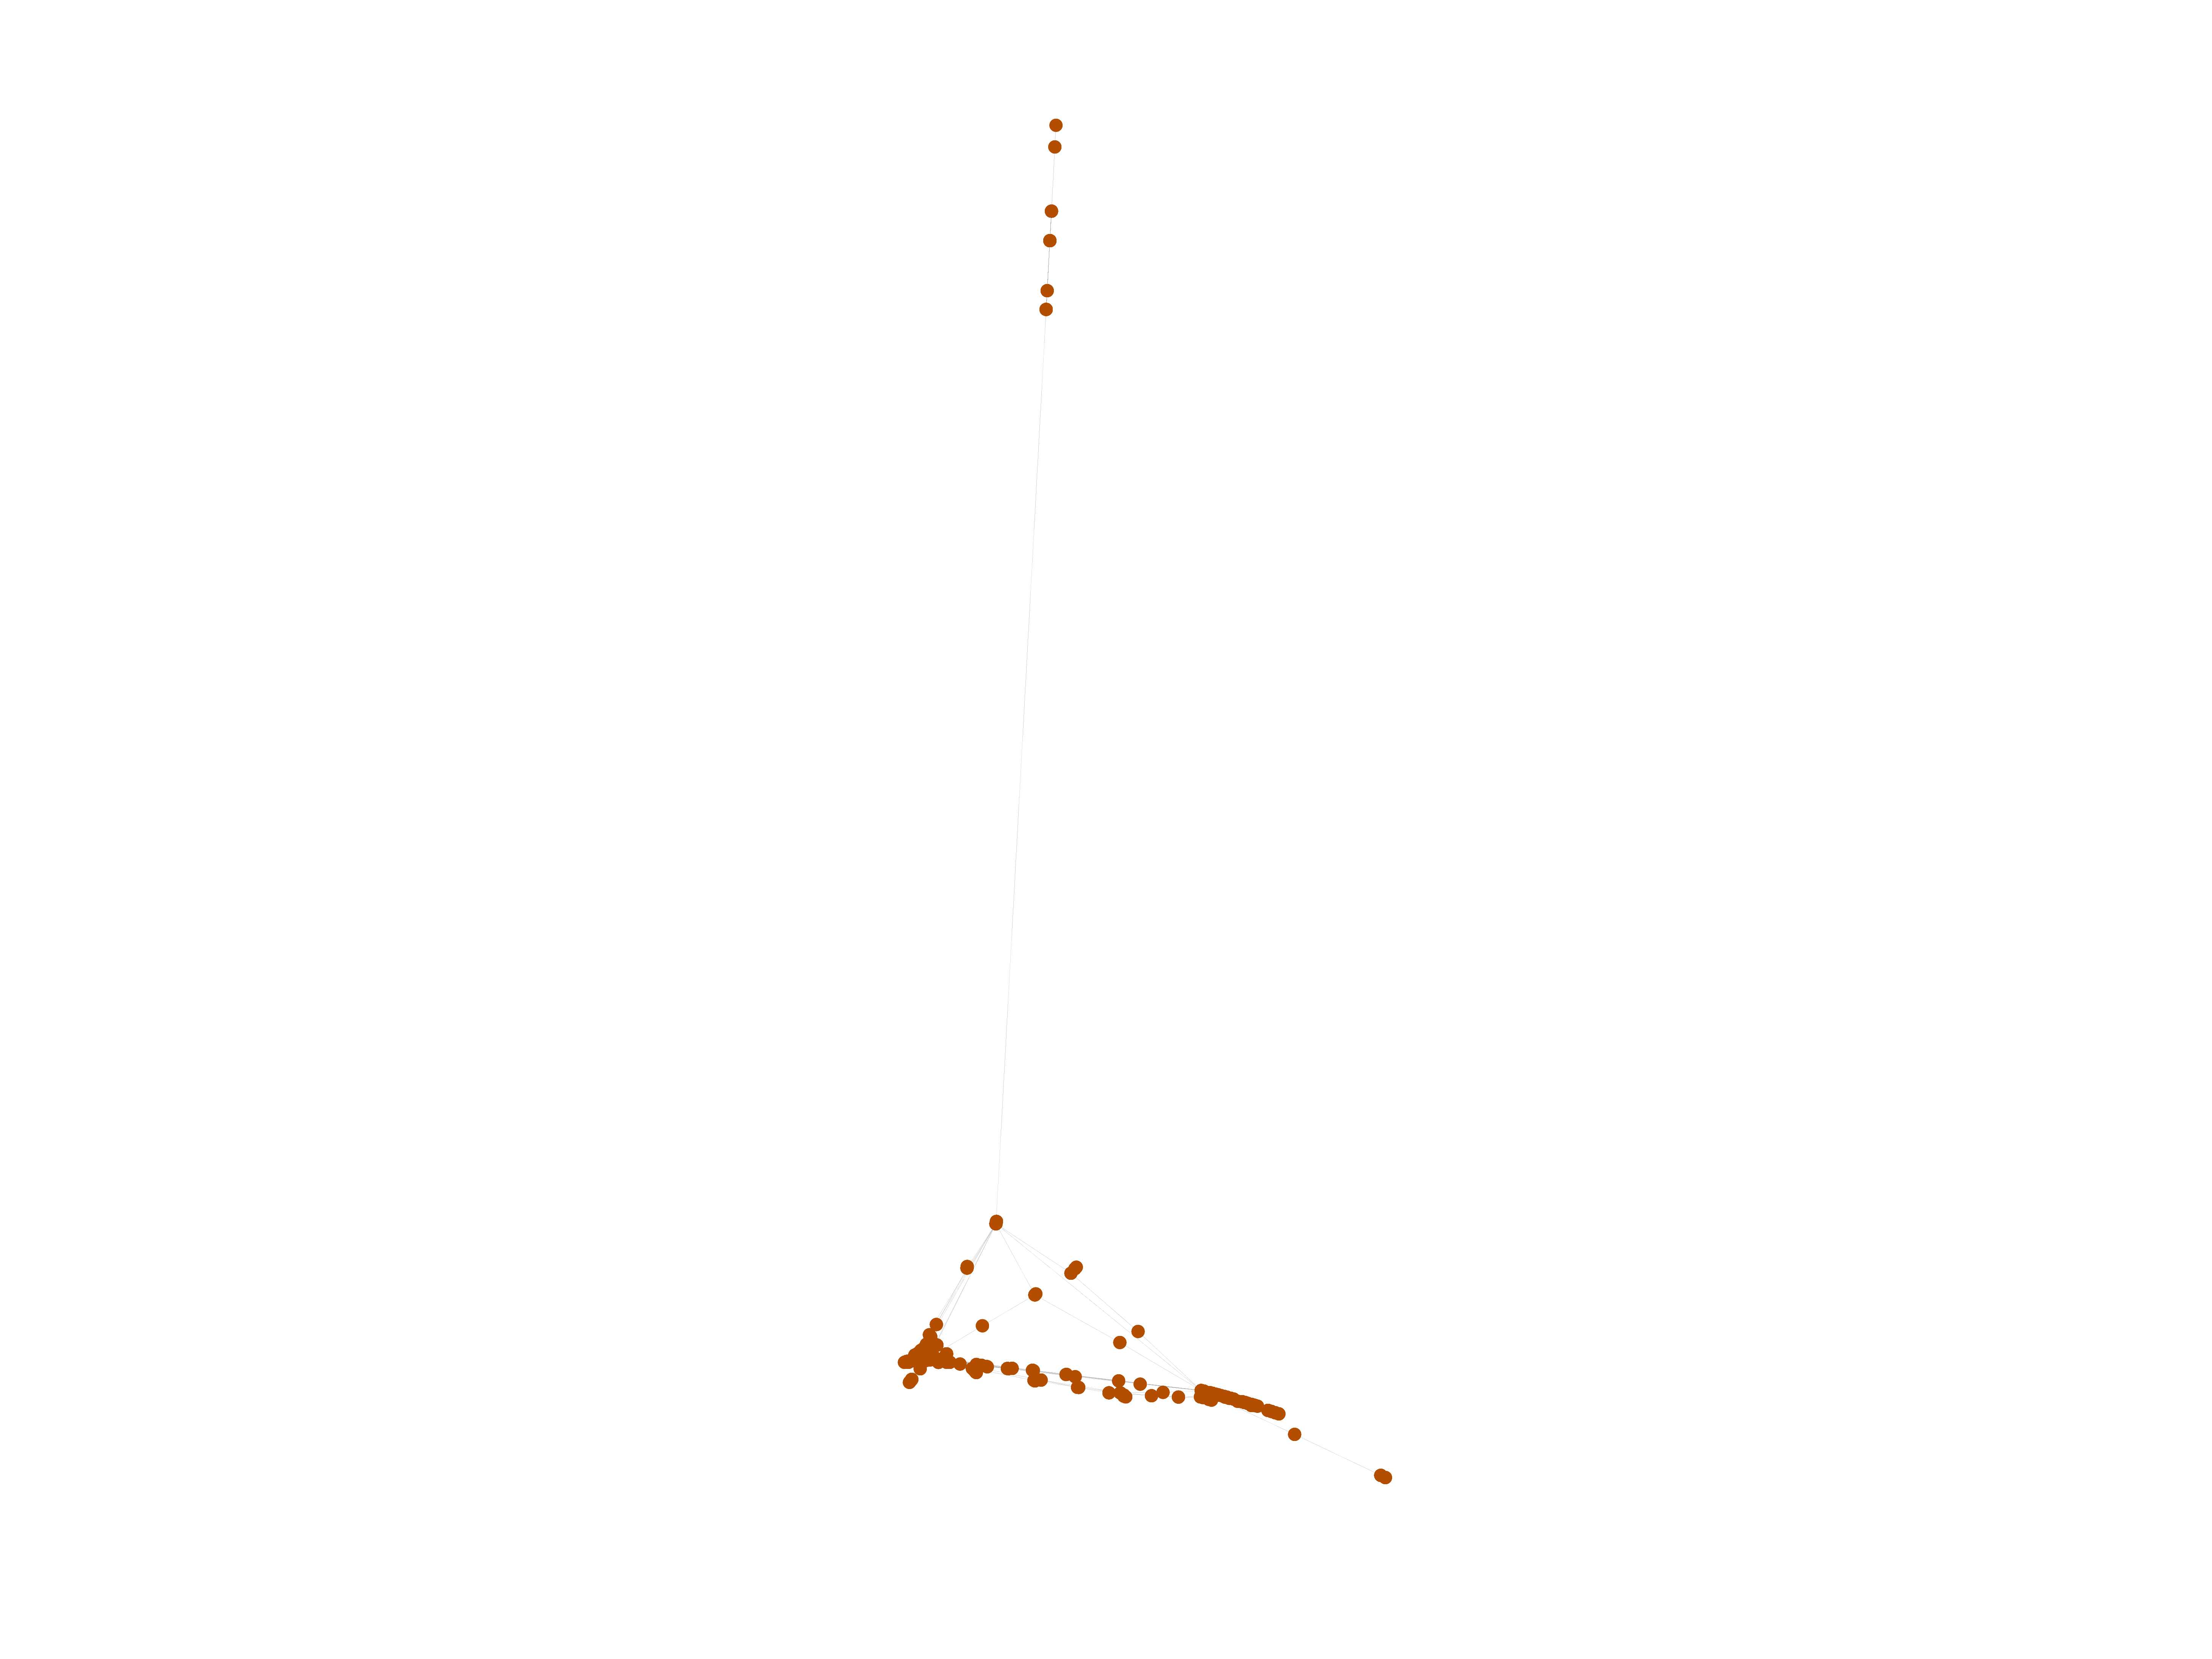
This is the bipartite edit network of the Swati Wiktionary. It contains users
and pages from the Swati Wiktionary, connected by edit events. Each edge
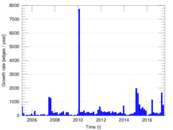
represents an edit. The dataset includes the timestamp of each edit.
Metadata
Statistics
| Size | n = | 1,540
|
| Left size | n1 = | 231
|
| Right size | n2 = | 1,309
|
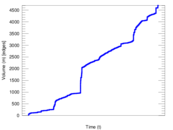
| Volume | m = | 4,703
|
| Unique edge count | m̿ = | 2,776
|
| Wedge count | s = | 329,959
|
| Claw count | z = | 44,574,233
|
| Cross count | x = | 5,271,041,510
|
| Square count | q = | 127,193
|
| 4-Tour count | T4 = | 2,345,436
|
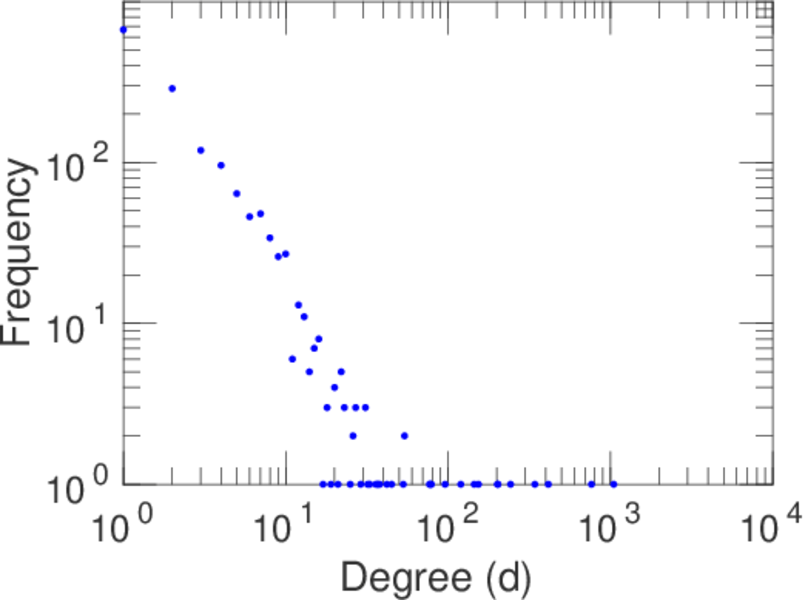
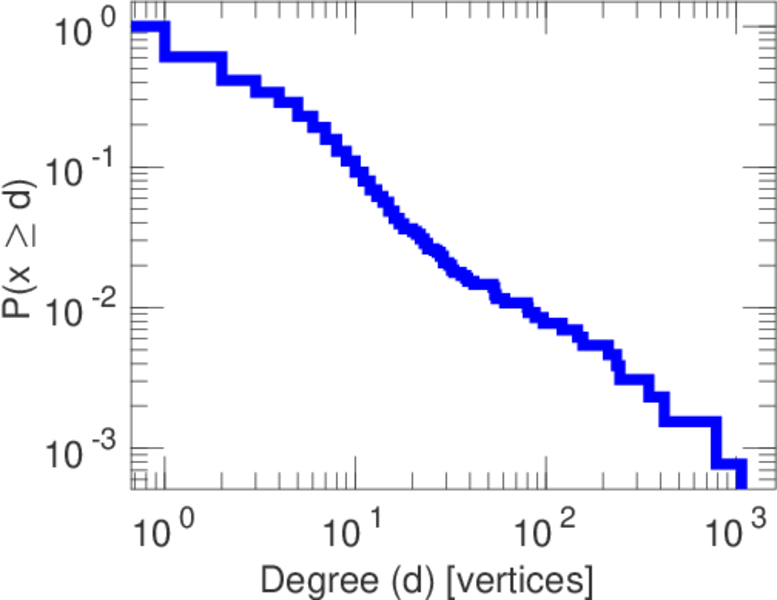
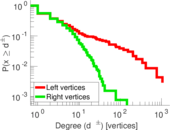
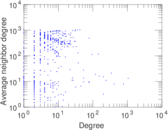
| Maximum degree | dmax = | 1,050
|
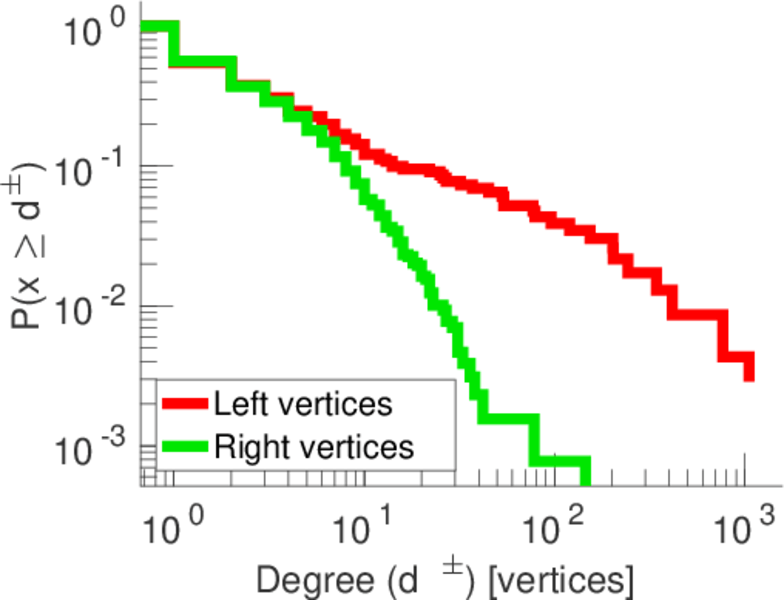
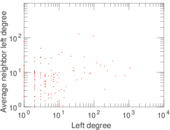
| Maximum left degree | d1max = | 1,050
|
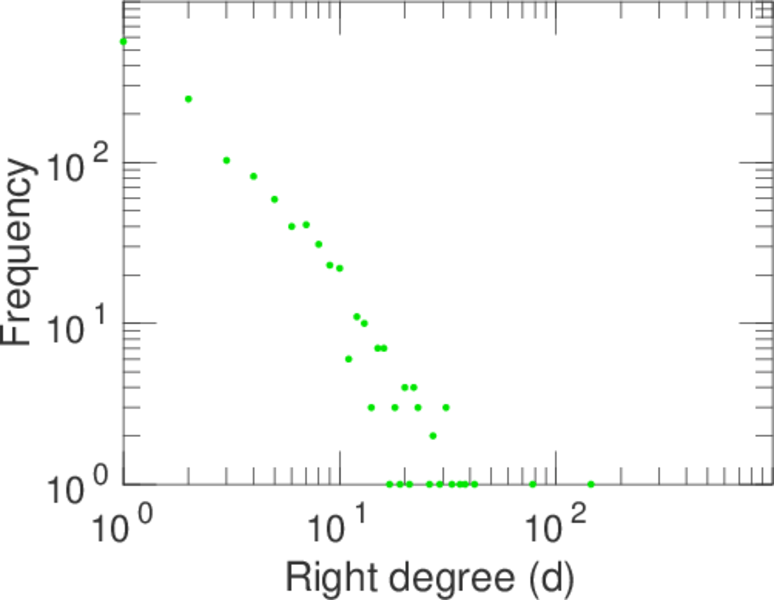
| Maximum right degree | d2max = | 145
|
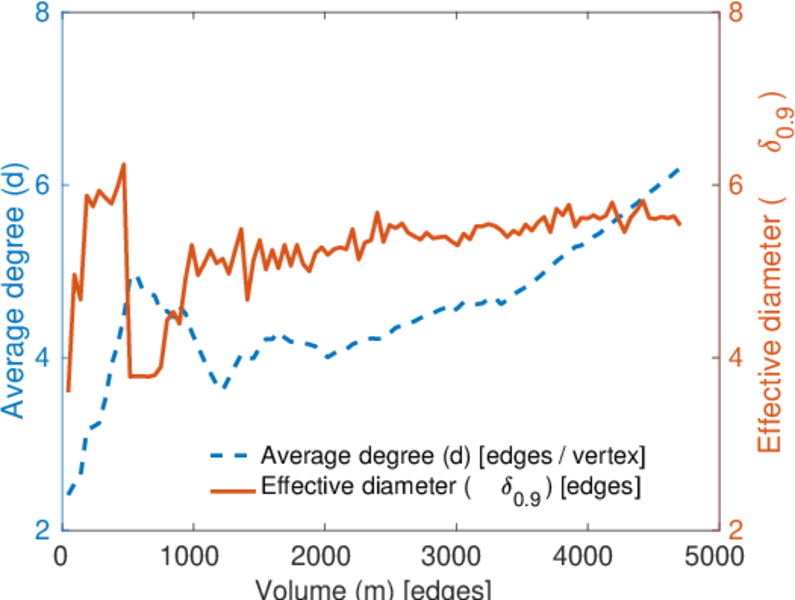
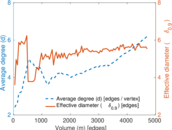
| Average degree | d = | 6.107 79
|
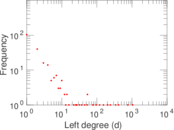
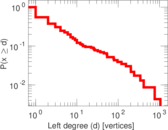
| Average left degree | d1 = | 20.359 3
|
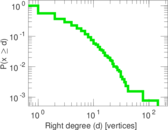
| Average right degree | d2 = | 3.592 82
|
| Fill | p = | 0.009 180 53
|
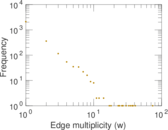
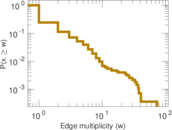
| Average edge multiplicity | m̃ = | 1.694 16
|
| Size of LCC | N = | 1,339
|
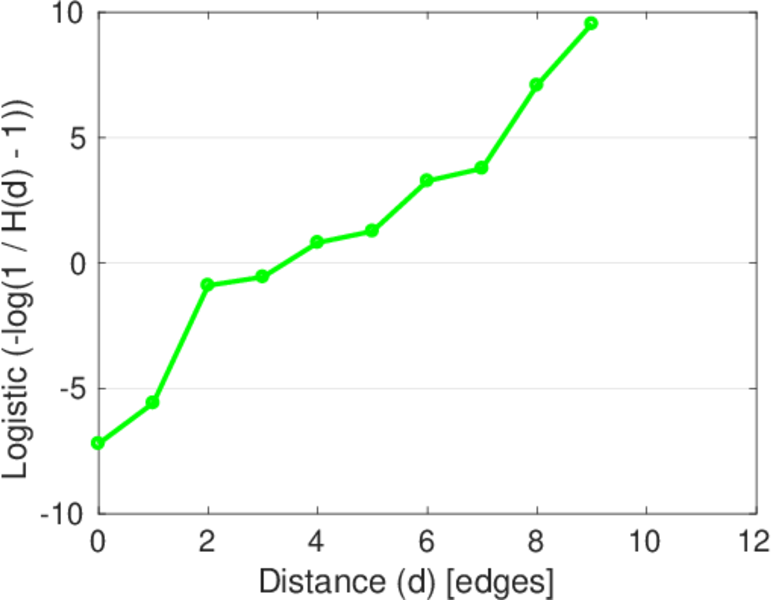
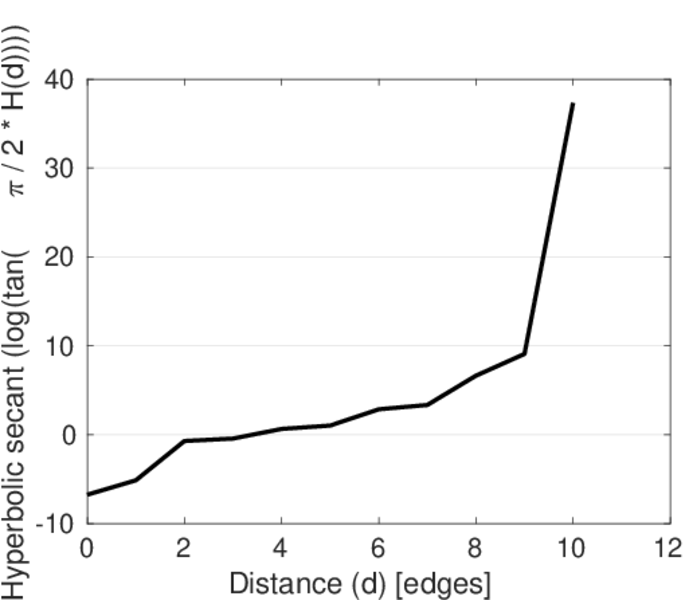
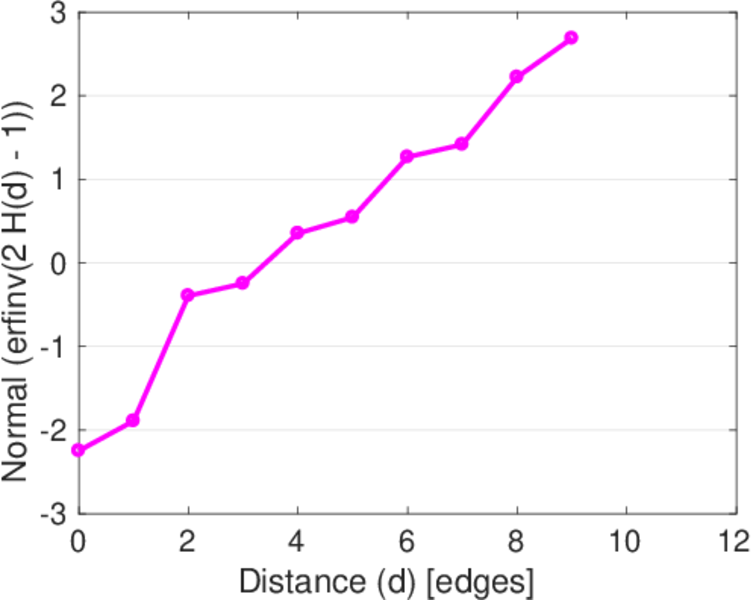
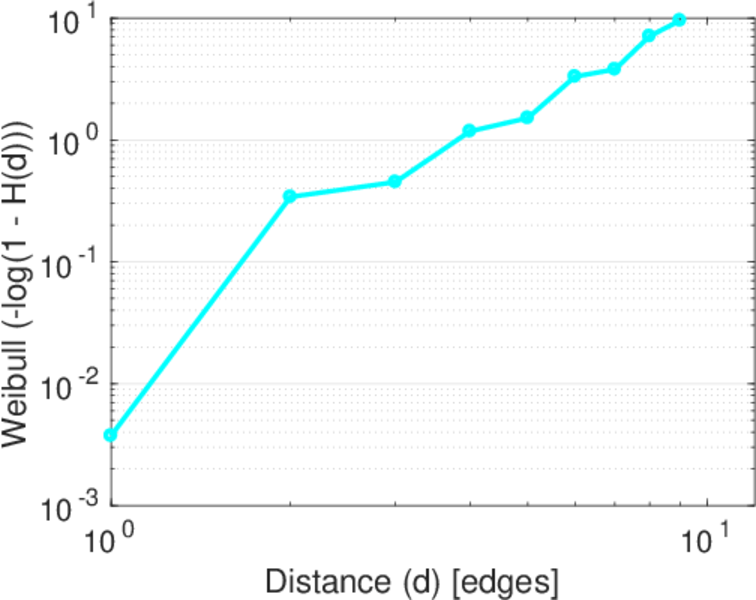
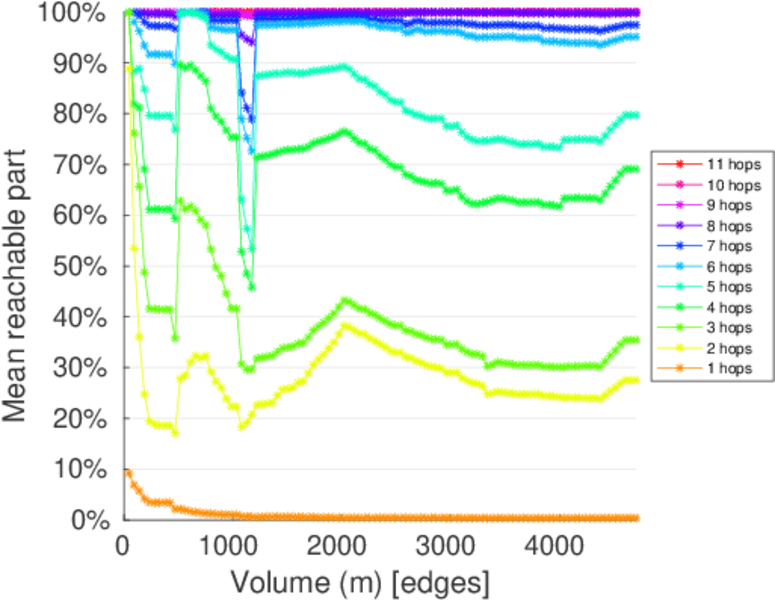
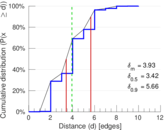
| Diameter | δ = | 11
|
| 50-Percentile effective diameter | δ0.5 = | 3.417 73
|
| 90-Percentile effective diameter | δ0.9 = | 5.656 30
|
| Median distance | δM = | 4
|
| Mean distance | δm = | 3.933 98
|
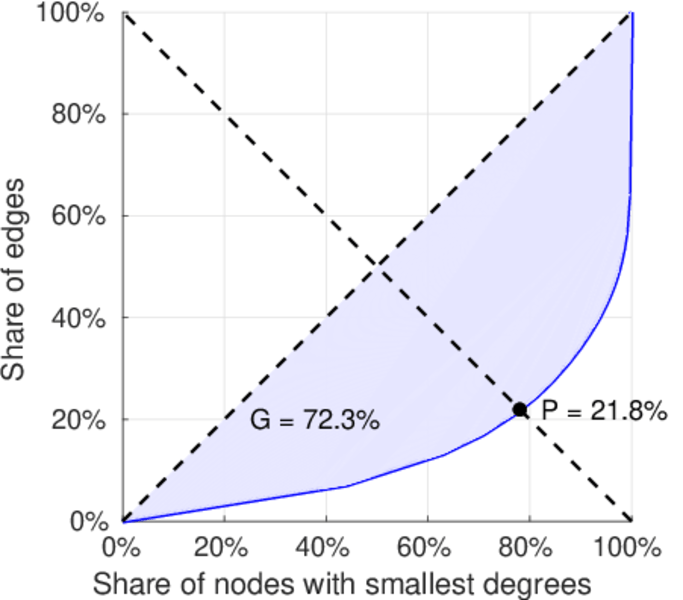
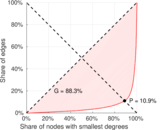
| Gini coefficient | G = | 0.732 677
|
| Balanced inequality ratio | P = | 0.213 906
|
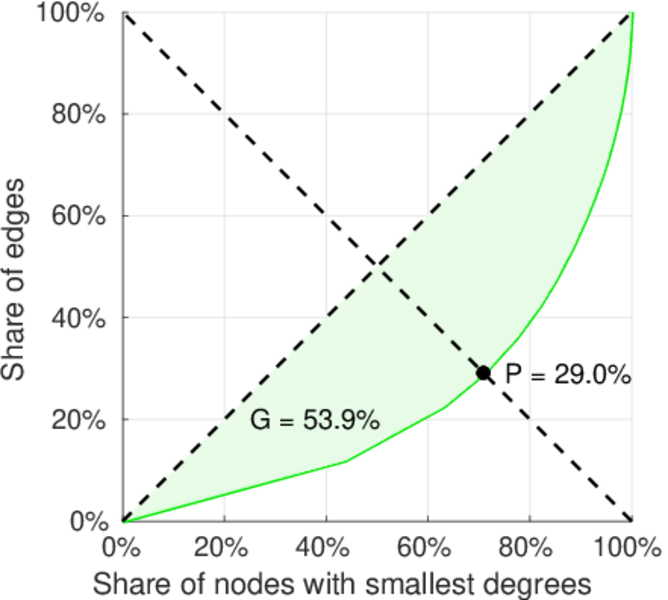
| Left balanced inequality ratio | P1 = | 0.108 654
|
| Right balanced inequality ratio | P2 = | 0.289 815
|
| Relative edge distribution entropy | Her = | 0.792 558
|
| Power law exponent | γ = | 2.741 89
|
| Tail power law exponent | γt = | 2.361 00
|
| Tail power law exponent with p | γ3 = | 2.361 00
|
| p-value | p = | 0.000 00
|
| Left tail power law exponent with p | γ3,1 = | 1.791 00
|
| Left p-value | p1 = | 0.780 000
|
| Right tail power law exponent with p | γ3,2 = | 8.281 00
|
| Right p-value | p2 = | 0.677 000
|
| Degree assortativity | ρ = | −0.193 659
|
| Degree assortativity p-value | pρ = | 7.307 35 × 10−25
|
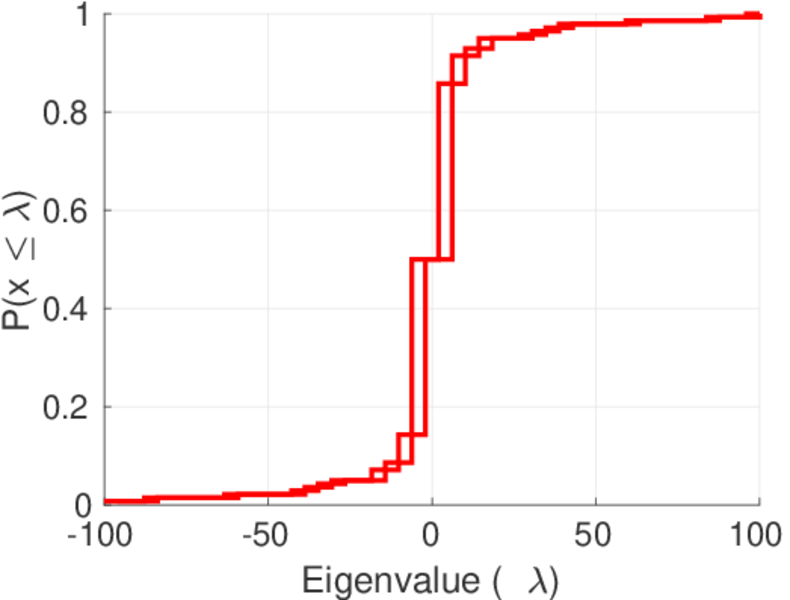
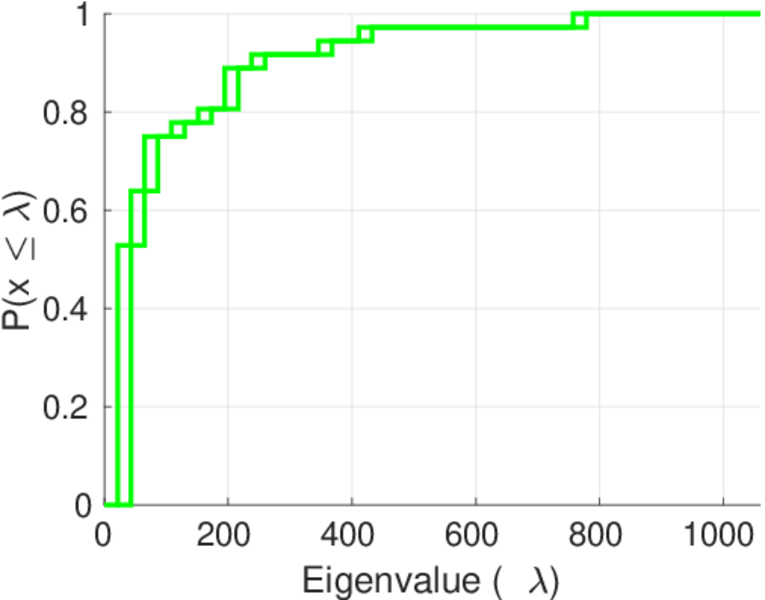
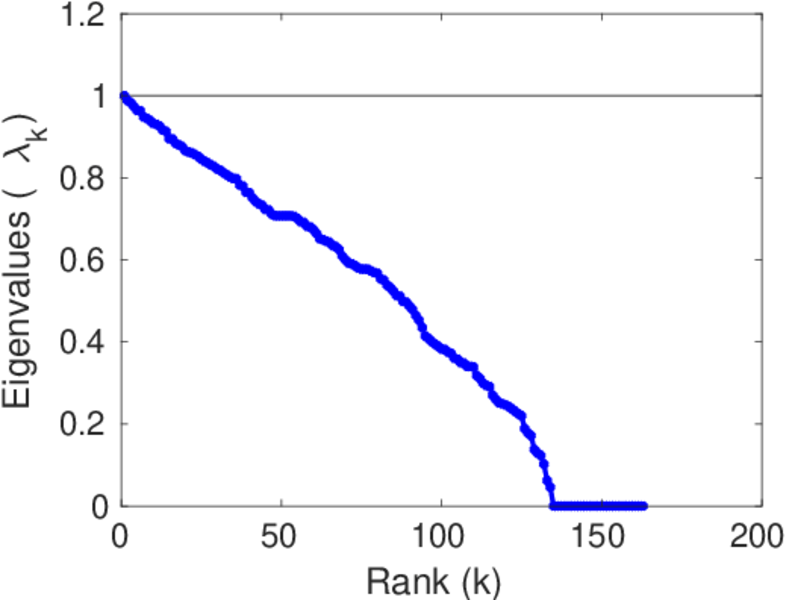
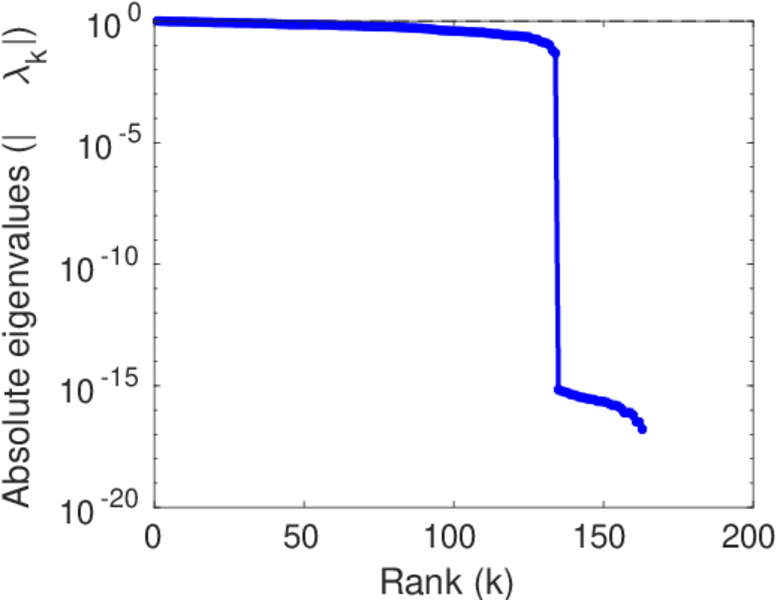
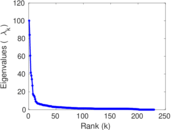
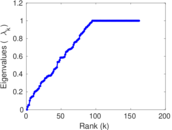
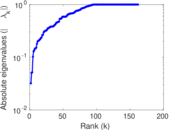
| Spectral norm | α = | 100.094
|
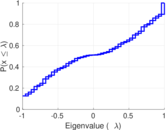
| Algebraic connectivity | a = | 0.031 991 9
|
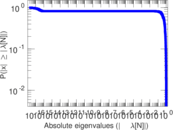
| Spectral separation | |λ1[A] / λ2[A]| = | 1.190 28
|
| Controllability | C = | 1,108
|
| Relative controllability | Cr = | 0.729 908
|
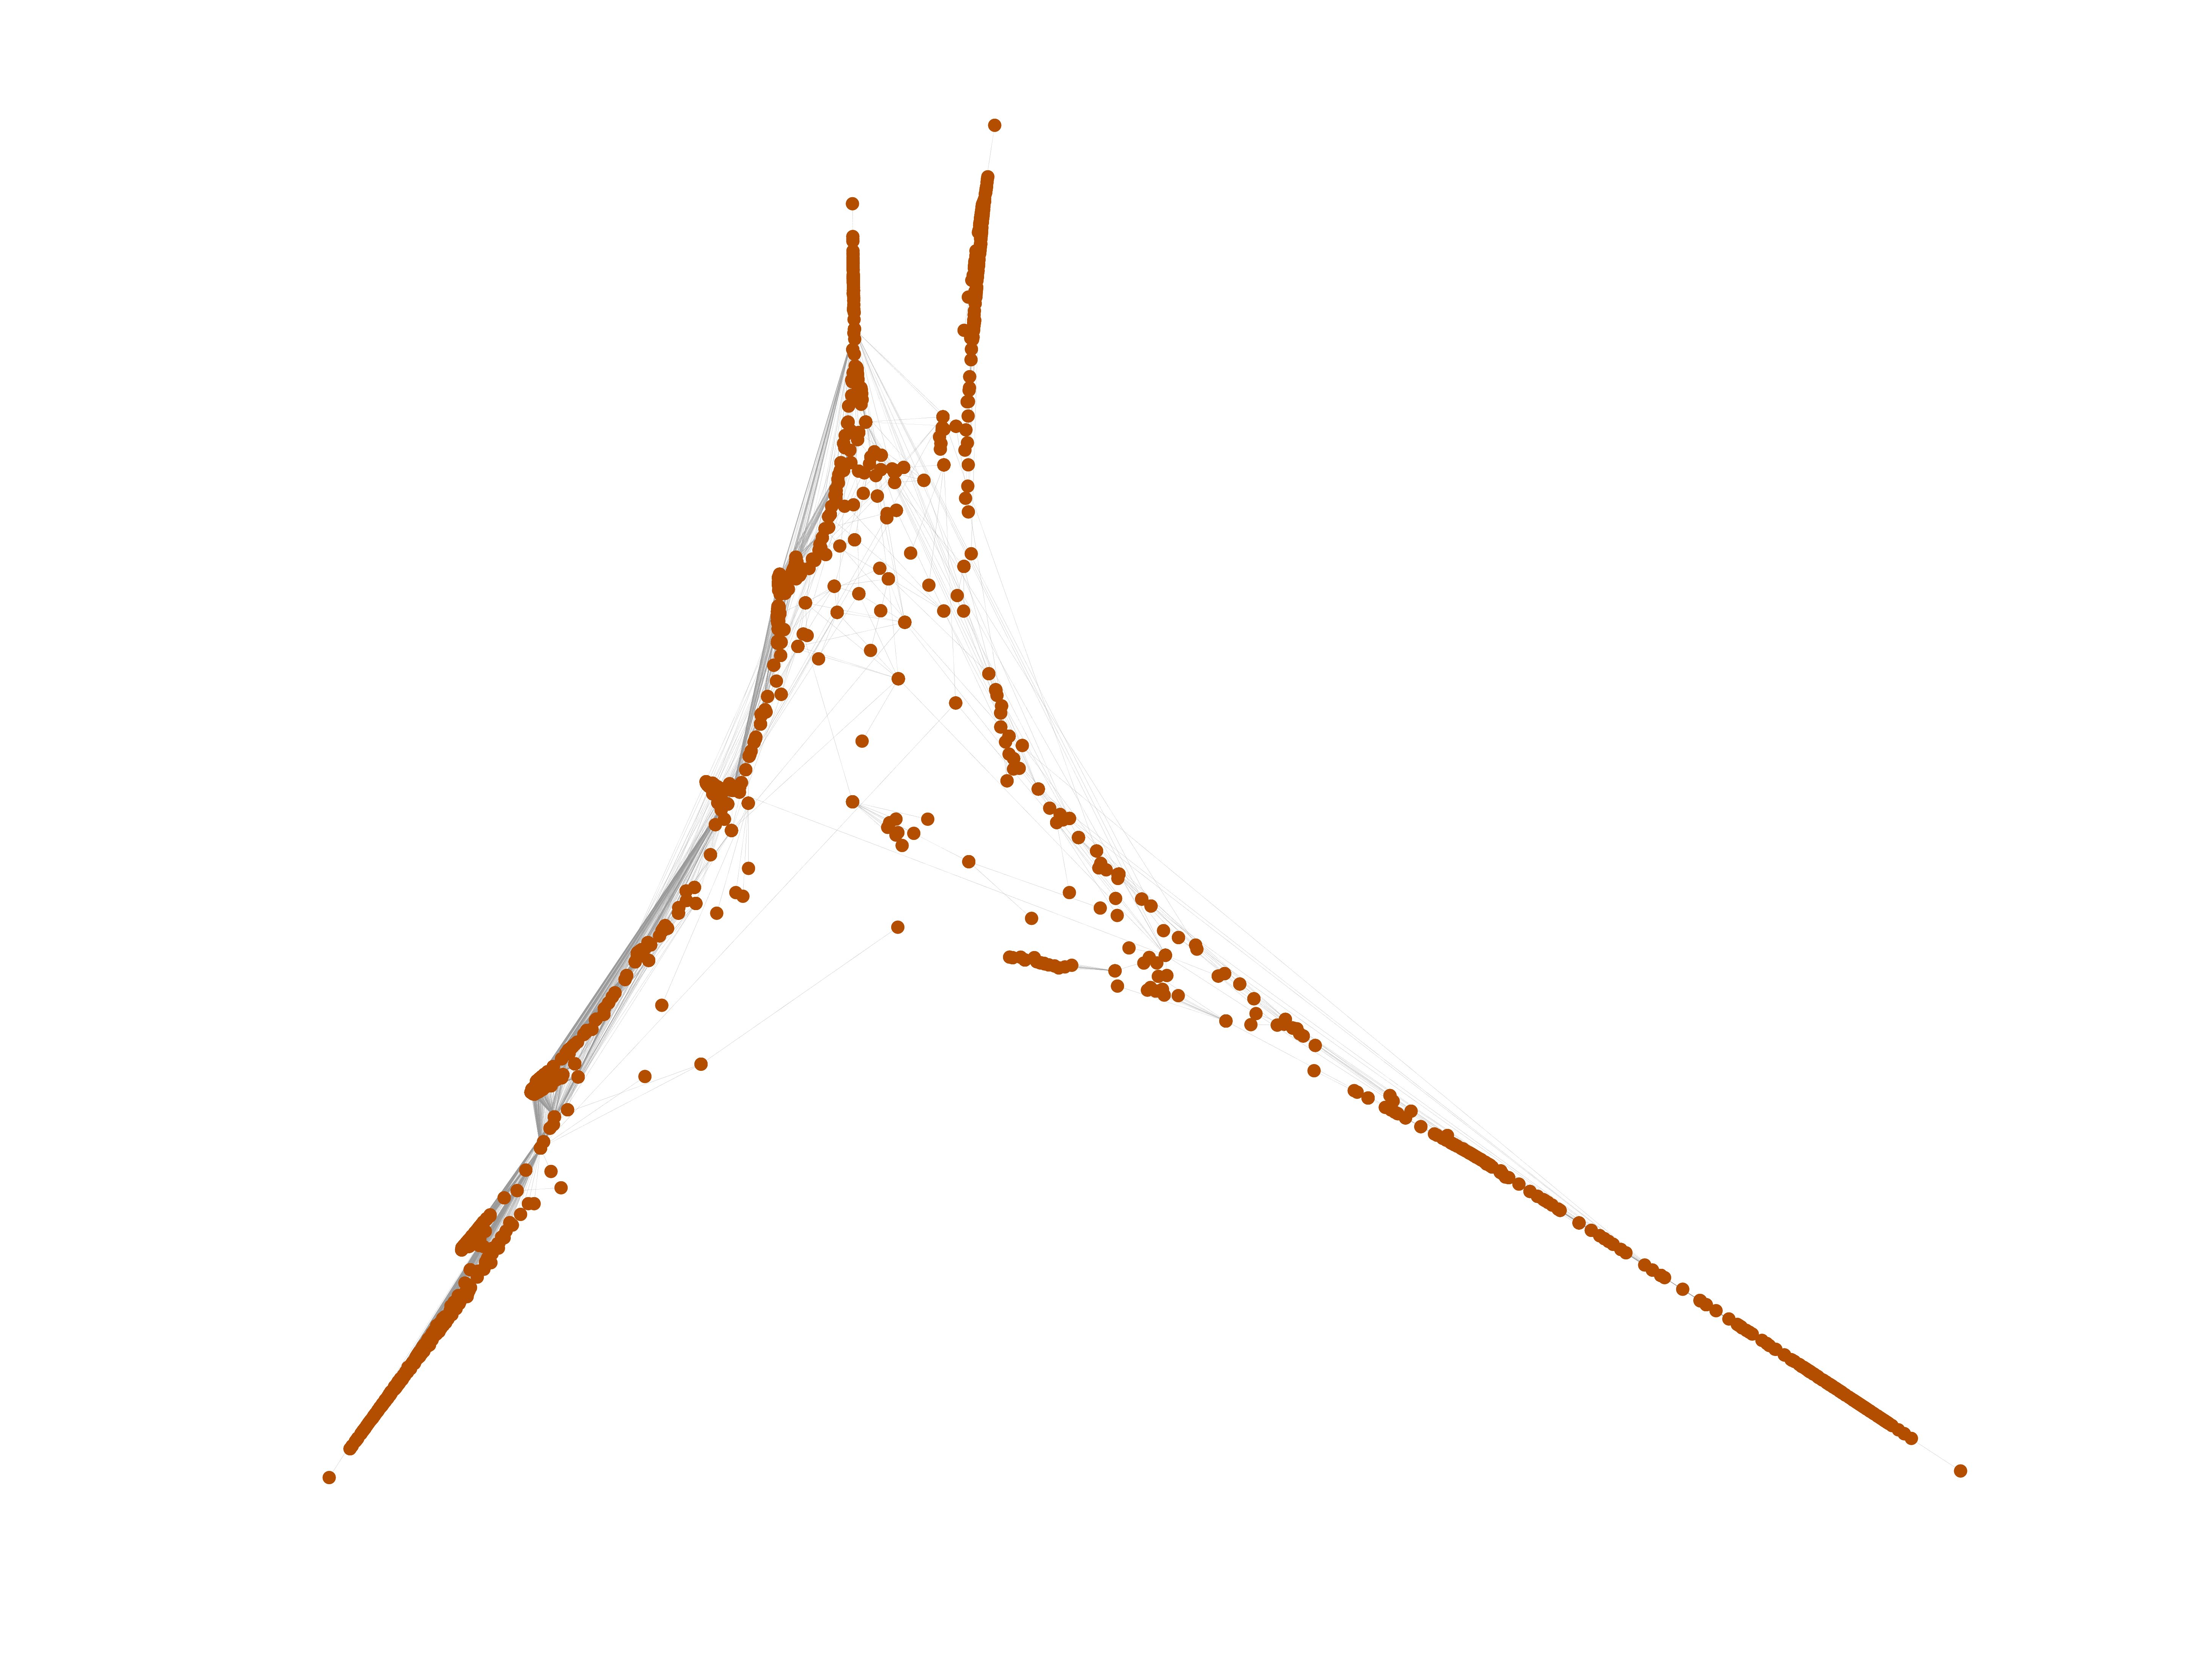
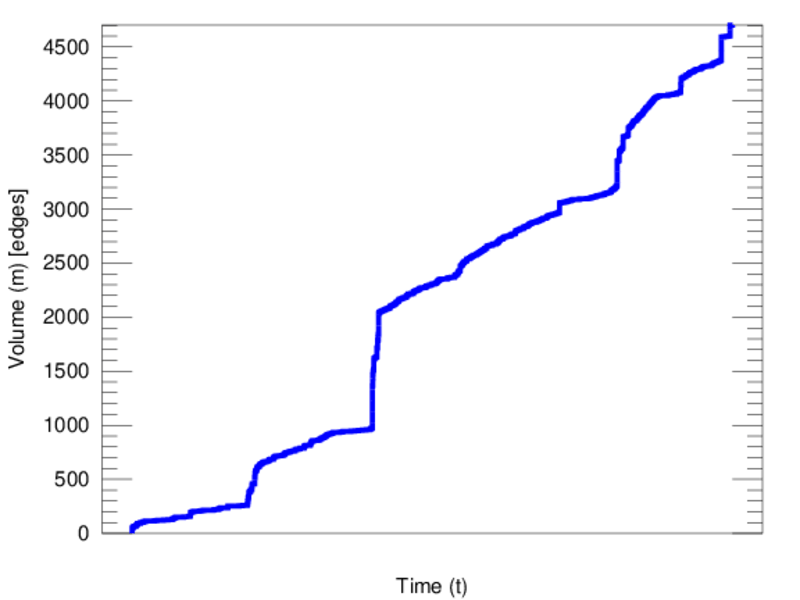
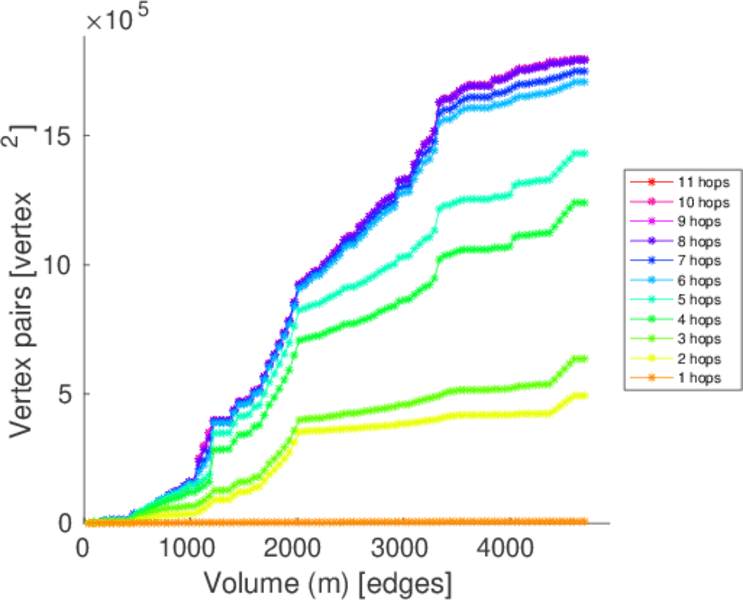
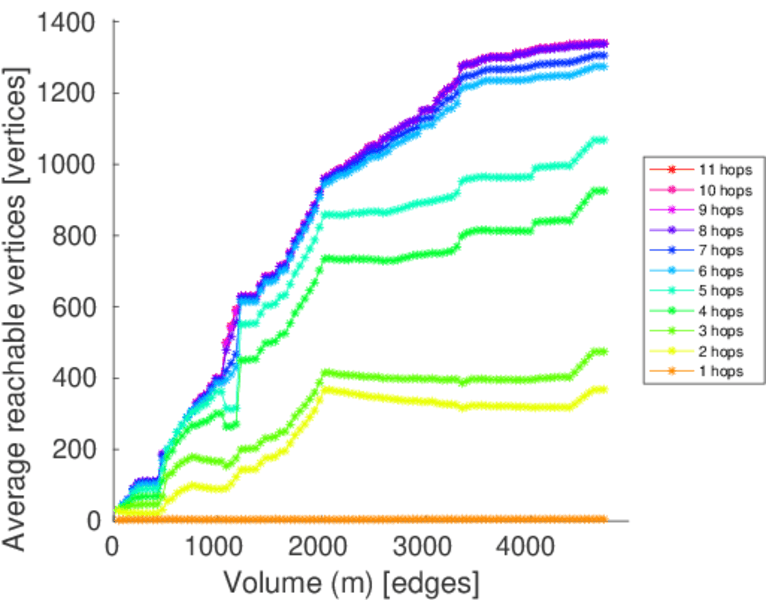
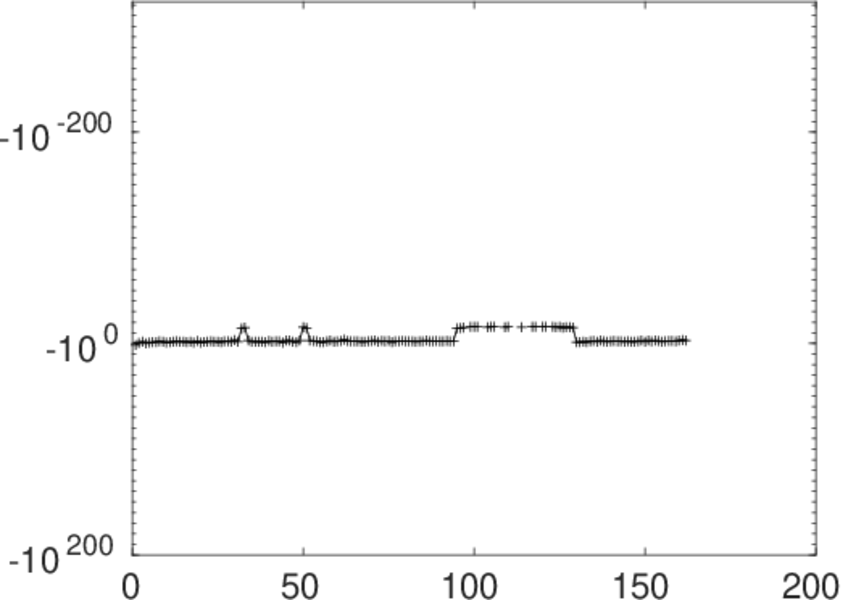
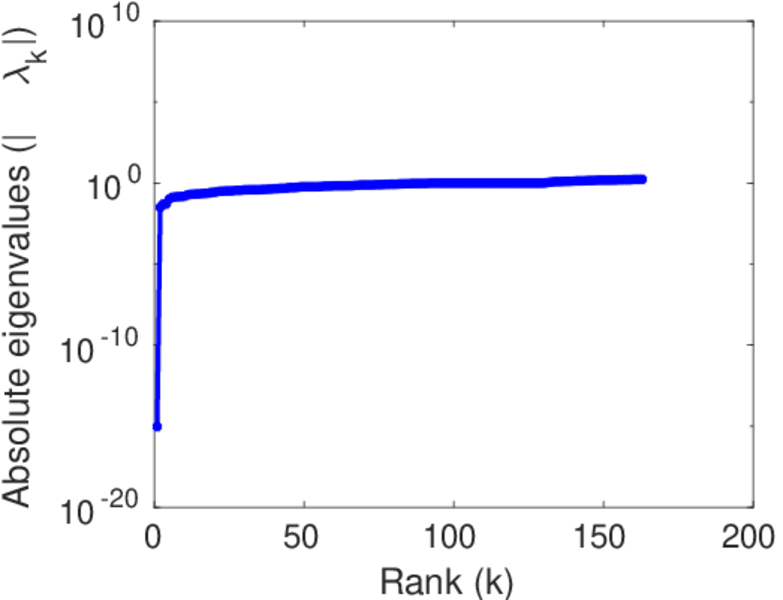
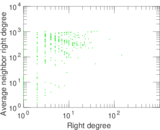
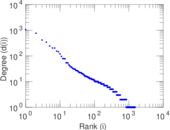
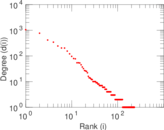
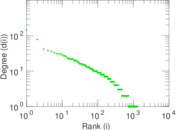
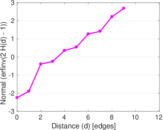
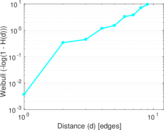
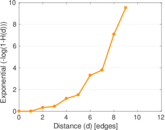
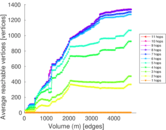
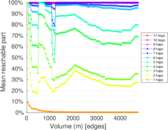
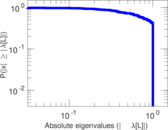
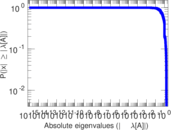
Plots


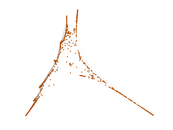
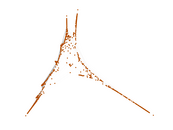

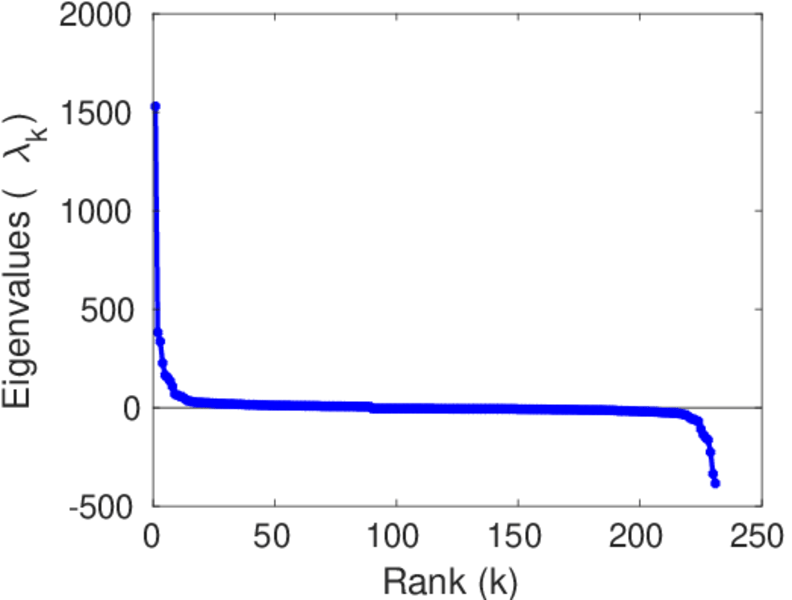
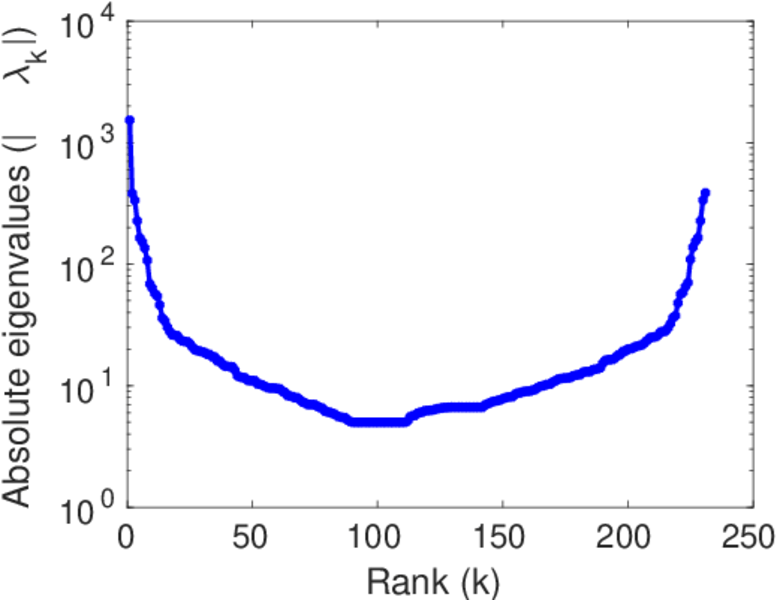
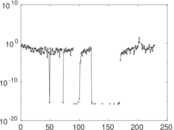
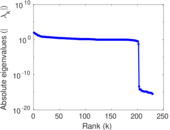
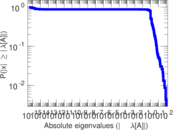
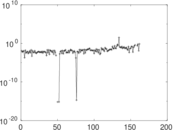
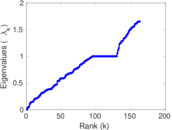
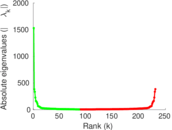
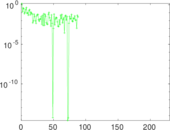
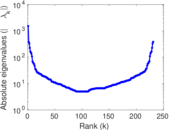
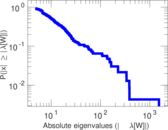
Matrix decompositions plots


Downloads
References
|
[1]
|
Jérôme Kunegis.
KONECT – The Koblenz Network Collection.
In Proc. Int. Conf. on World Wide Web Companion, pages
1343–1350, 2013.
[ http ]
|
|
[2]
|
Wikimedia Foundation.
Wikimedia downloads.
http://dumps.wikimedia.org/, January 2010.
|
 KONECT ‣ Networks ‣
Buy Me a Coffee
KONECT ‣ Networks ‣
Buy Me a Coffee