Wikipedia edits (stq)
This is the bipartite edit network of the Saterland Frisian Wikipedia. It
contains users and pages from the Saterland Frisian Wikipedia, connected by
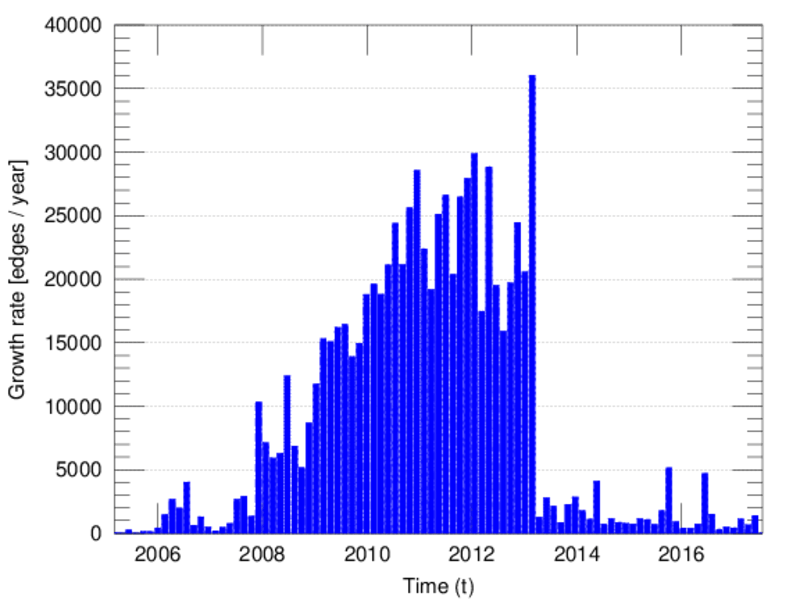
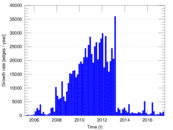
edit events. Each edge represents an edit. The dataset includes the timestamp
of each edit.
Metadata
Statistics
| Size | n = | 10,580
|
| Left size | n1 = | 1,016
|
| Right size | n2 = | 9,564
|
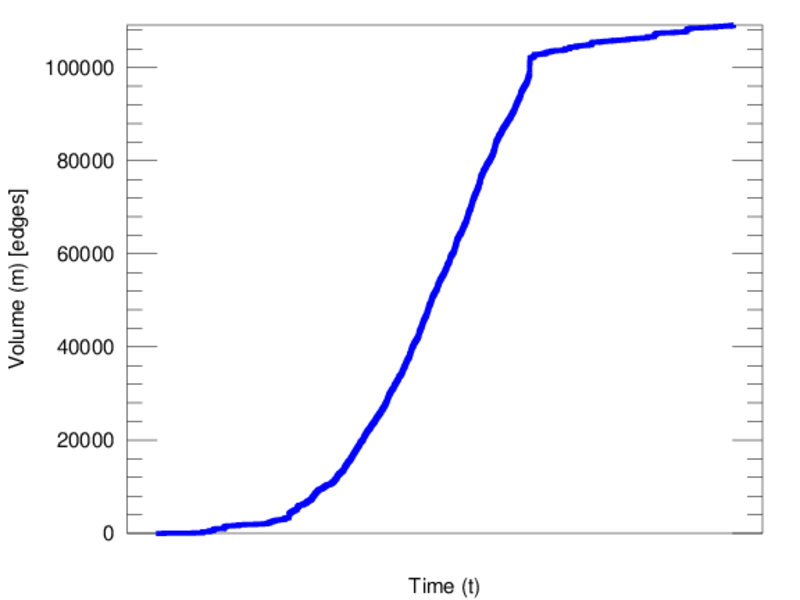
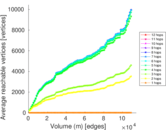
| Volume | m = | 109,121
|
| Unique edge count | m̿ = | 50,159
|
| Wedge count | s = | 35,694,985
|
| Claw count | z = | 29,201,215,715
|
| Cross count | x = | 22,752,027,402,748
|
| Square count | q = | 74,091,545
|
| 4-Tour count | T4 = | 735,654,614
|
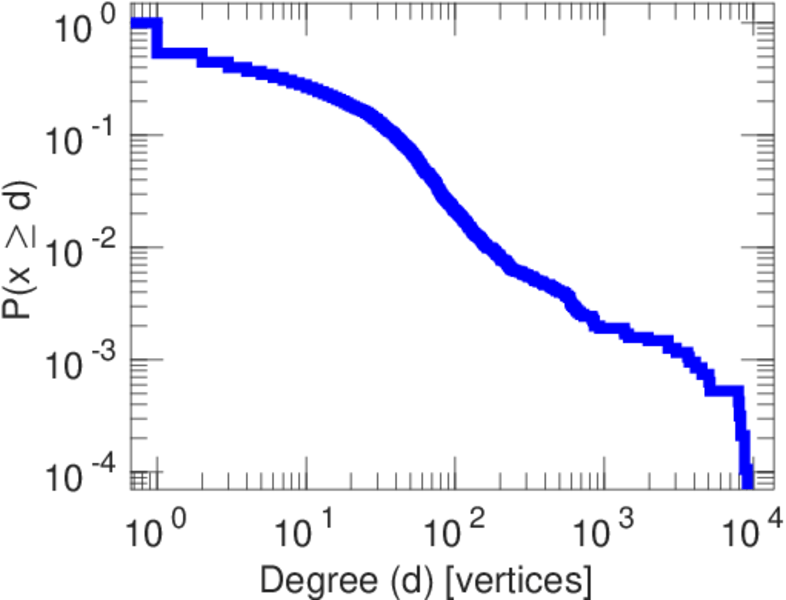
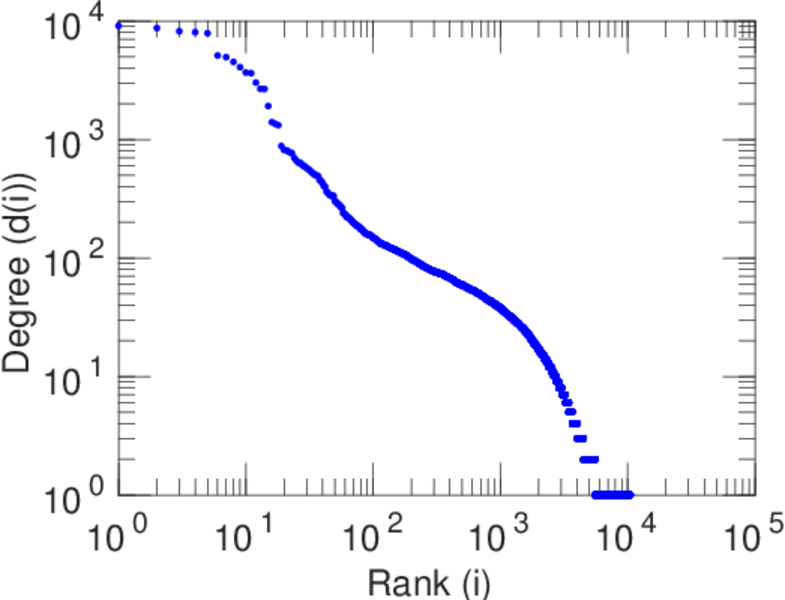
| Maximum degree | dmax = | 9,100
|
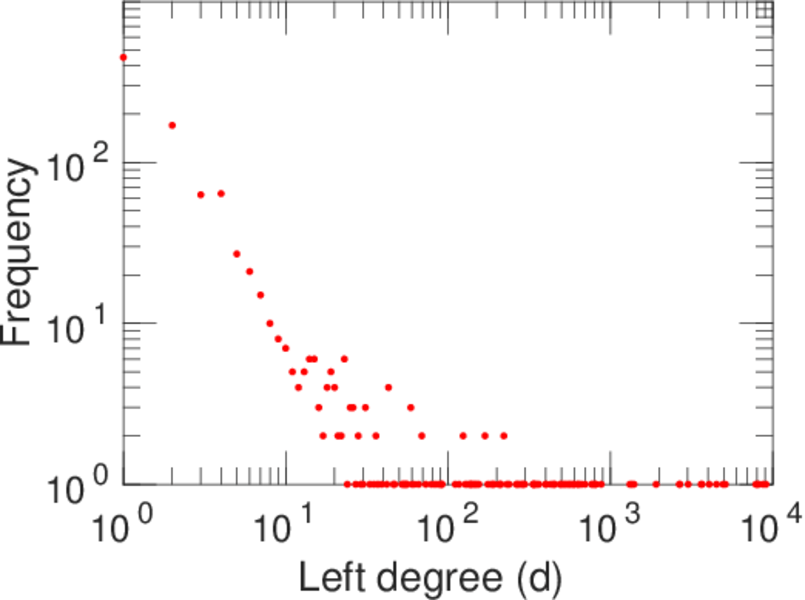
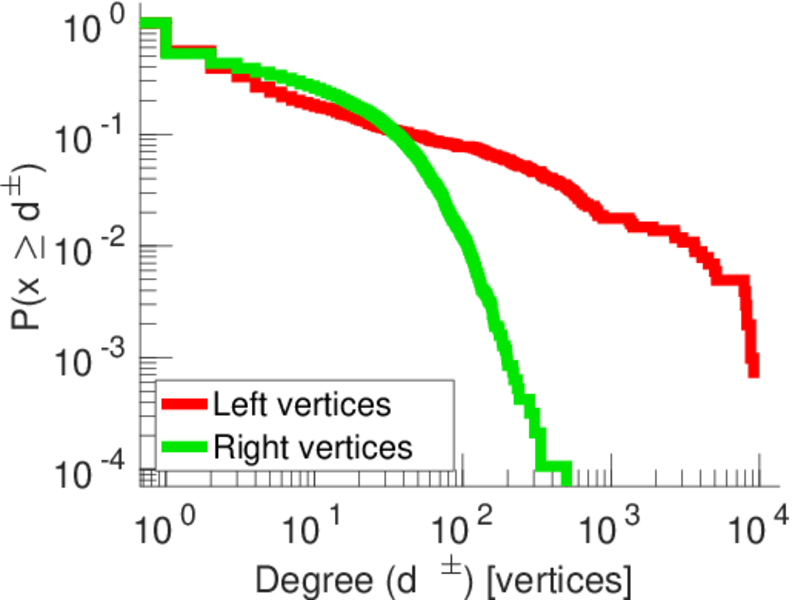
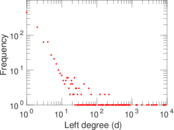
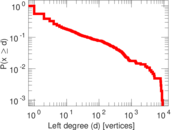
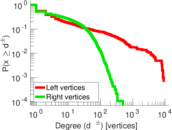
| Maximum left degree | d1max = | 9,100
|
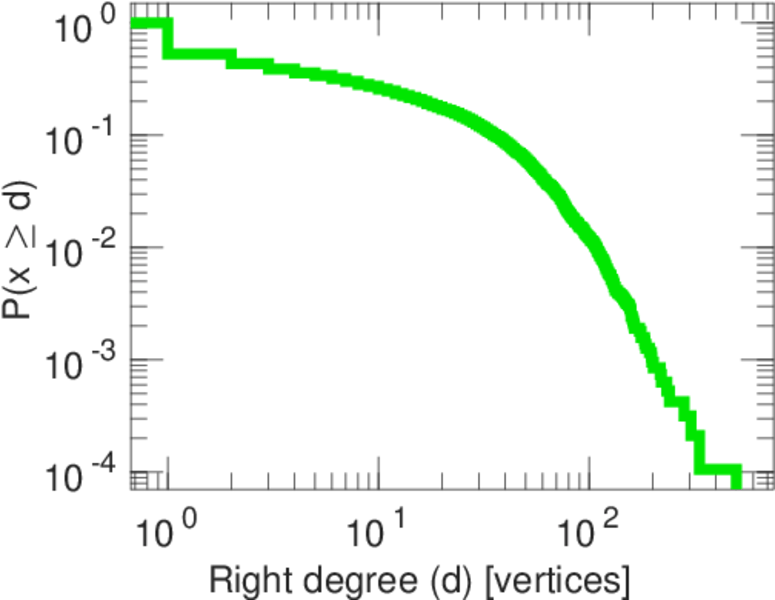
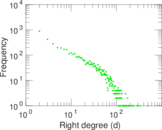
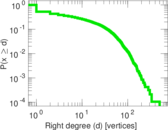
| Maximum right degree | d2max = | 499
|
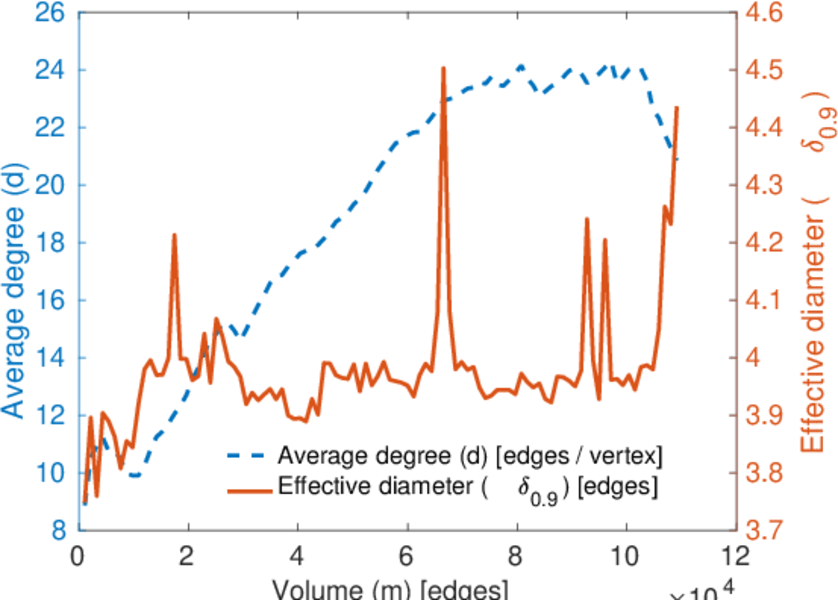
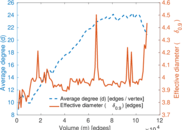
| Average degree | d = | 20.627 8
|
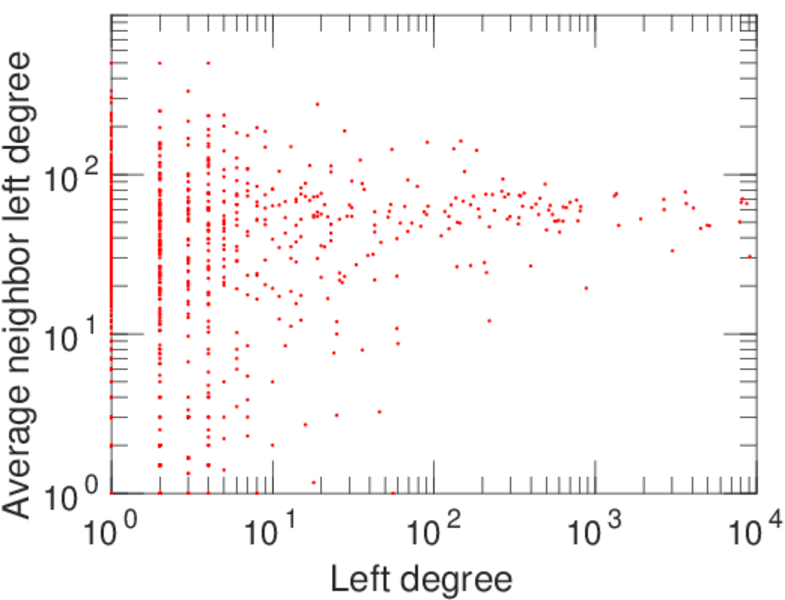
| Average left degree | d1 = | 107.403
|
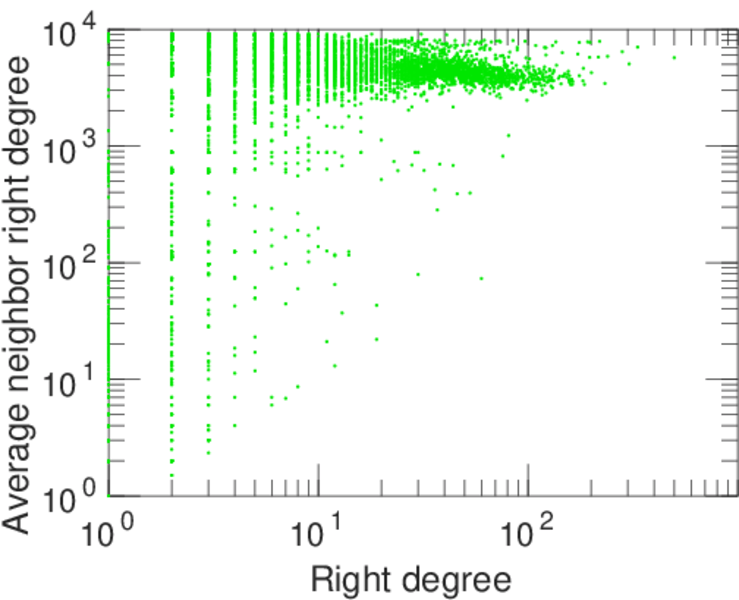
| Average right degree | d2 = | 11.409 6
|
| Fill | p = | 0.005 161 97
|
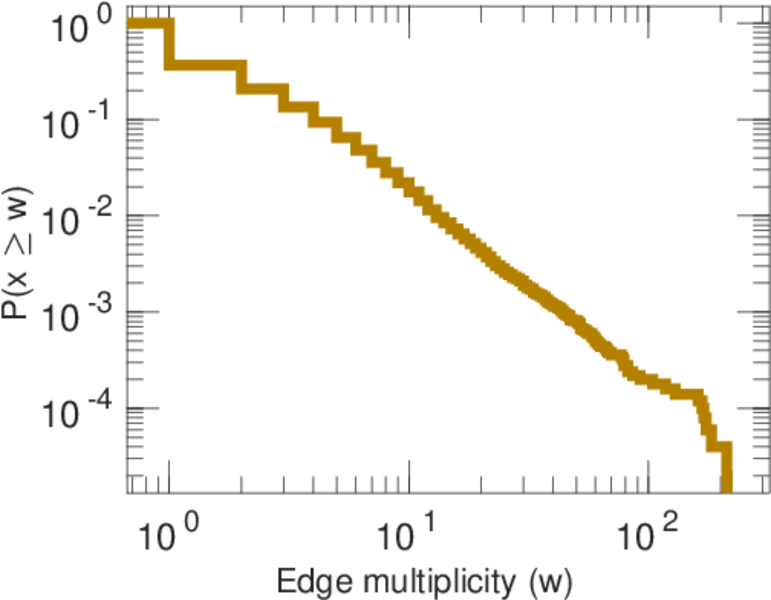
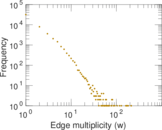
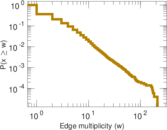
| Average edge multiplicity | m̃ = | 2.175 50
|
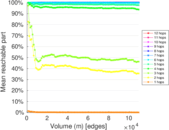
| Size of LCC | N = | 9,941
|
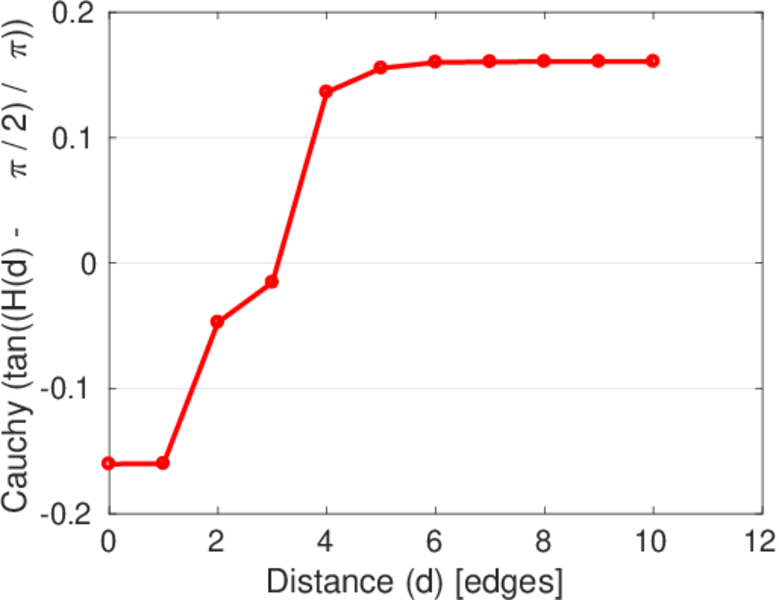
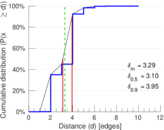
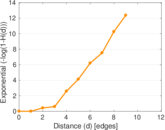
| Diameter | δ = | 12
|
| 50-Percentile effective diameter | δ0.5 = | 3.103 72
|
| 90-Percentile effective diameter | δ0.9 = | 3.947 30
|
| Median distance | δM = | 4
|
| Mean distance | δm = | 3.290 98
|
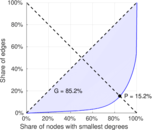
| Gini coefficient | G = | 0.854 460
|
| Balanced inequality ratio | P = | 0.152 798
|
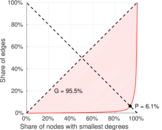
| Left balanced inequality ratio | P1 = | 0.060 648 3
|
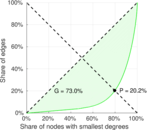
| Right balanced inequality ratio | P2 = | 0.202 069
|
| Relative edge distribution entropy | Her = | 0.757 305
|
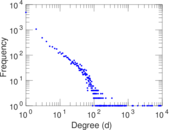
| Power law exponent | γ = | 2.124 23
|
| Tail power law exponent | γt = | 1.741 00
|
| Tail power law exponent with p | γ3 = | 1.741 00
|
| p-value | p = | 0.000 00
|
| Left tail power law exponent with p | γ3,1 = | 1.651 00
|
| Left p-value | p1 = | 0.000 00
|
| Right tail power law exponent with p | γ3,2 = | 8.911 00
|
| Right p-value | p2 = | 0.937 000
|
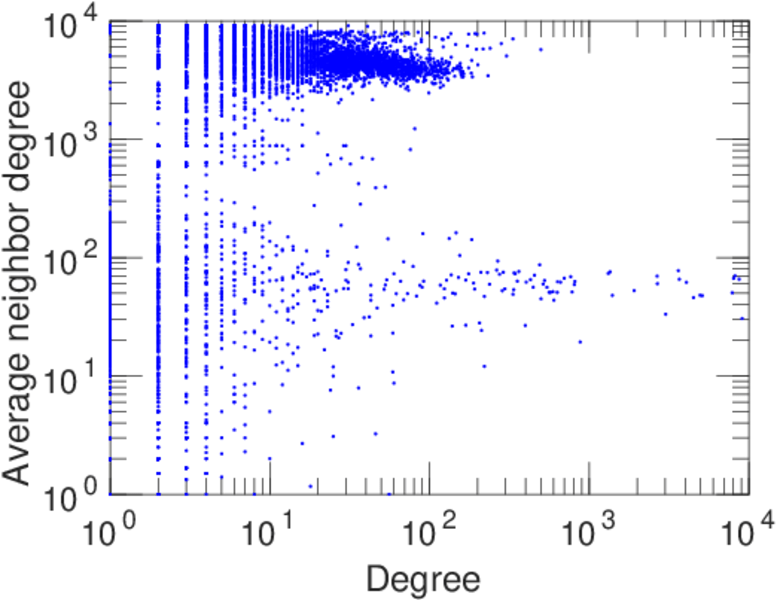
| Degree assortativity | ρ = | −0.355 414
|
| Degree assortativity p-value | pρ = | 0.000 00
|
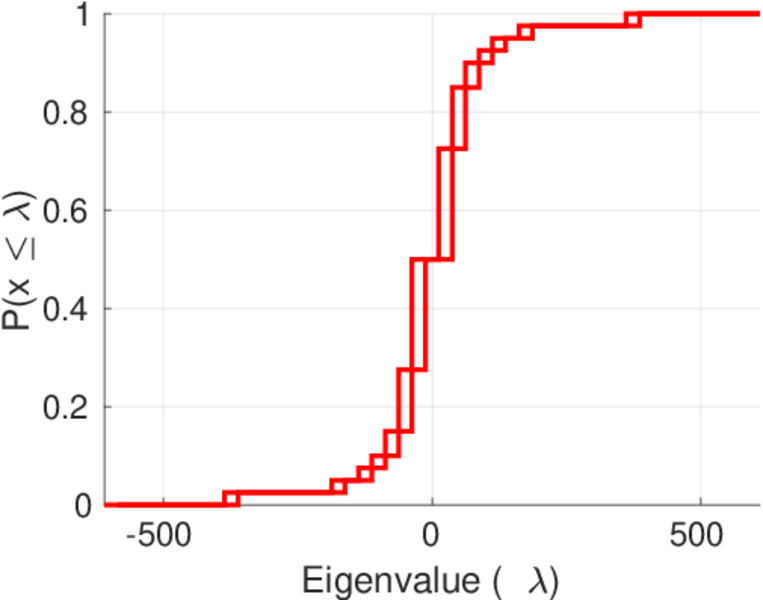
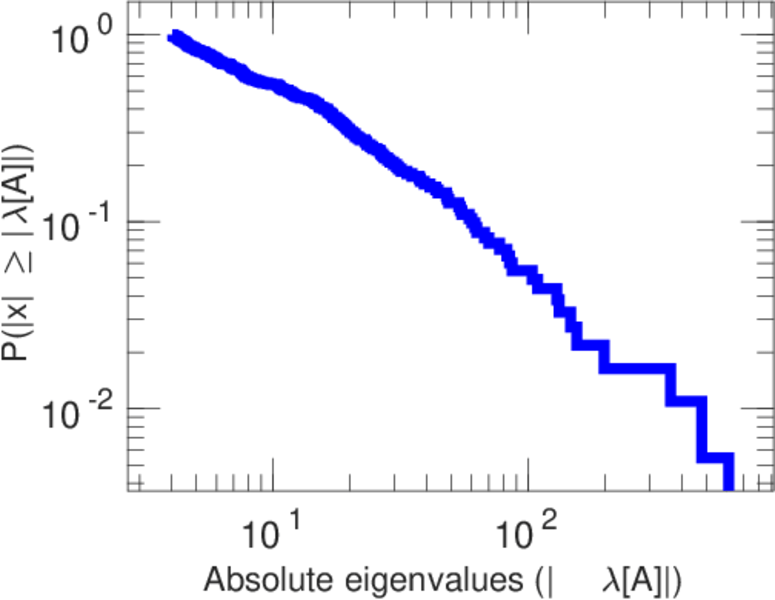
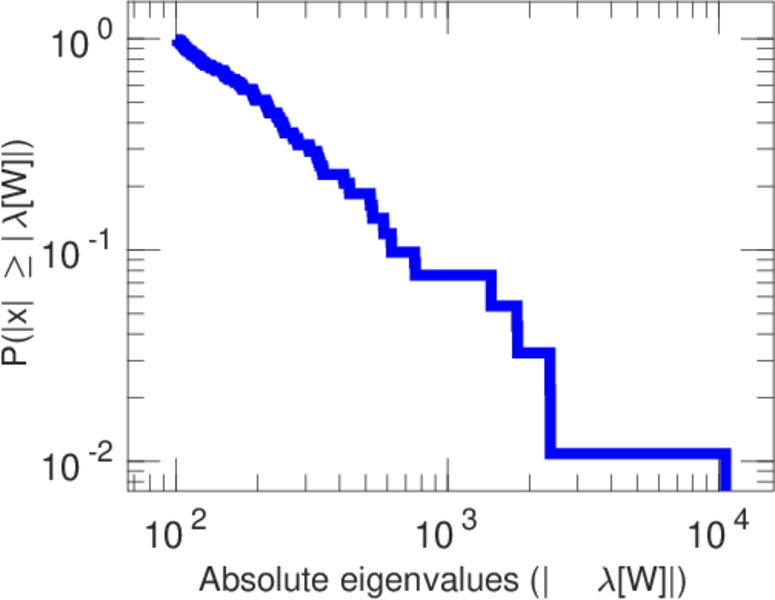
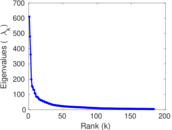
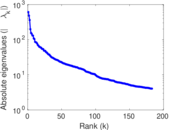
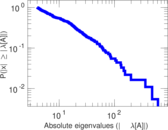
| Spectral norm | α = | 610.388
|
| Algebraic connectivity | a = | 0.022 604 5
|
| Spectral separation | |λ1[A] / λ2[A]| = | 1.272 08
|
| Controllability | C = | 8,609
|
| Relative controllability | Cr = | 0.822 647
|
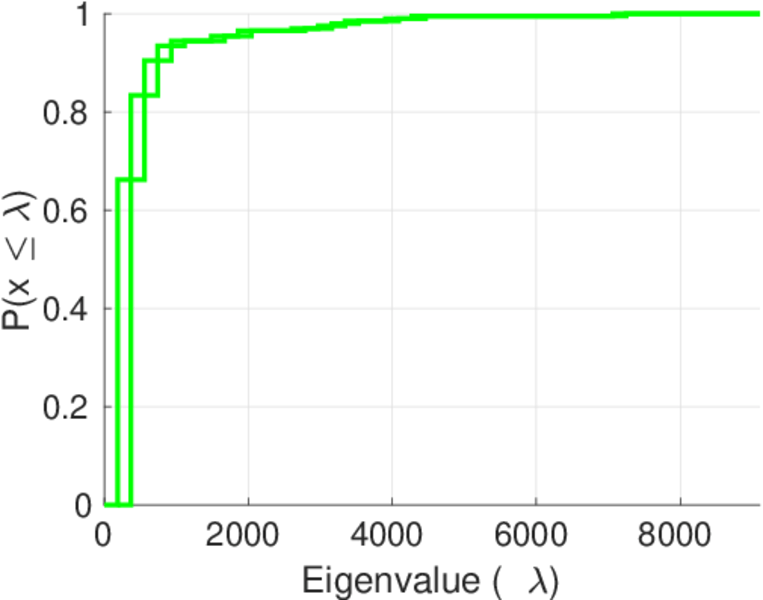
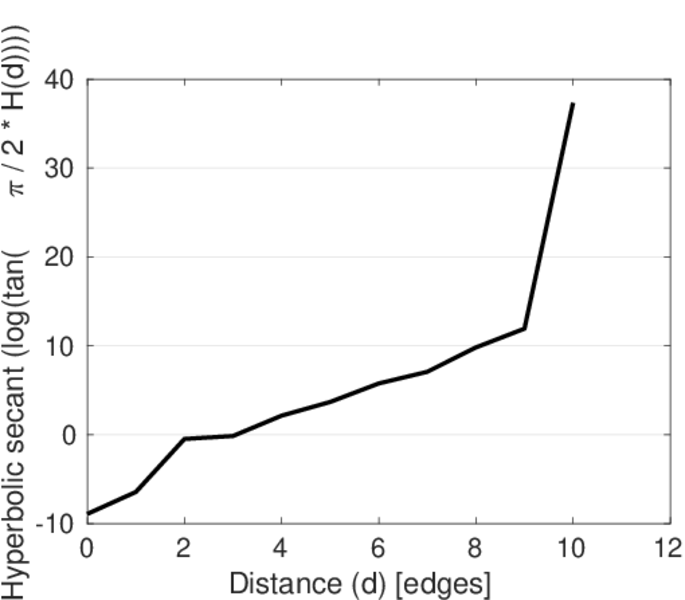
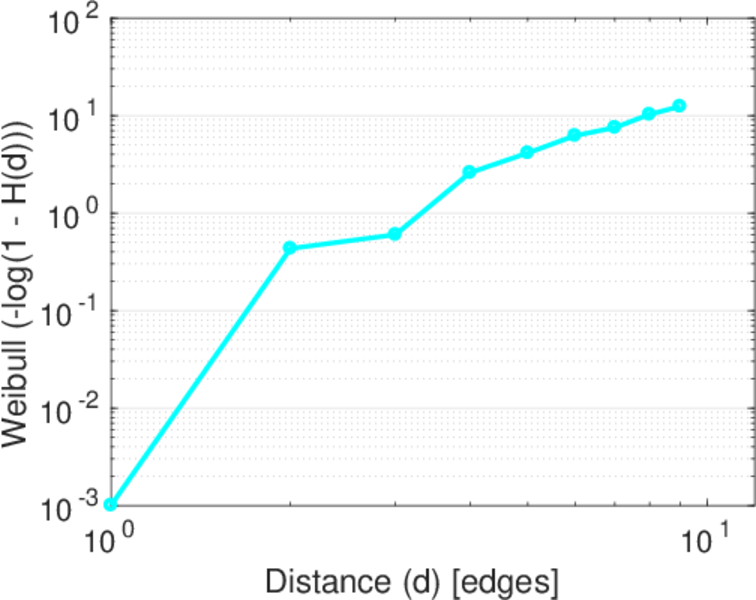
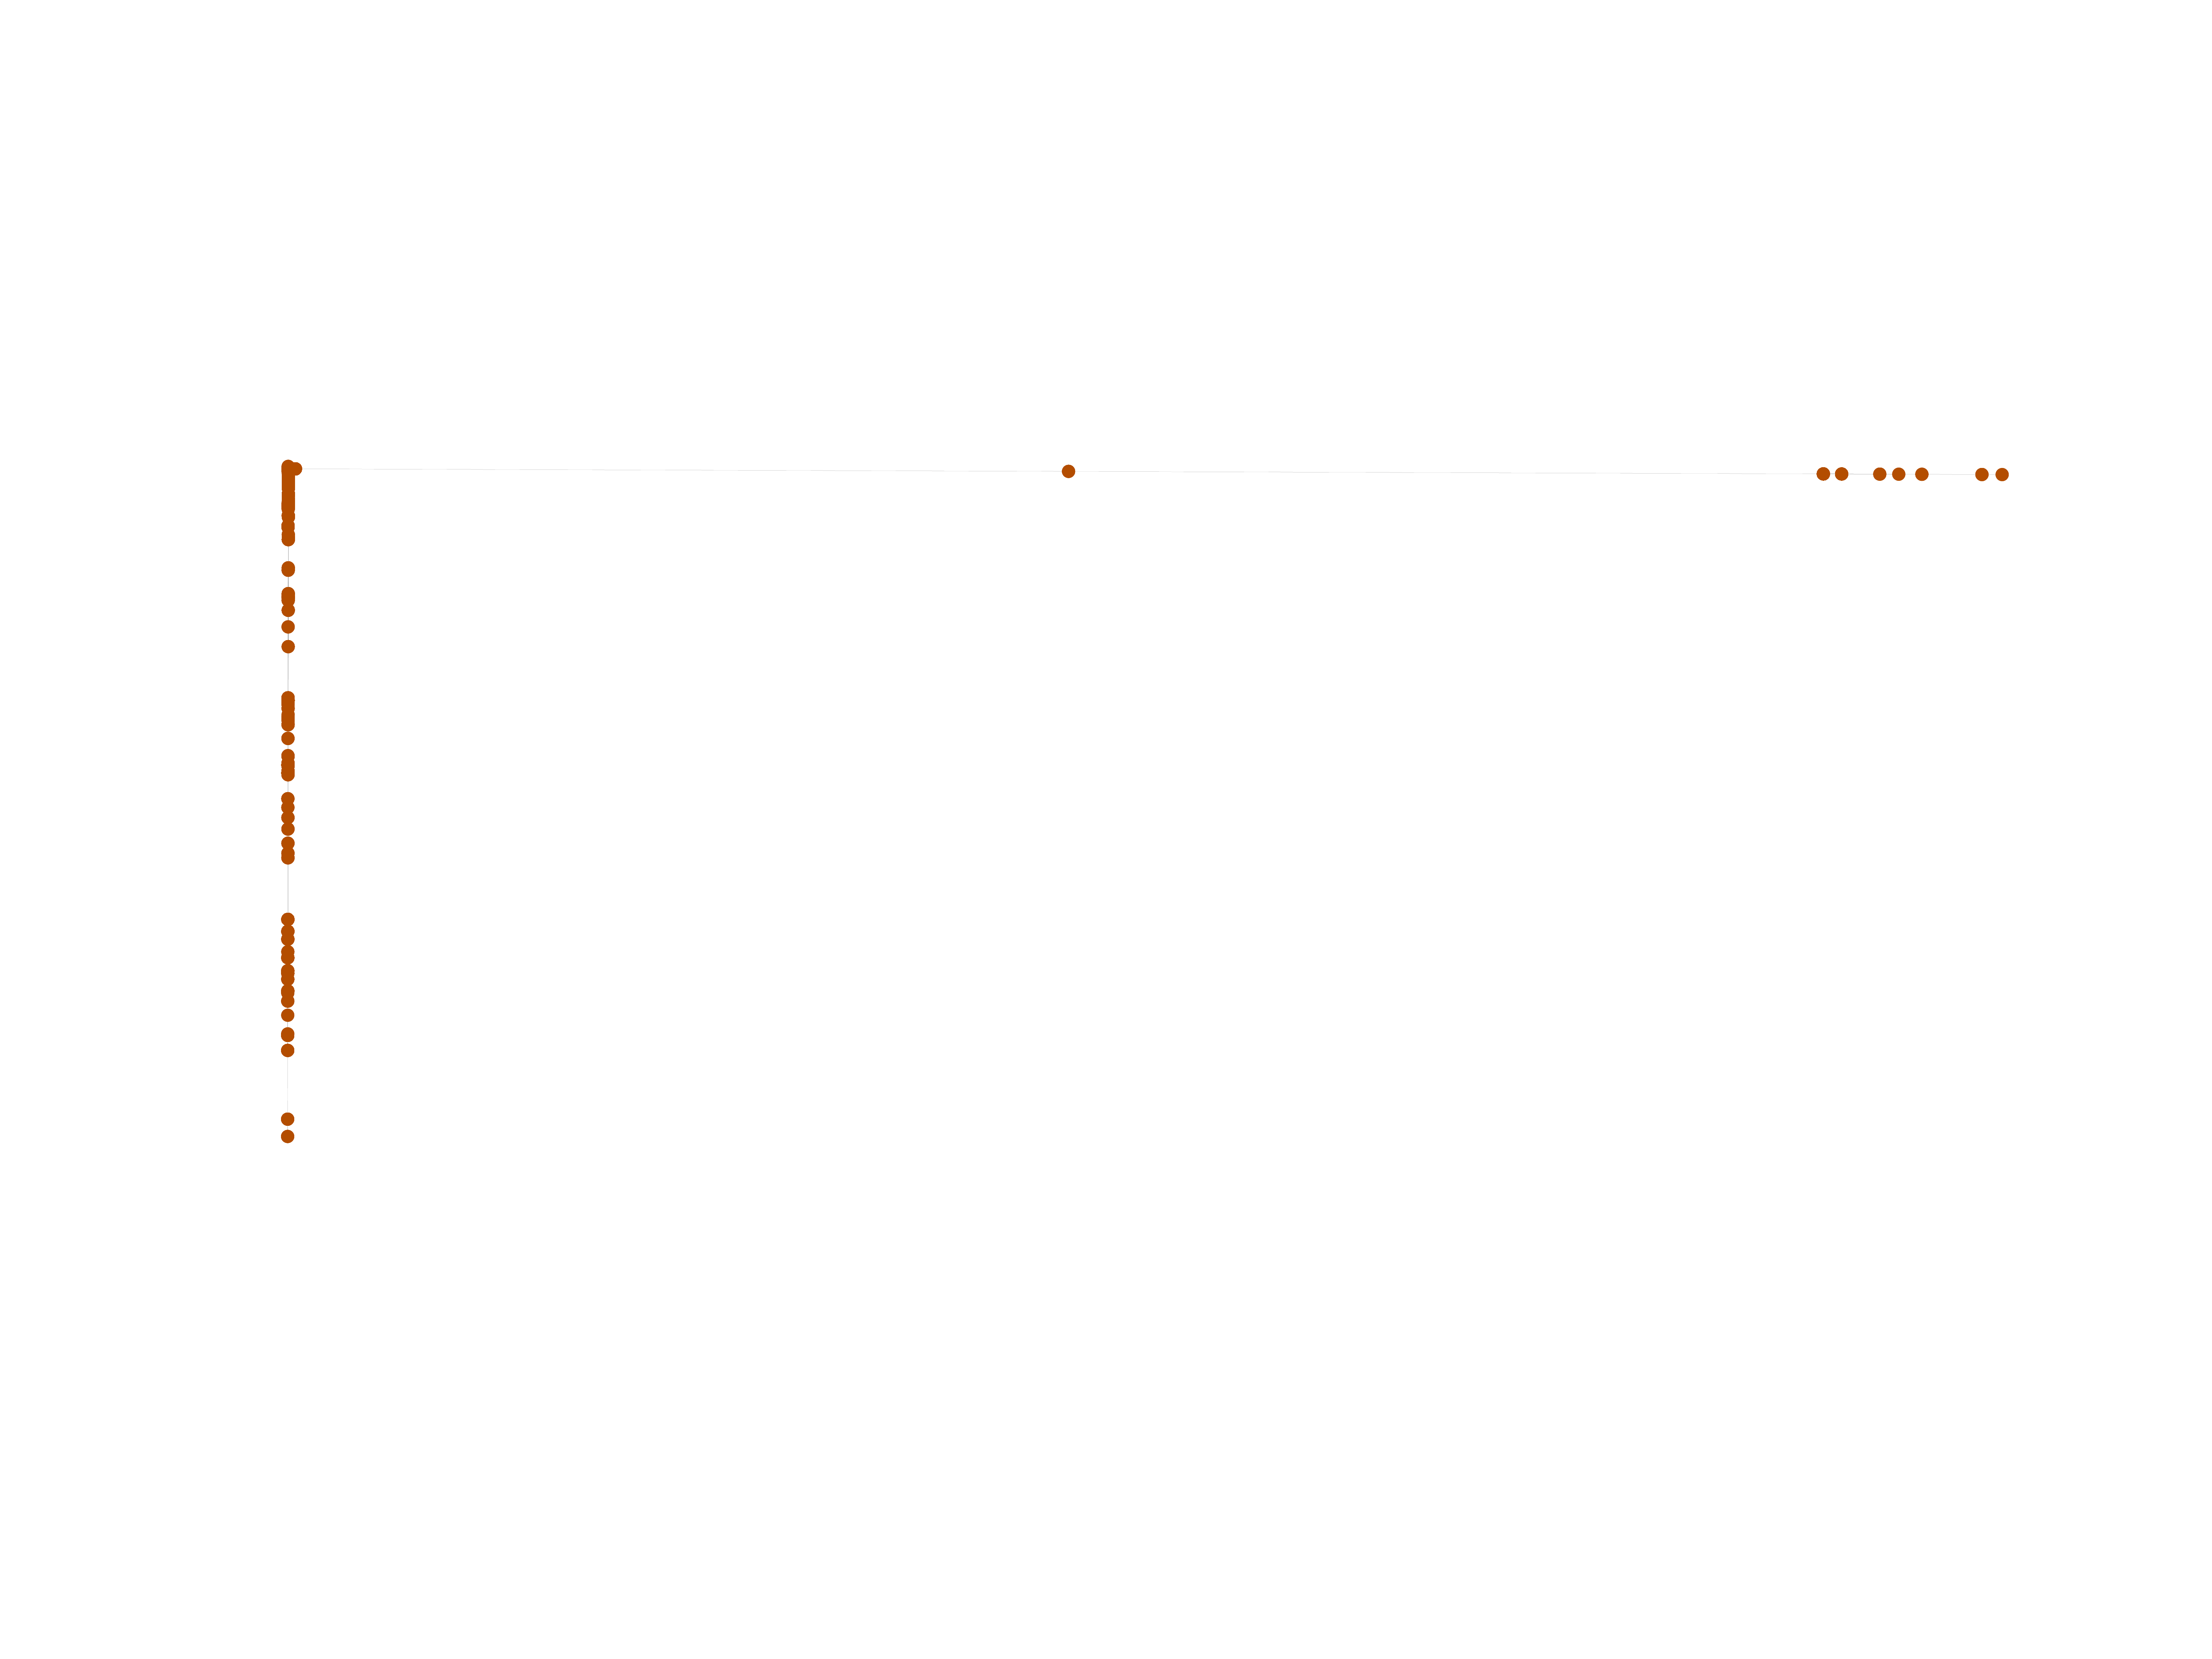
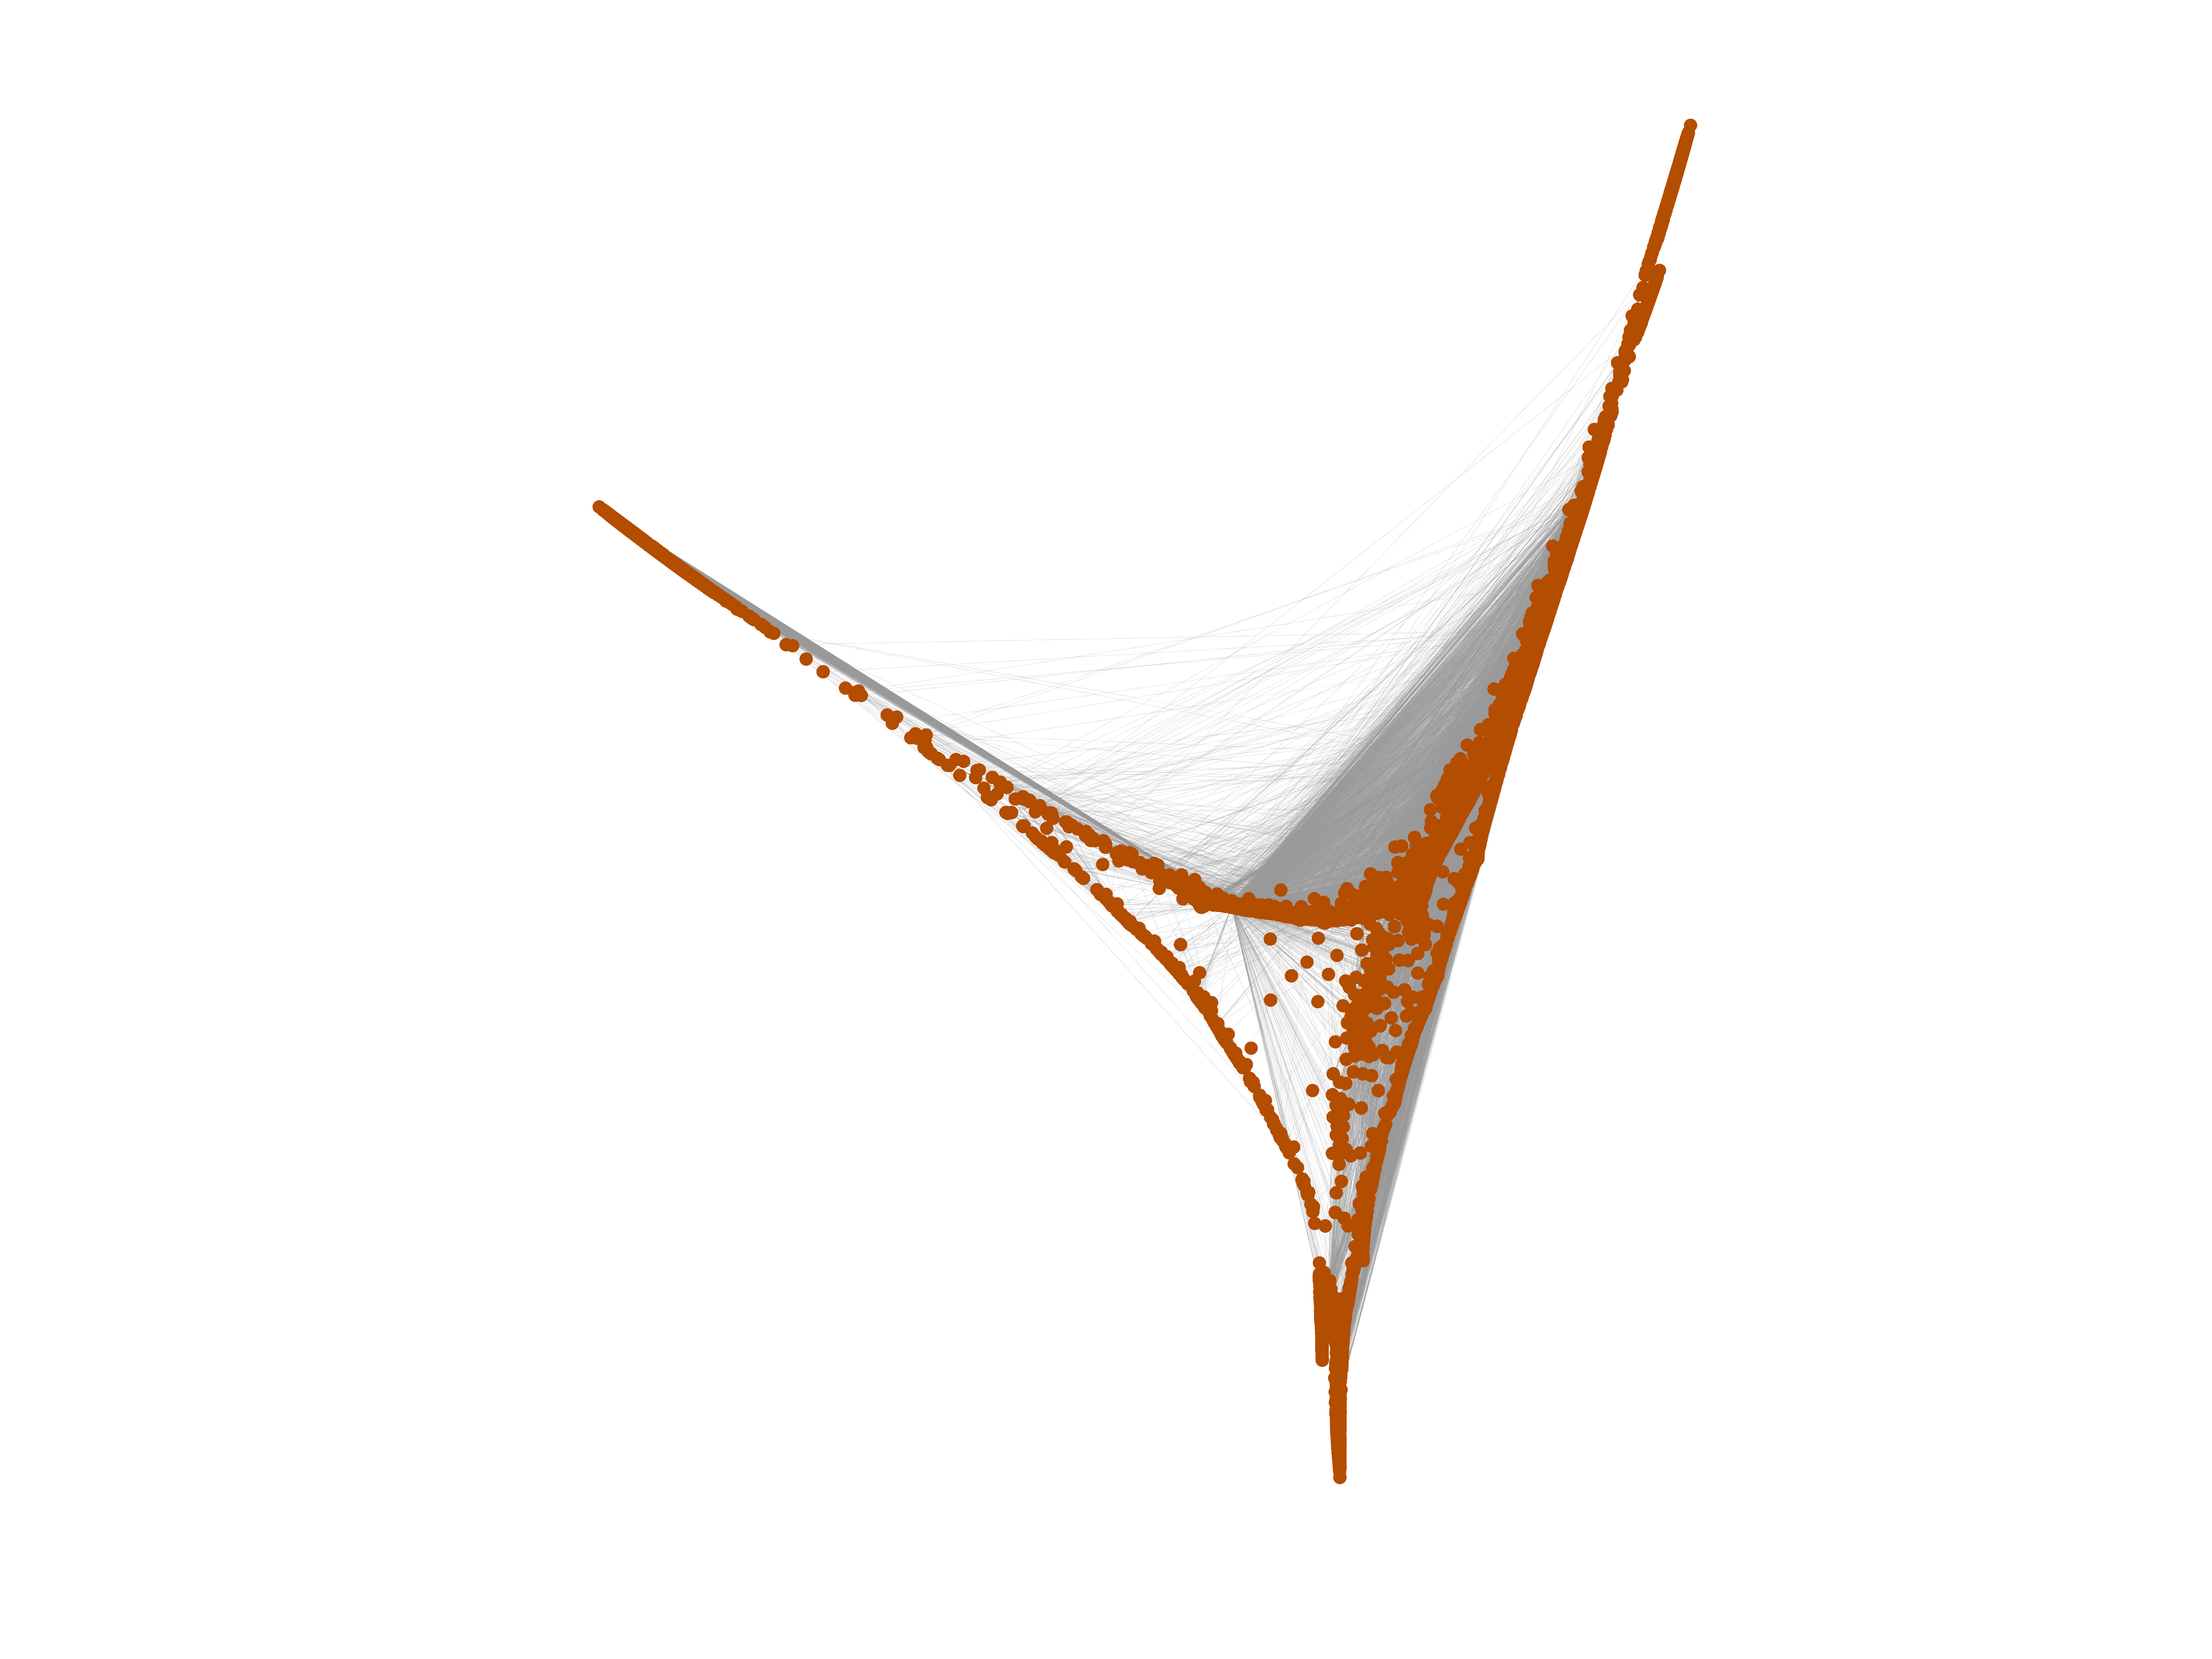
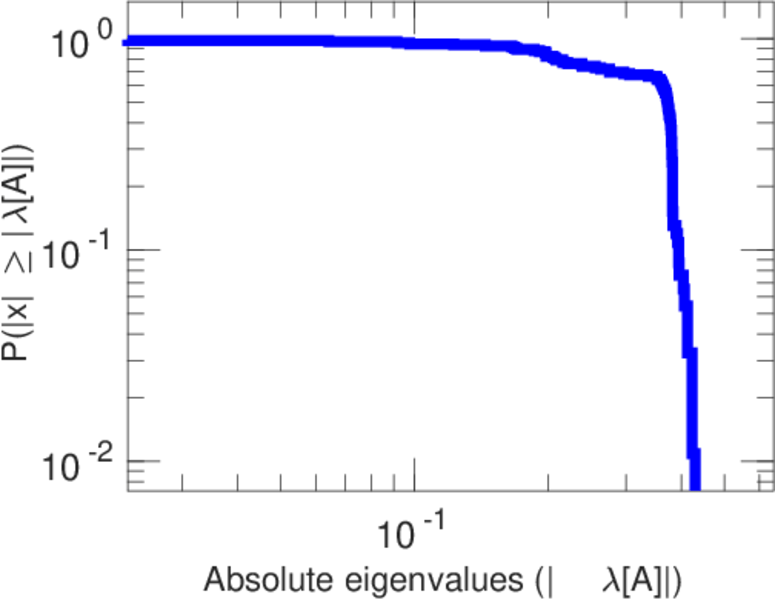
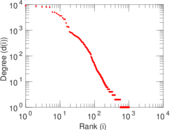
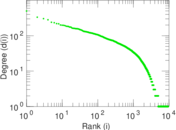
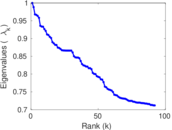
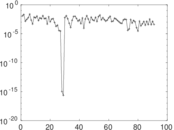
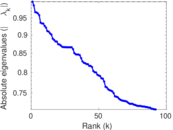
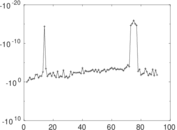
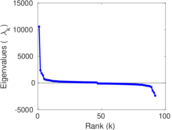
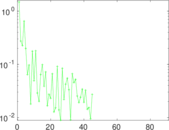
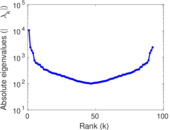
Plots


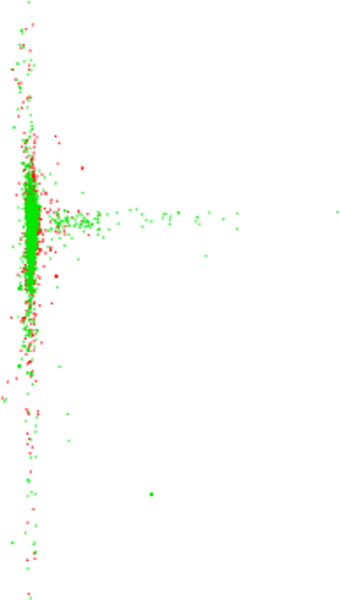
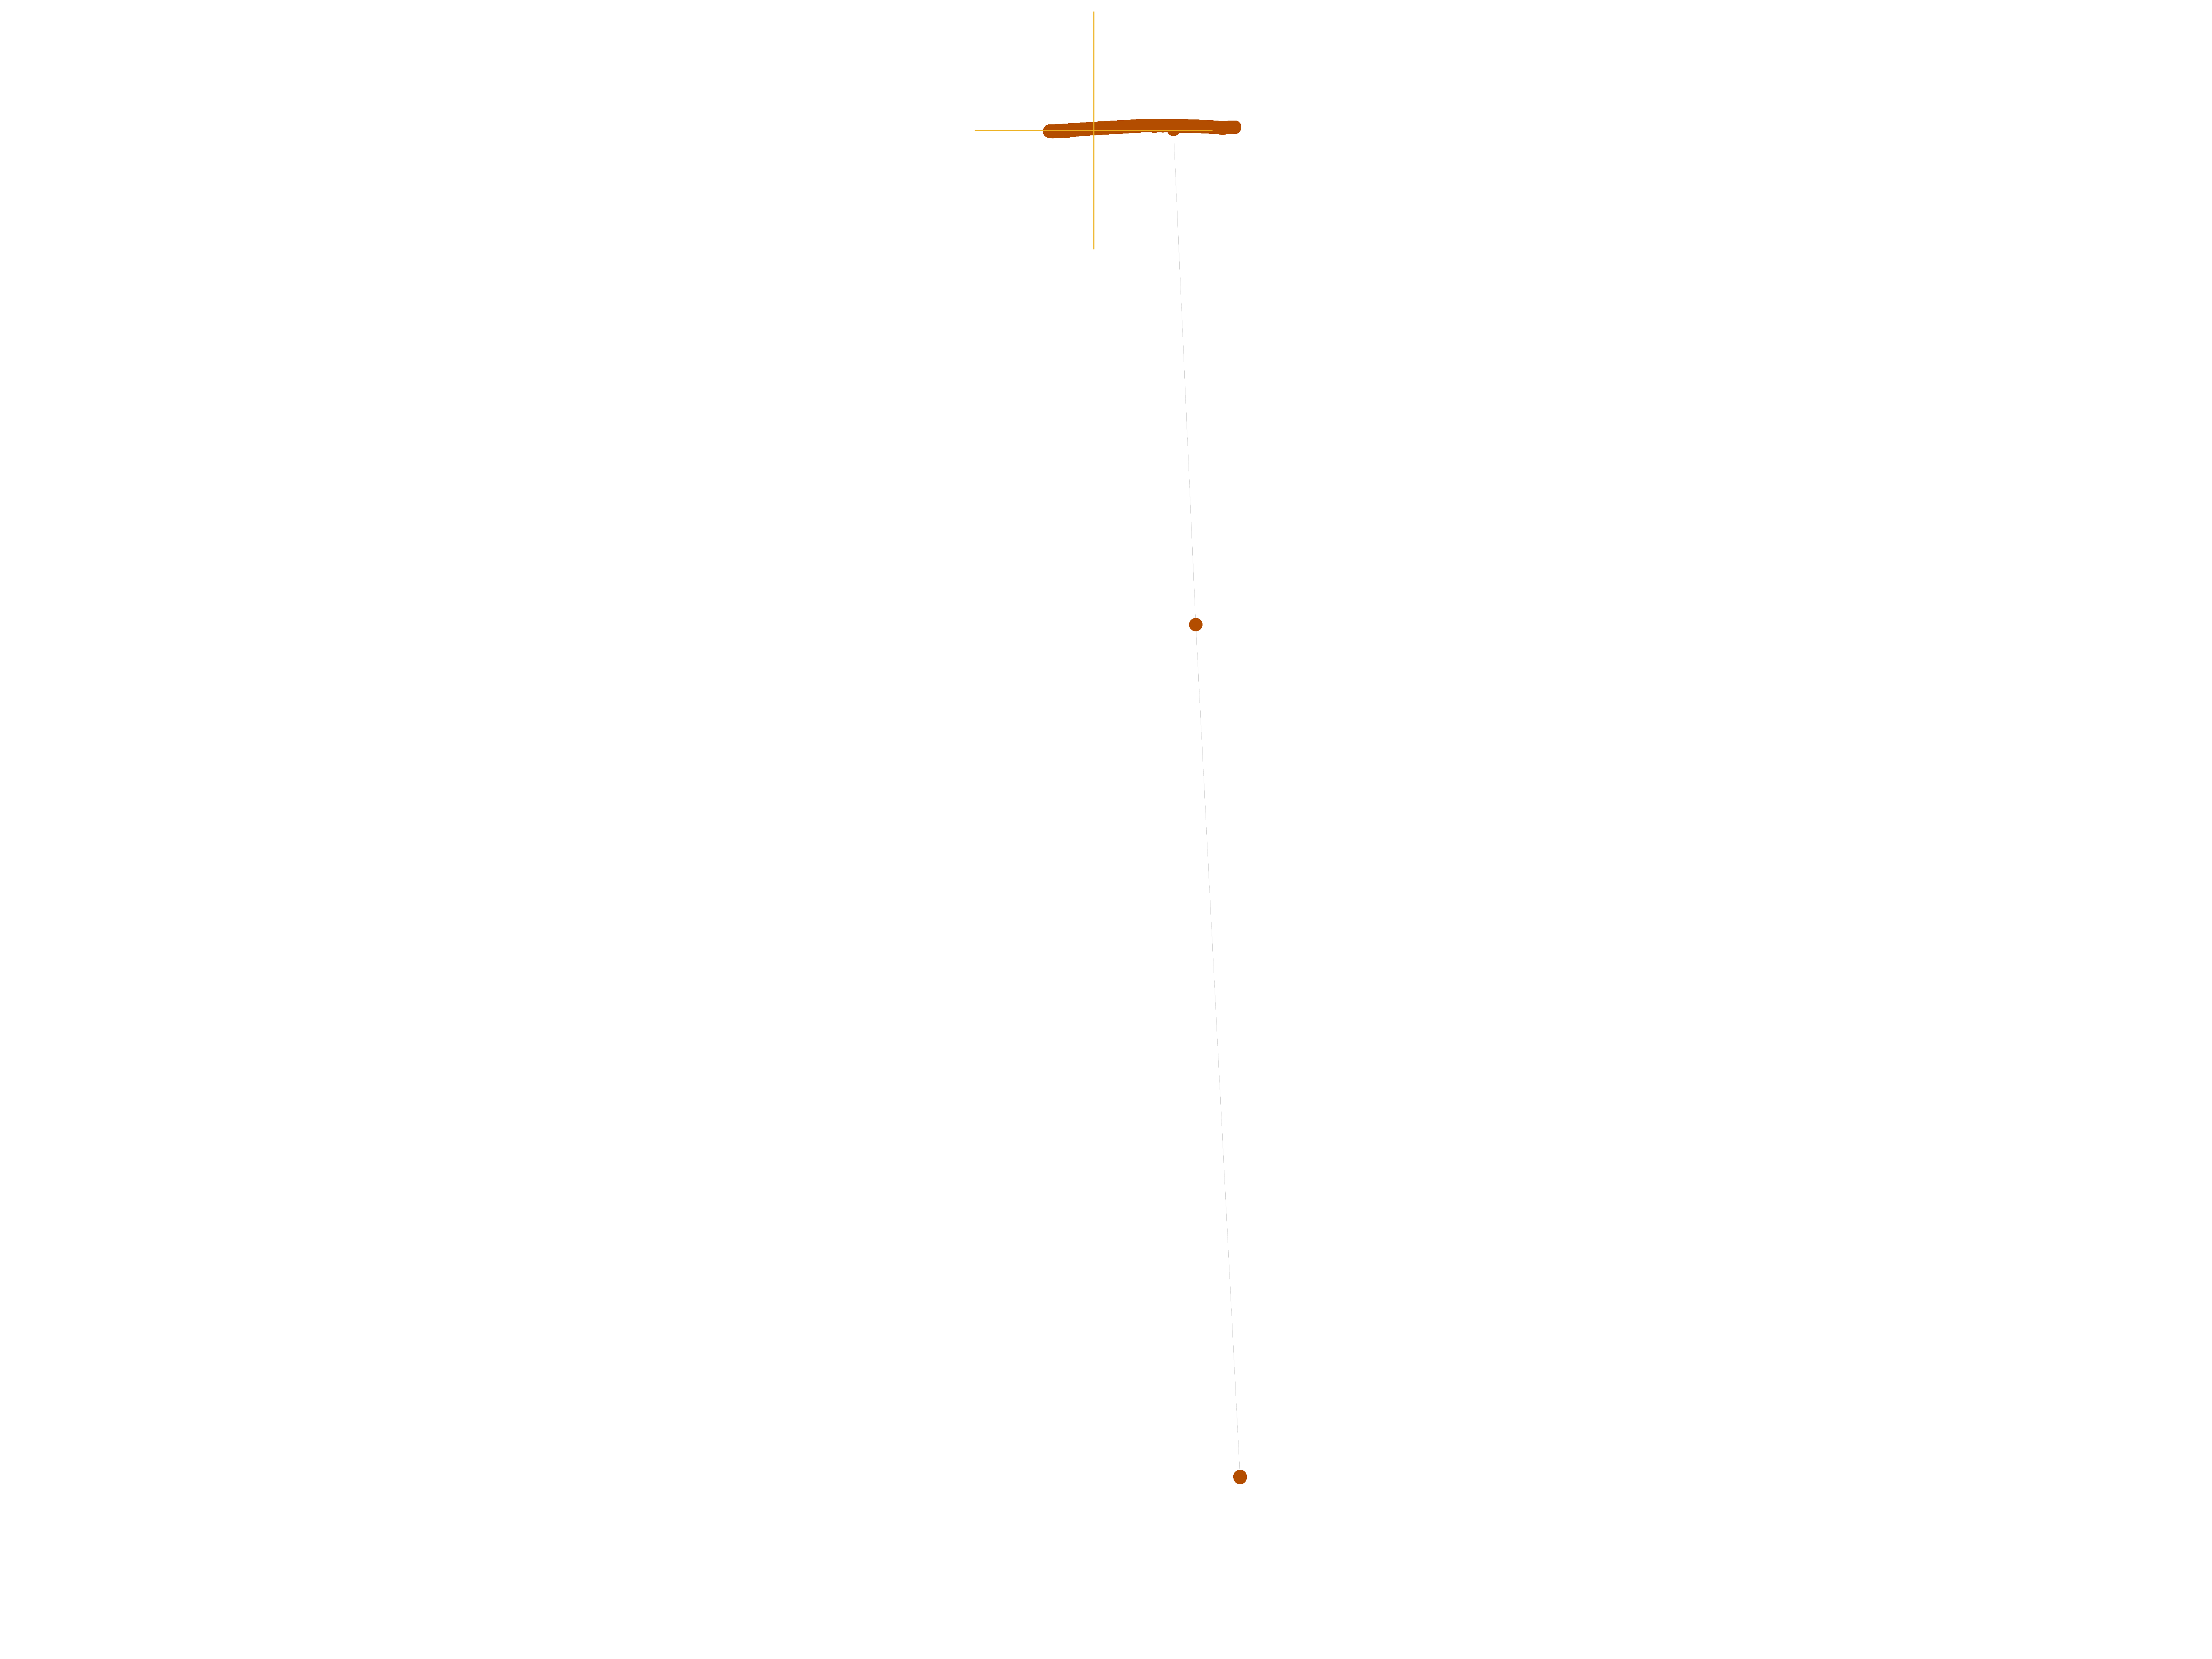
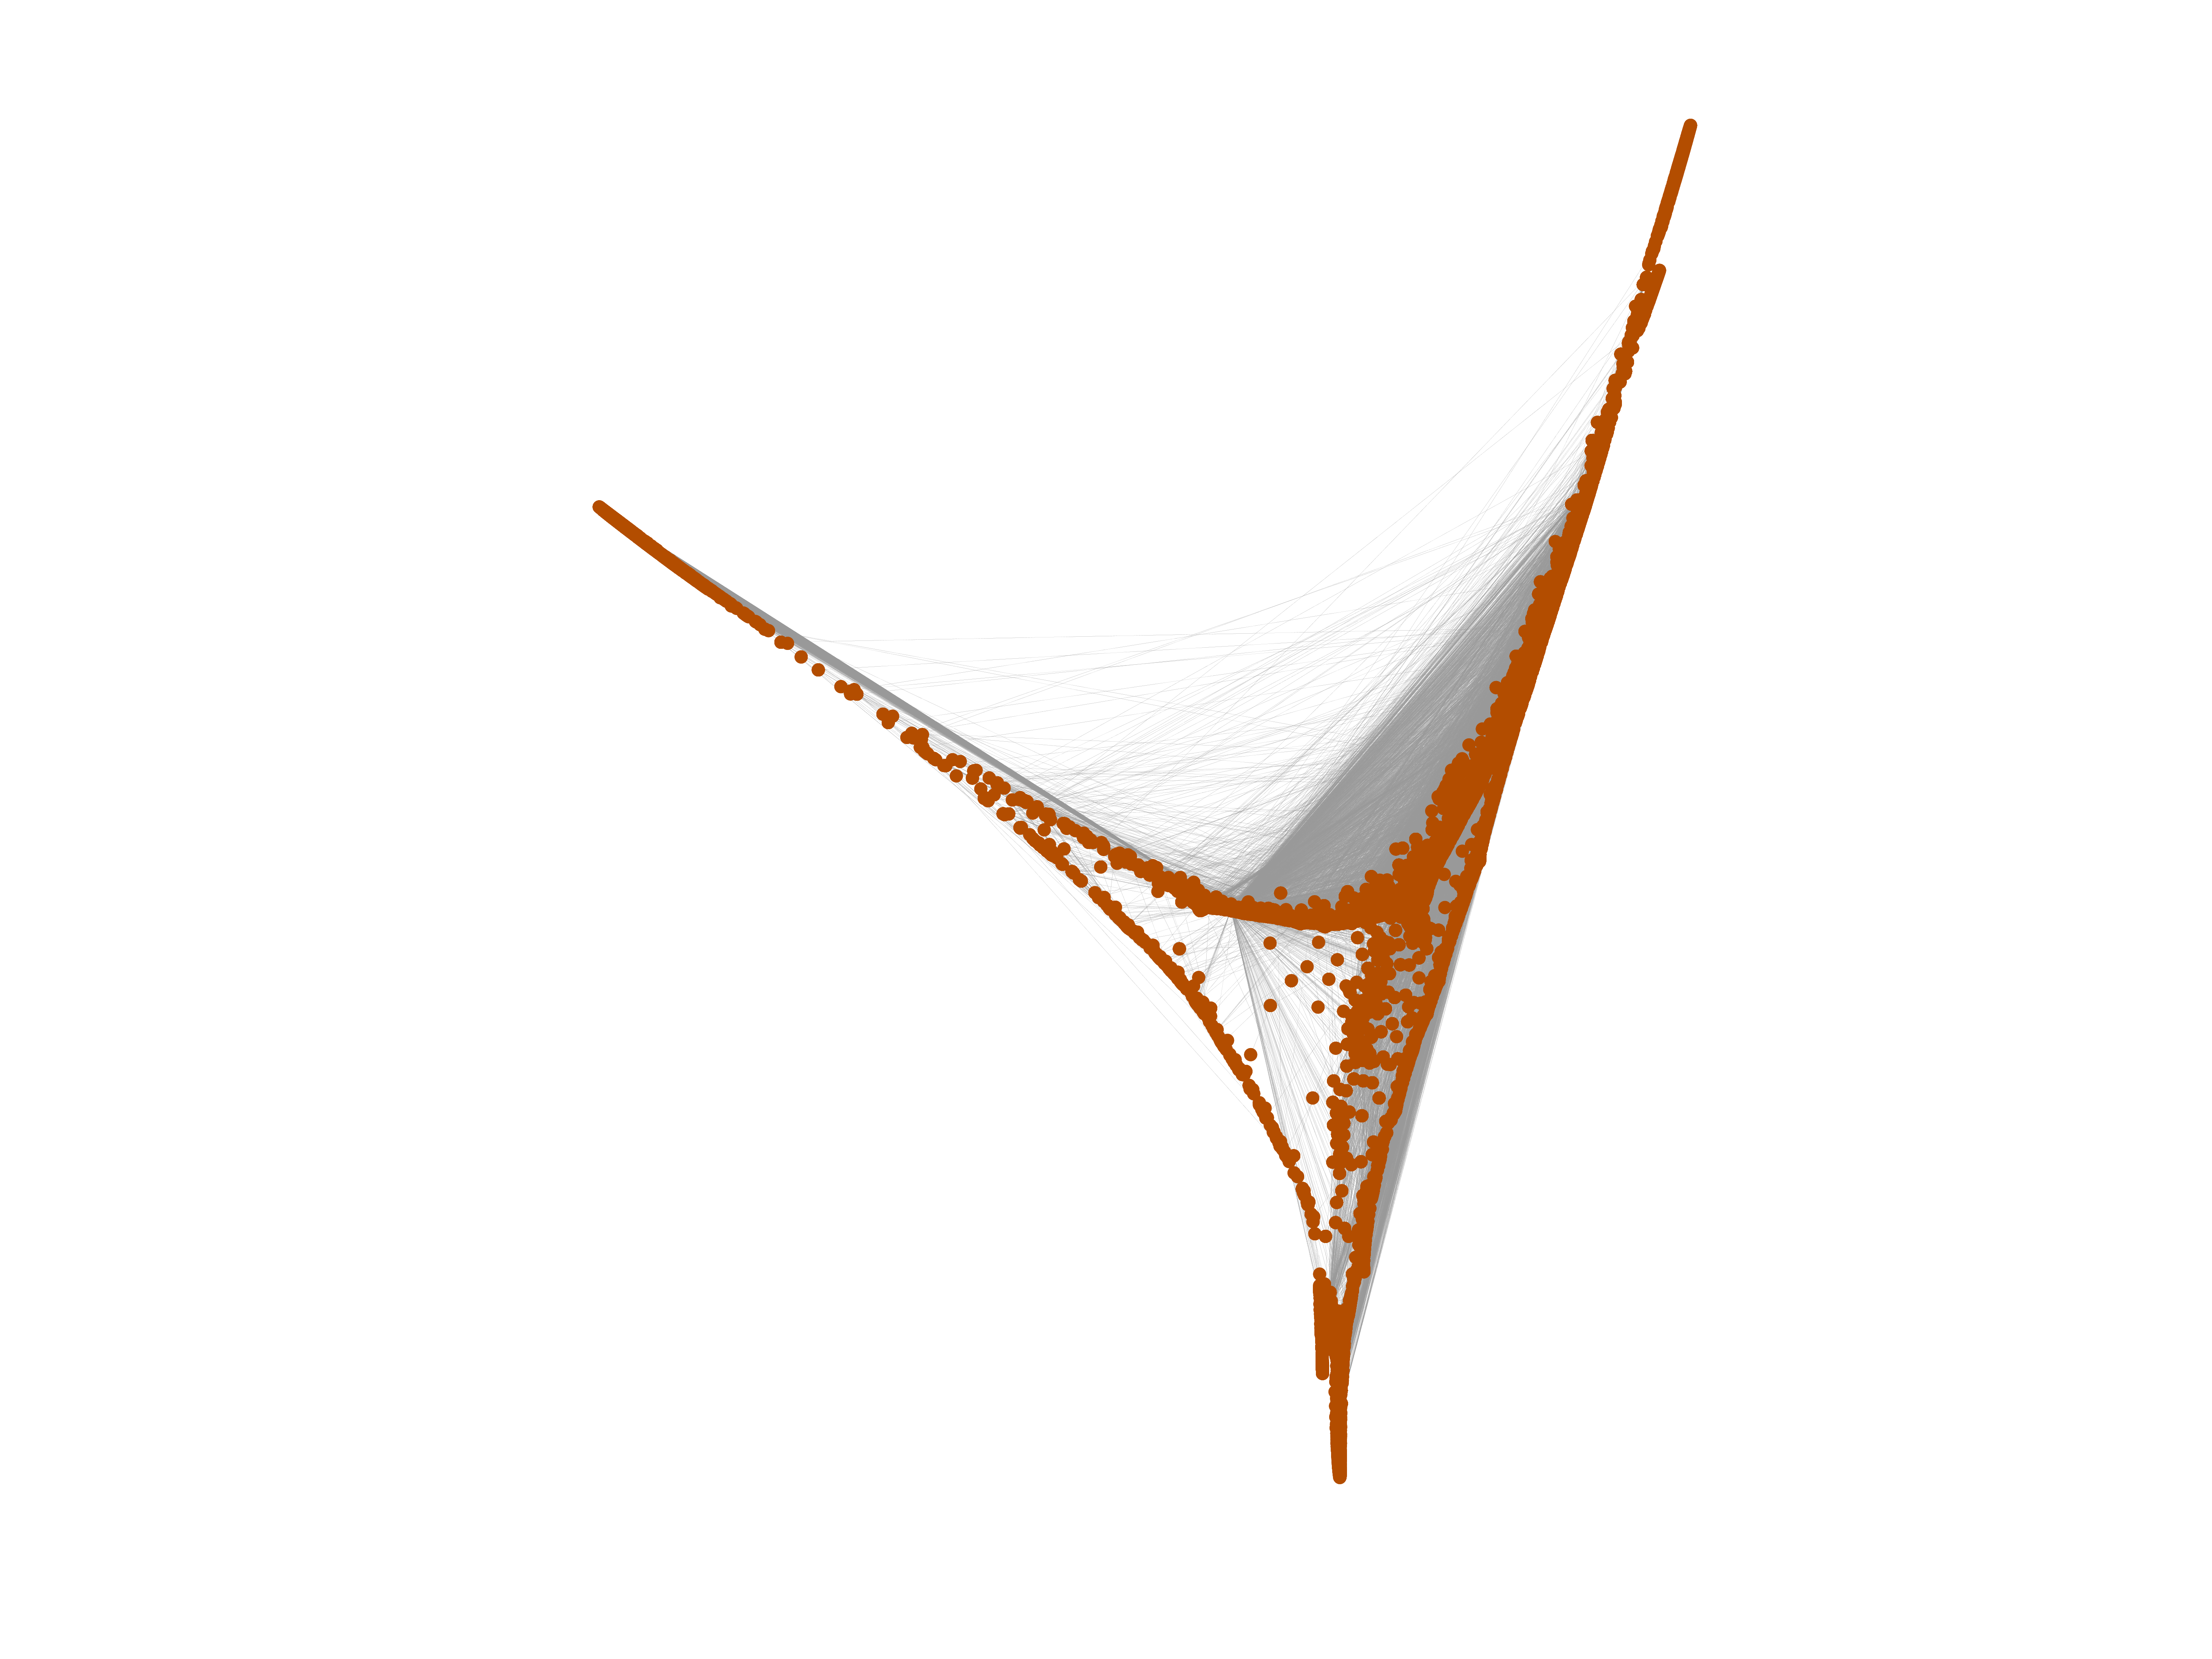
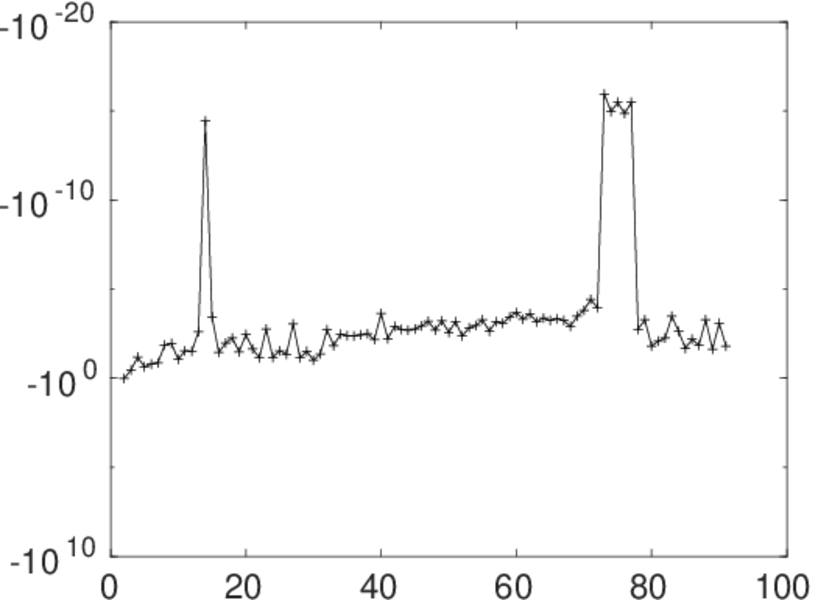
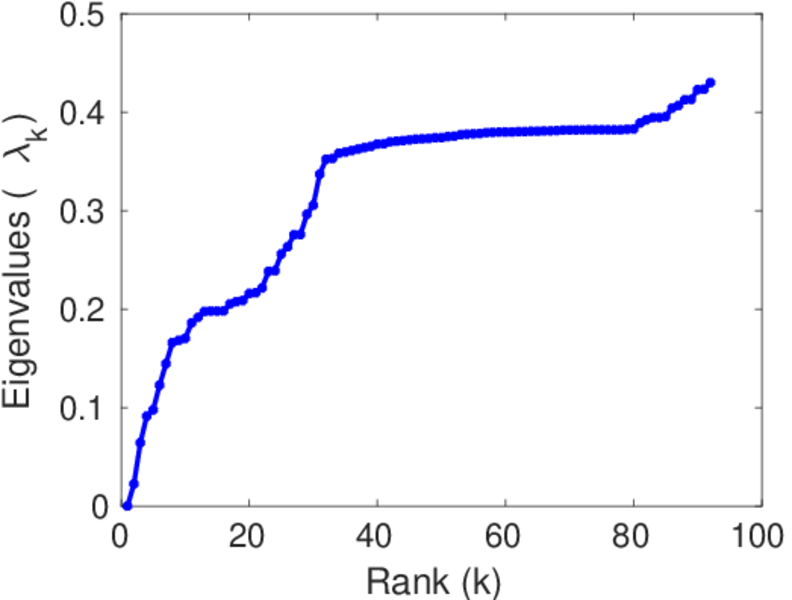
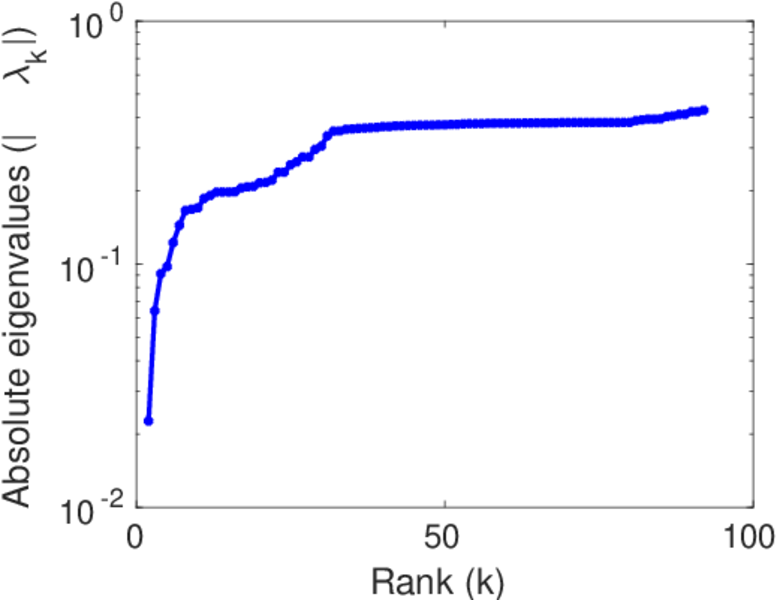
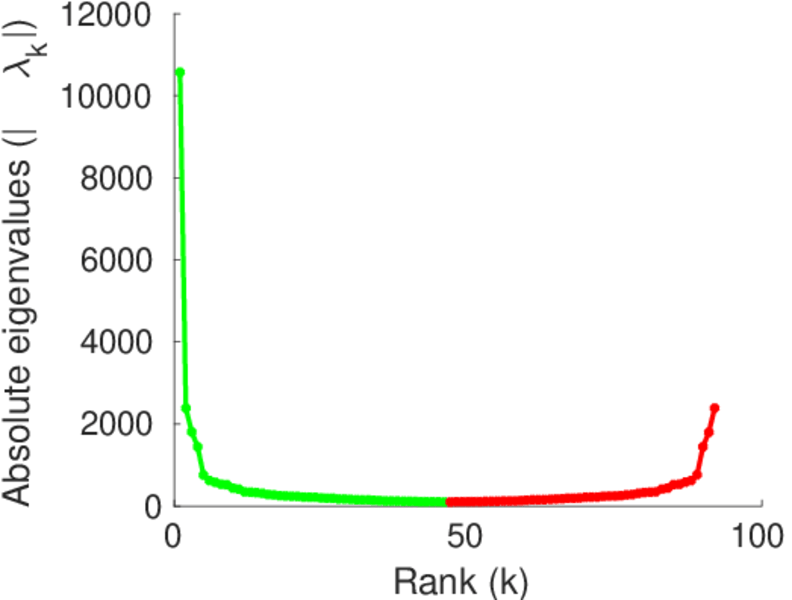
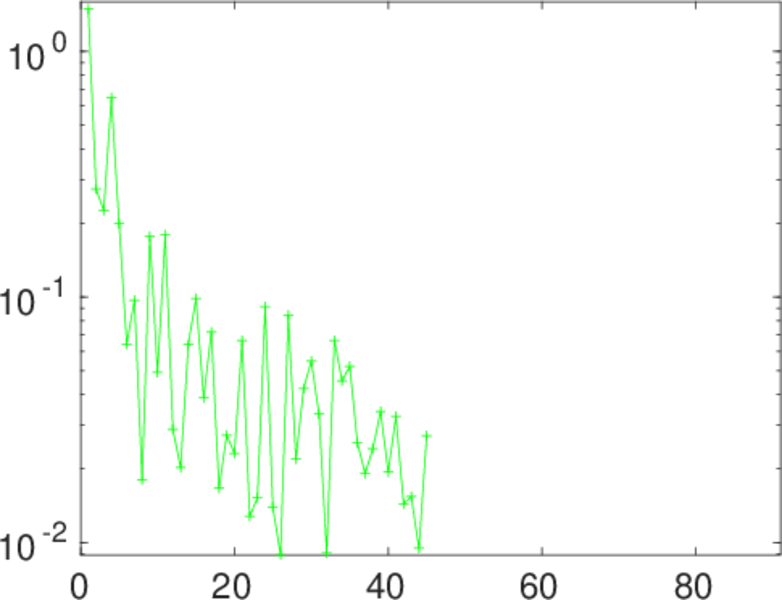
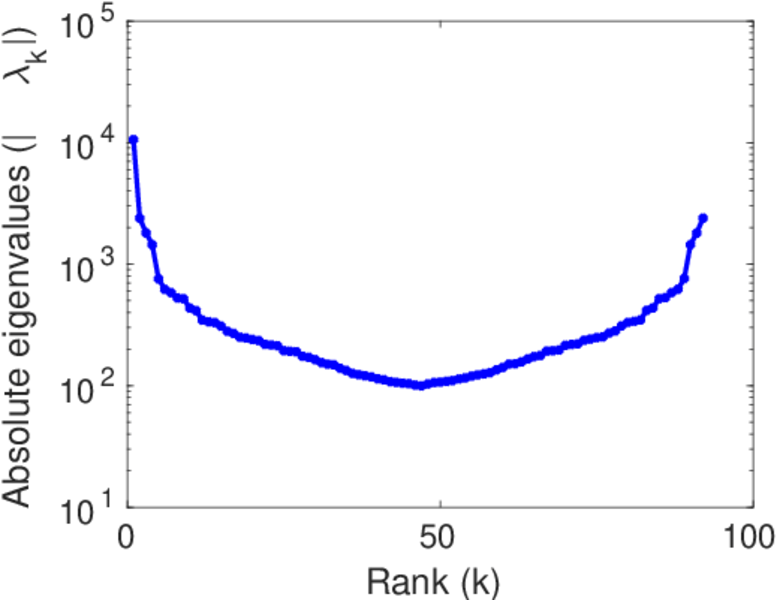
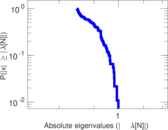
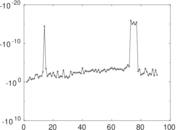
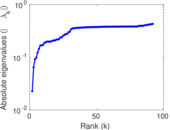
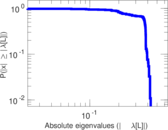
Matrix decompositions plots


Downloads
References
|
[1]
|
Jérôme Kunegis.
KONECT – The Koblenz Network Collection.
In Proc. Int. Conf. on World Wide Web Companion, pages
1343–1350, 2013.
[ http ]
|
|
[2]
|
Wikimedia Foundation.
Wikimedia downloads.
http://dumps.wikimedia.org/, January 2010.
|
 KONECT ‣ Networks ‣
Buy Me a Coffee
KONECT ‣ Networks ‣
Buy Me a Coffee