Wikipedia edits (st)
This is the bipartite edit network of the Southern Sotho Wikipedia. It contains
users and pages from the Southern Sotho Wikipedia, connected by edit events.
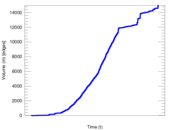
Each edge represents an edit. The dataset includes the timestamp of each edit.
Metadata
Statistics
| Size | n = | 2,689
|
| Left size | n1 = | 645
|
| Right size | n2 = | 2,044
|
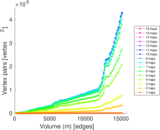
| Volume | m = | 14,965
|
| Unique edge count | m̿ = | 6,553
|
| Wedge count | s = | 358,985
|
| Claw count | z = | 18,035,605
|
| Cross count | x = | 901,060,854
|
| Square count | q = | 714,618
|
| 4-Tour count | T4 = | 7,173,522
|
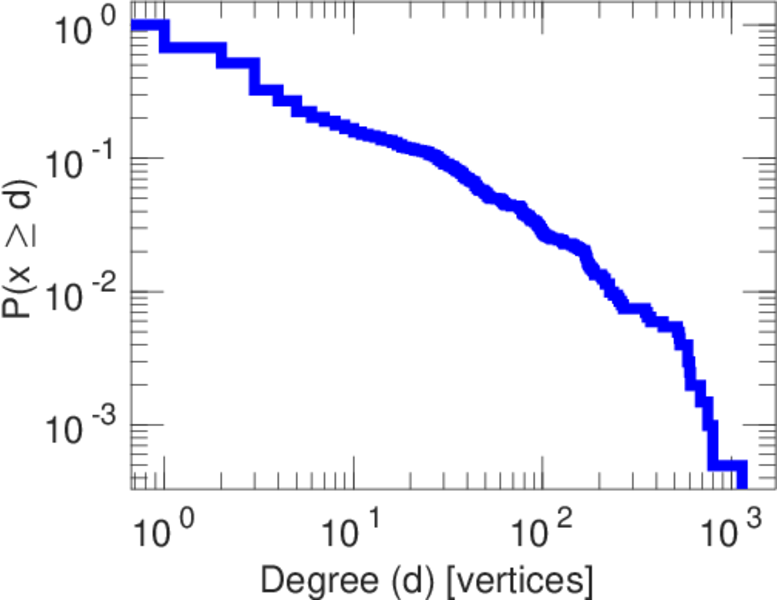
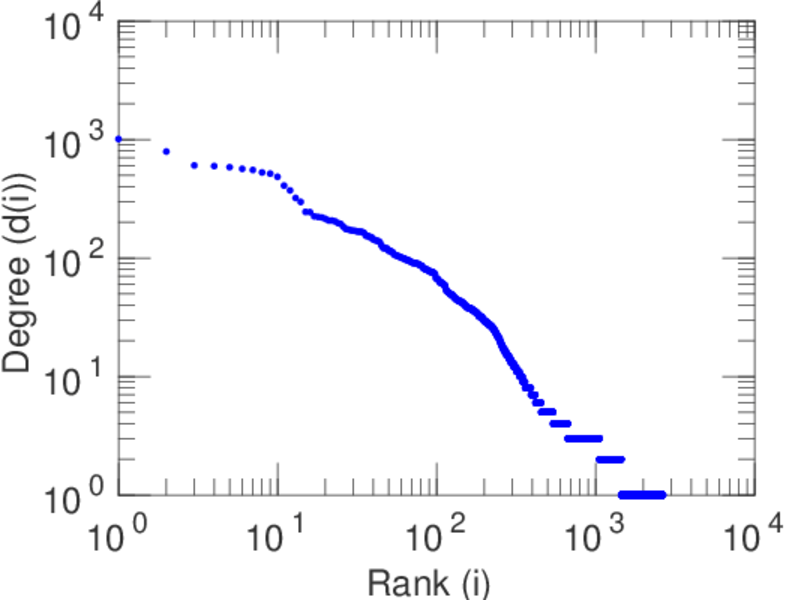
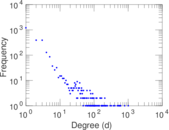
| Maximum degree | dmax = | 1,009
|
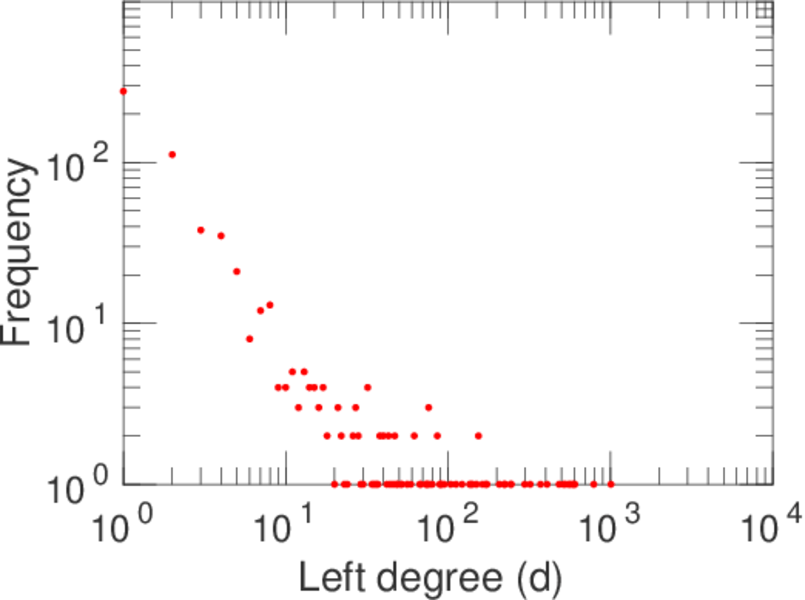
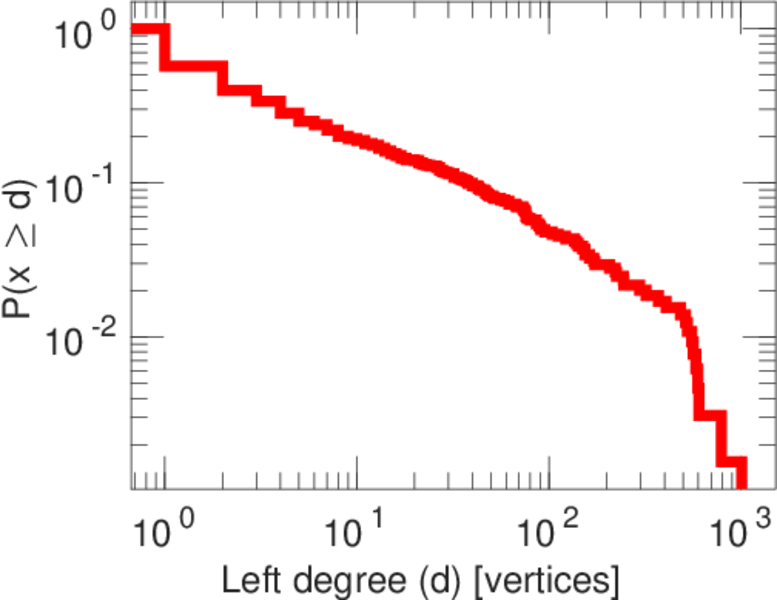
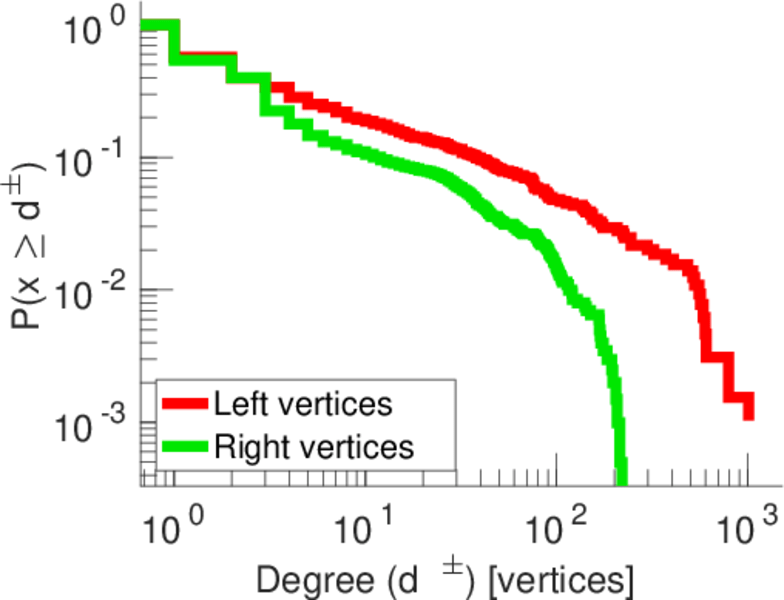
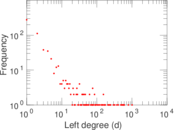
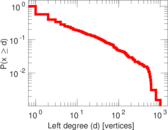
| Maximum left degree | d1max = | 1,009
|
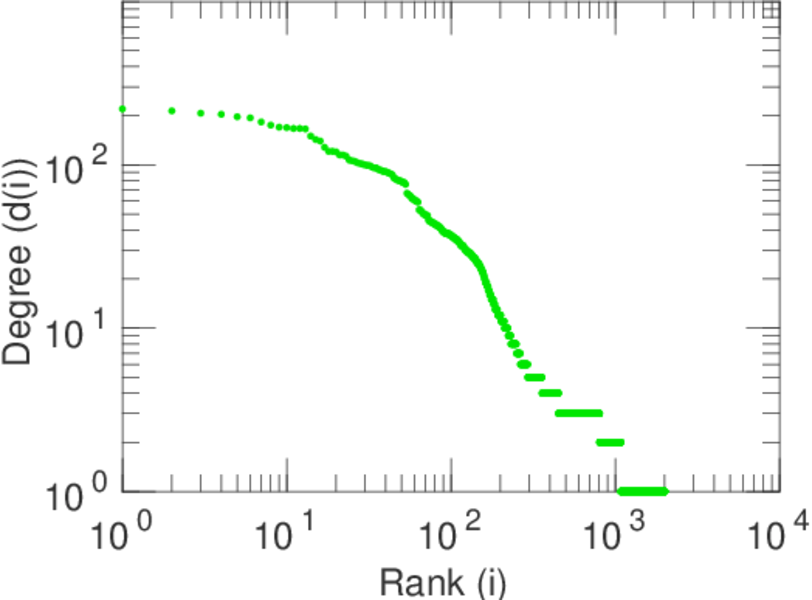
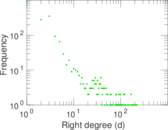
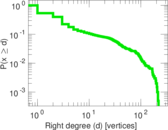
| Maximum right degree | d2max = | 220
|
| Average degree | d = | 11.130 5
|
| Average left degree | d1 = | 23.201 6
|
| Average right degree | d2 = | 7.321 43
|
| Fill | p = | 0.004 970 49
|
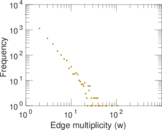
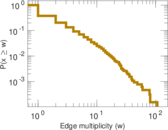
| Average edge multiplicity | m̃ = | 2.283 69
|
| Size of LCC | N = | 2,070
|
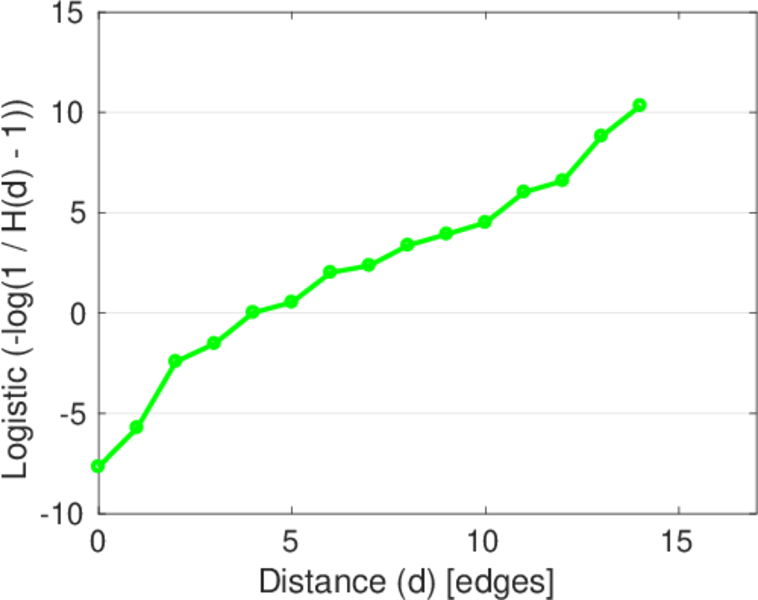
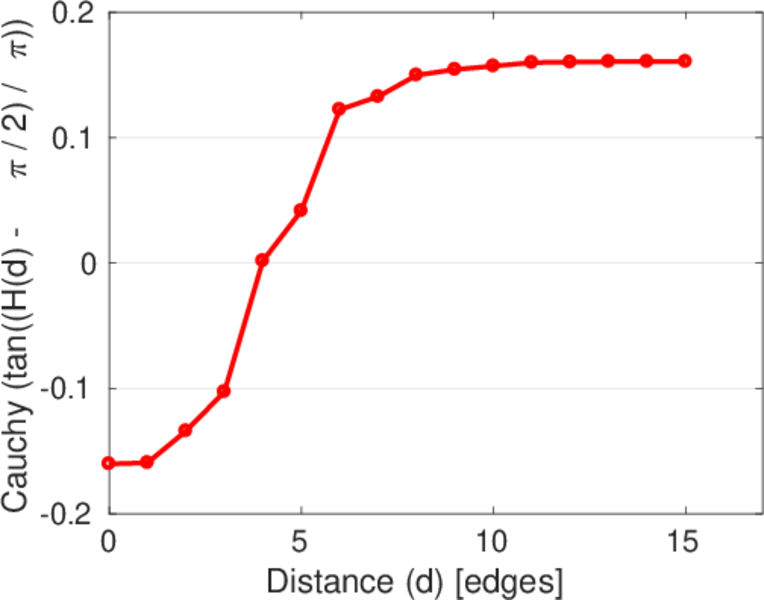
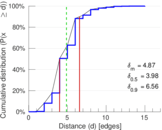
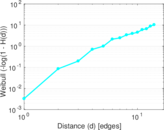
| Diameter | δ = | 16
|
| 50-Percentile effective diameter | δ0.5 = | 3.984 55
|
| 90-Percentile effective diameter | δ0.9 = | 6.558 87
|
| Median distance | δM = | 4
|
| Mean distance | δm = | 4.873 01
|
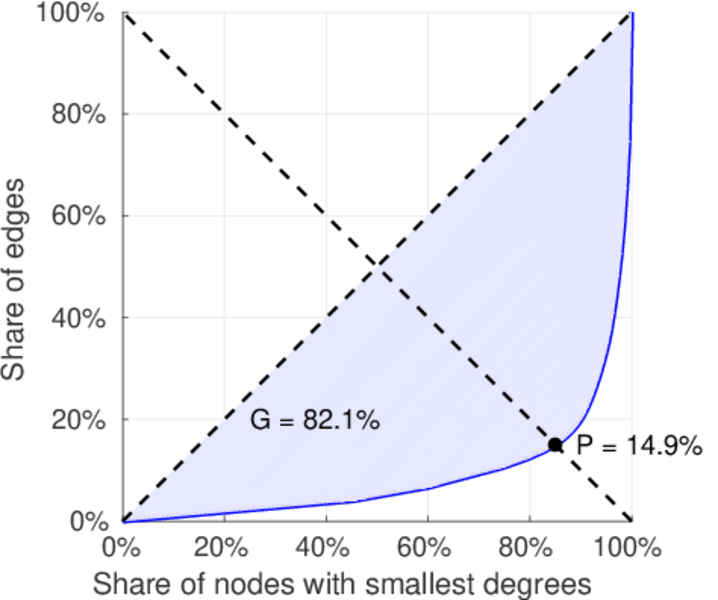
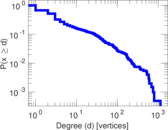
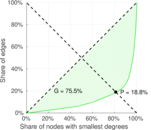
| Gini coefficient | G = | 0.821 100
|
| Balanced inequality ratio | P = | 0.148 079
|
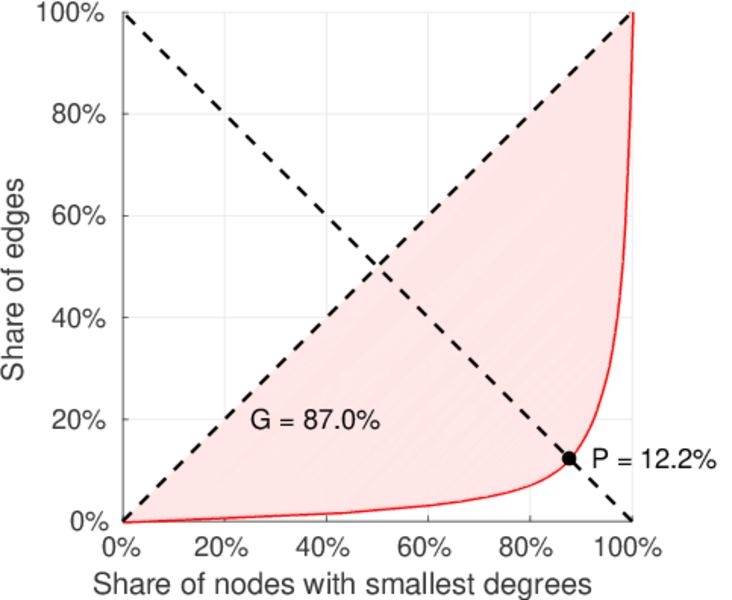
| Left balanced inequality ratio | P1 = | 0.121 751
|
| Right balanced inequality ratio | P2 = | 0.188 106
|
| Relative edge distribution entropy | Her = | 0.825 948
|
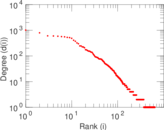
| Power law exponent | γ = | 2.631 67
|
| Tail power law exponent | γt = | 1.951 00
|
| Tail power law exponent with p | γ3 = | 1.951 00
|
| p-value | p = | 0.000 00
|
| Left tail power law exponent with p | γ3,1 = | 1.711 00
|
| Left p-value | p1 = | 0.012 000 0
|
| Right tail power law exponent with p | γ3,2 = | 2.071 00
|
| Right p-value | p2 = | 0.000 00
|
| Degree assortativity | ρ = | −0.247 351
|
| Degree assortativity p-value | pρ = | 6.149 01 × 10−92
|
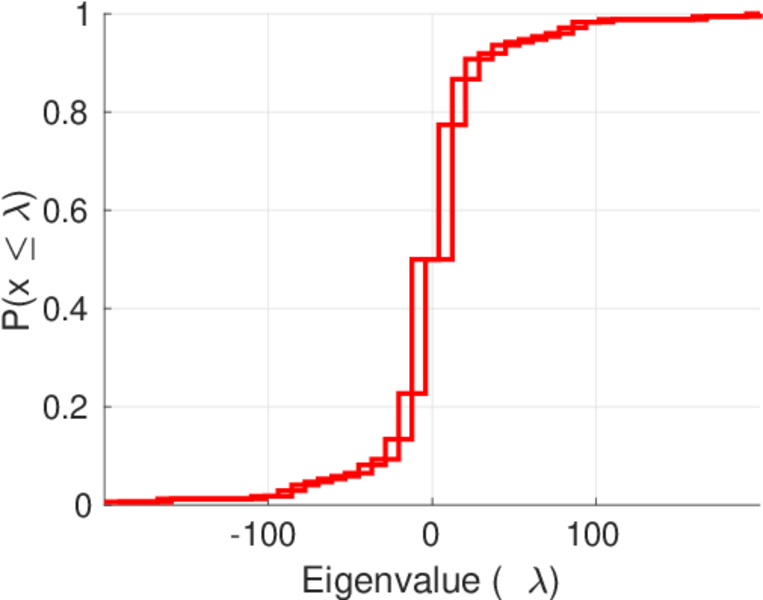
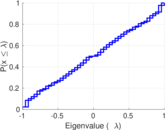
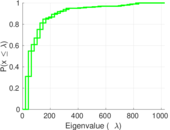
| Spectral norm | α = | 199.855
|
| Algebraic connectivity | a = | 0.024 292 3
|
| Spectral separation | |λ1[A] / λ2[A]| = | 1.672 00
|
| Controllability | C = | 1,434
|
| Relative controllability | Cr = | 0.540 724
|
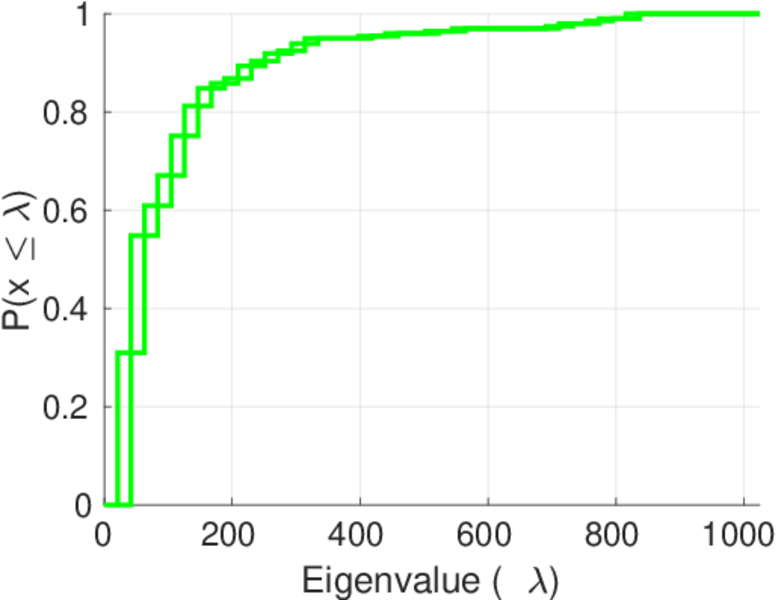
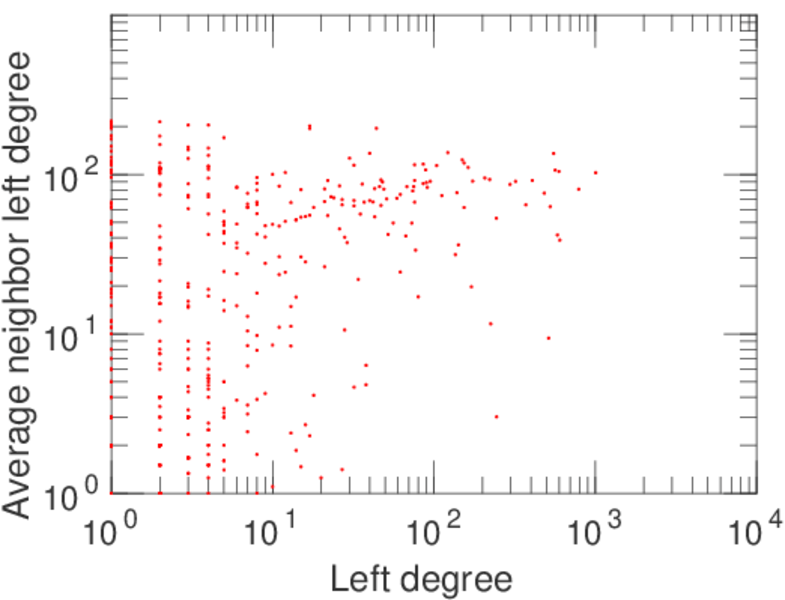
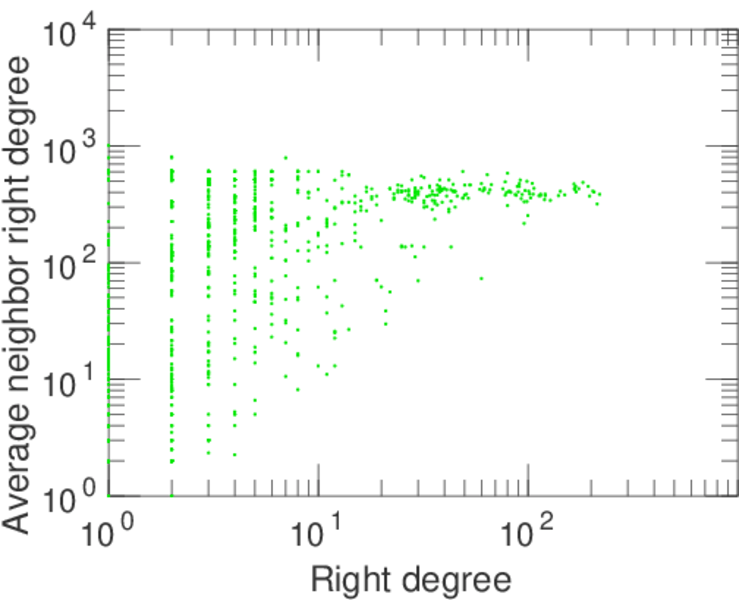
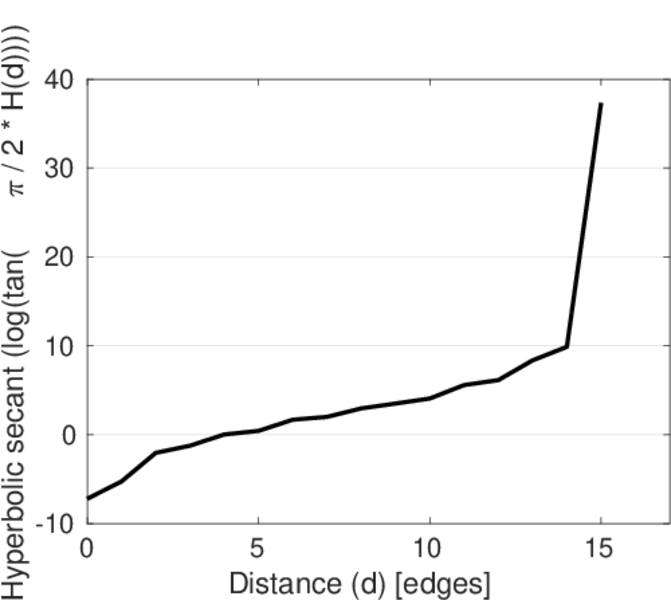
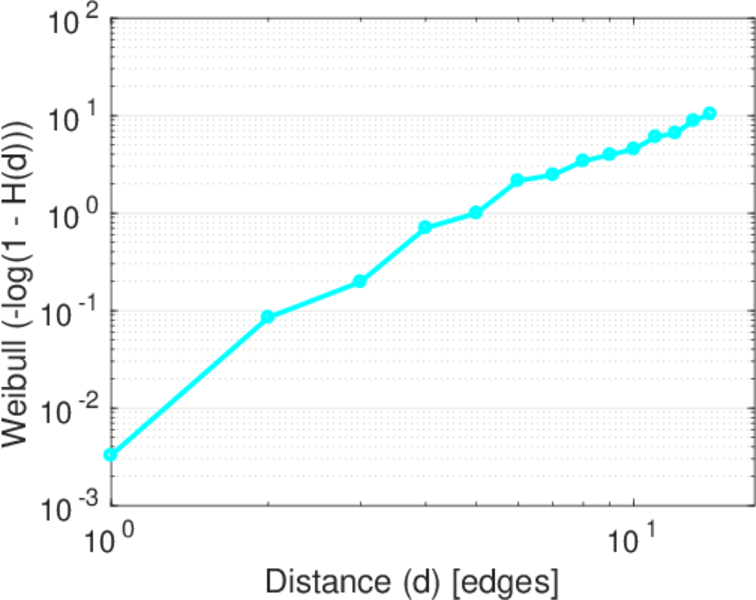
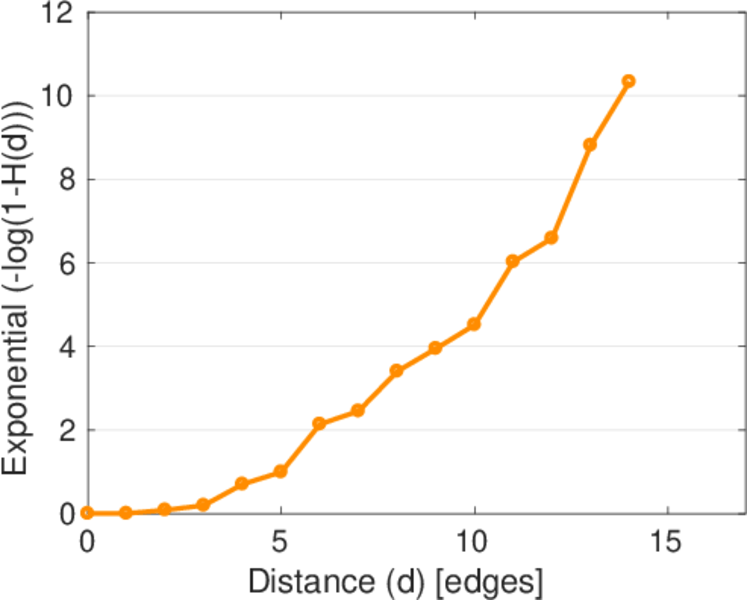
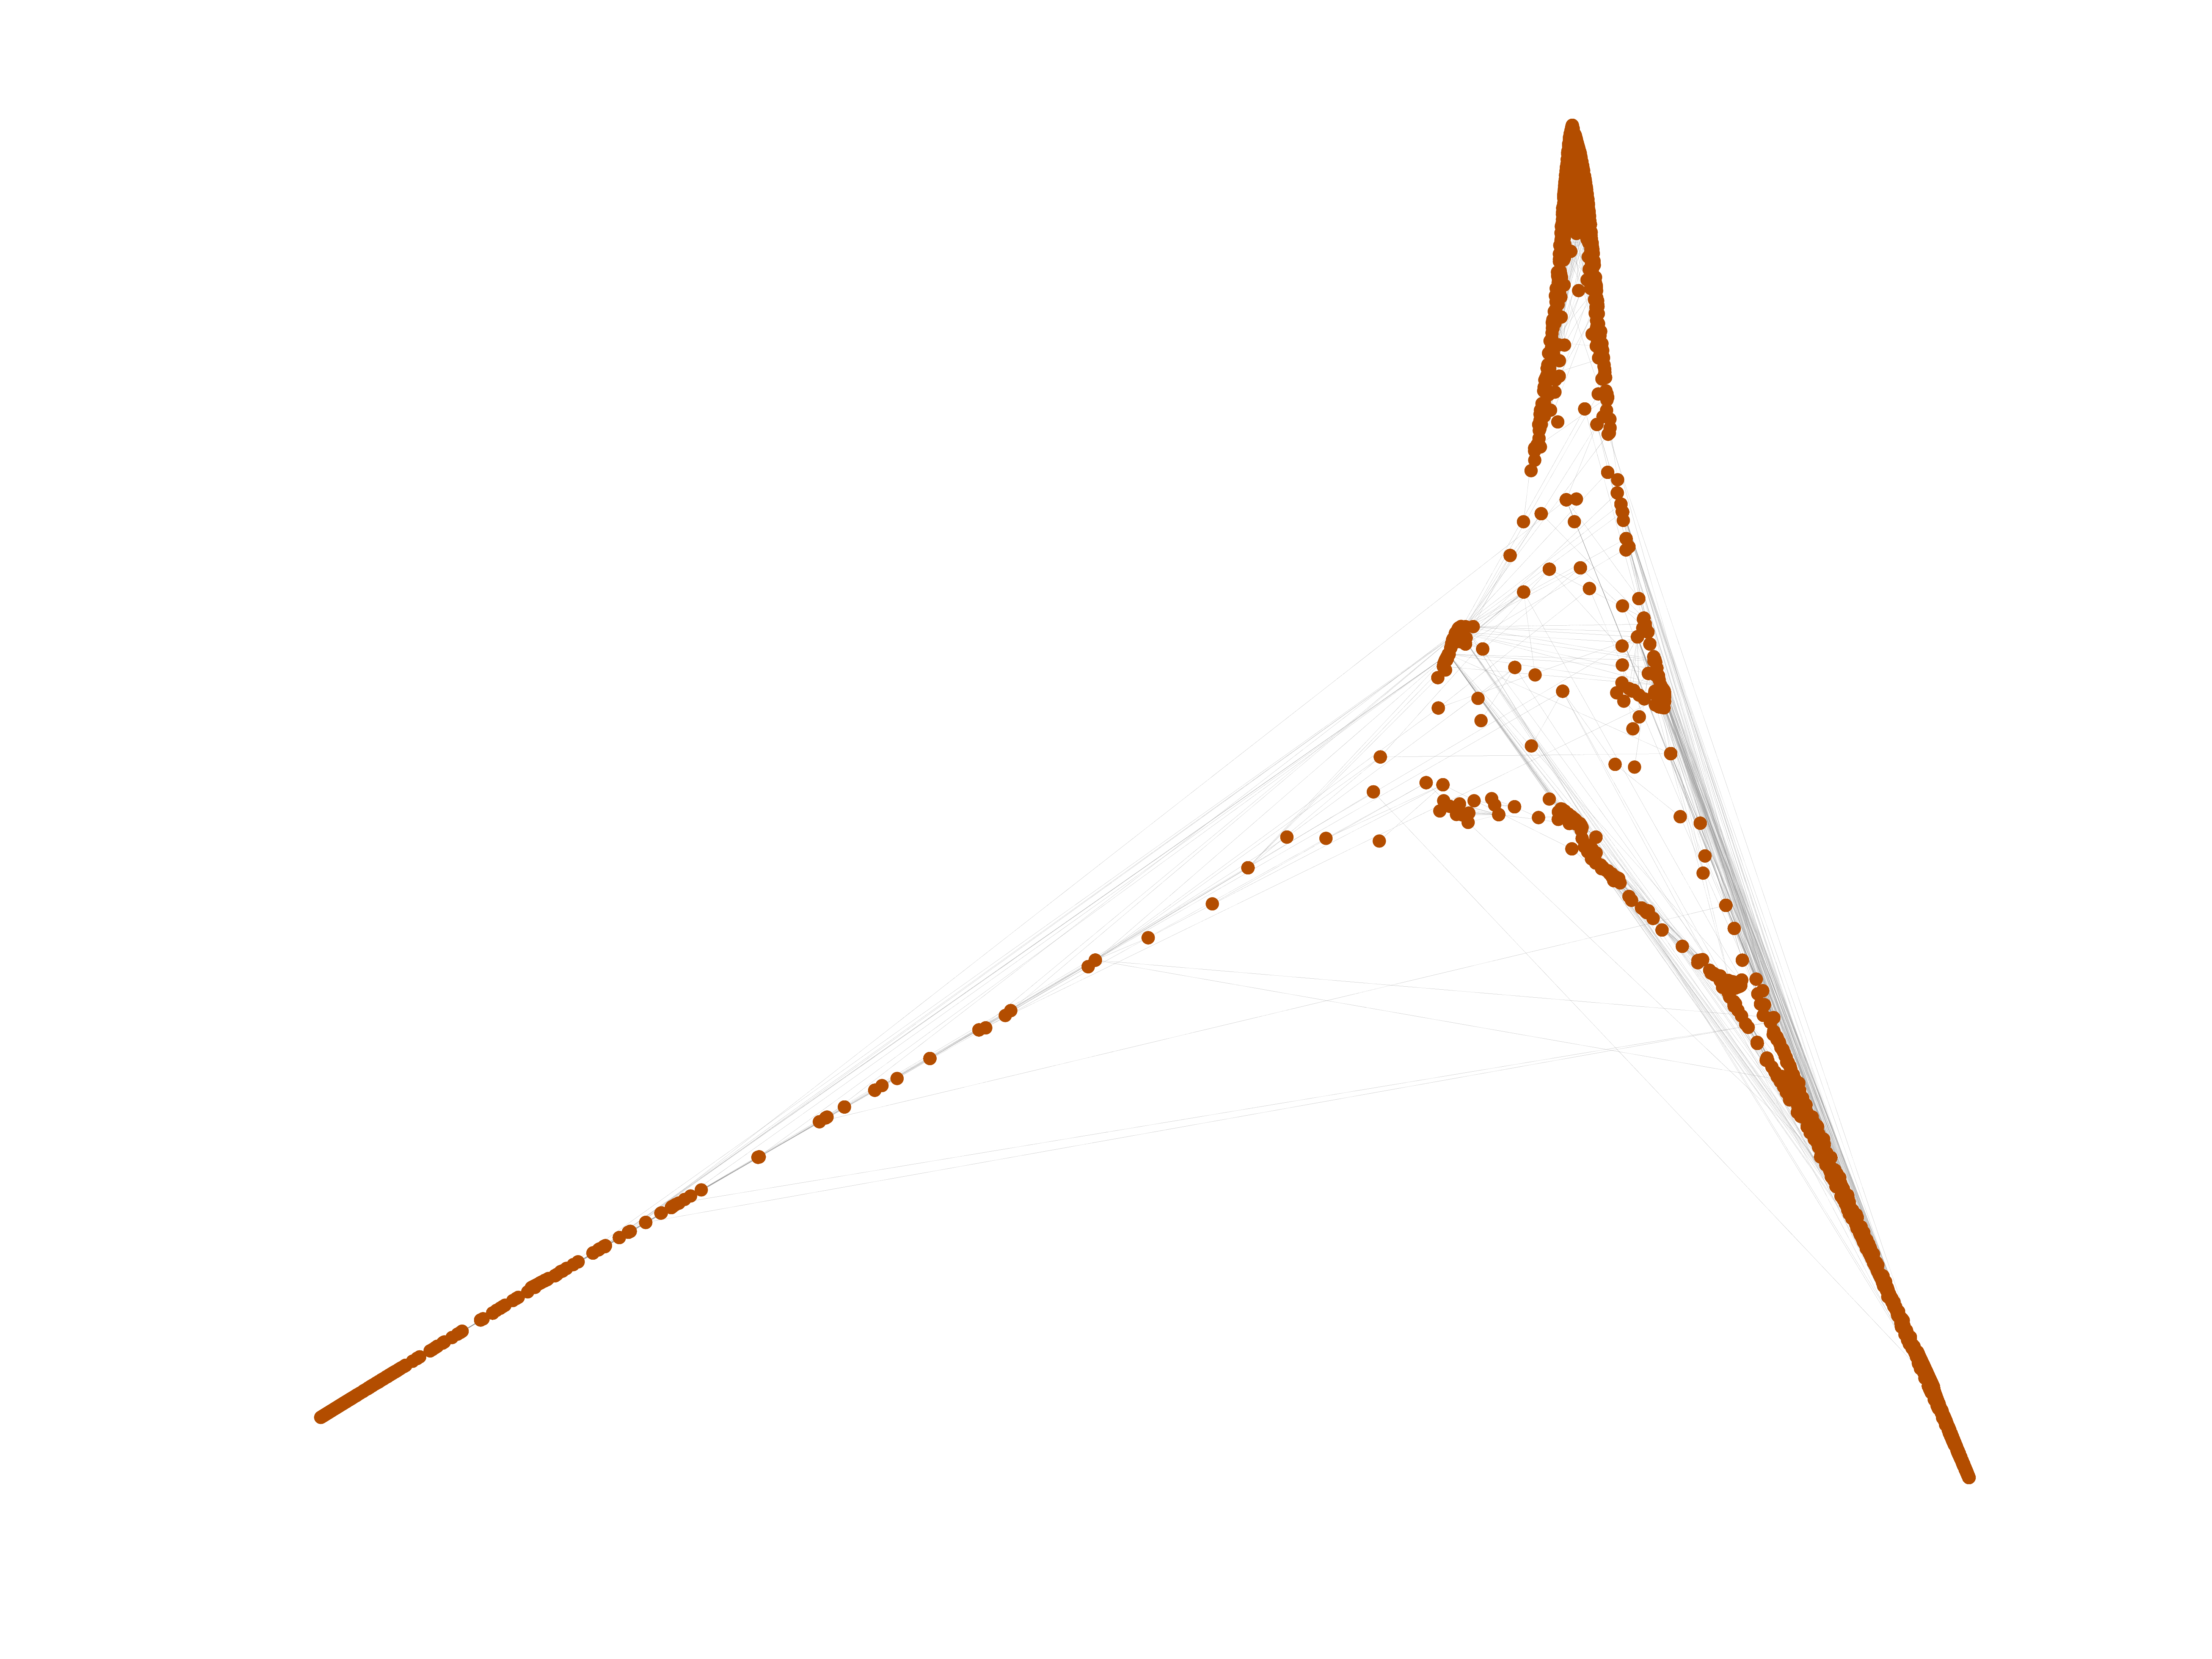
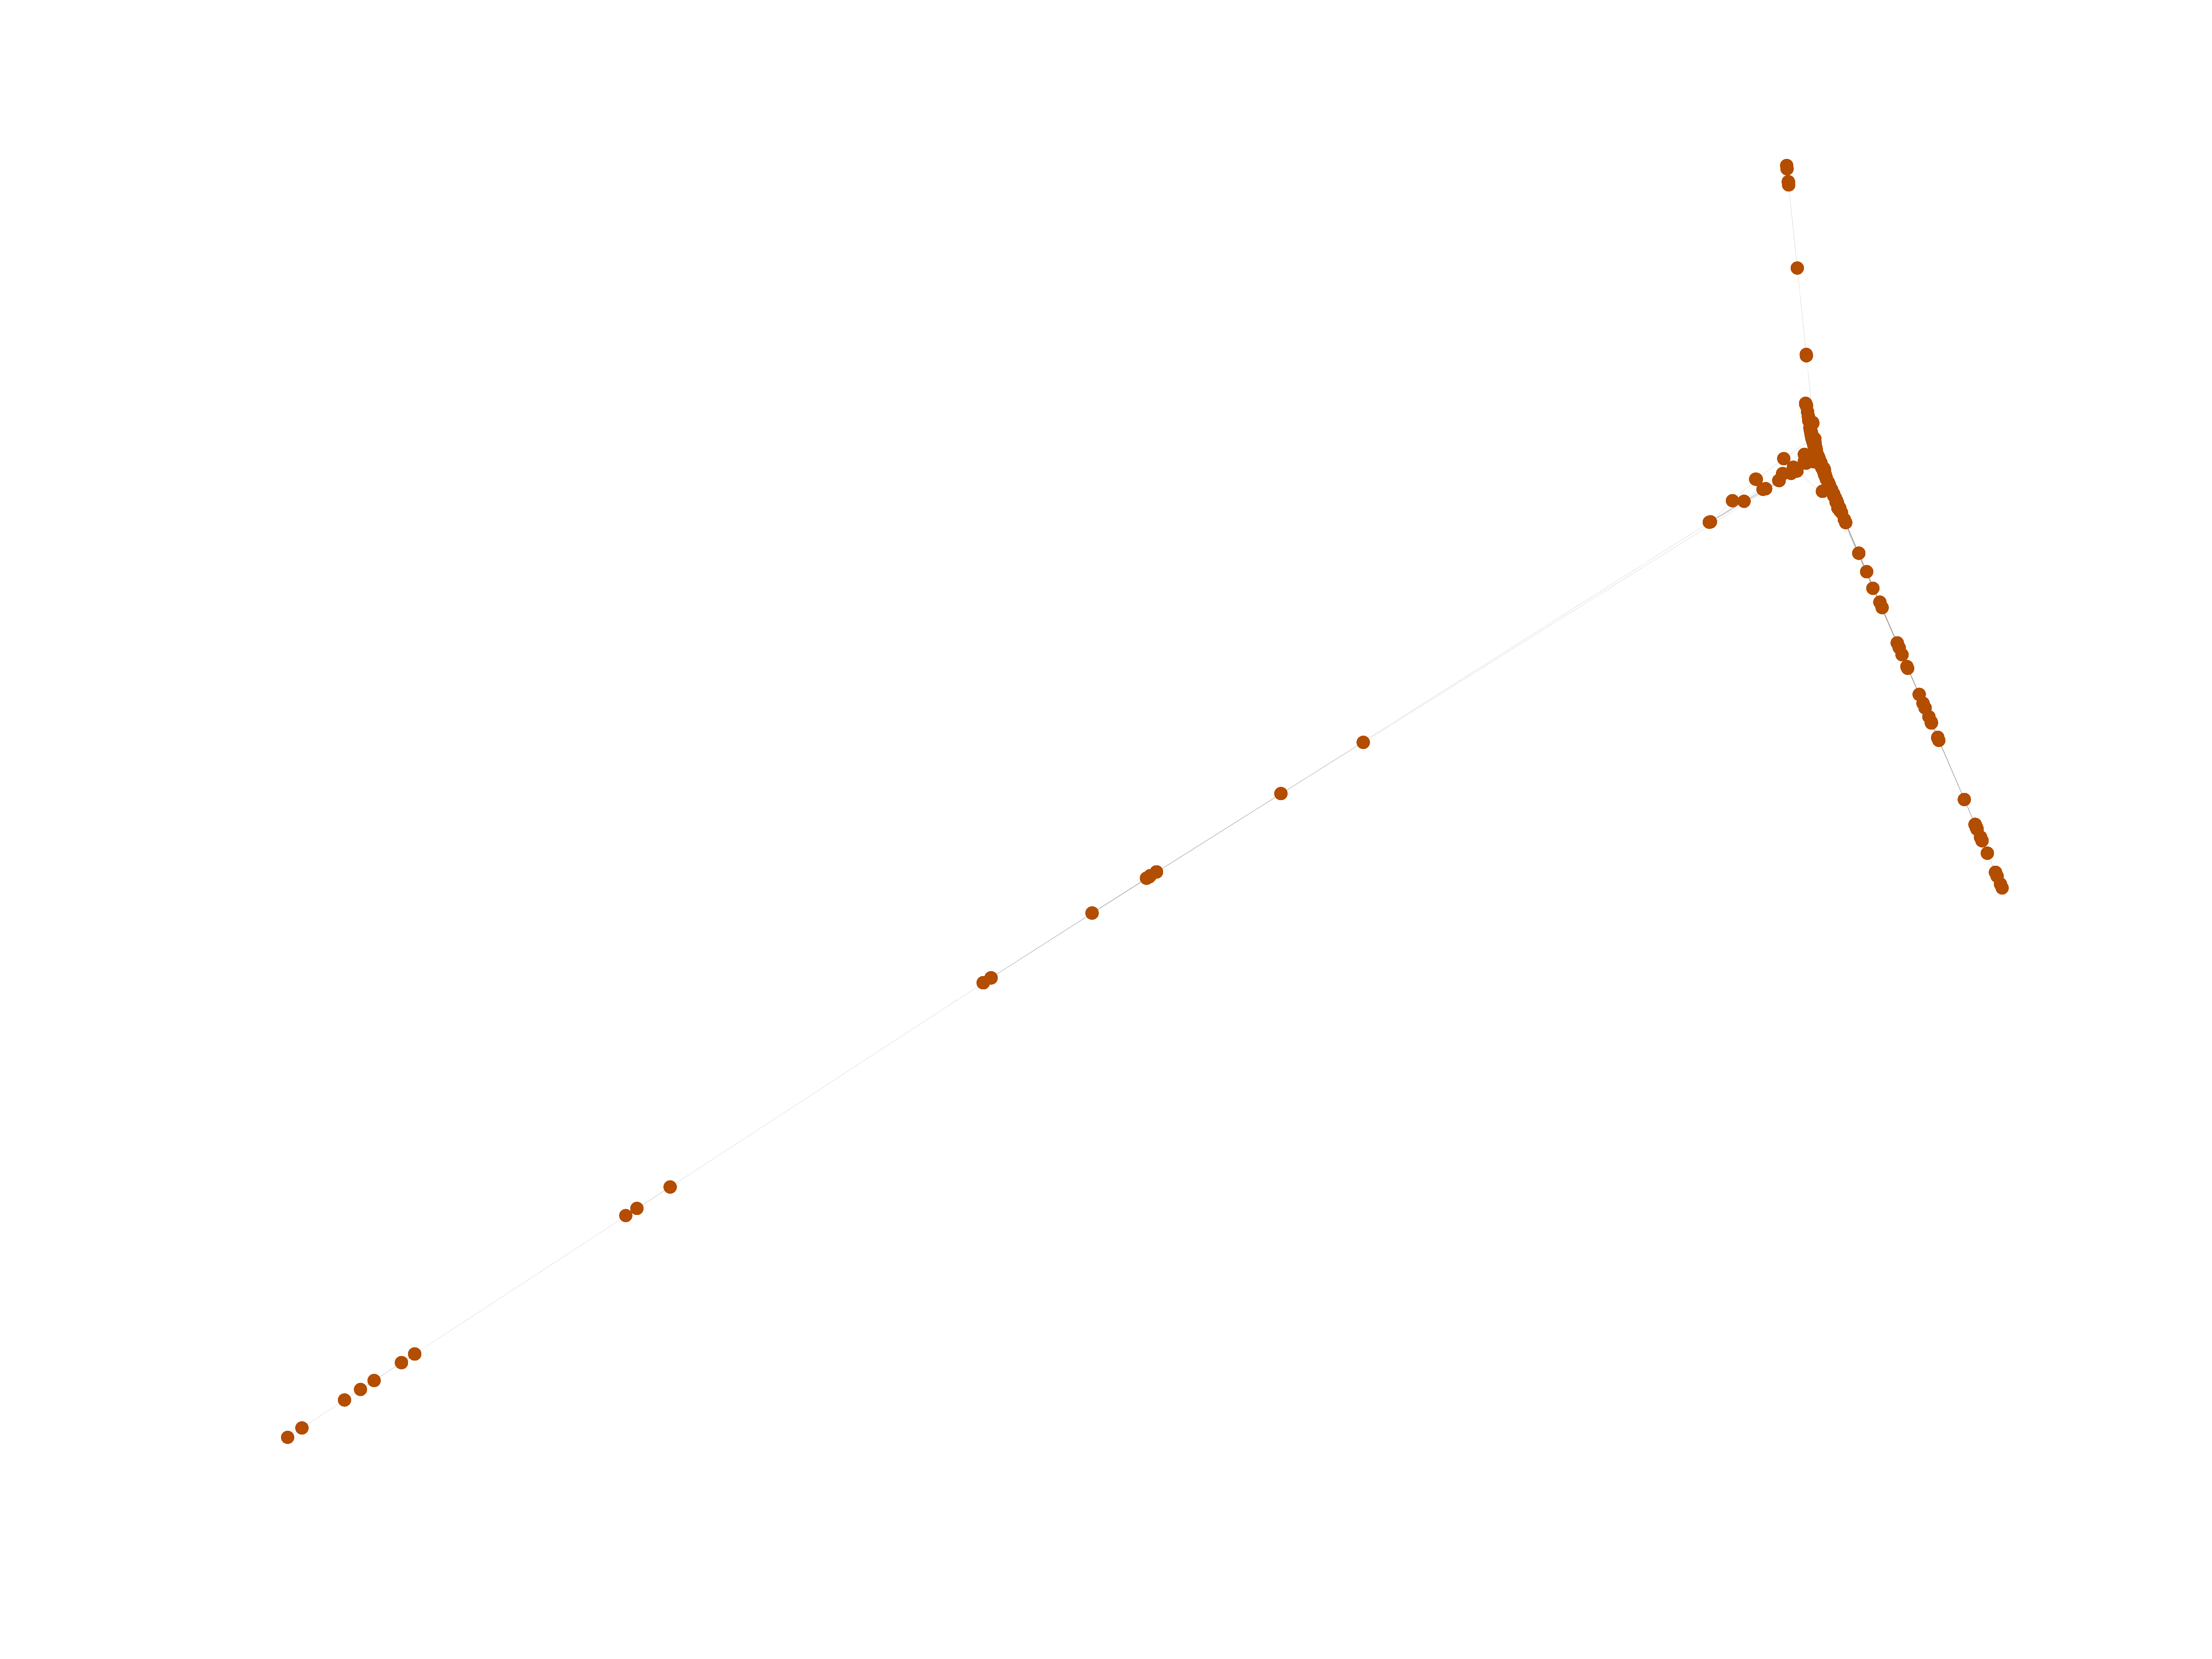
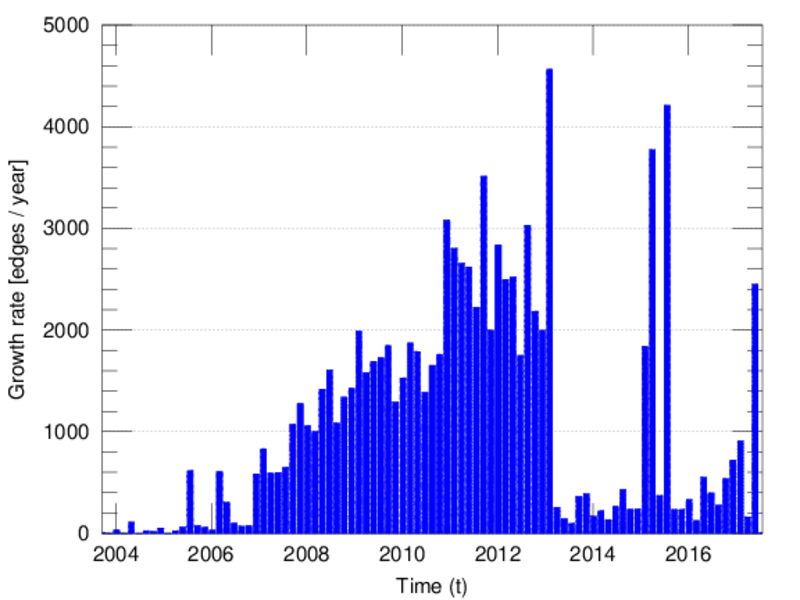
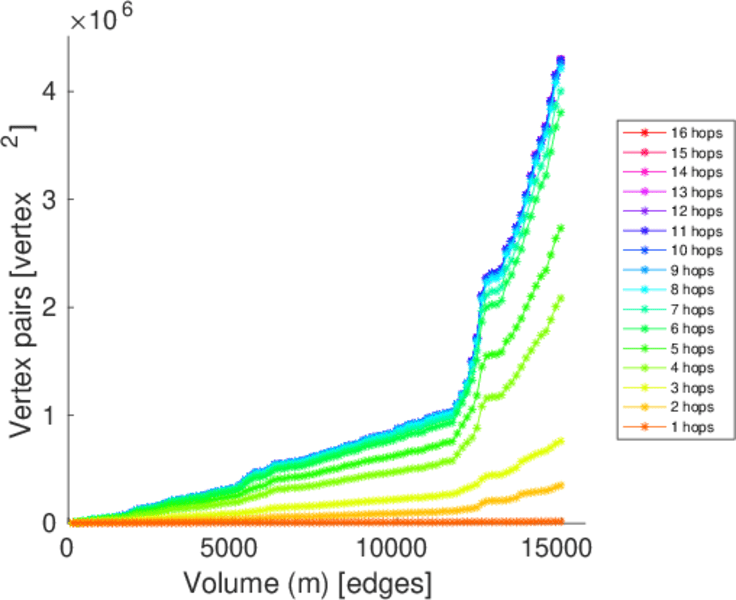
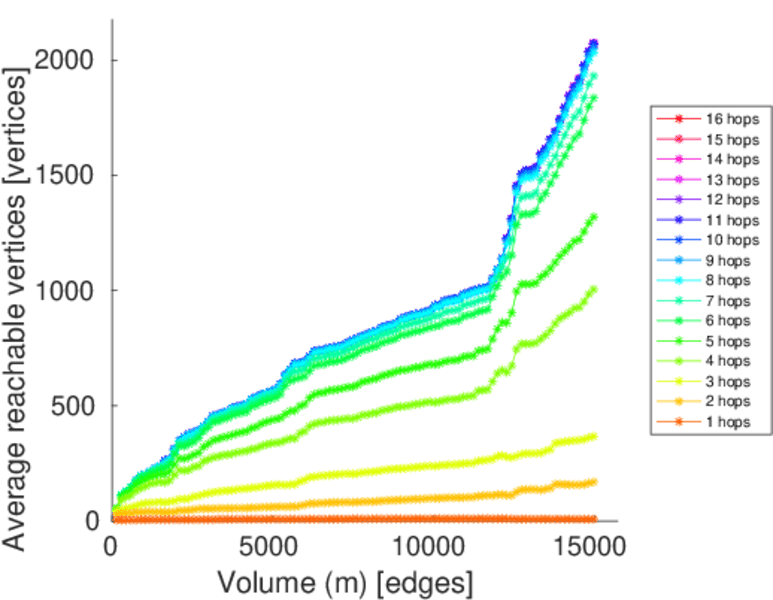
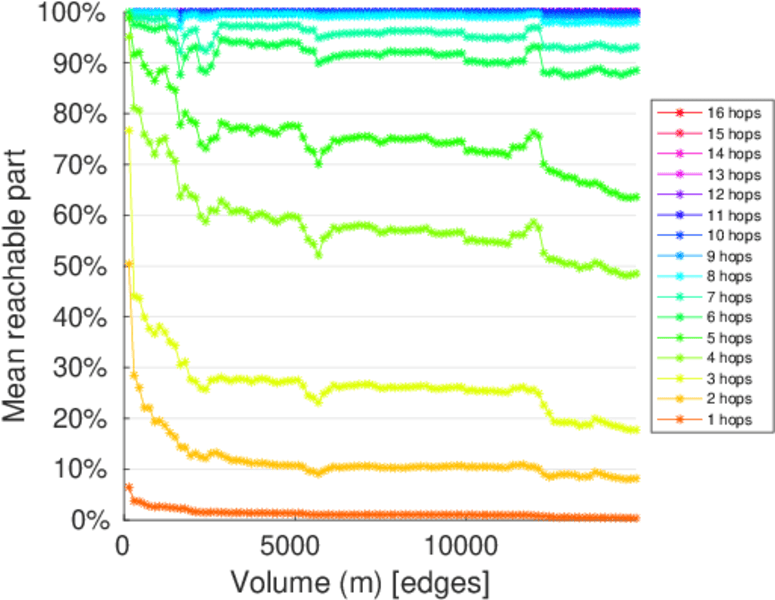
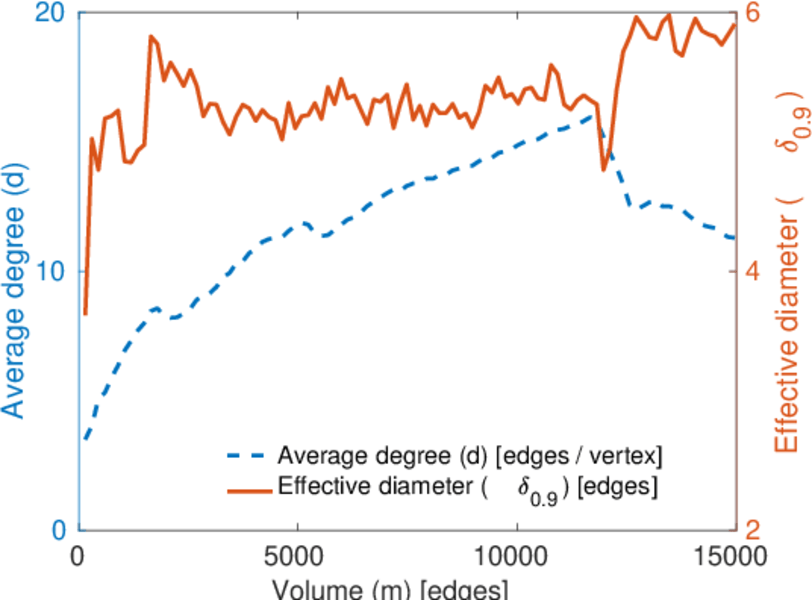
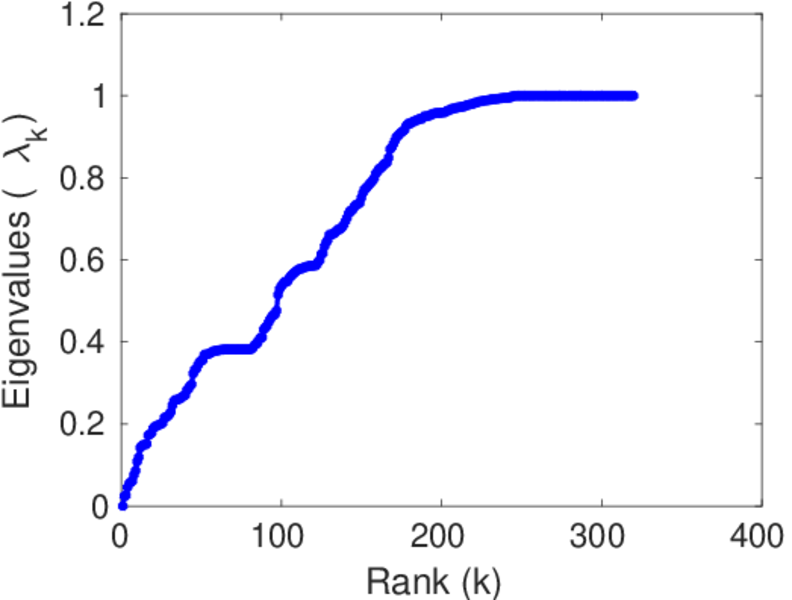
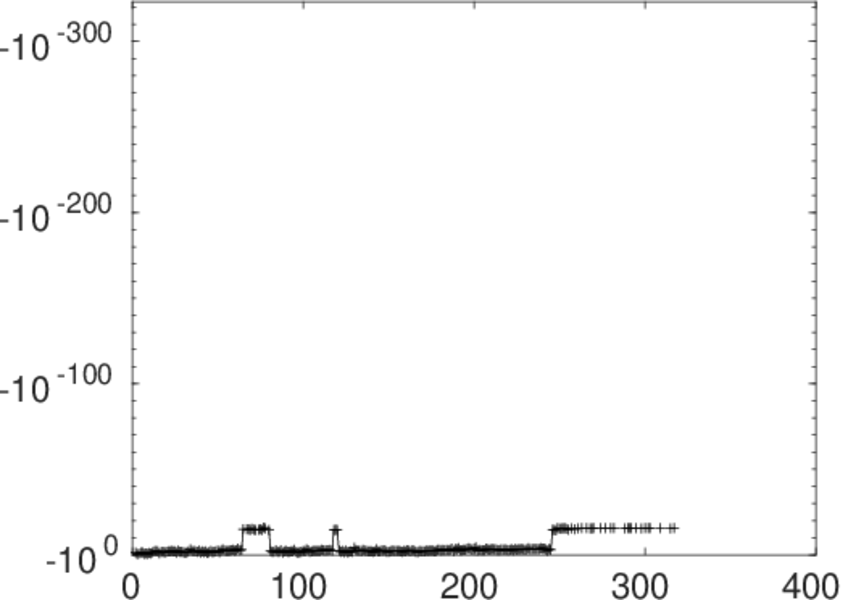
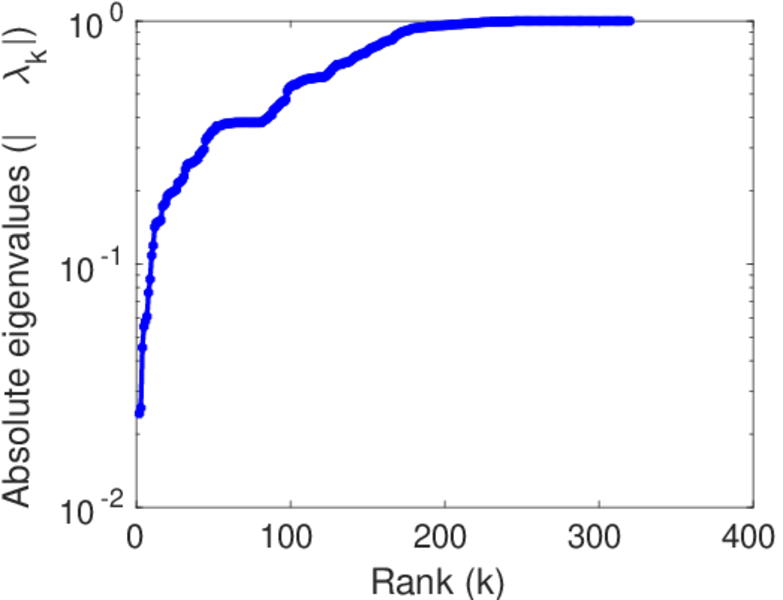
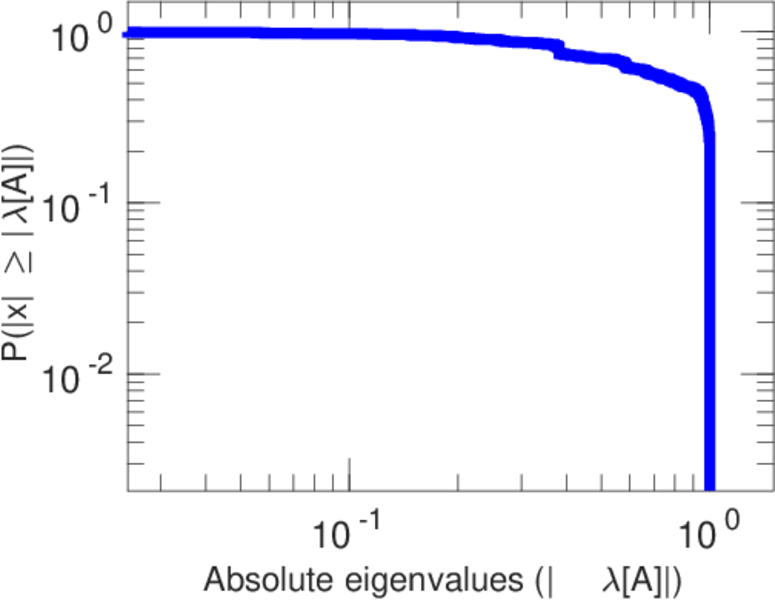
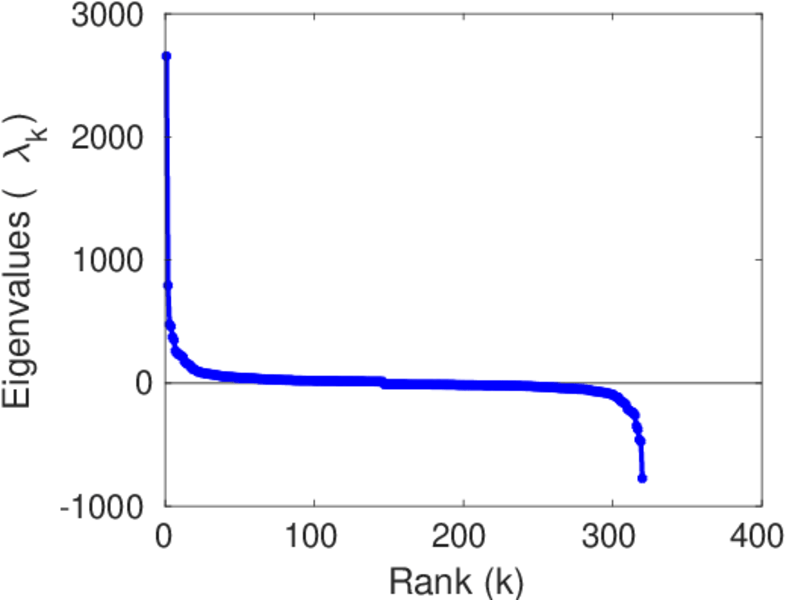
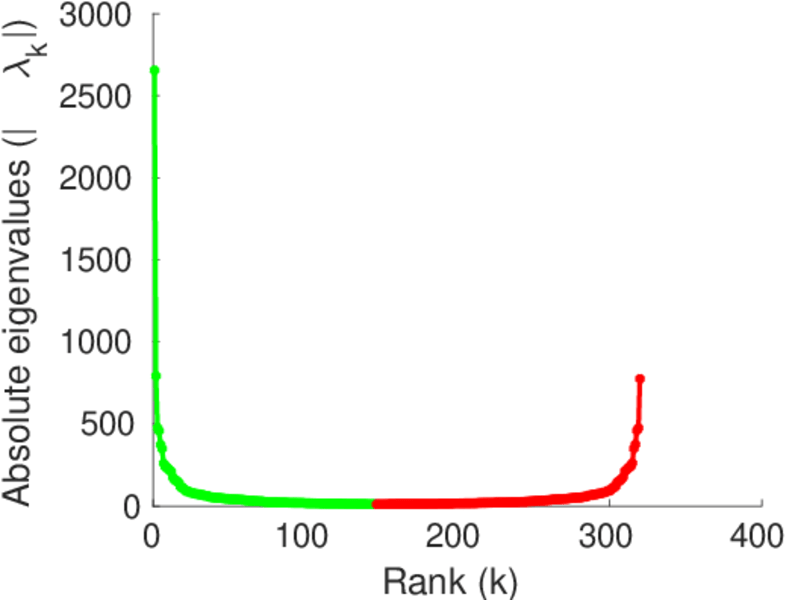
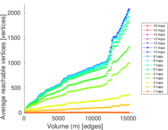
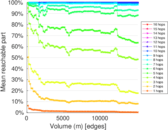
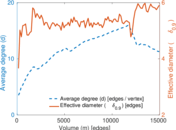
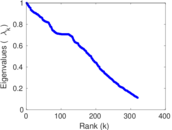
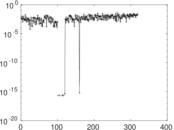
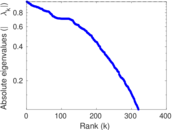
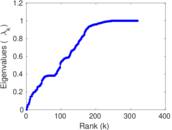
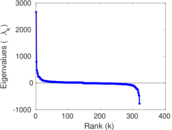
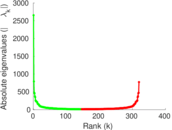
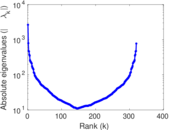
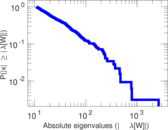
Plots


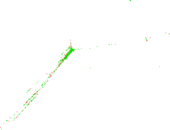
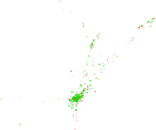


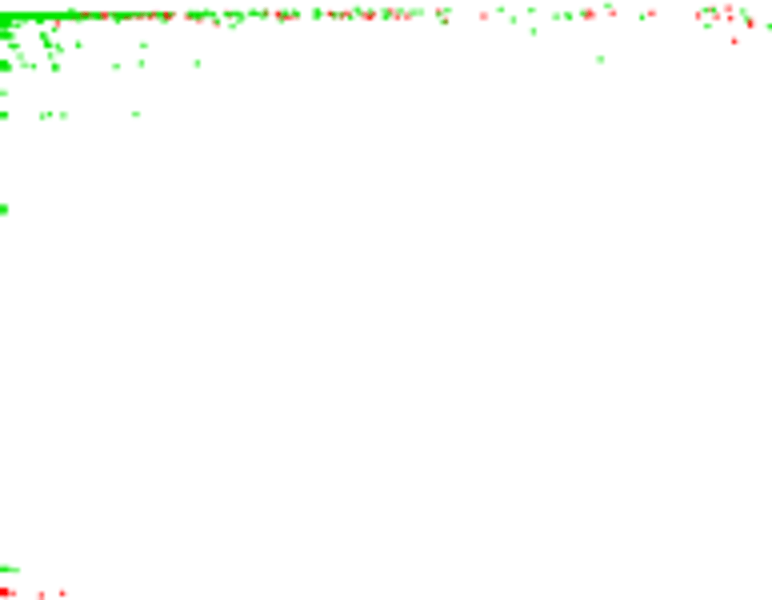
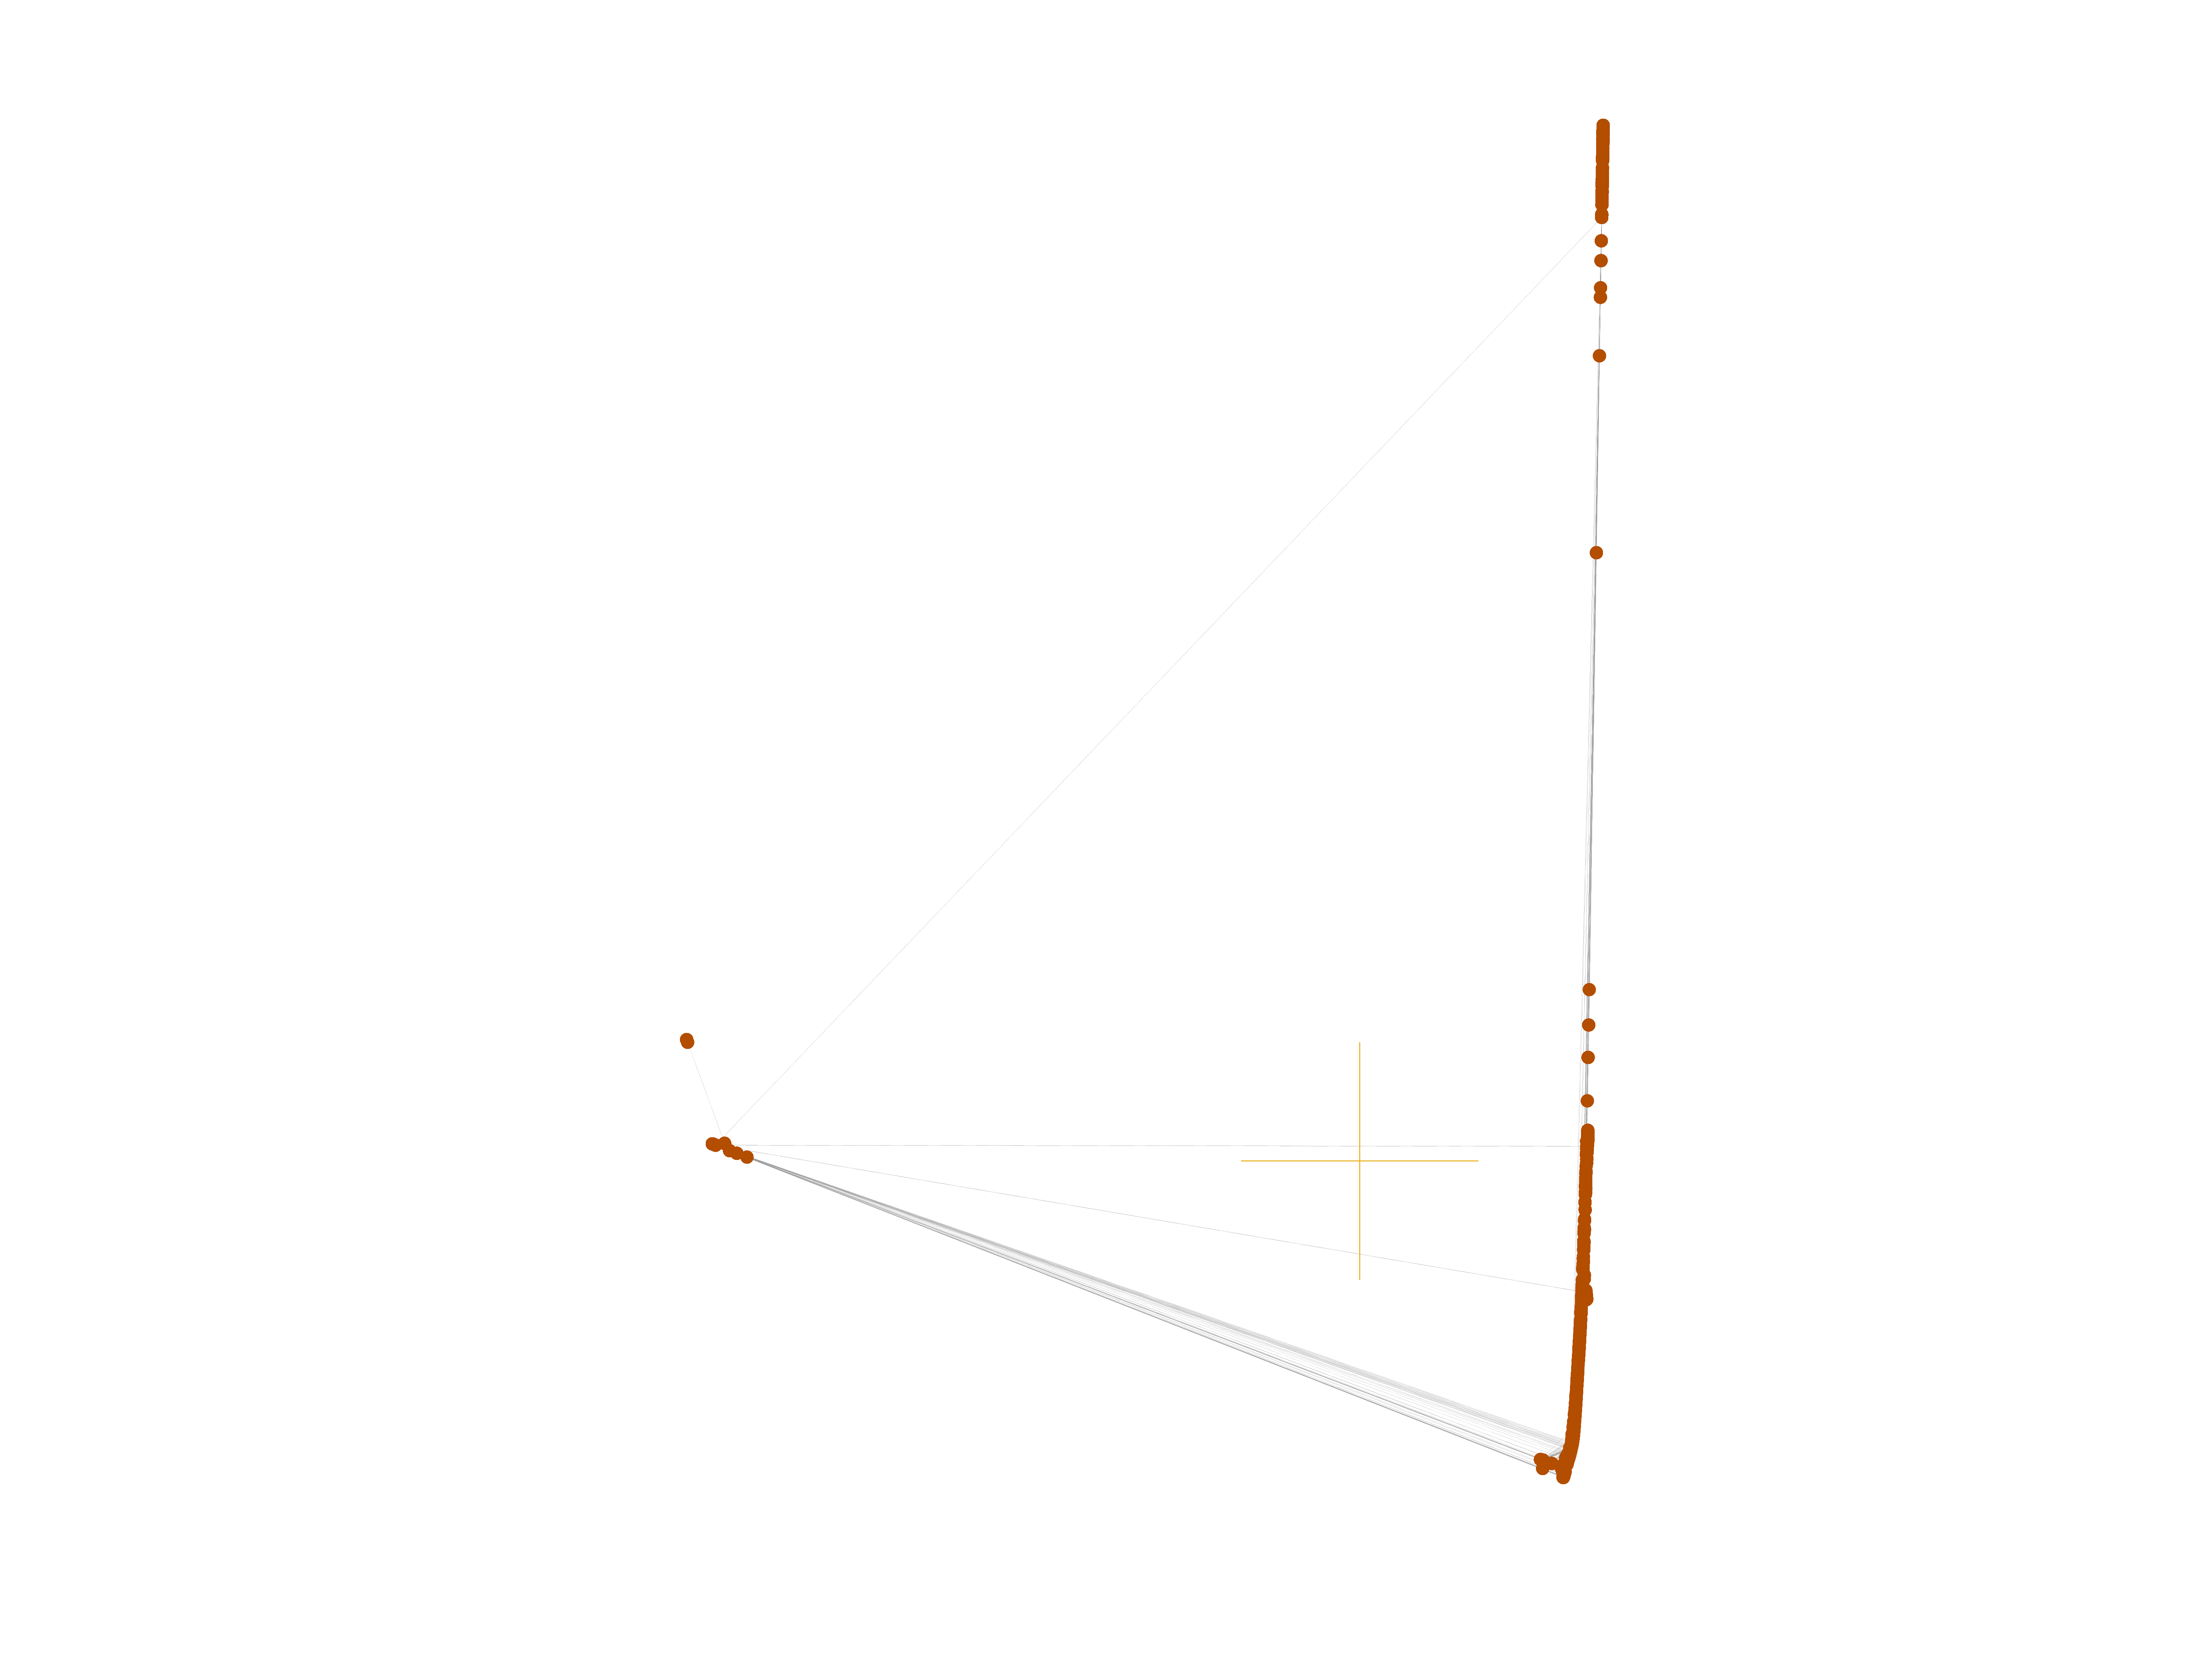
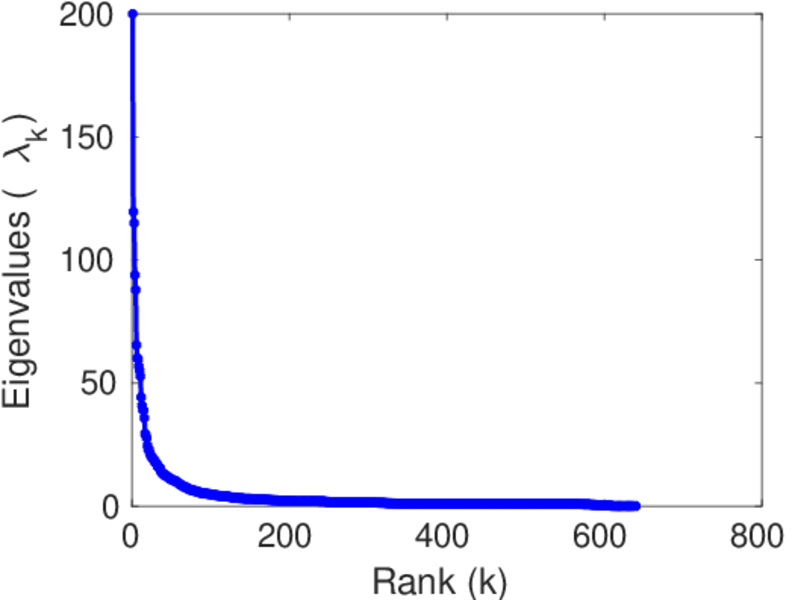
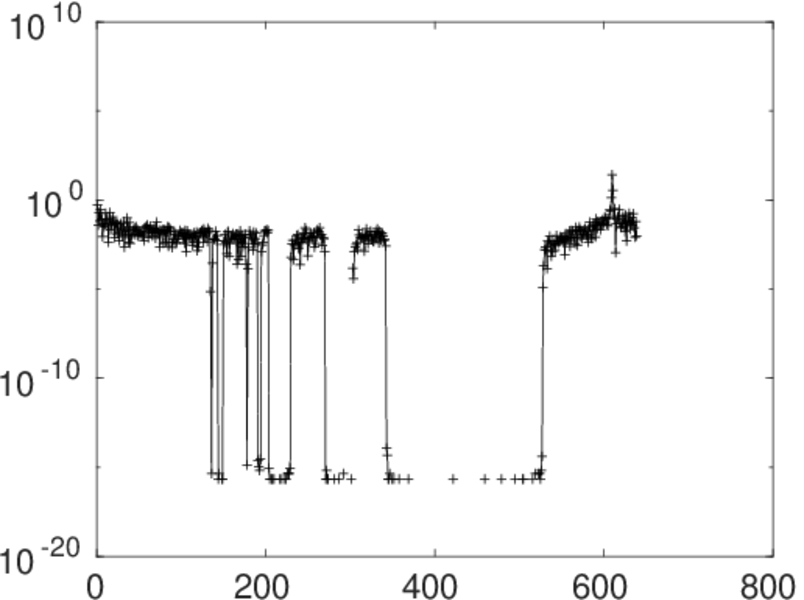
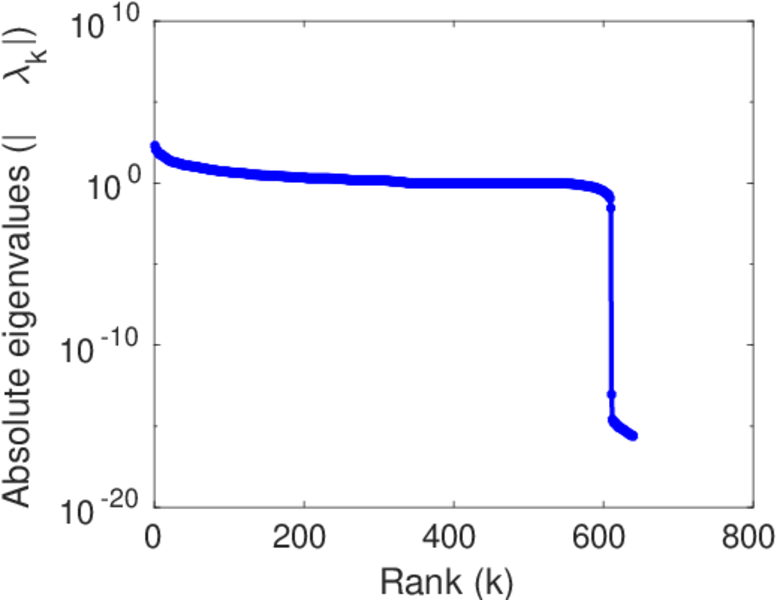
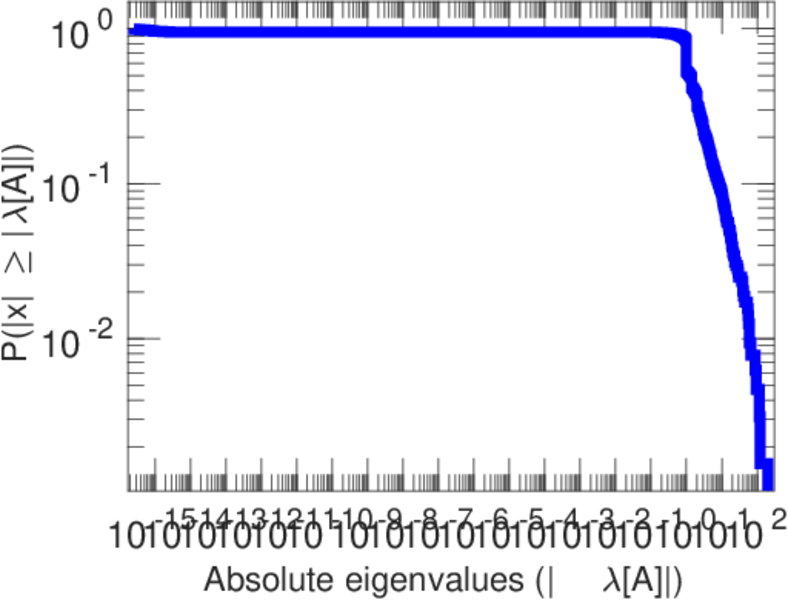
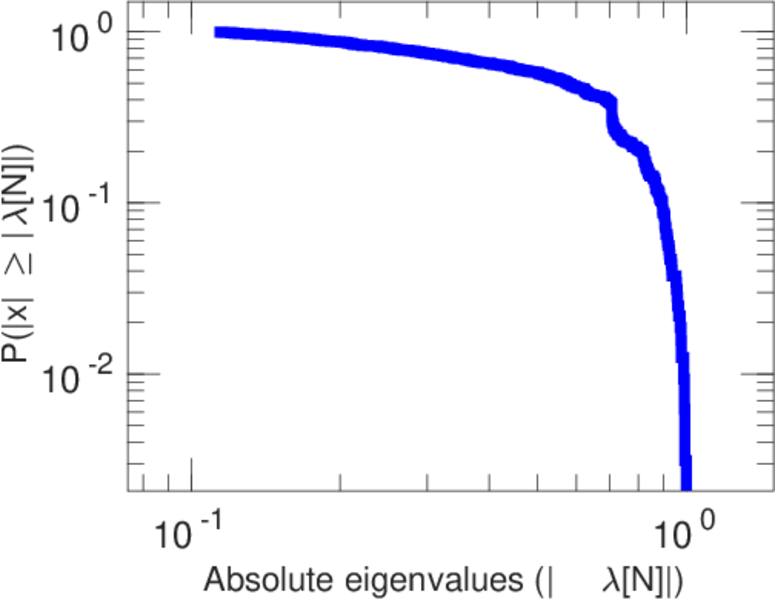
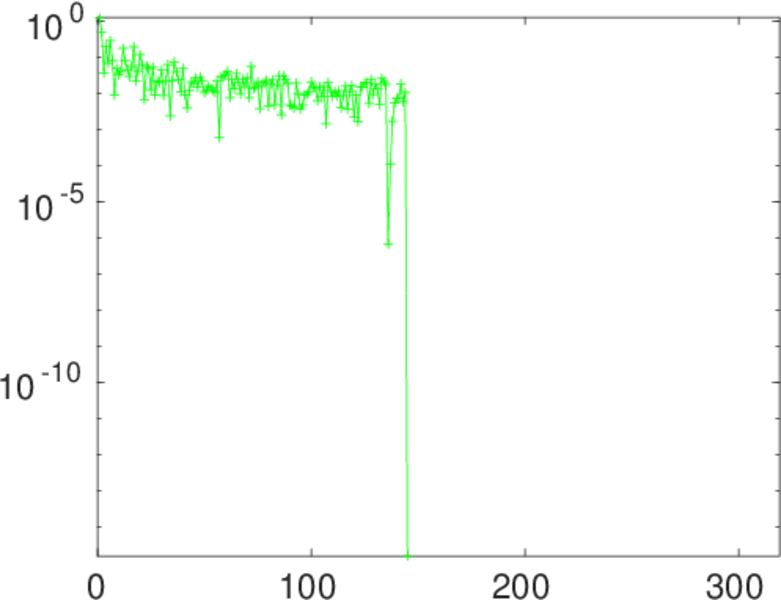
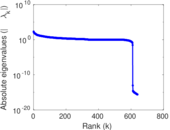
Matrix decompositions plots


Downloads
References
|
[1]
|
Jérôme Kunegis.
KONECT – The Koblenz Network Collection.
In Proc. Int. Conf. on World Wide Web Companion, pages
1343–1350, 2013.
[ http ]
|
|
[2]
|
Wikimedia Foundation.
Wikimedia downloads.
http://dumps.wikimedia.org/, January 2010.
|
 KONECT ‣ Networks ‣
Buy Me a Coffee
KONECT ‣ Networks ‣
Buy Me a Coffee