Wikipedia edits (su)
This is the bipartite edit network of the Sundanese Wikipedia. It contains
users and pages from the Sundanese Wikipedia, connected by edit events. Each
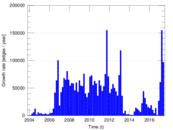
edge represents an edit. The dataset includes the timestamp of each edit.
Metadata
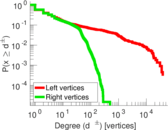
Statistics
| Size | n = | 68,354
|
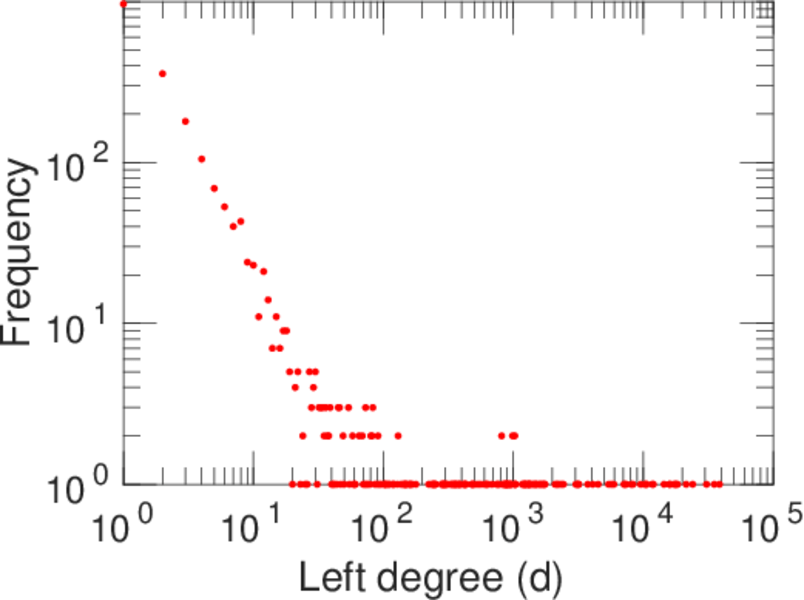
| Left size | n1 = | 2,204
|
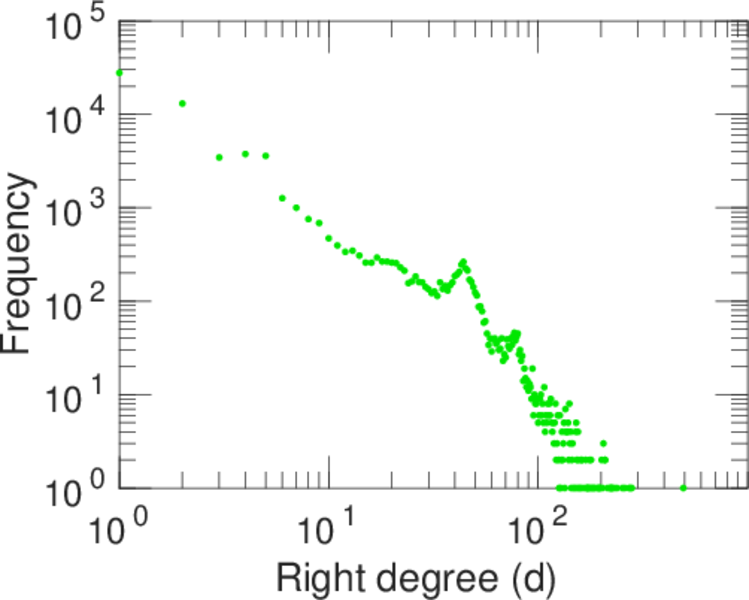
| Right size | n2 = | 66,150
|
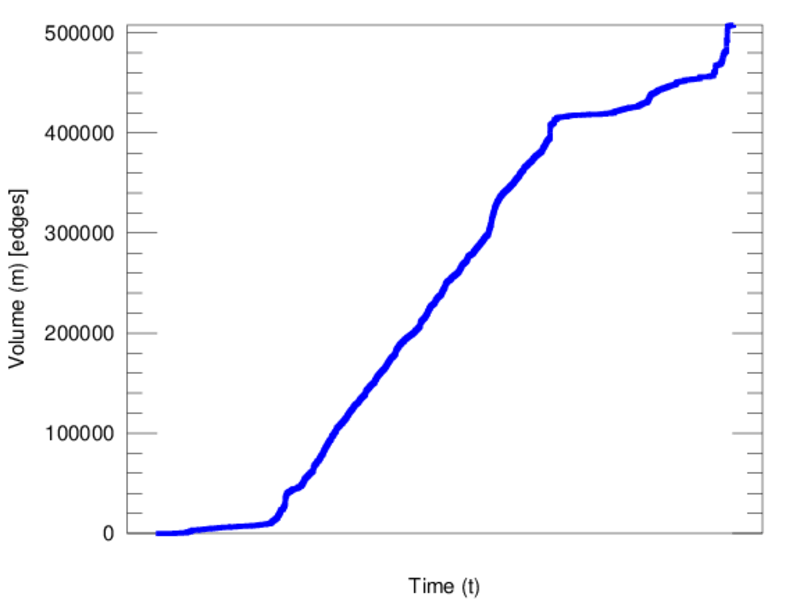
| Volume | m = | 507,845
|
| Unique edge count | m̿ = | 271,504
|
| Wedge count | s = | 1,048,343,059
|
| Claw count | z = | 4,404,651,504,978
|
| Cross count | x = | 16,485,637,718,082,306
|
| Square count | q = | 1,496,409,374
|
| 4-Tour count | T4 = | 16,165,211,584
|
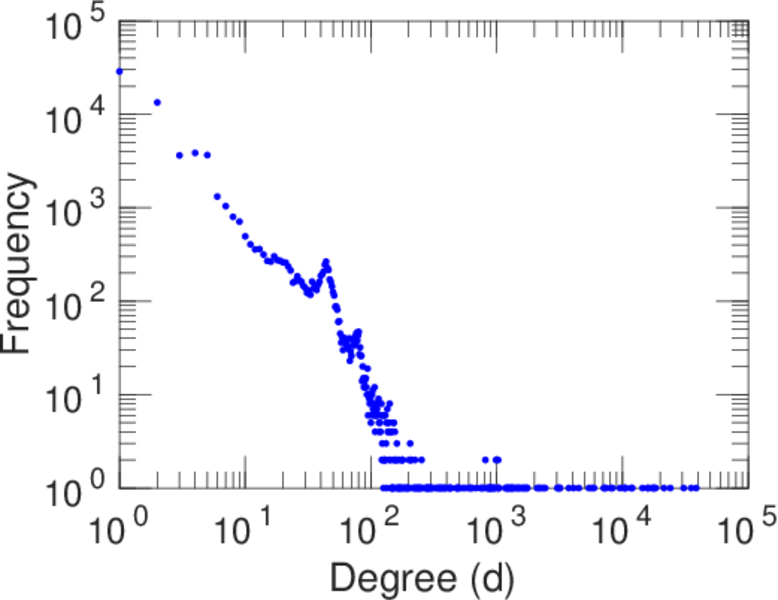
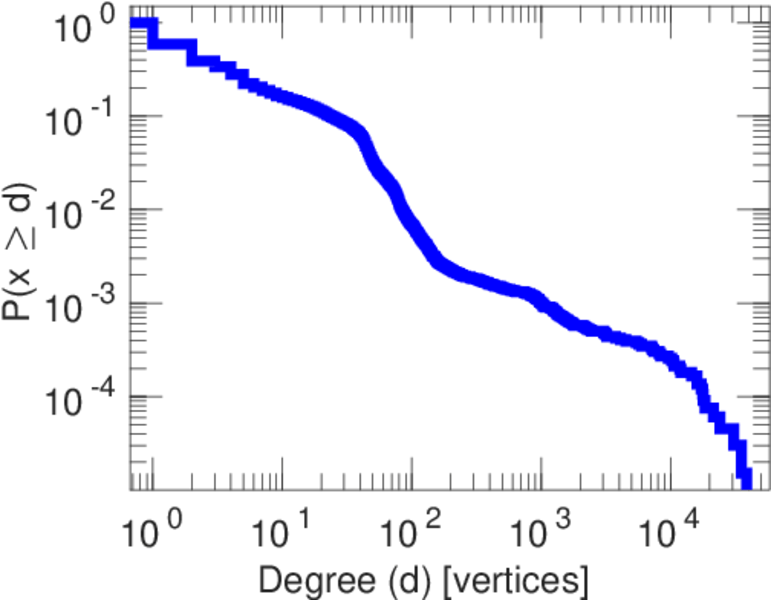
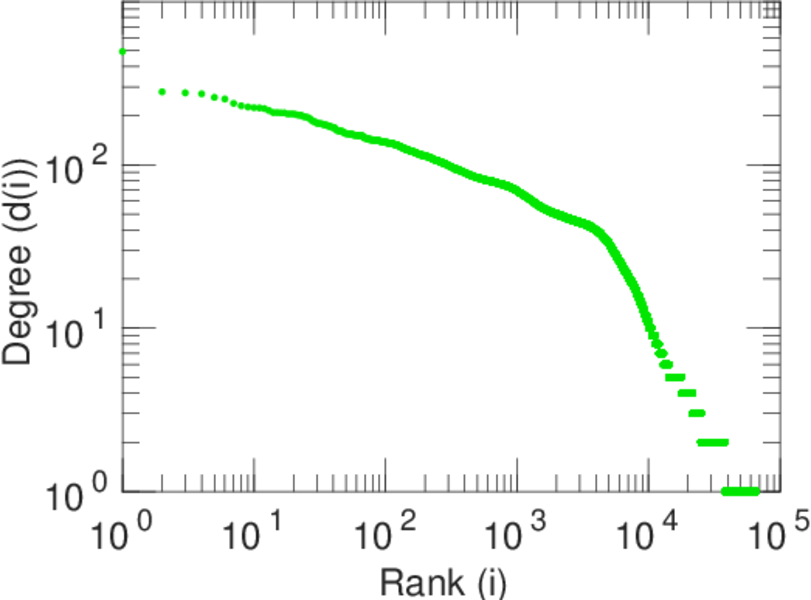
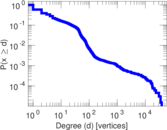
| Maximum degree | dmax = | 38,623
|
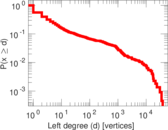
| Maximum left degree | d1max = | 38,623
|
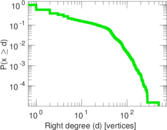
| Maximum right degree | d2max = | 494
|
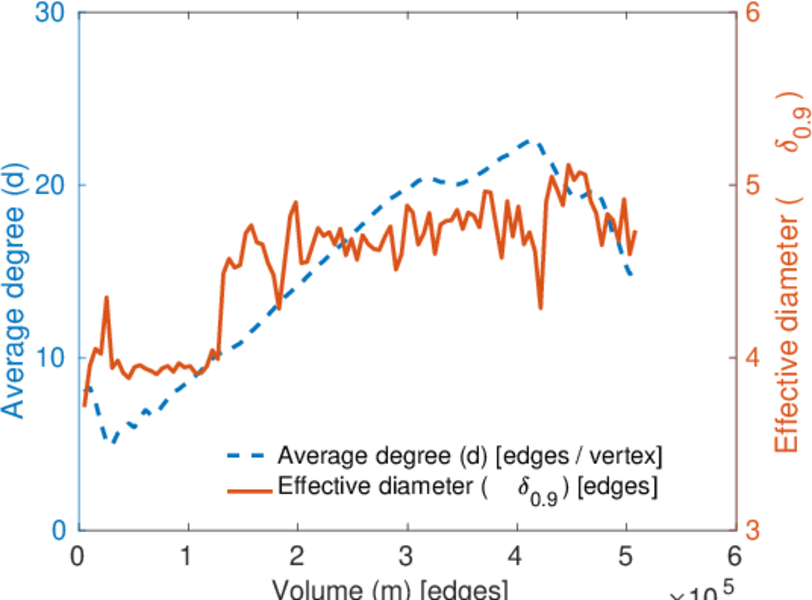
| Average degree | d = | 14.859 3
|
| Average left degree | d1 = | 230.420
|
| Average right degree | d2 = | 7.677 17
|
| Fill | p = | 0.001 862 24
|
| Average edge multiplicity | m̃ = | 1.870 49
|
| Size of LCC | N = | 67,268
|
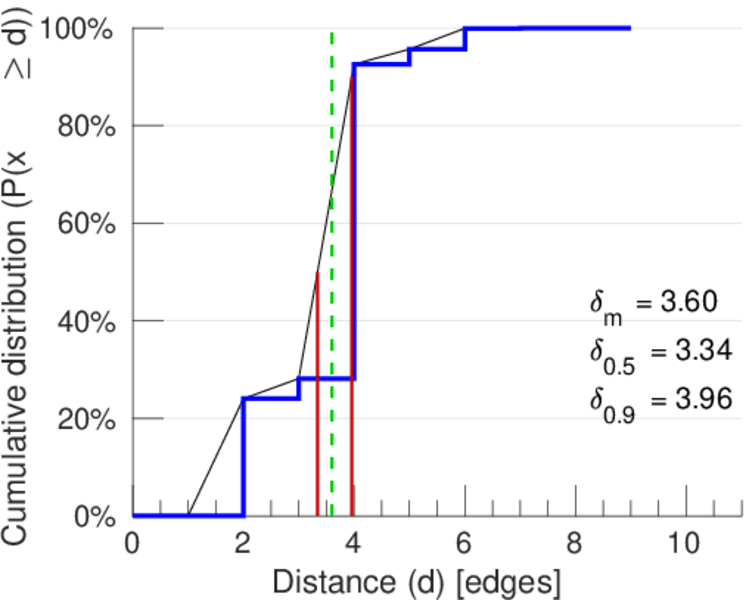
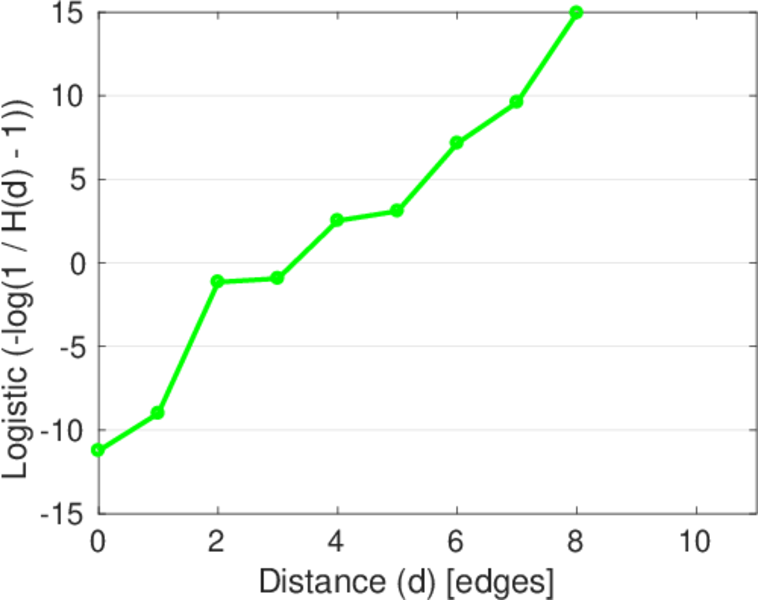
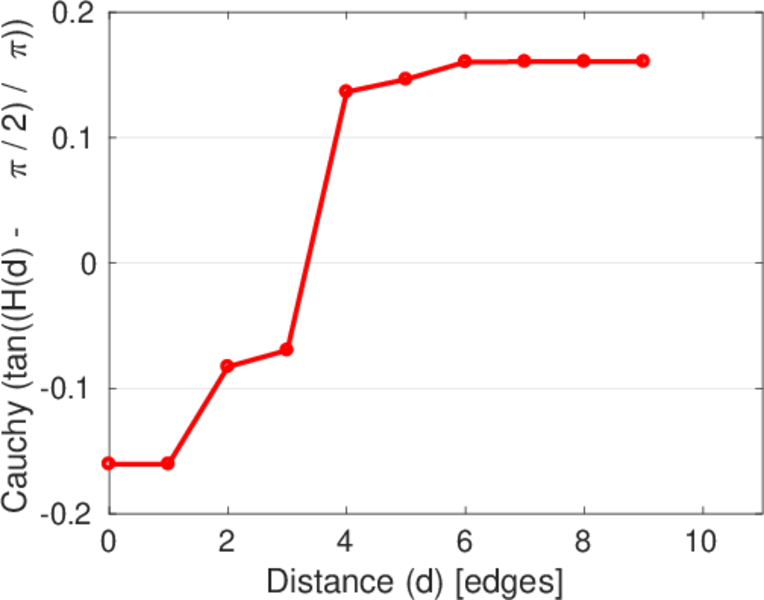
| Diameter | δ = | 11
|
| 50-Percentile effective diameter | δ0.5 = | 3.339 16
|
| 90-Percentile effective diameter | δ0.9 = | 3.960 06
|
| Median distance | δM = | 4
|
| Mean distance | δm = | 3.596 68
|
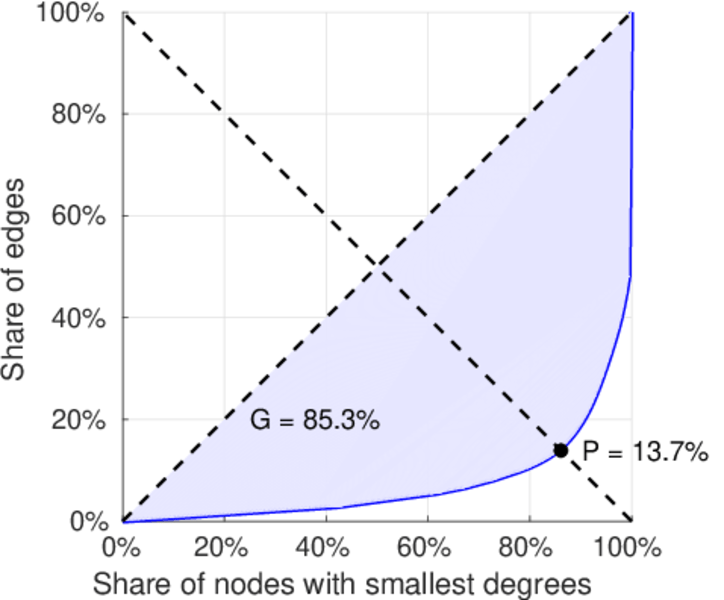
| Gini coefficient | G = | 0.853 916
|
| Balanced inequality ratio | P = | 0.137 428
|
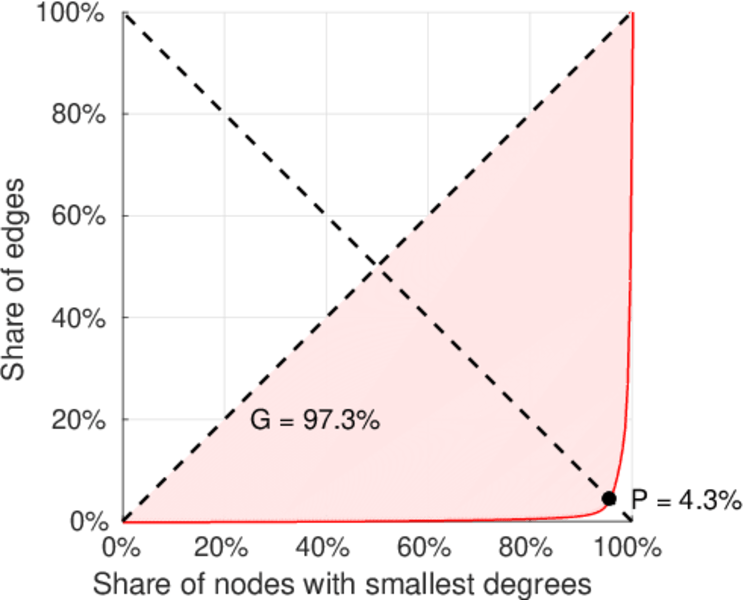
| Left balanced inequality ratio | P1 = | 0.043 066 3
|
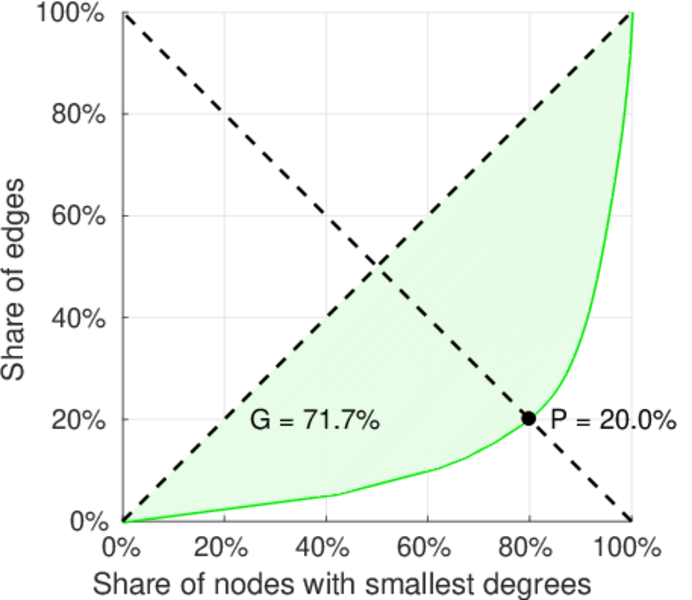
| Right balanced inequality ratio | P2 = | 0.200 364
|
| Relative edge distribution entropy | Her = | 0.717 082
|
| Power law exponent | γ = | 2.251 20
|
| Tail power law exponent | γt = | 1.941 00
|
| Tail power law exponent with p | γ3 = | 1.941 00
|
| p-value | p = | 0.000 00
|
| Left tail power law exponent with p | γ3,1 = | 1.711 00
|
| Left p-value | p1 = | 0.000 00
|
| Right tail power law exponent with p | γ3,2 = | 8.911 00
|
| Right p-value | p2 = | 0.919 000
|
| Degree assortativity | ρ = | −0.413 950
|
| Degree assortativity p-value | pρ = | 0.000 00
|
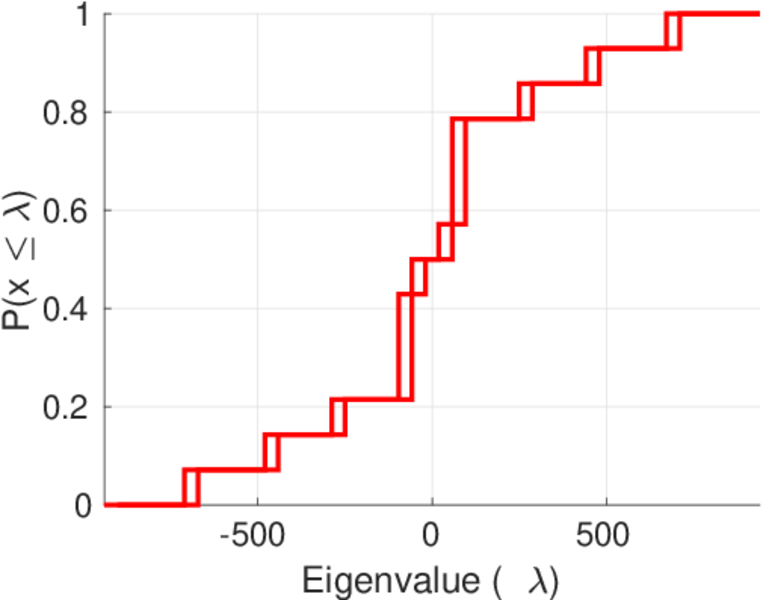
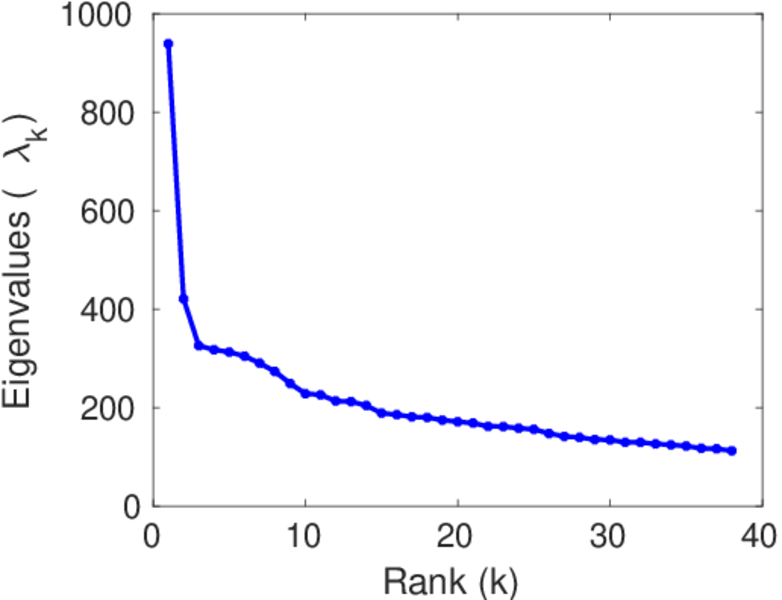
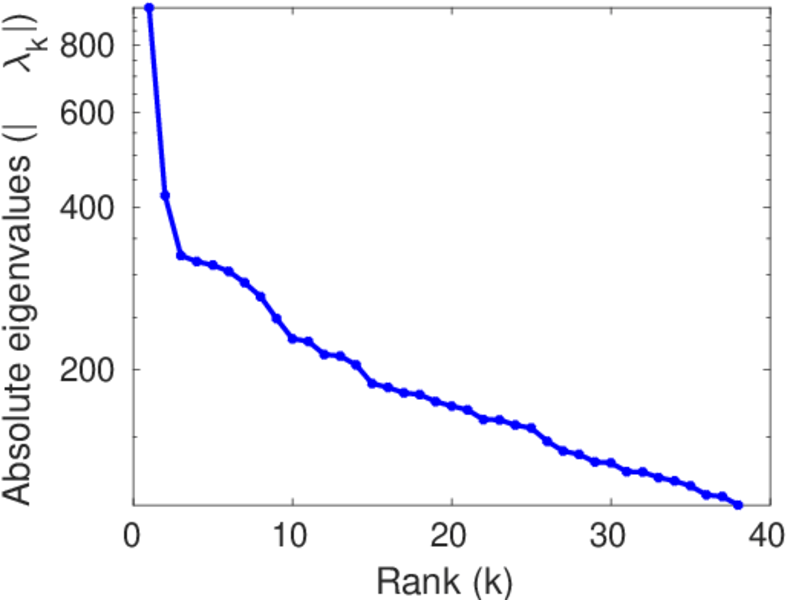
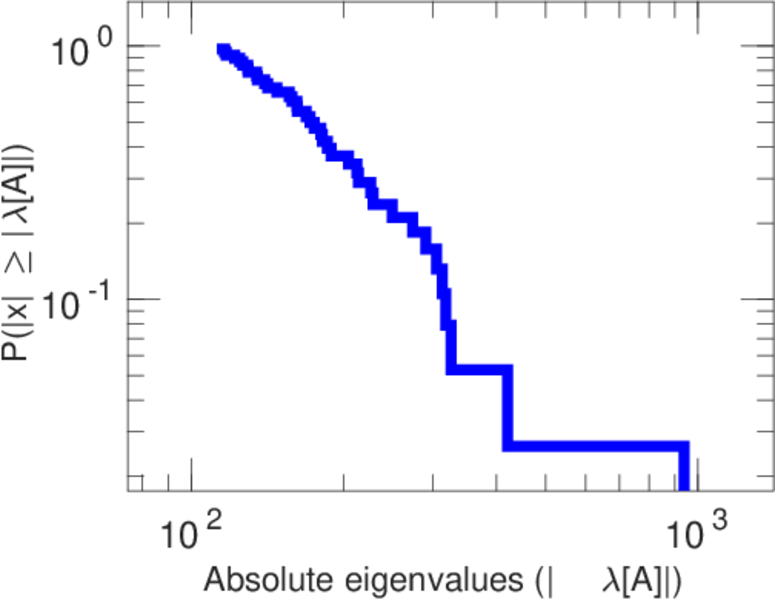
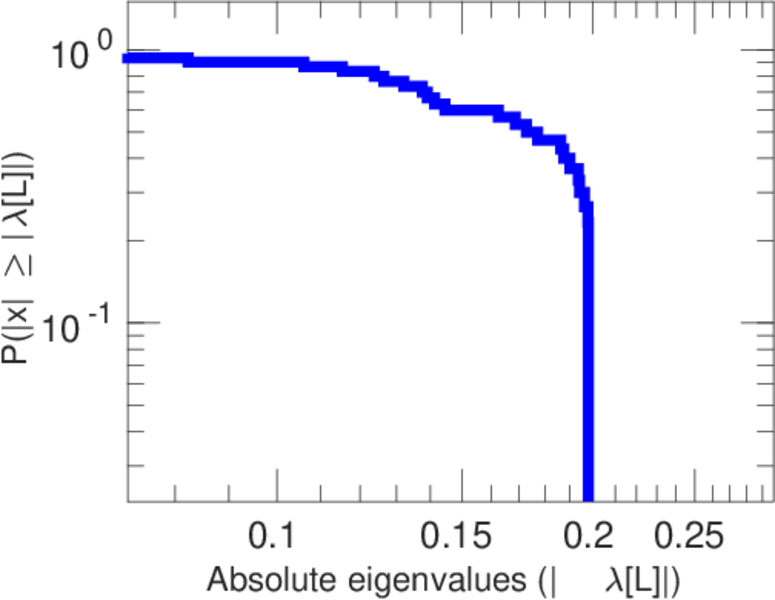
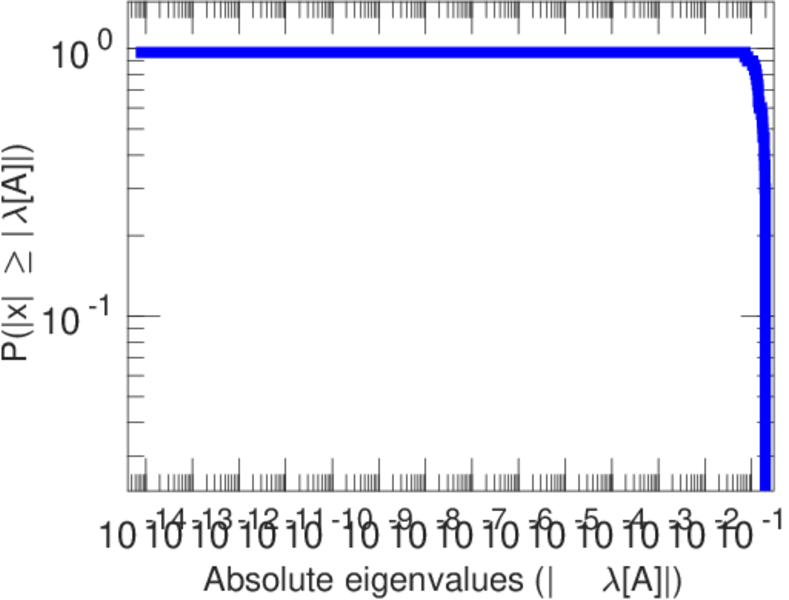
| Spectral norm | α = | 939.030
|
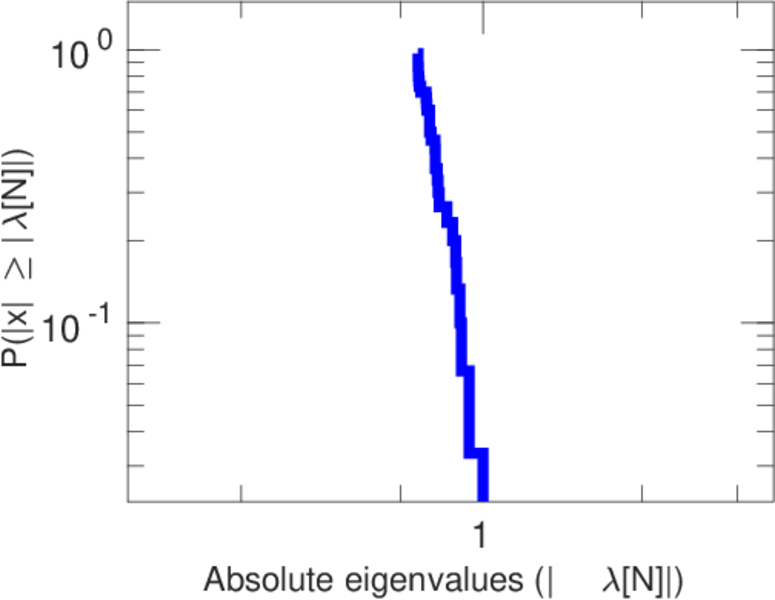
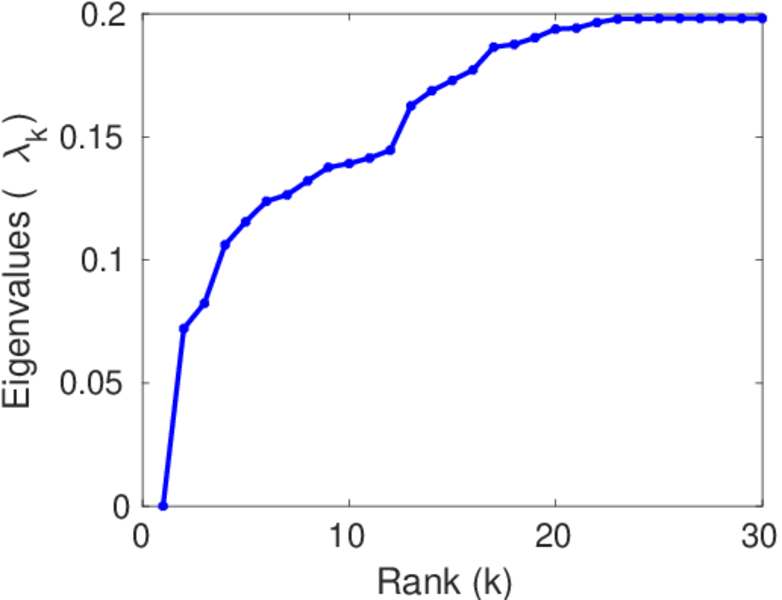
| Algebraic connectivity | a = | 0.072 104 0
|
| Spectral separation | |λ1[A] / λ2[A]| = | 2.230 54
|
| Controllability | C = | 63,965
|
| Relative controllability | Cr = | 0.939 322
|
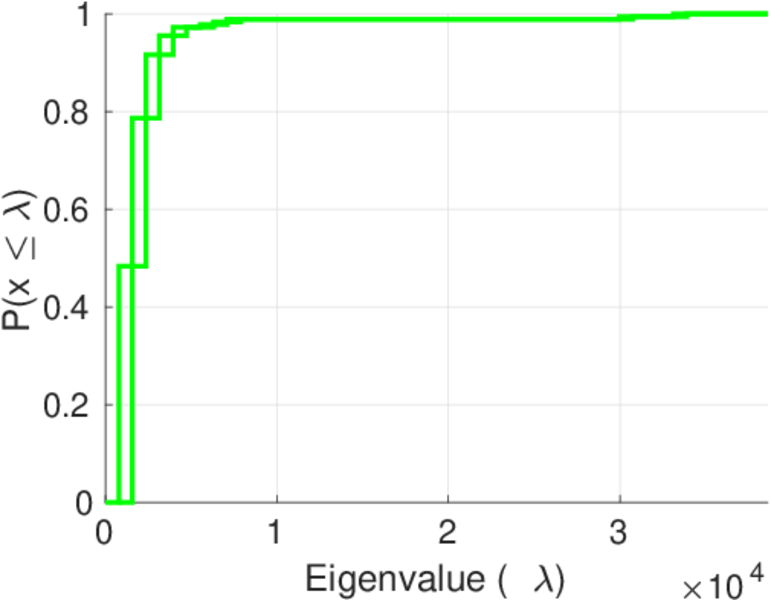
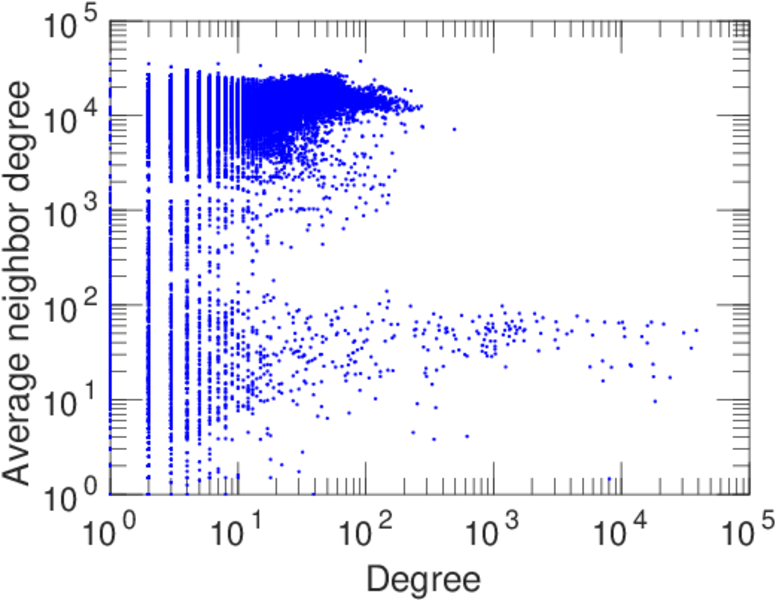
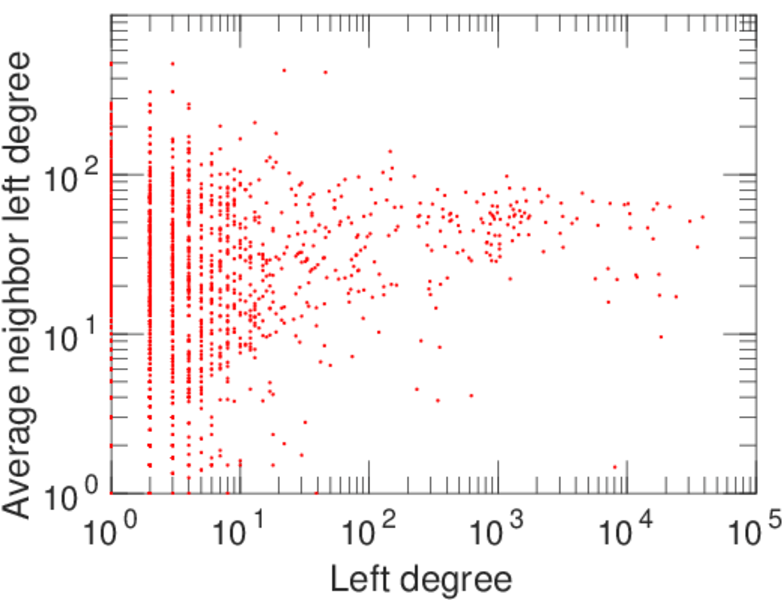
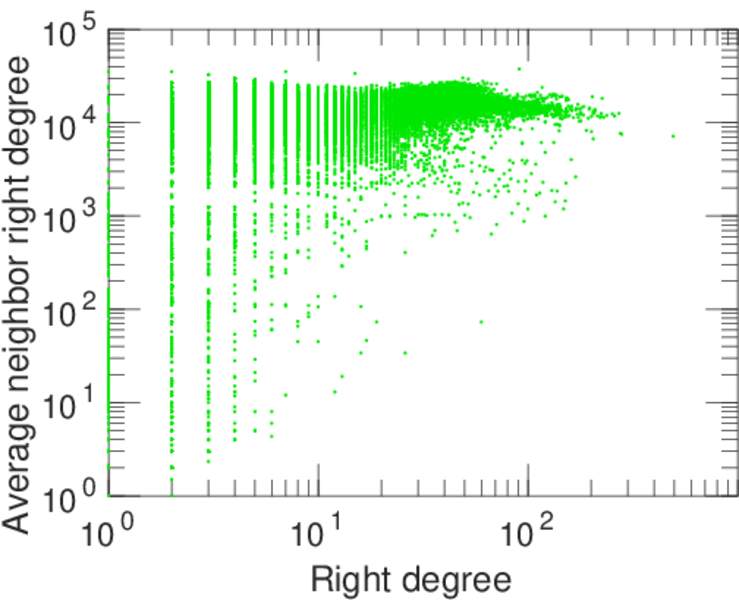
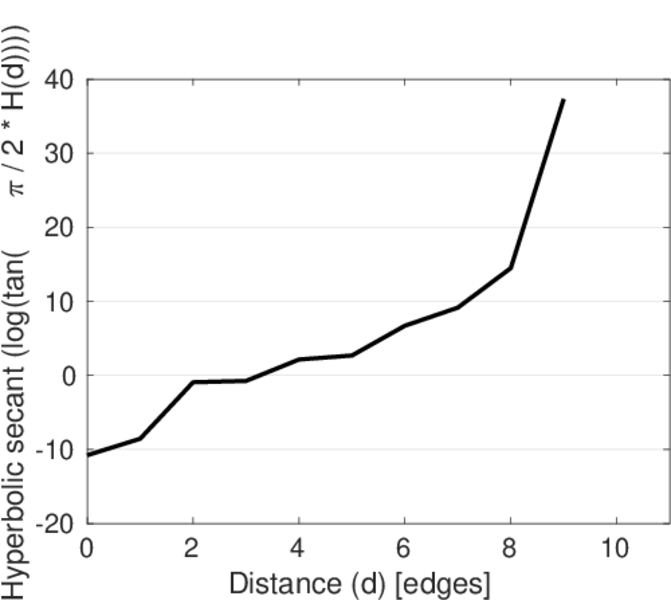
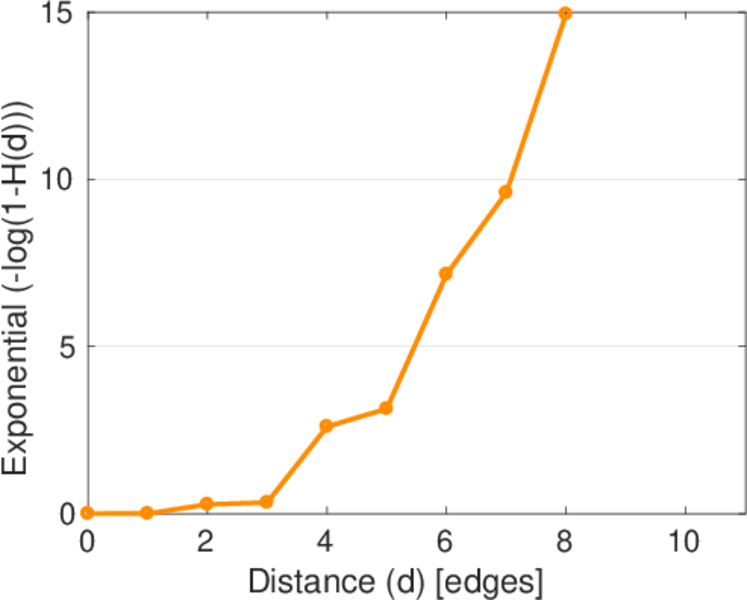
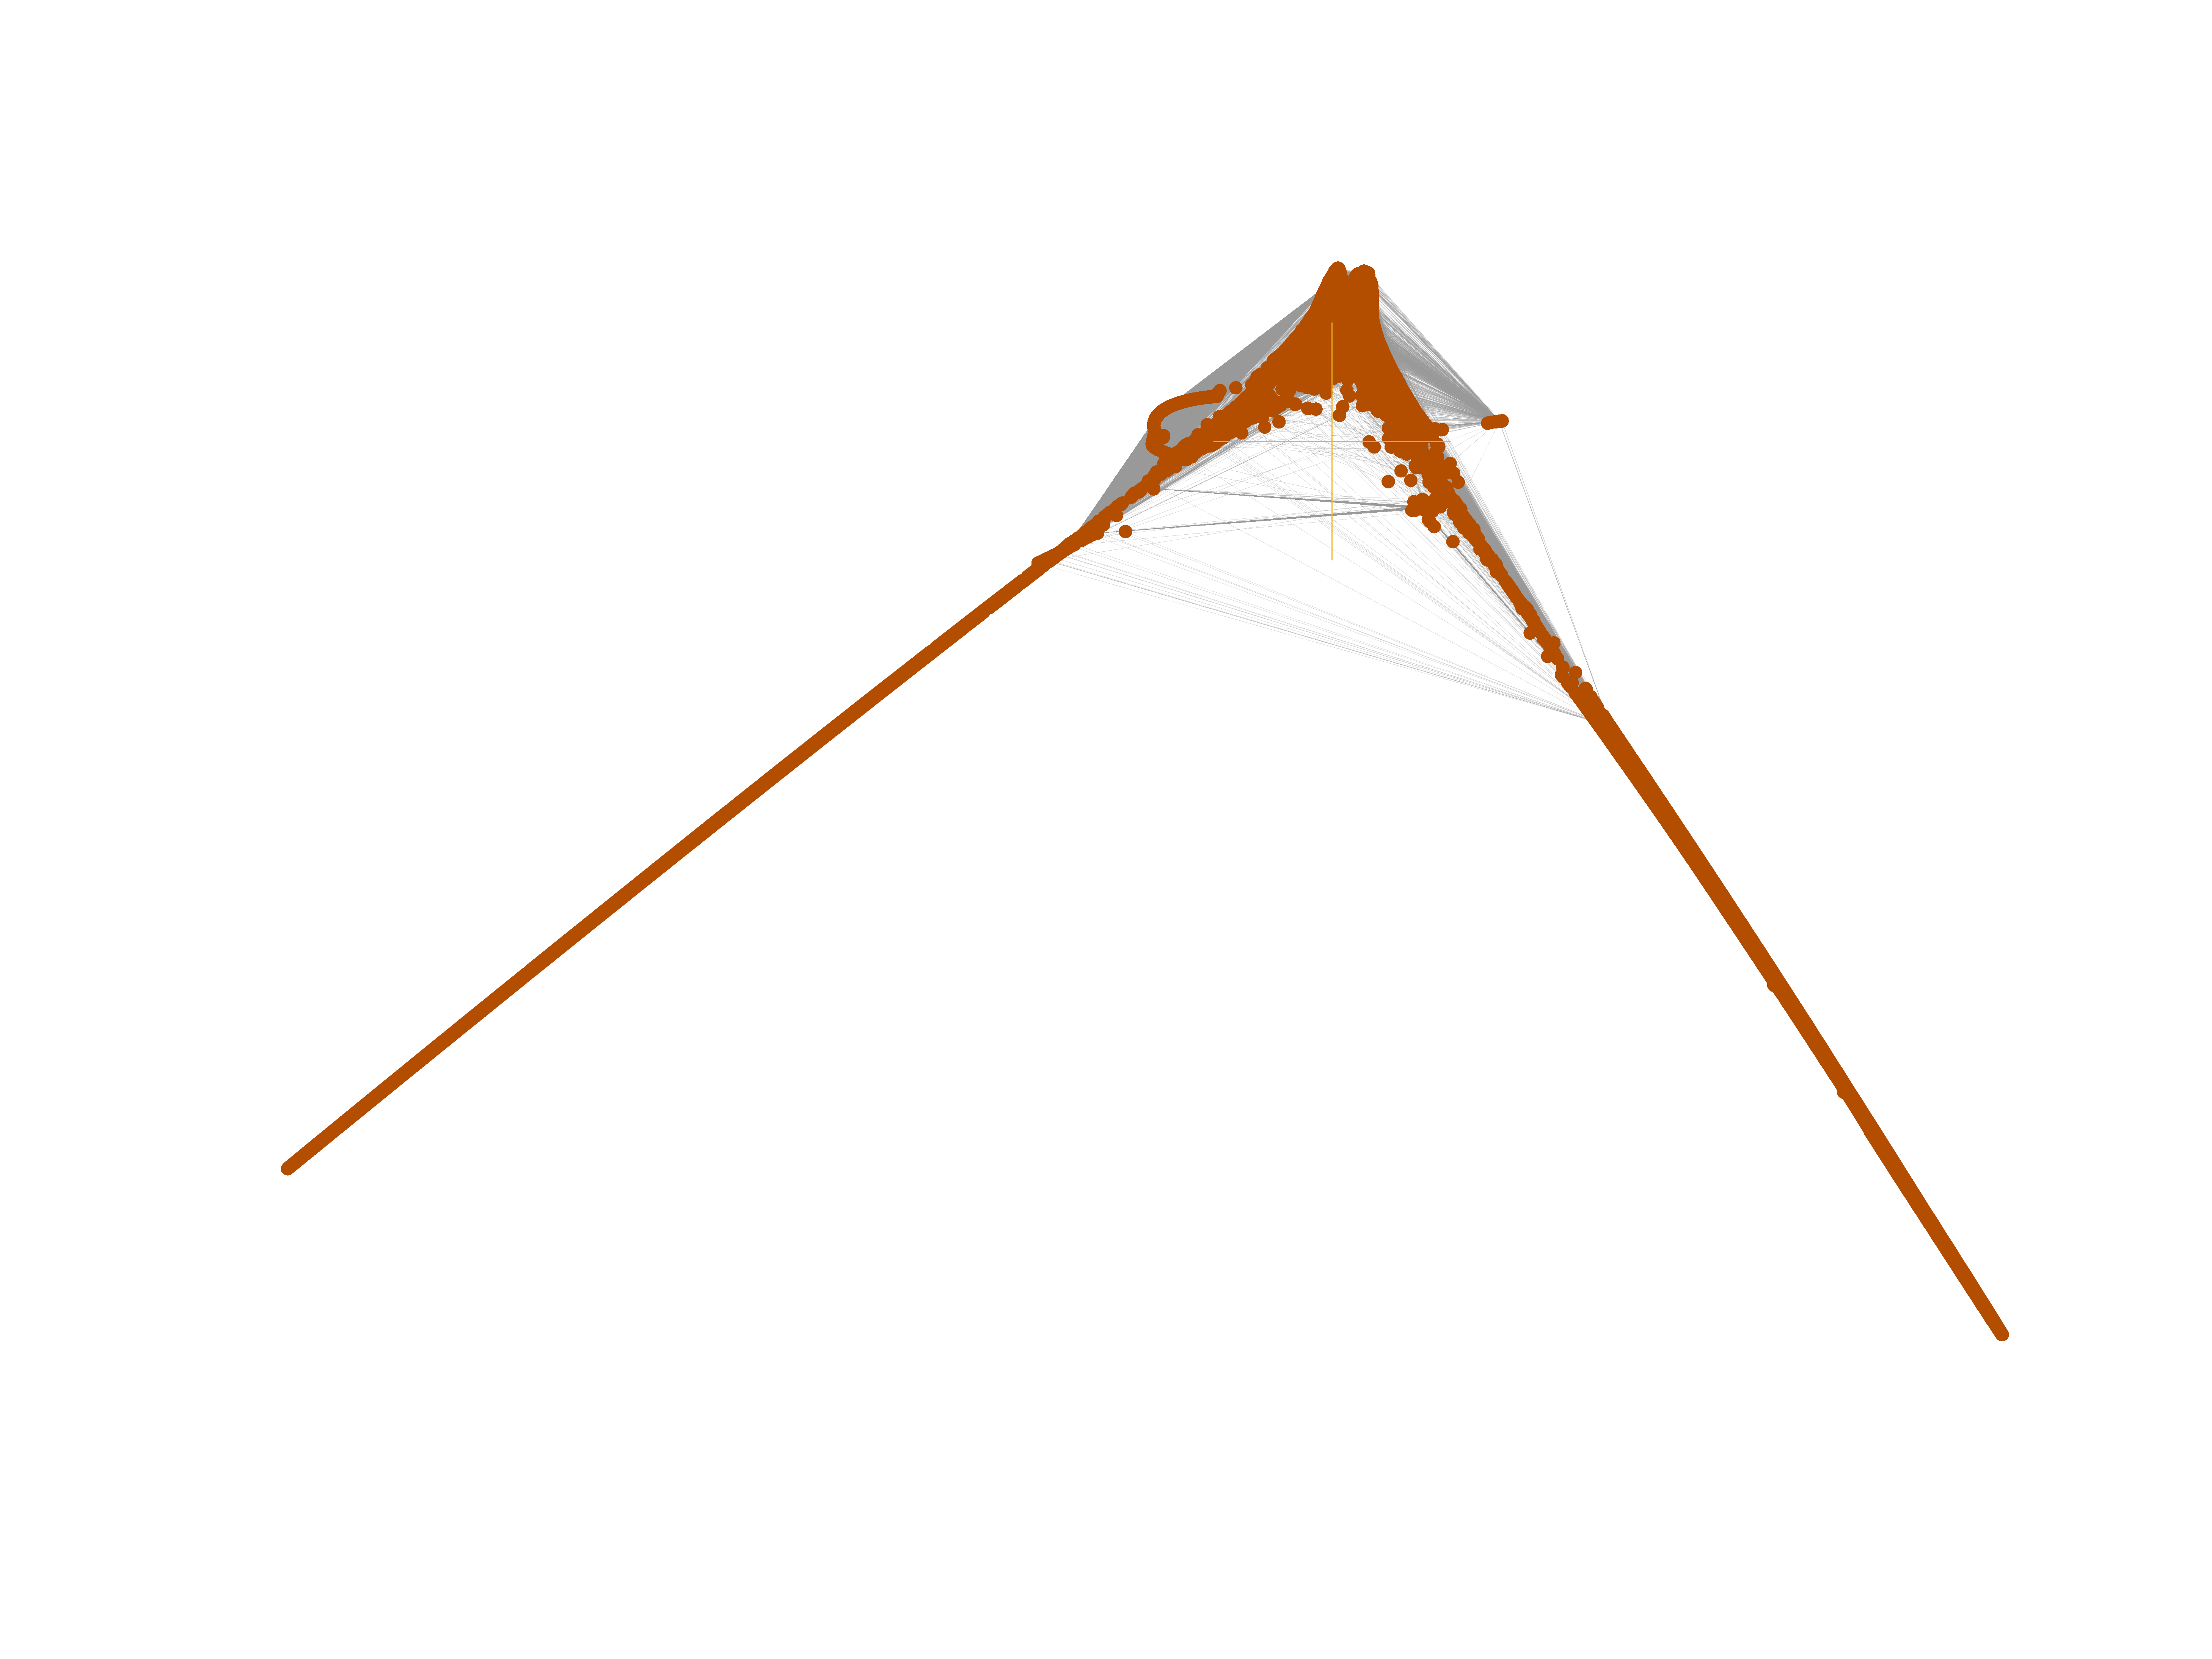
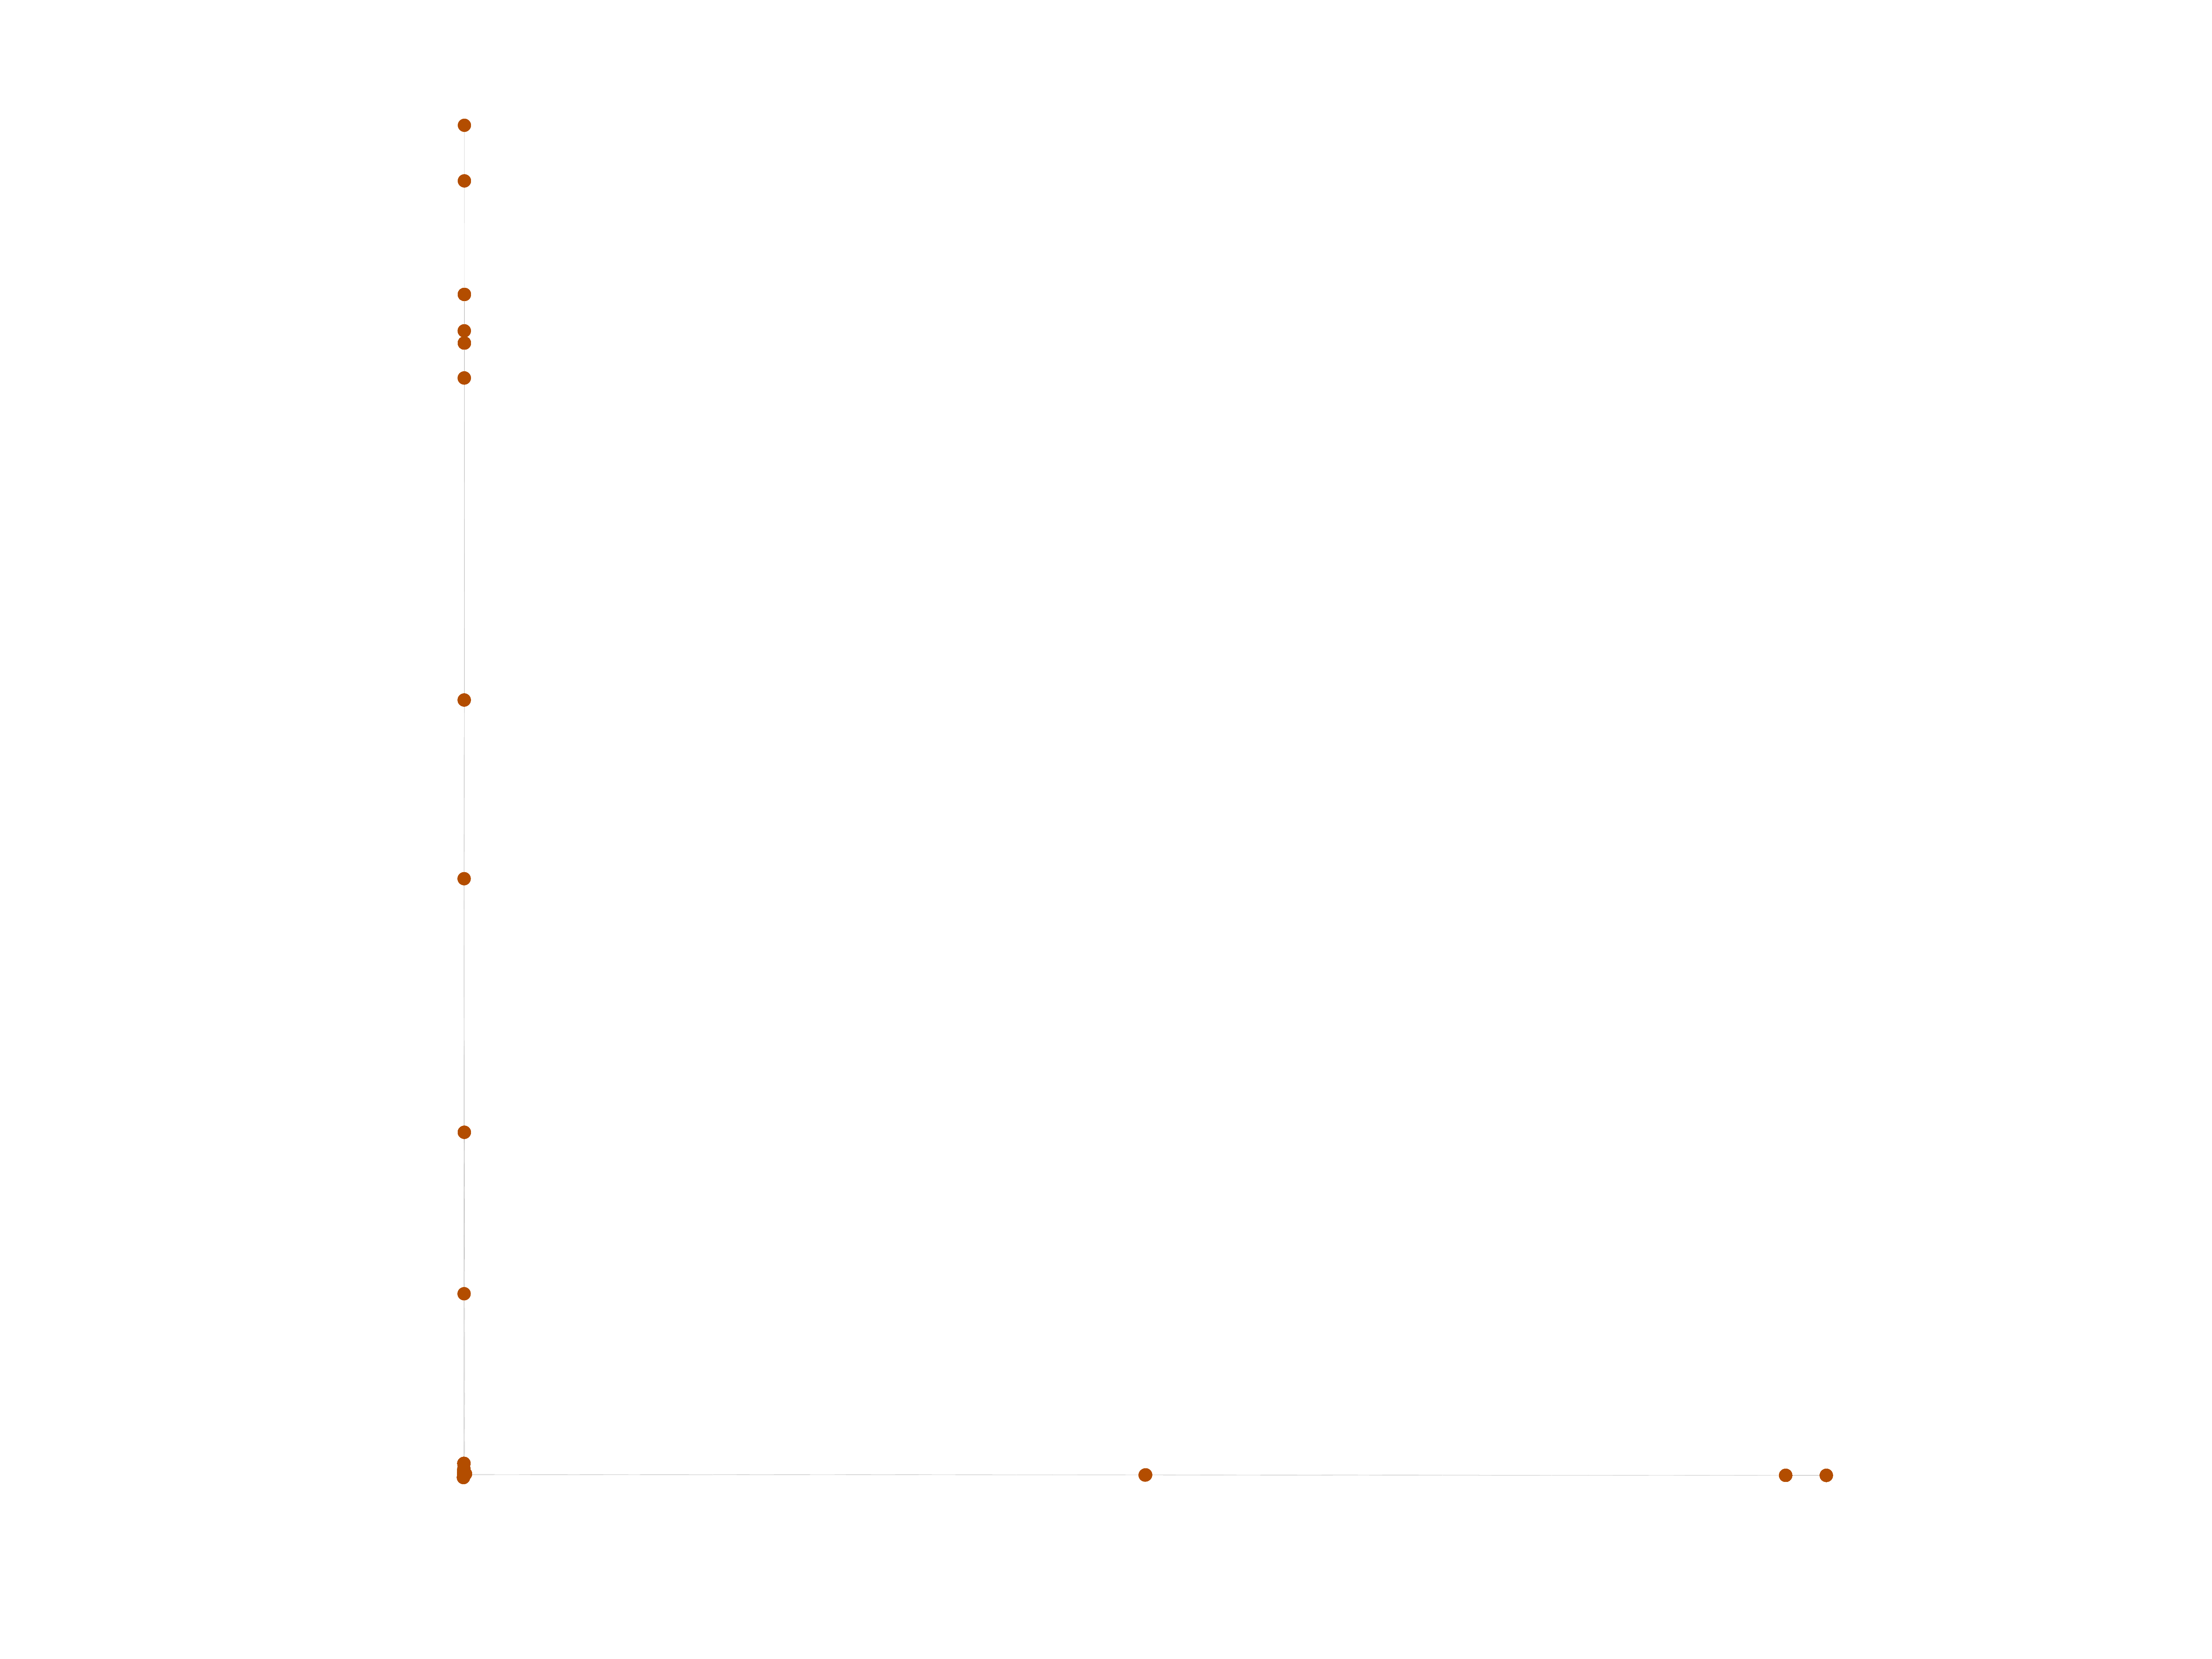
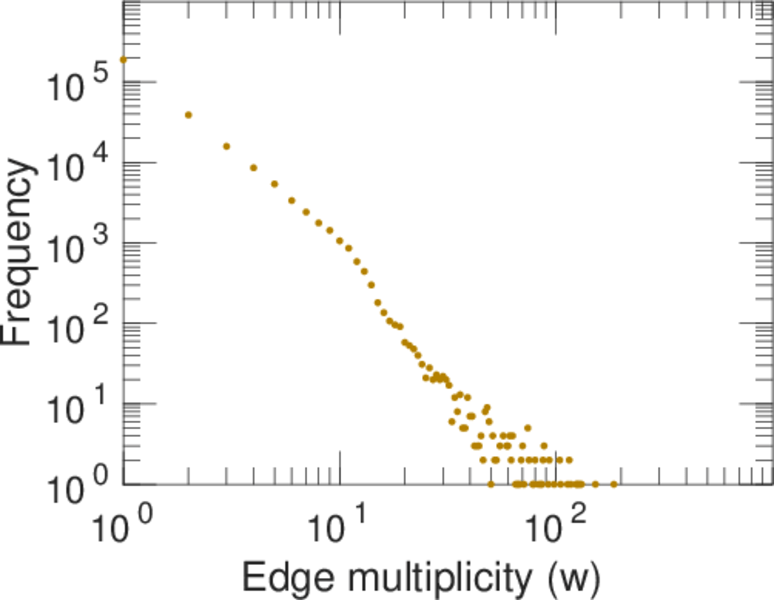
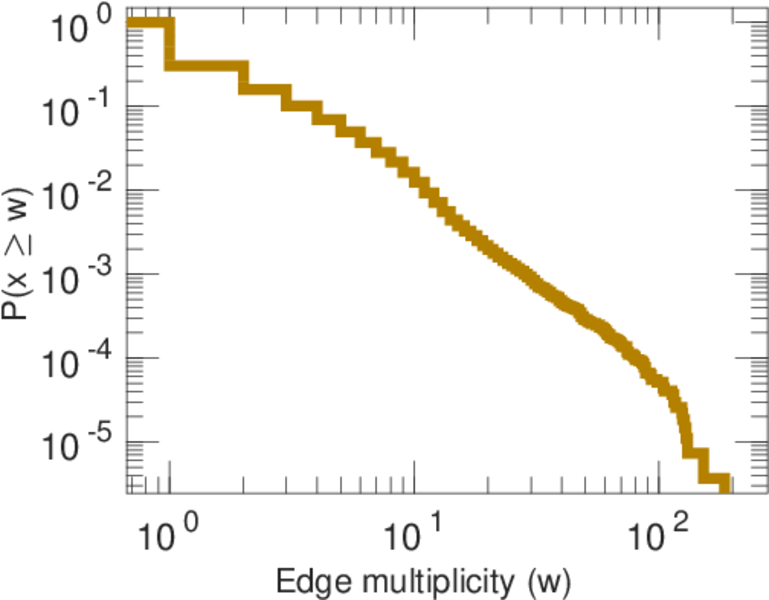
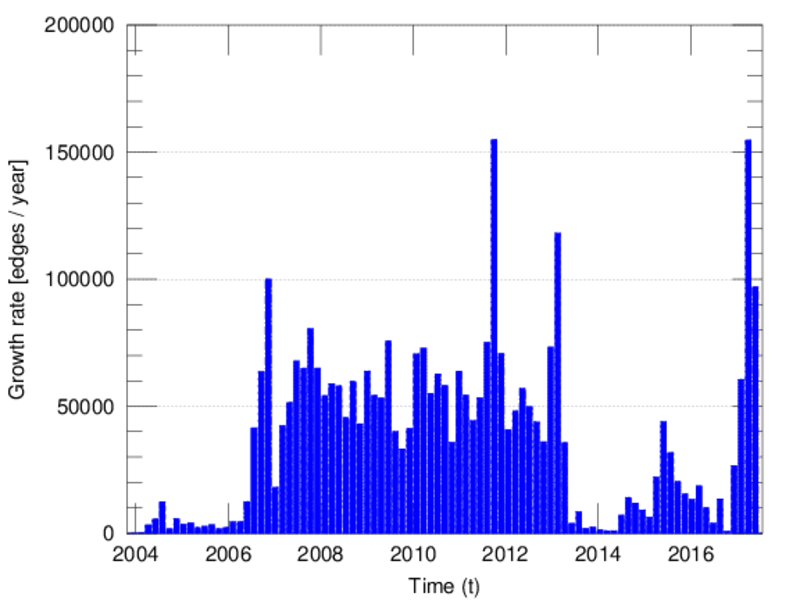
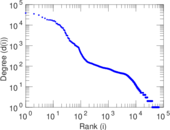
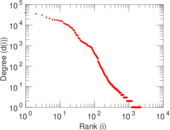
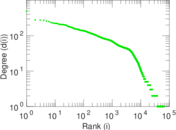
Plots


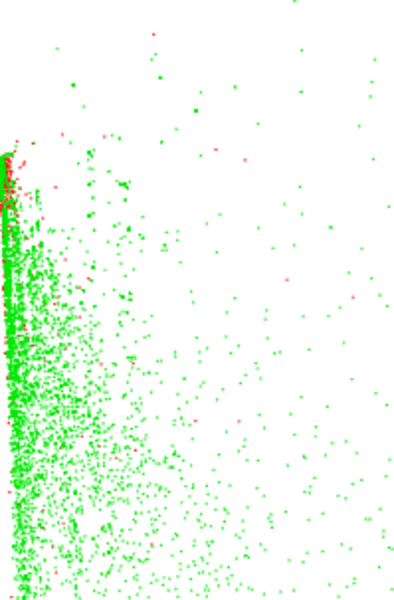
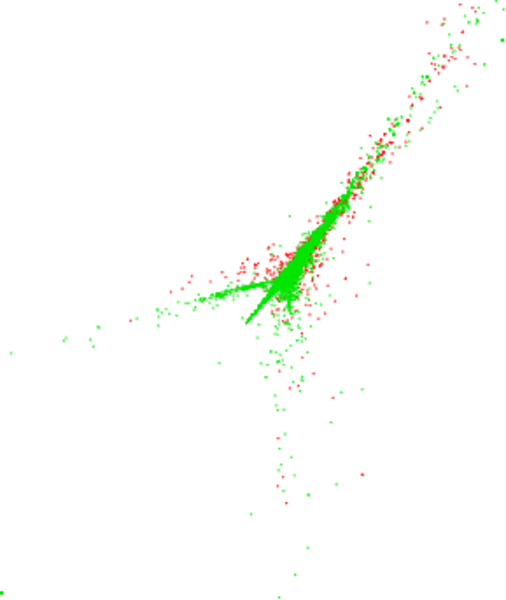
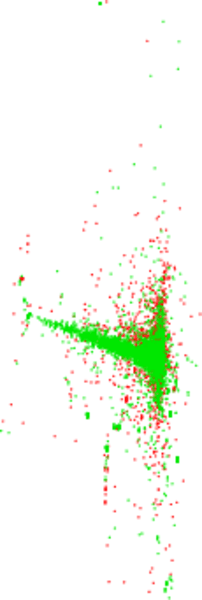
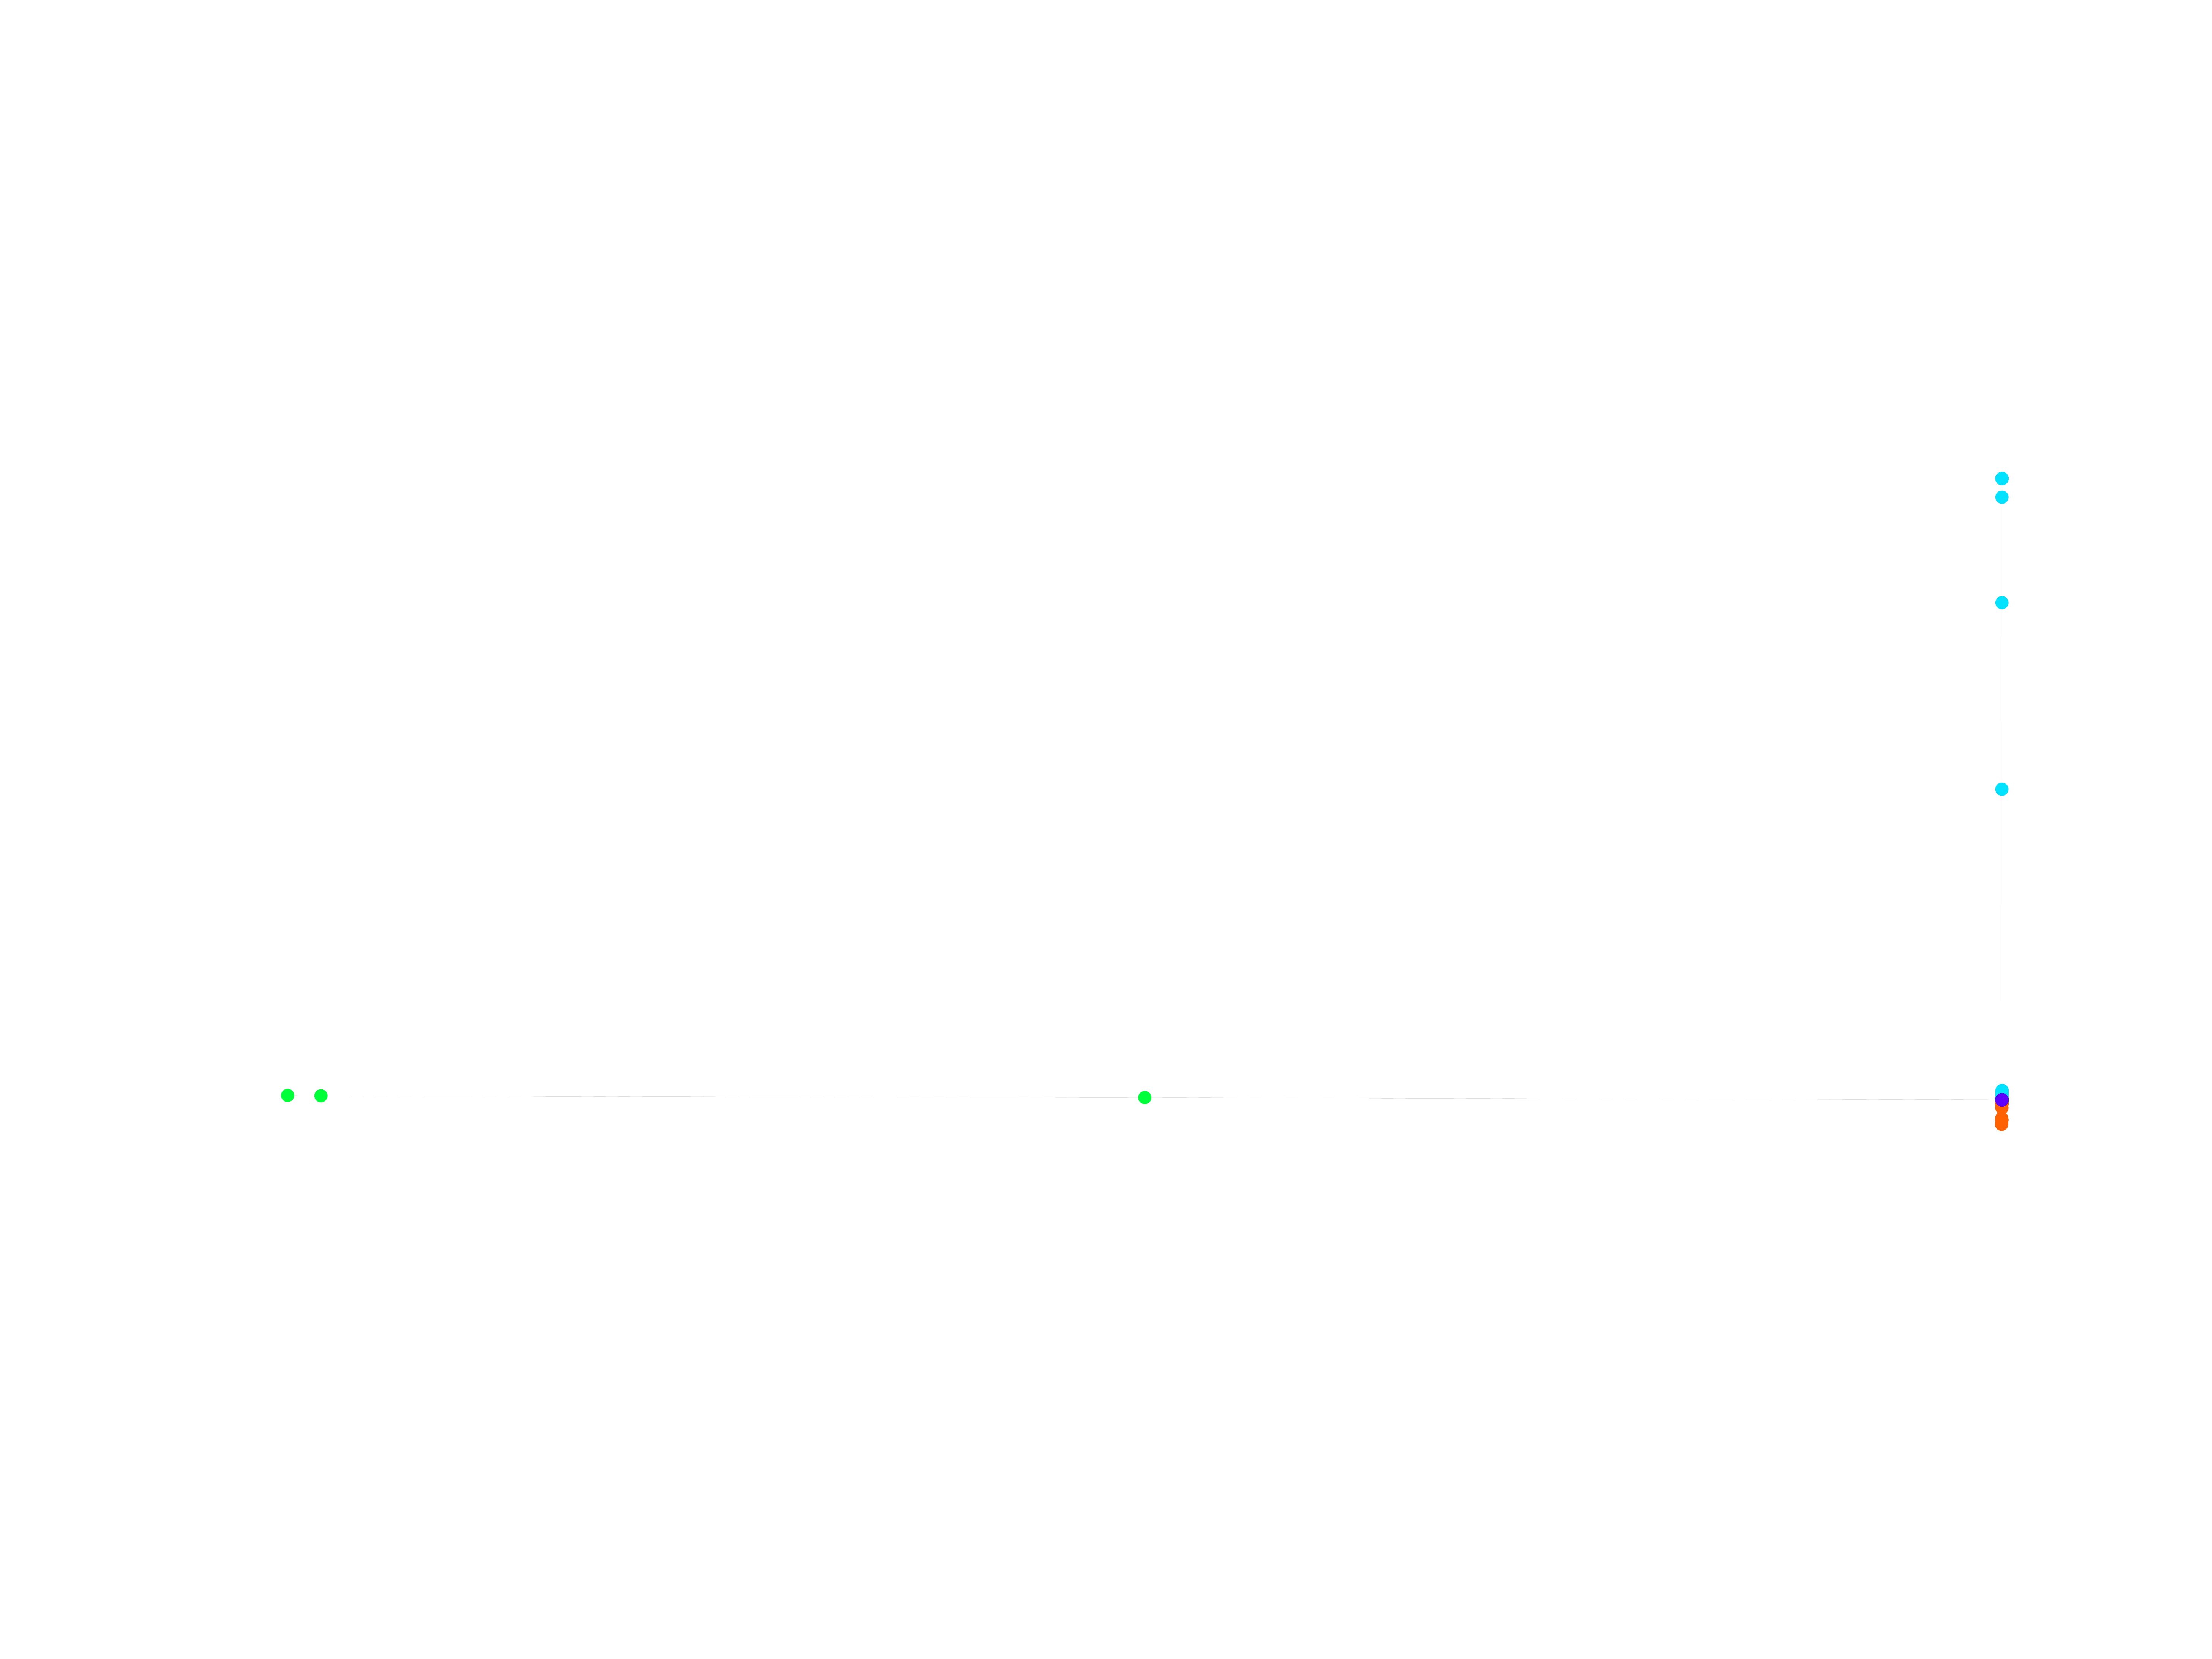
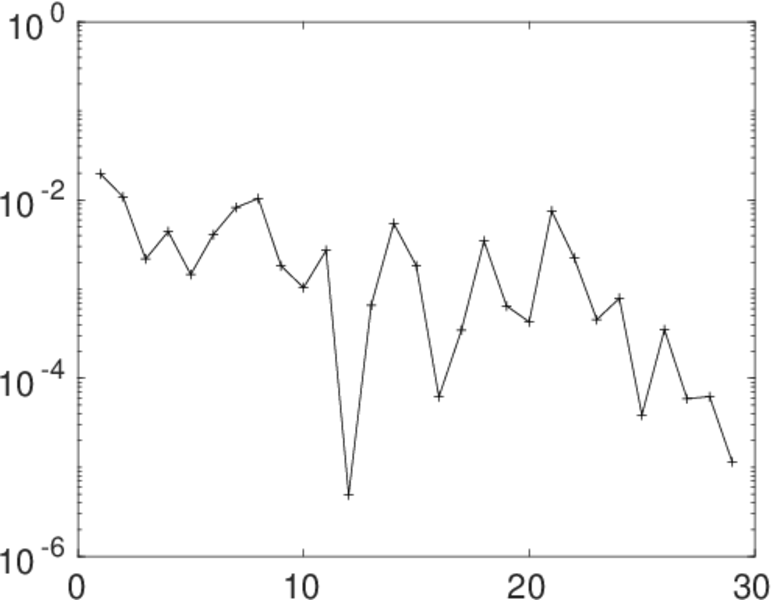
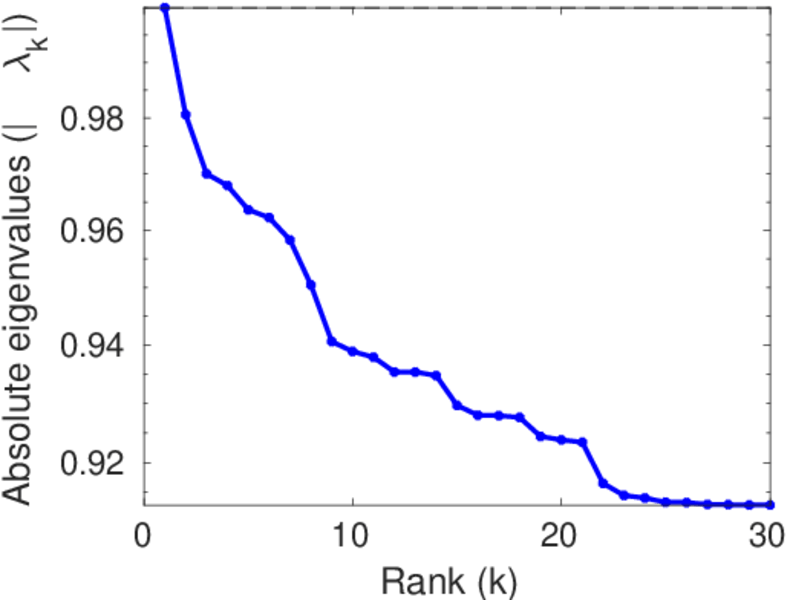
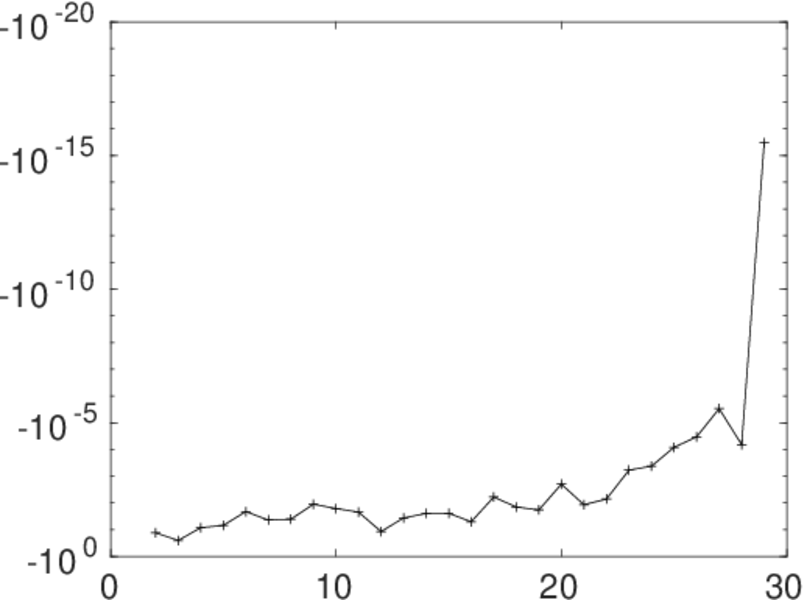
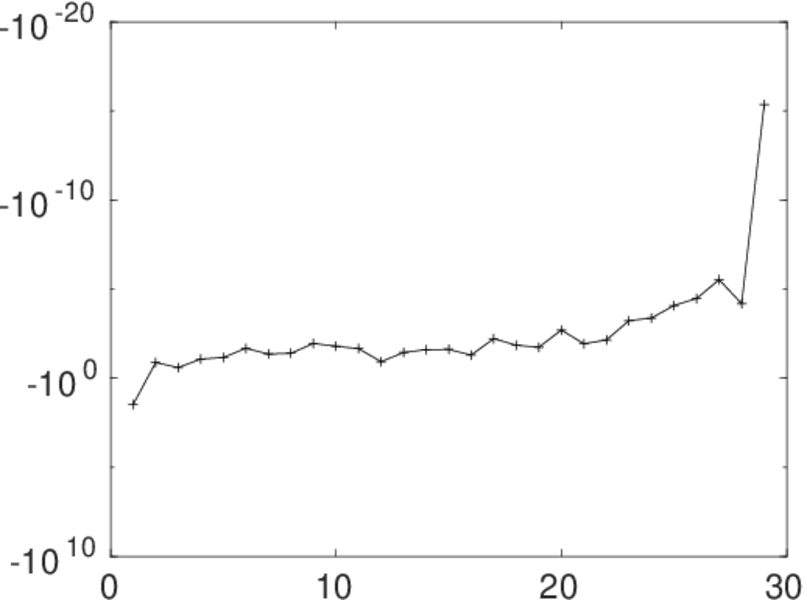
Matrix decompositions plots


Downloads
References
|
[1]
|
Jérôme Kunegis.
KONECT – The Koblenz Network Collection.
In Proc. Int. Conf. on World Wide Web Companion, pages
1343–1350, 2013.
[ http ]
|
|
[2]
|
Wikimedia Foundation.
Wikimedia downloads.
http://dumps.wikimedia.org/, January 2010.
|
 KONECT ‣ Networks ‣
Buy Me a Coffee
KONECT ‣ Networks ‣
Buy Me a Coffee