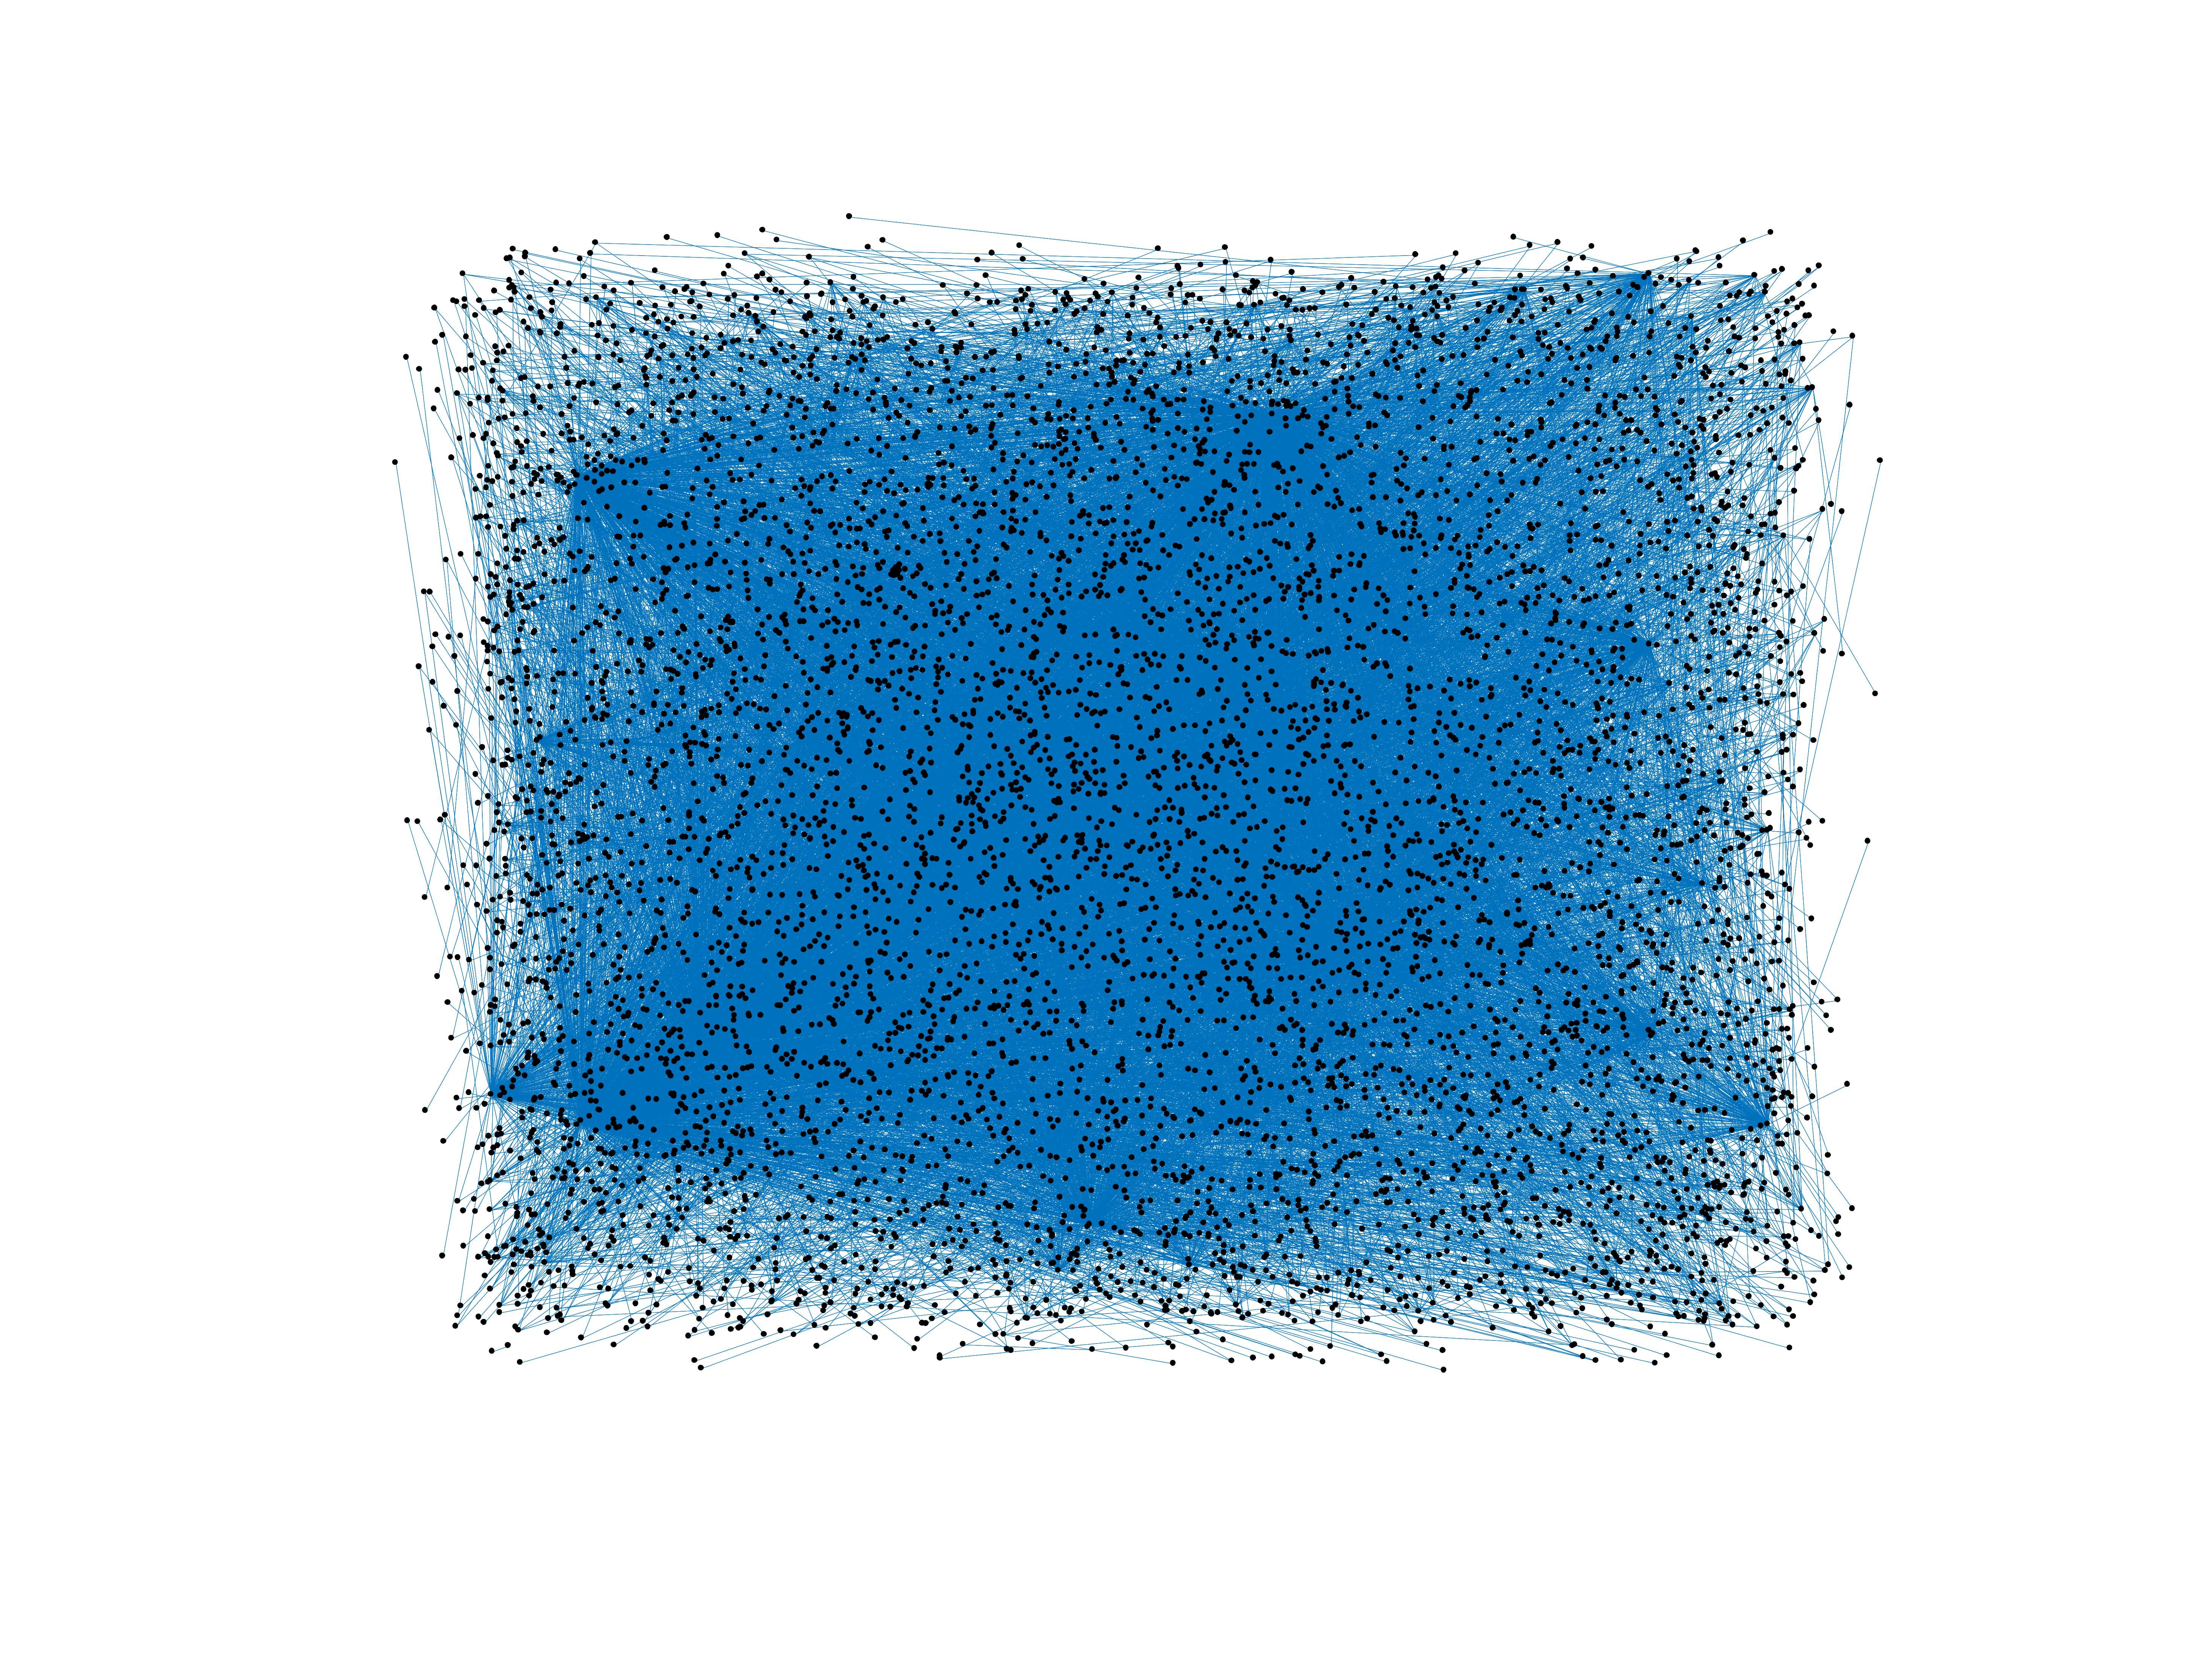
Wikibooks edits (sv)
This is the bipartite edit network of the Swedish Wikibooks. It contains users
and pages from the Swedish Wikibooks, connected by edit events. Each edge
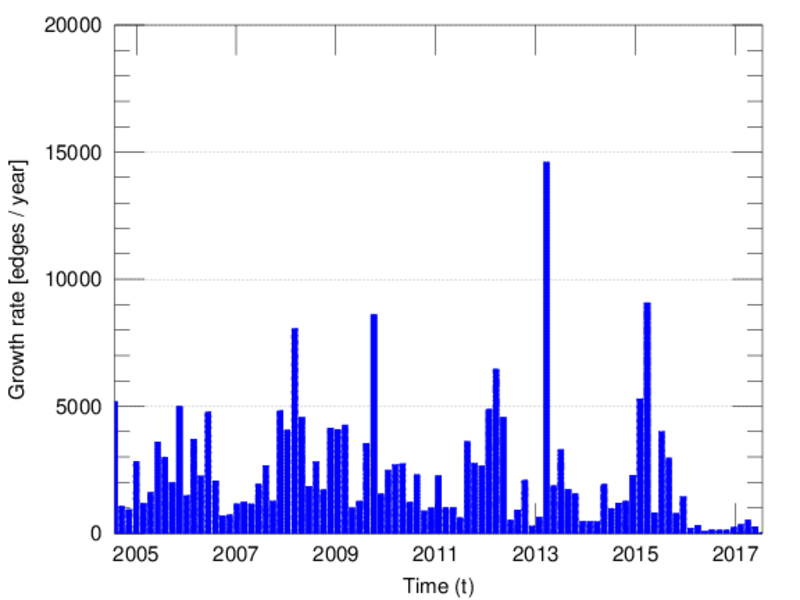
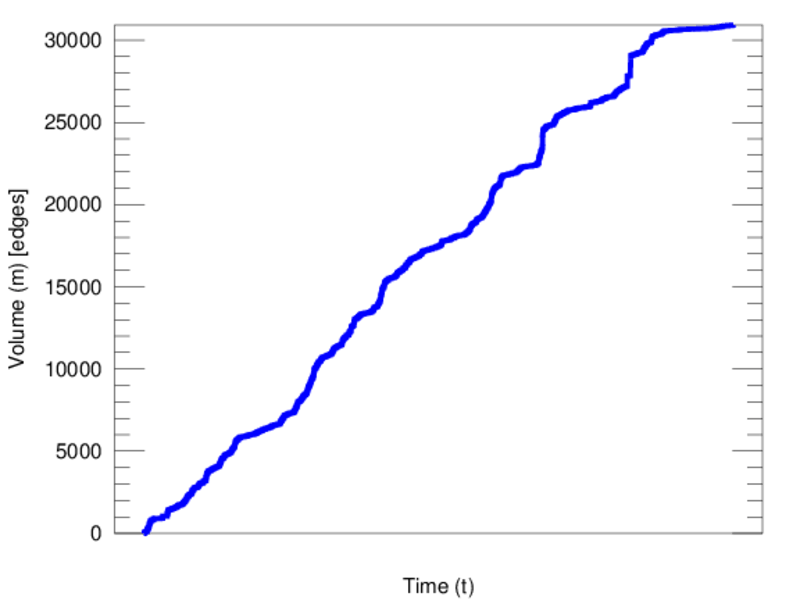
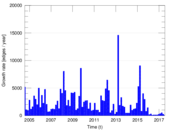
represents an edit. The dataset includes the timestamp of each edit.
Metadata
Statistics
| Size | n = | 7,094
|
| Left size | n1 = | 989
|
| Right size | n2 = | 6,105
|
| Volume | m = | 30,924
|
| Unique edge count | m̿ = | 12,321
|
| Wedge count | s = | 3,023,661
|
| Claw count | z = | 973,740,776
|
| Cross count | x = | 270,132,779,223
|
| Square count | q = | 401,801
|
| 4-Tour count | T4 = | 15,340,662
|
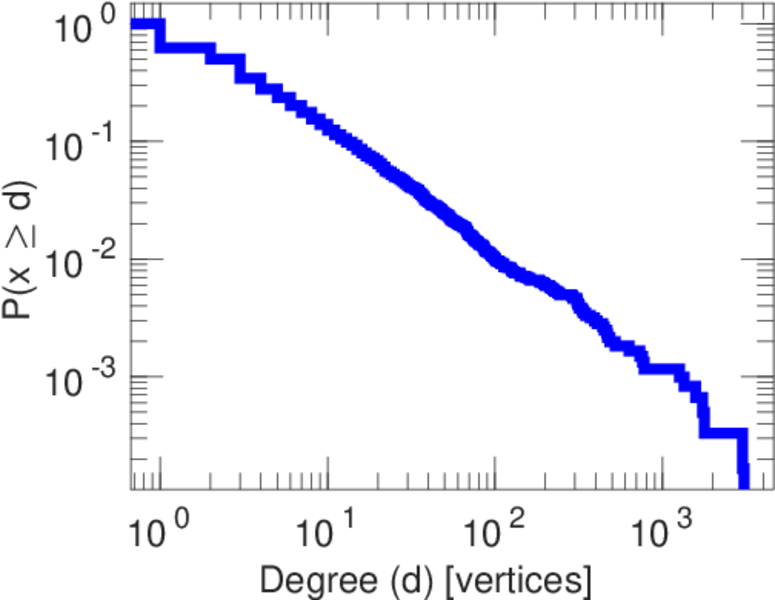
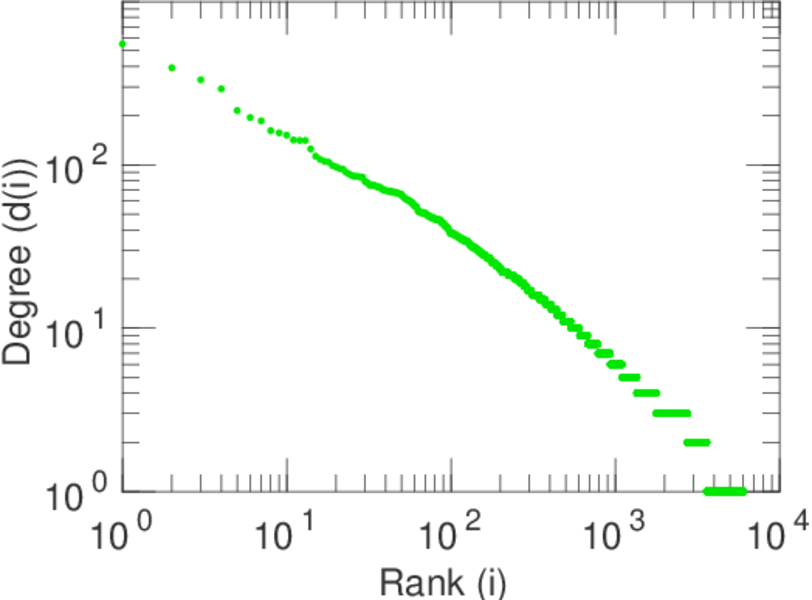
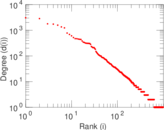
| Maximum degree | dmax = | 3,053
|
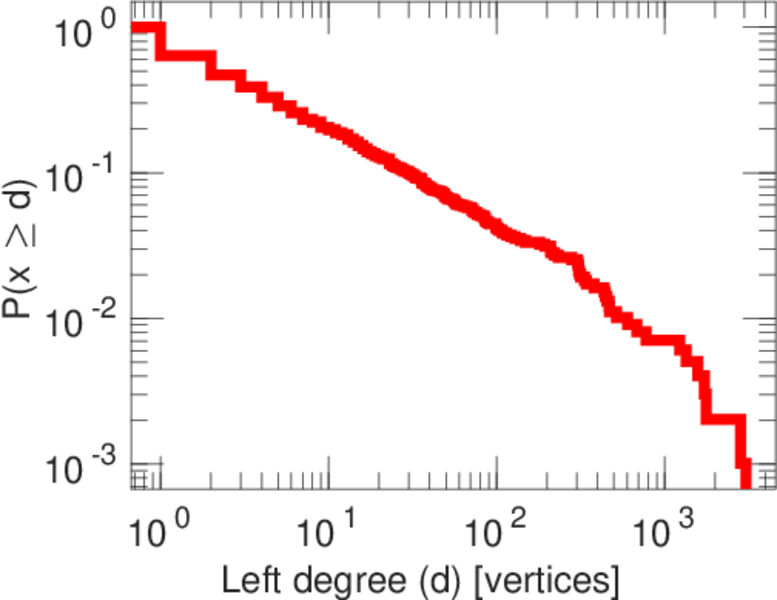
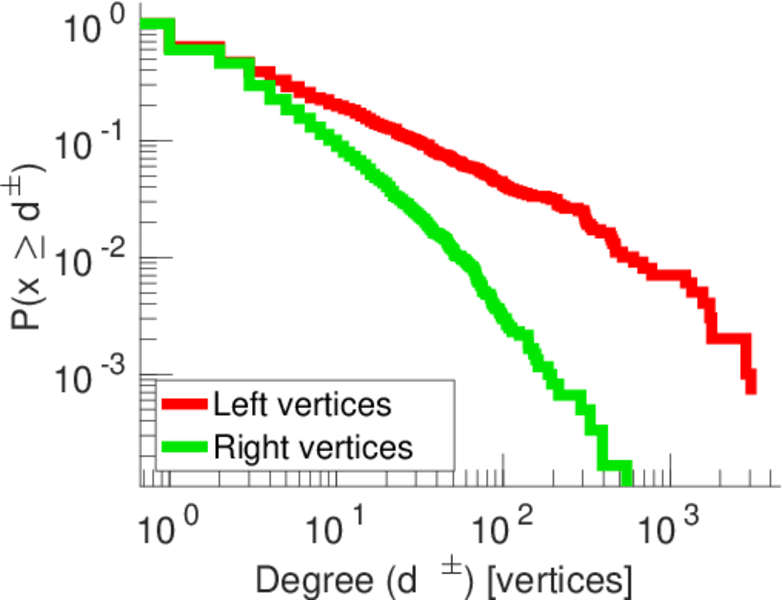
| Maximum left degree | d1max = | 3,053
|
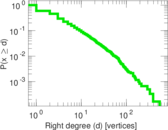
| Maximum right degree | d2max = | 550
|
| Average degree | d = | 8.718 35
|
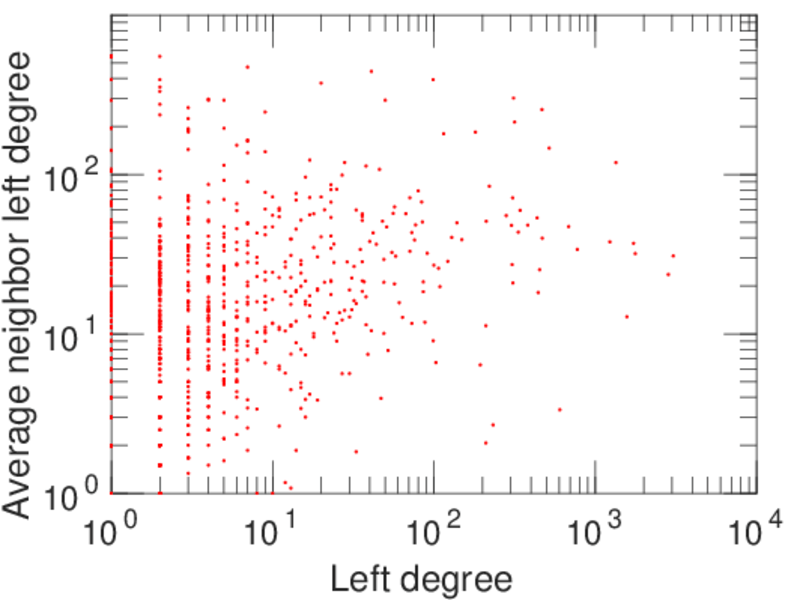
| Average left degree | d1 = | 31.267 9
|
| Average right degree | d2 = | 5.065 36
|
| Fill | p = | 0.002 040 63
|
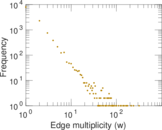
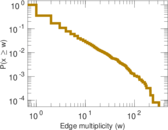
| Average edge multiplicity | m̃ = | 2.509 86
|
| Size of LCC | N = | 6,620
|
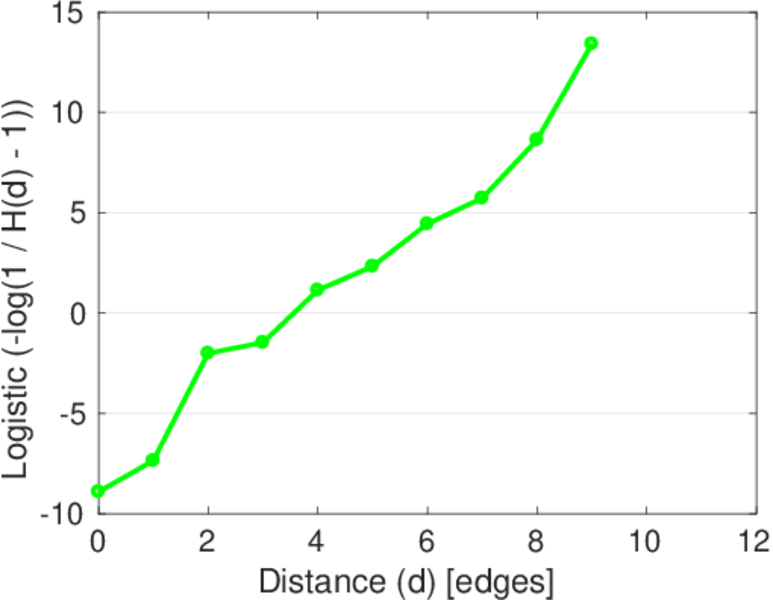
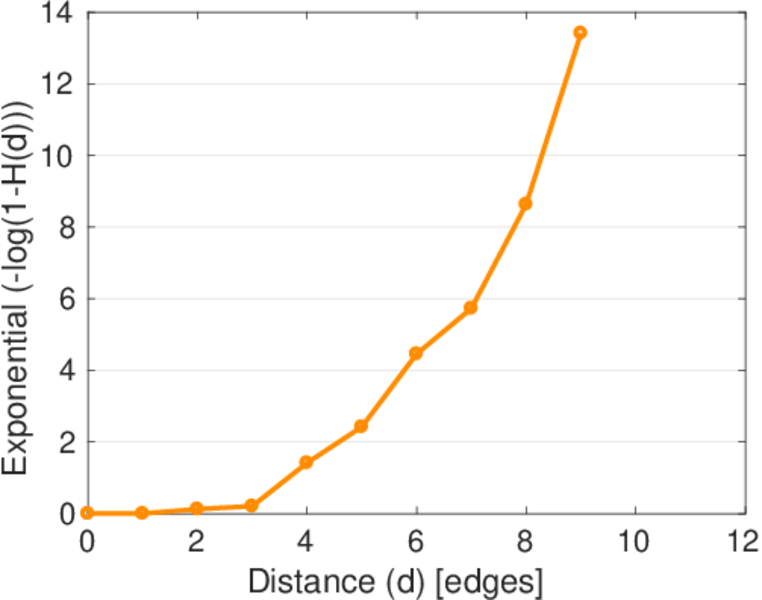
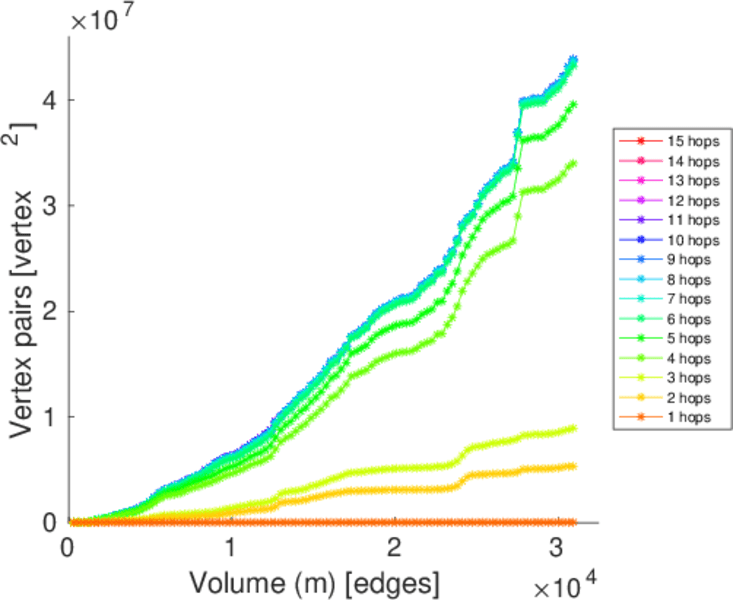
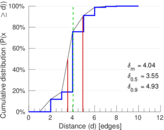
| Diameter | δ = | 12
|
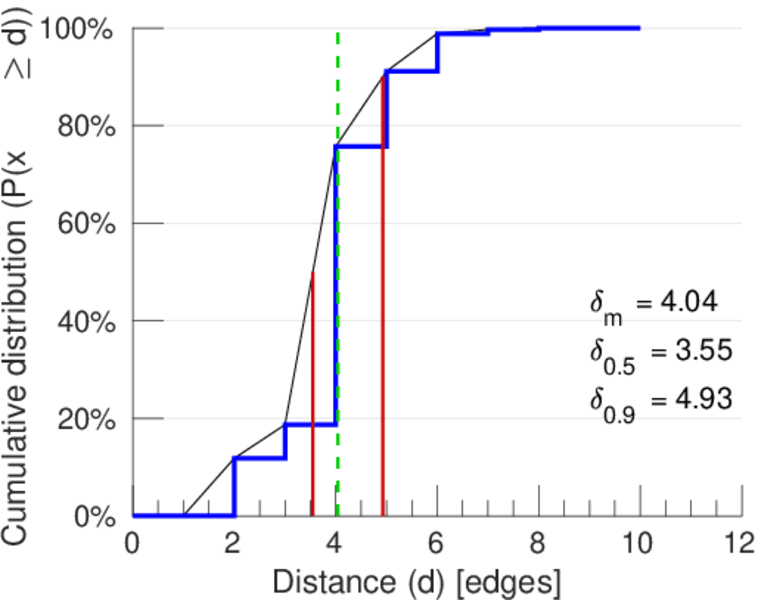
| 50-Percentile effective diameter | δ0.5 = | 3.549 10
|
| 90-Percentile effective diameter | δ0.9 = | 4.927 52
|
| Median distance | δM = | 4
|
| Mean distance | δm = | 4.040 97
|
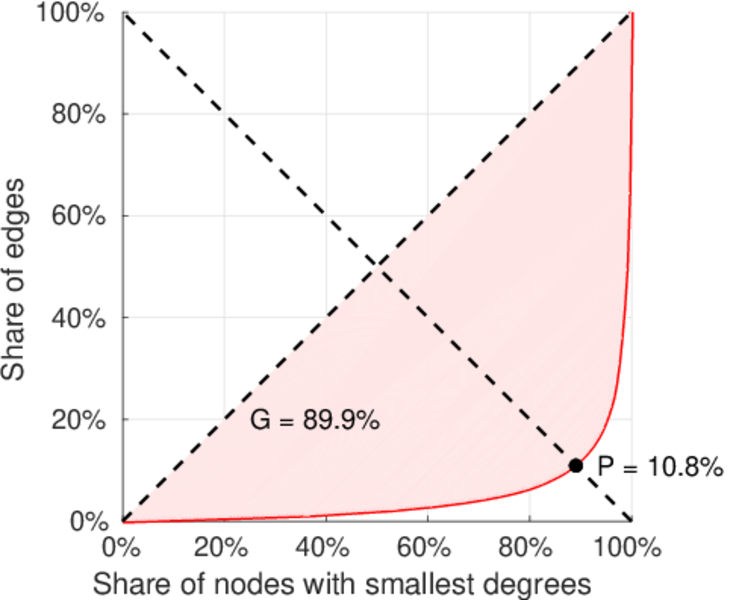
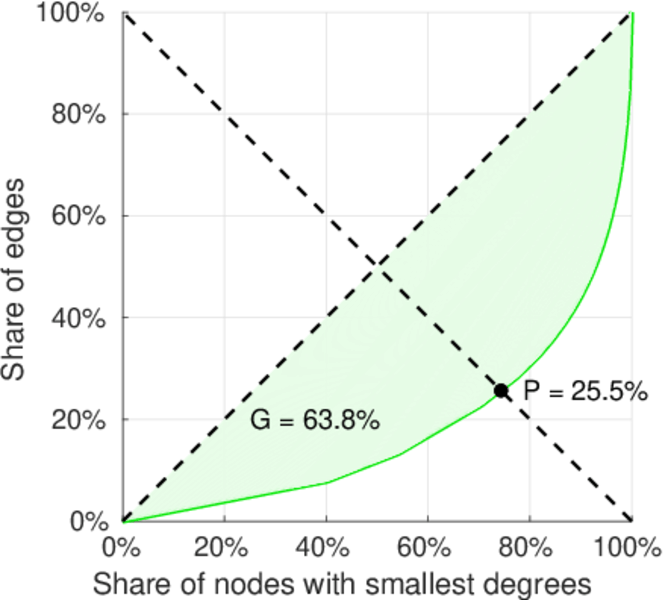
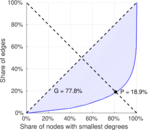
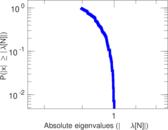
| Gini coefficient | G = | 0.788 226
|
| Balanced inequality ratio | P = | 0.184 549
|
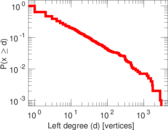
| Left balanced inequality ratio | P1 = | 0.107 619
|
| Right balanced inequality ratio | P2 = | 0.255 077
|
| Relative edge distribution entropy | Her = | 0.803 073
|
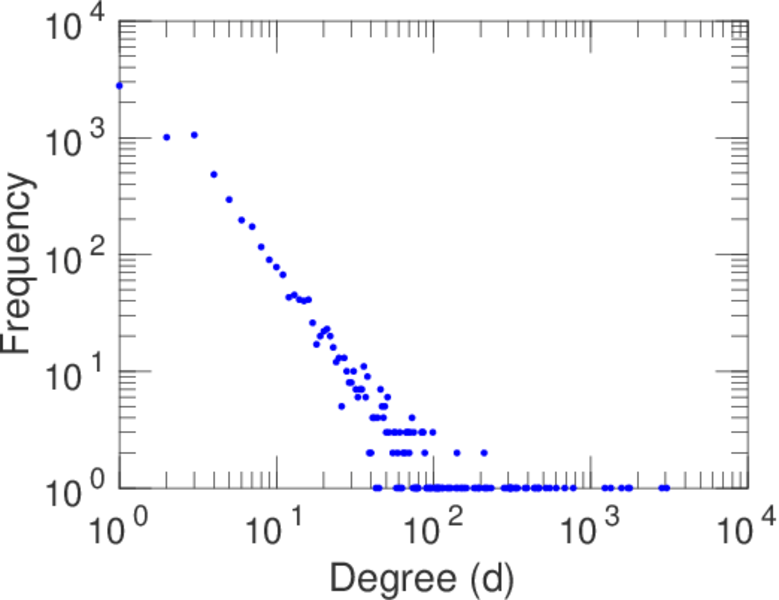
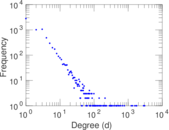
| Power law exponent | γ = | 2.865 95
|
| Tail power law exponent | γt = | 2.581 00
|
| Tail power law exponent with p | γ3 = | 2.581 00
|
| p-value | p = | 0.000 00
|
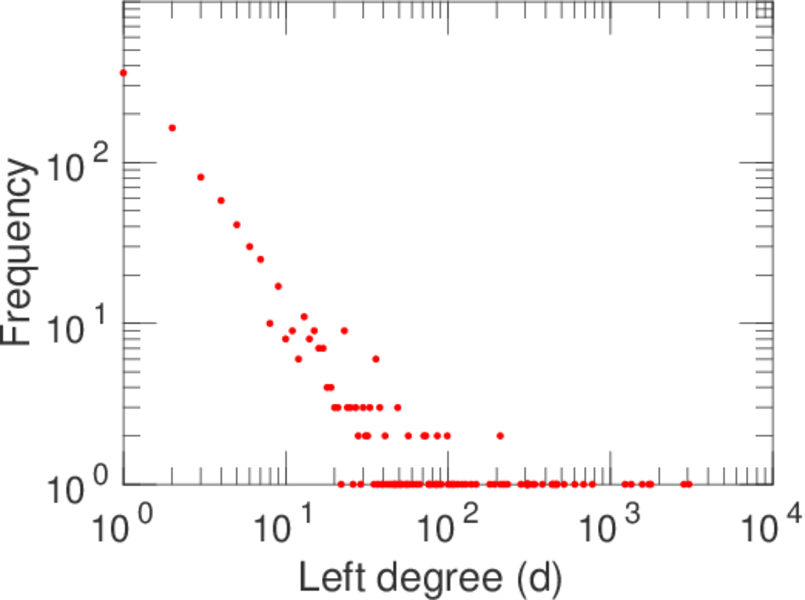
| Left tail power law exponent with p | γ3,1 = | 1.811 00
|
| Left p-value | p1 = | 0.433 000
|
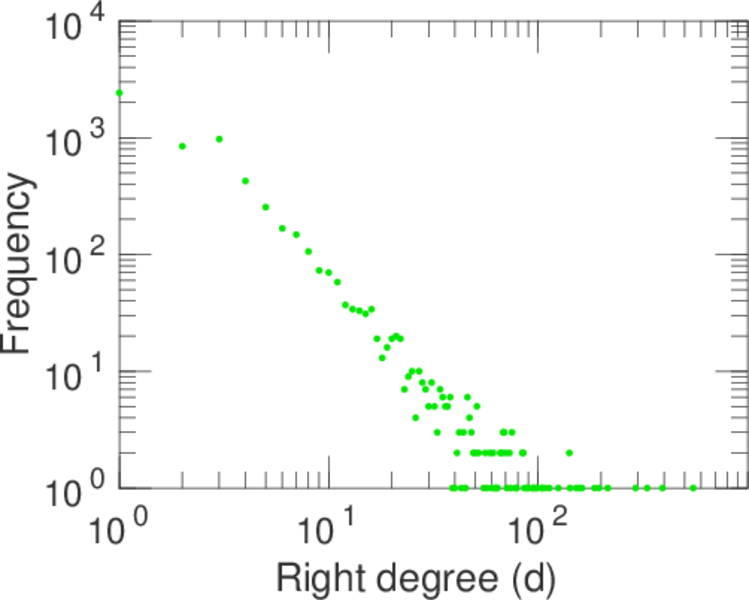
| Right tail power law exponent with p | γ3,2 = | 2.901 00
|
| Right p-value | p2 = | 0.000 00
|
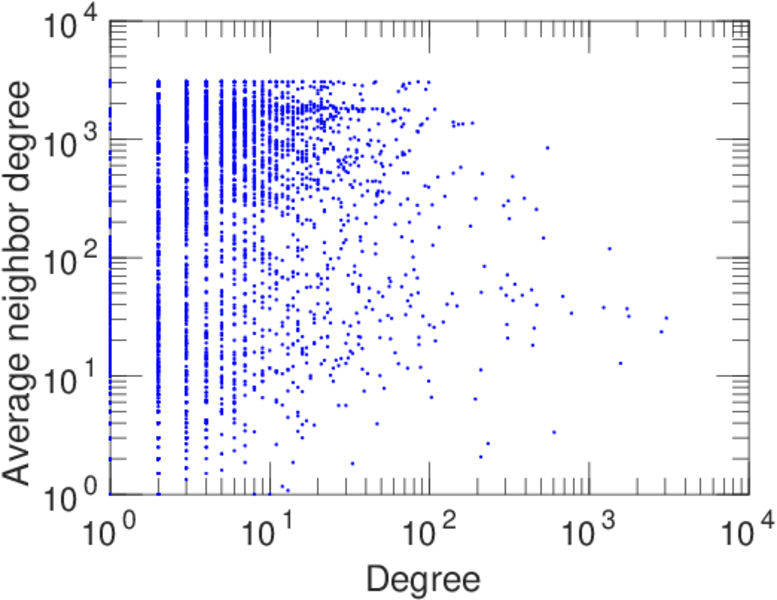
| Degree assortativity | ρ = | −0.182 198
|
| Degree assortativity p-value | pρ = | 1.935 04 × 10−92
|
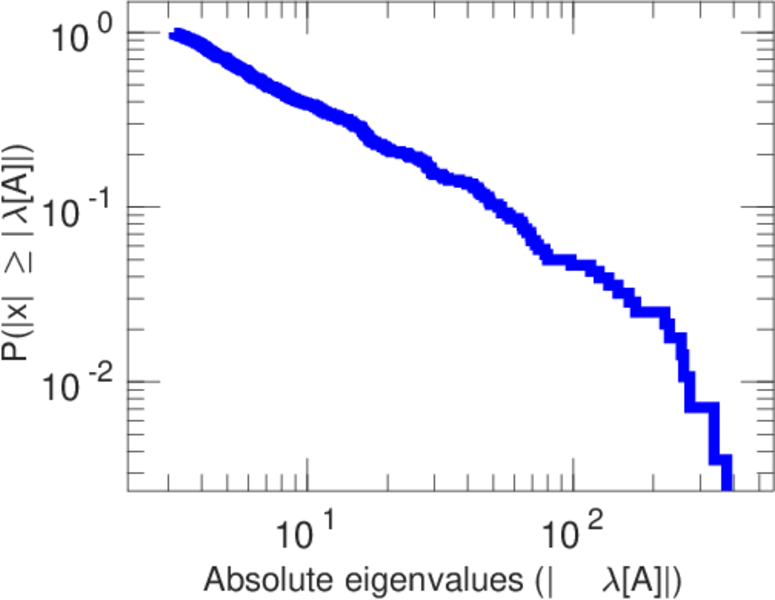
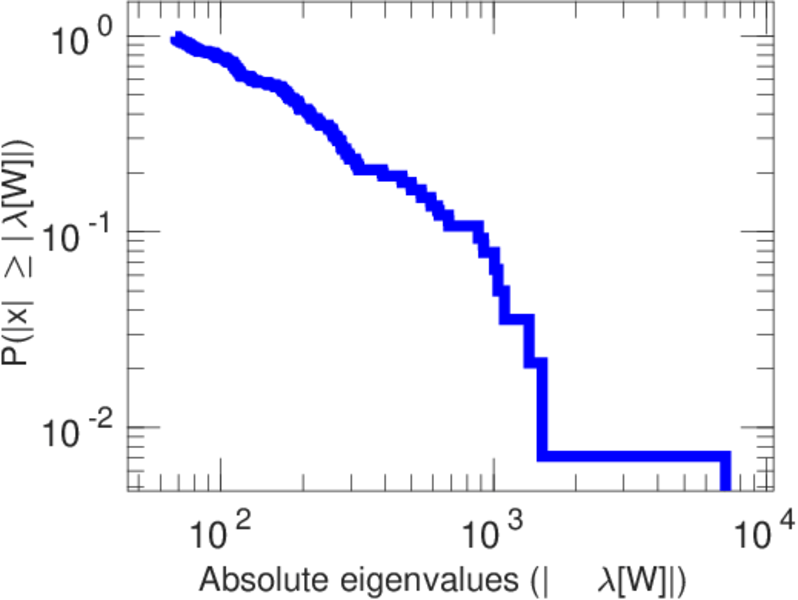
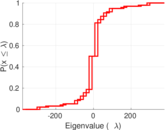
| Spectral norm | α = | 376.689
|
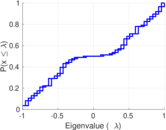
| Algebraic connectivity | a = | 0.027 623 9
|
| Spectral separation | |λ1[A] / λ2[A]| = | 1.115 75
|
| Controllability | C = | 5,356
|
| Relative controllability | Cr = | 0.764 051
|
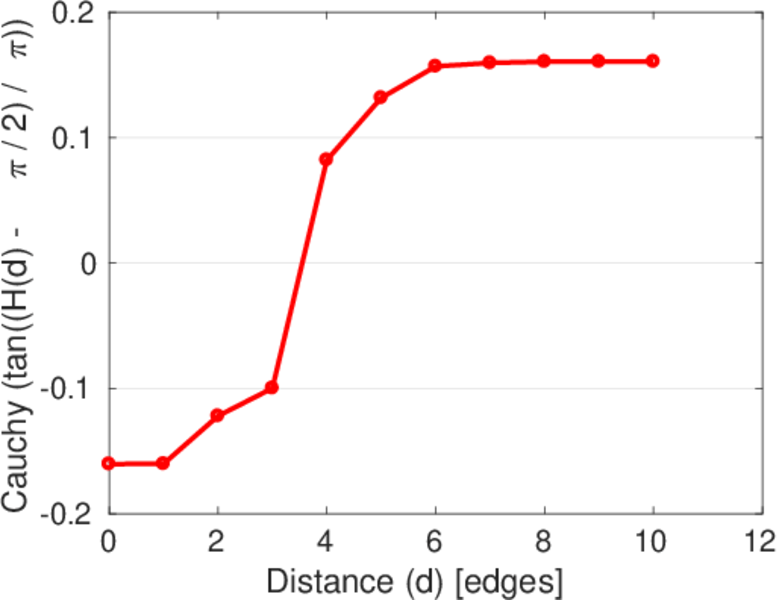
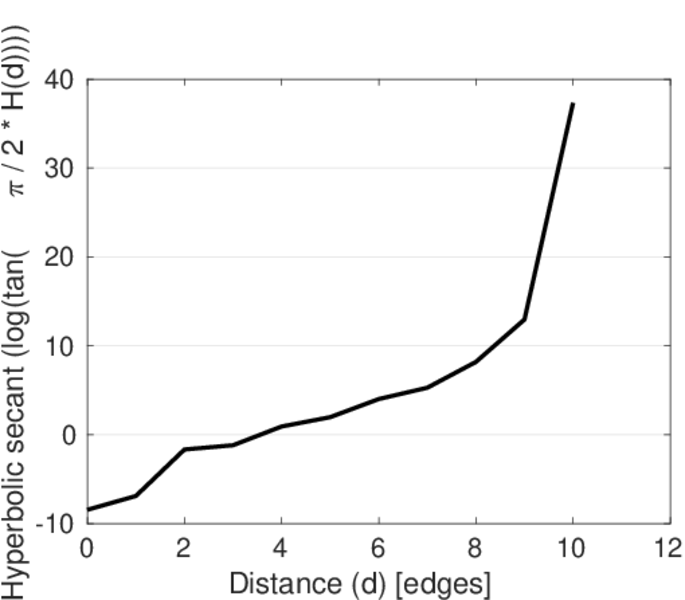
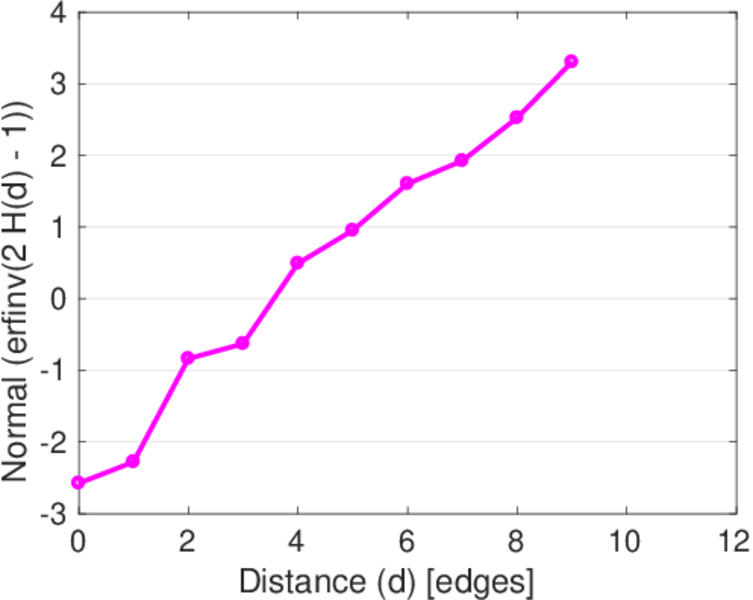
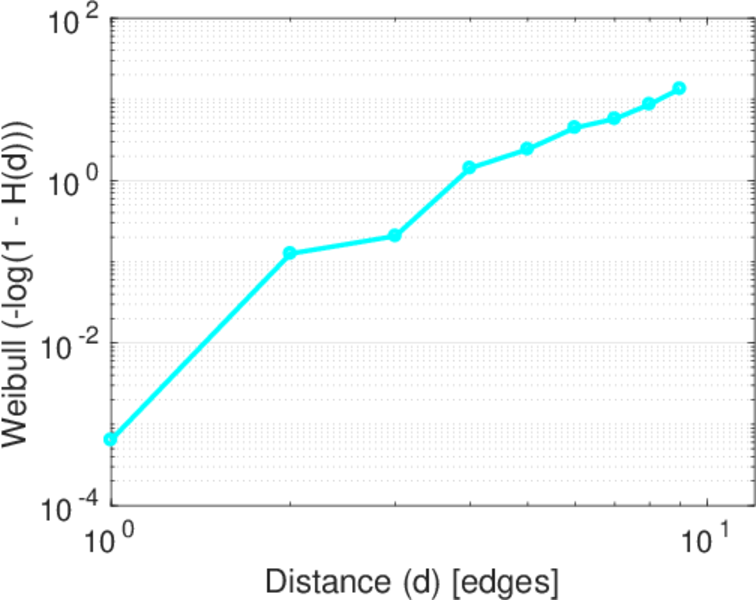
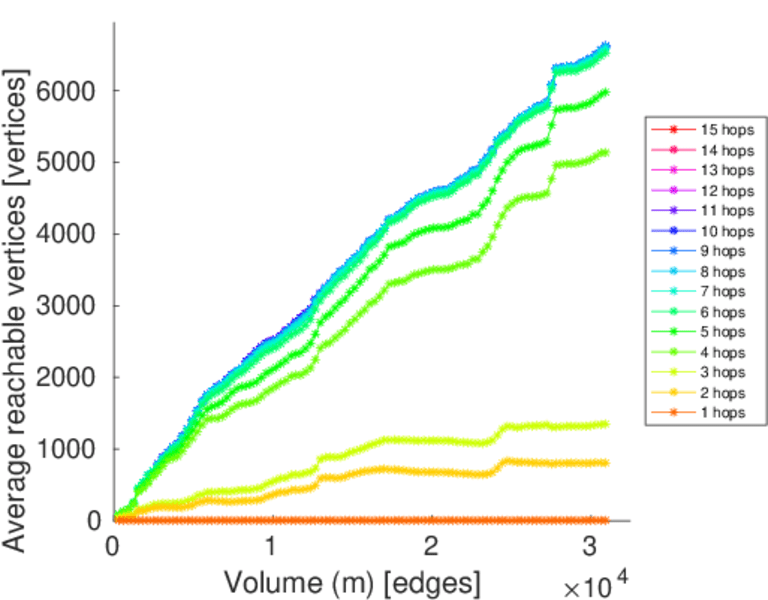
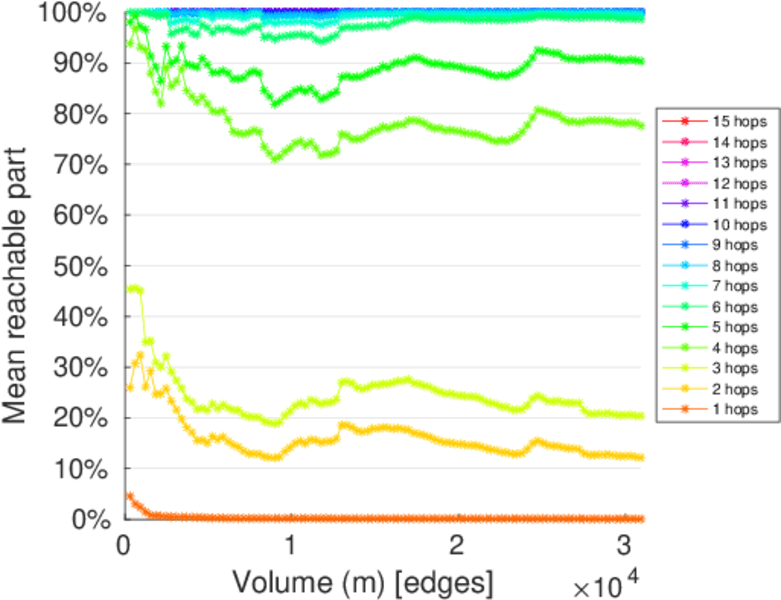
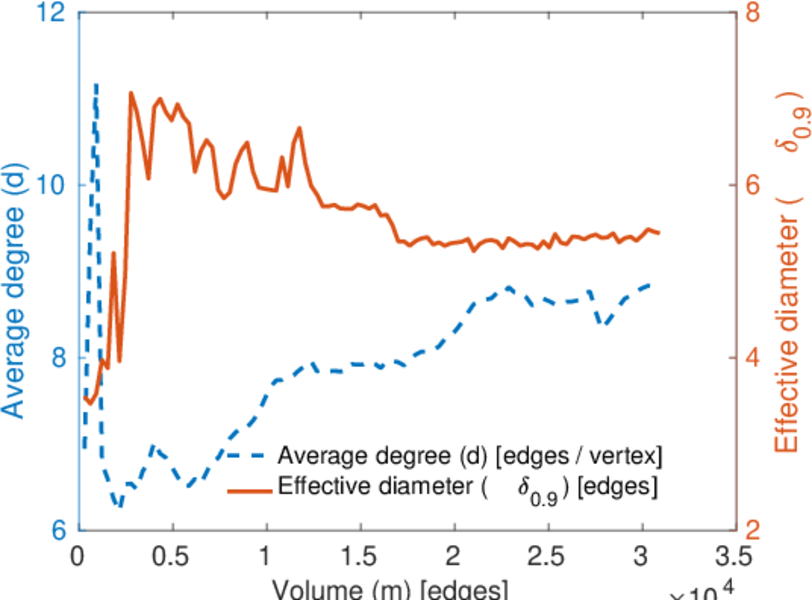
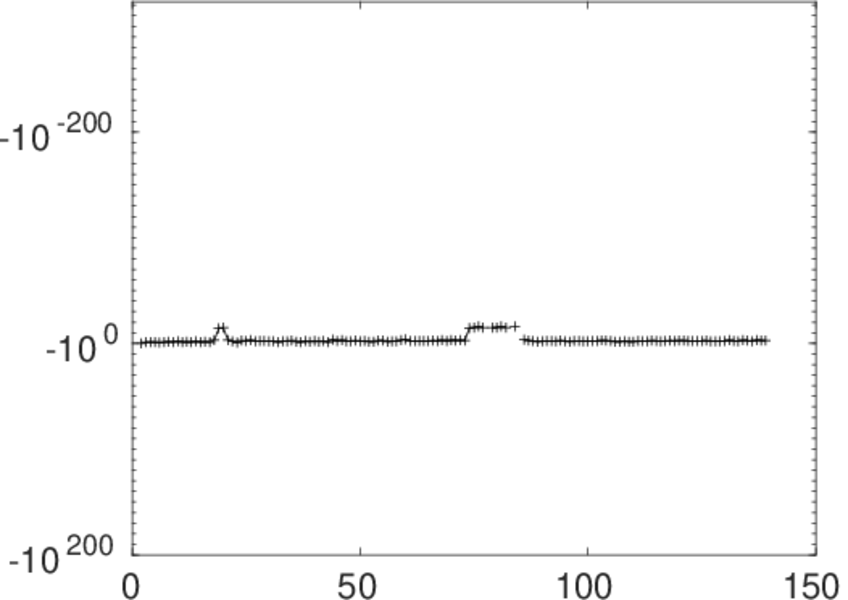
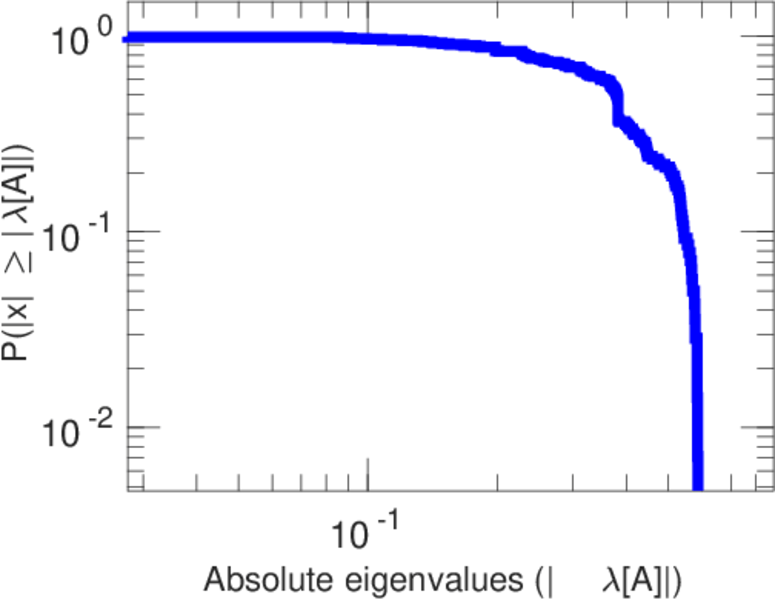
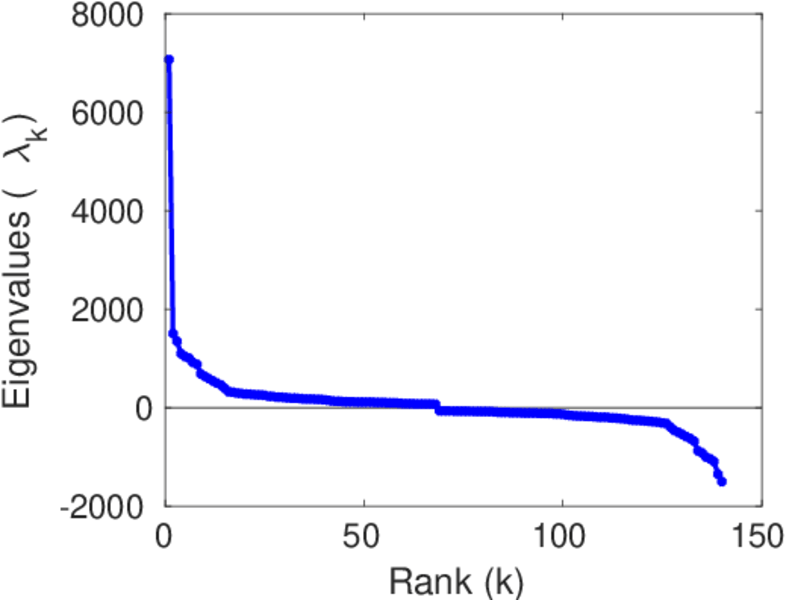
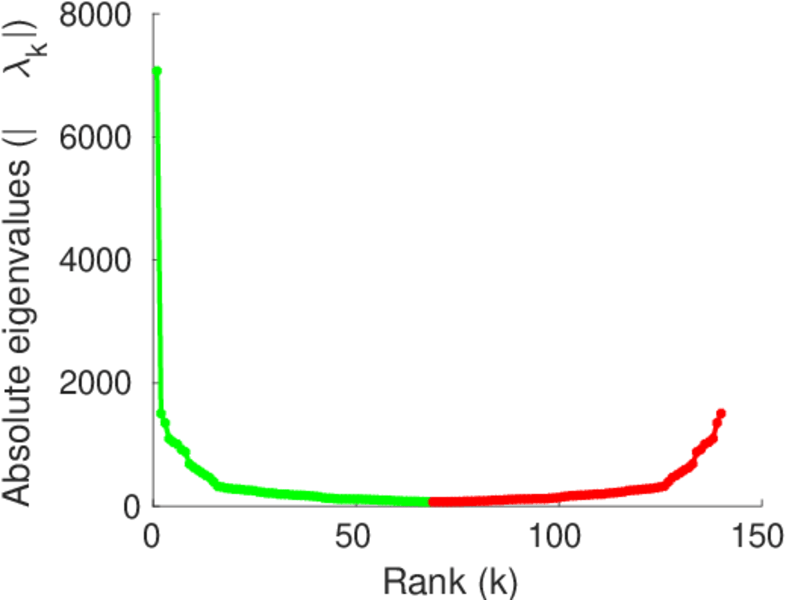
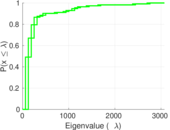
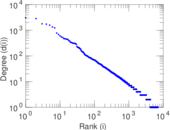
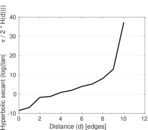
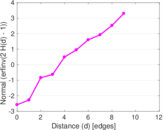
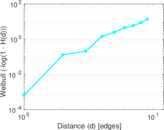
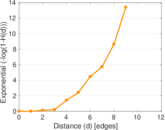
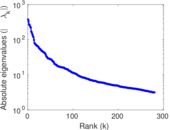
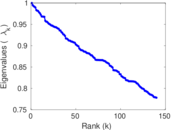
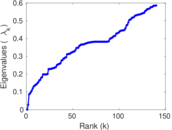
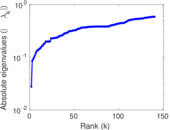
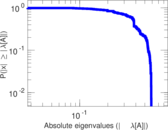
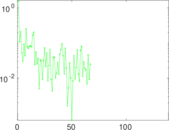
Plots


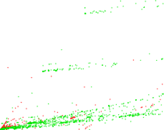

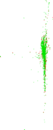


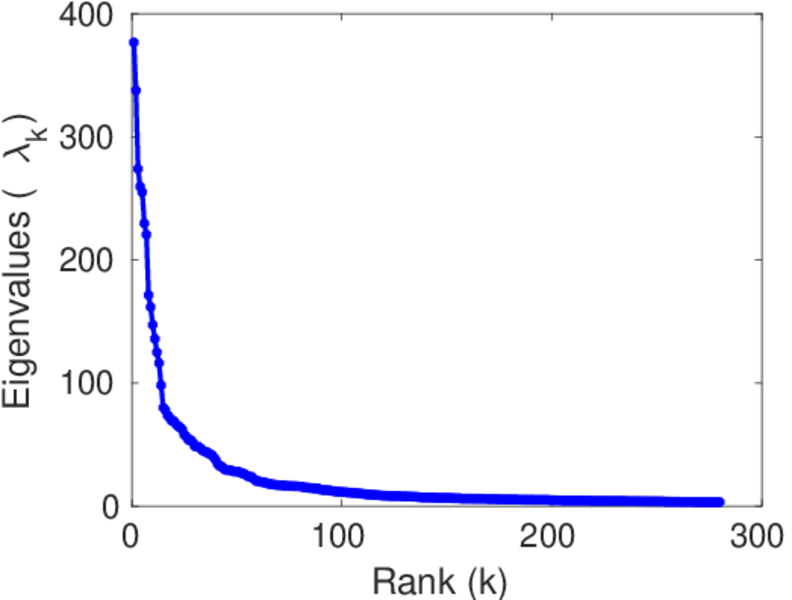
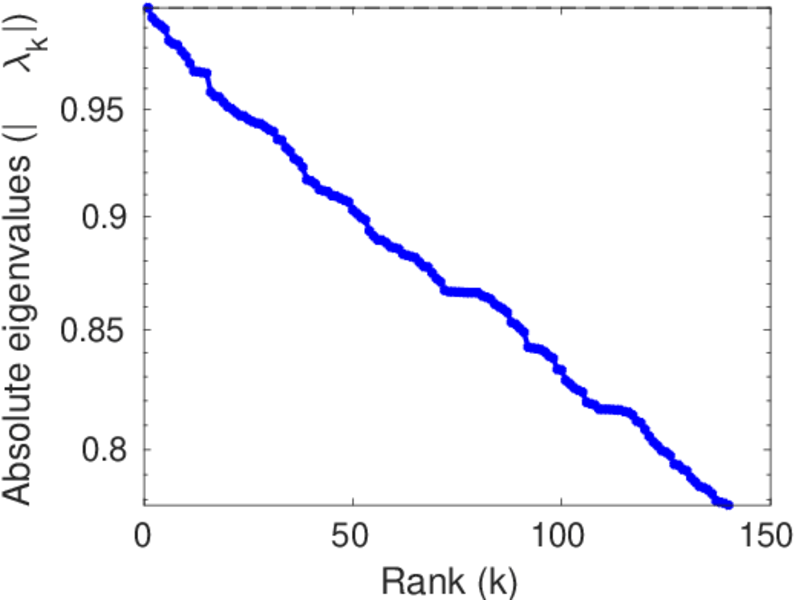
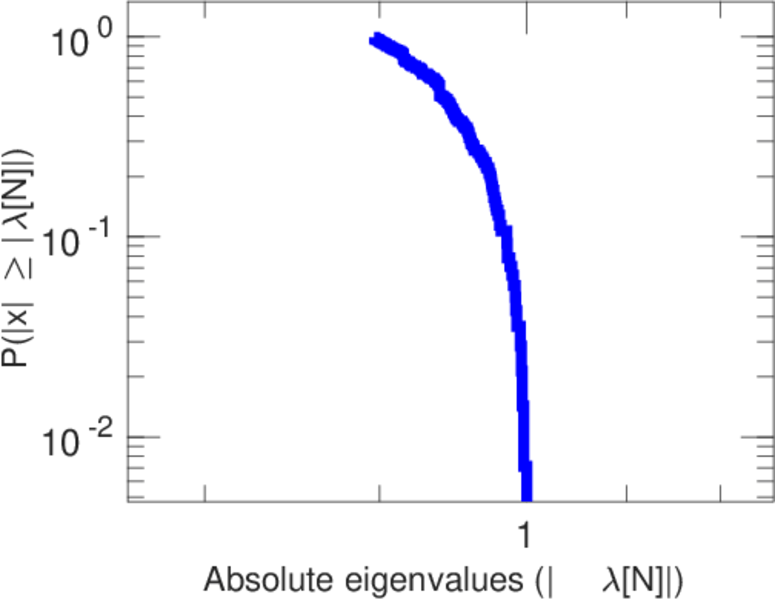
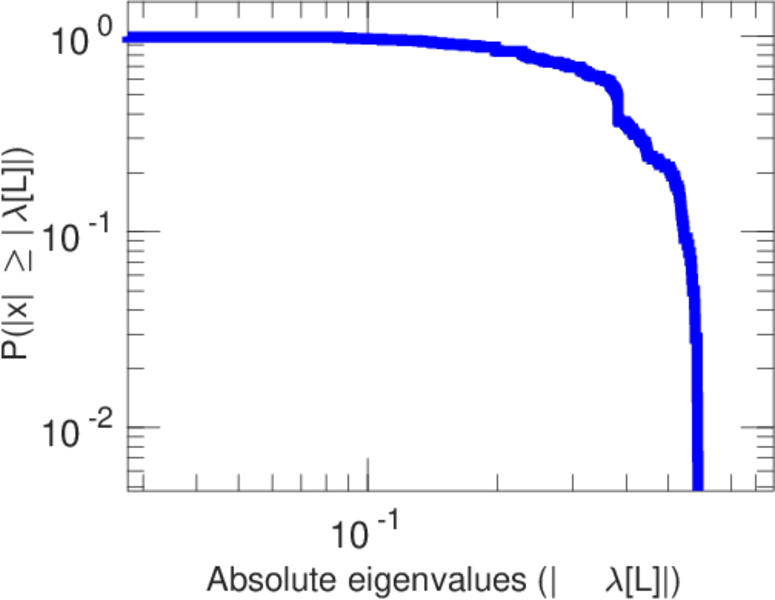
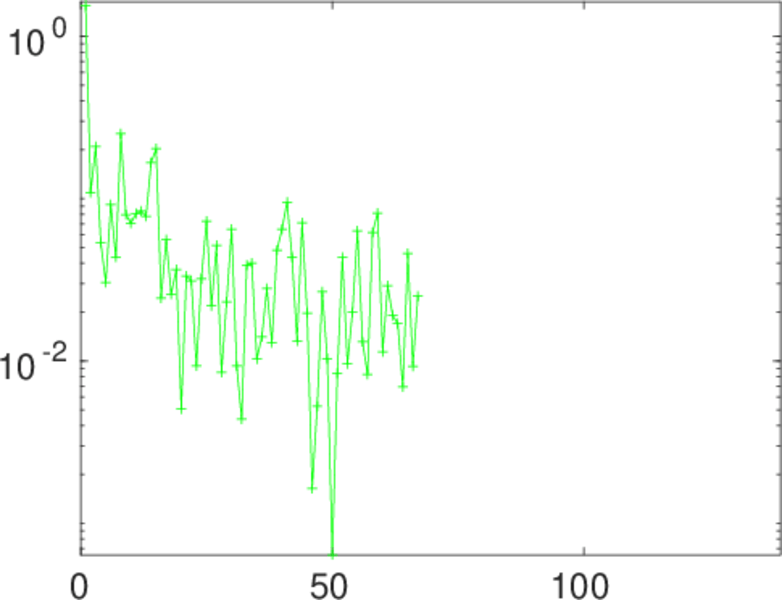
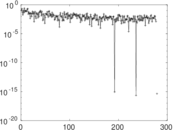
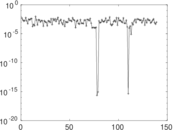
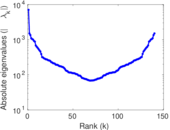
Matrix decompositions plots


Downloads
References
|
[1]
|
Jérôme Kunegis.
KONECT – The Koblenz Network Collection.
In Proc. Int. Conf. on World Wide Web Companion, pages
1343–1350, 2013.
[ http ]
|
|
[2]
|
Wikimedia Foundation.
Wikimedia downloads.
http://dumps.wikimedia.org/, January 2010.
|
 KONECT ‣ Networks ‣
Buy Me a Coffee
KONECT ‣ Networks ‣
Buy Me a Coffee