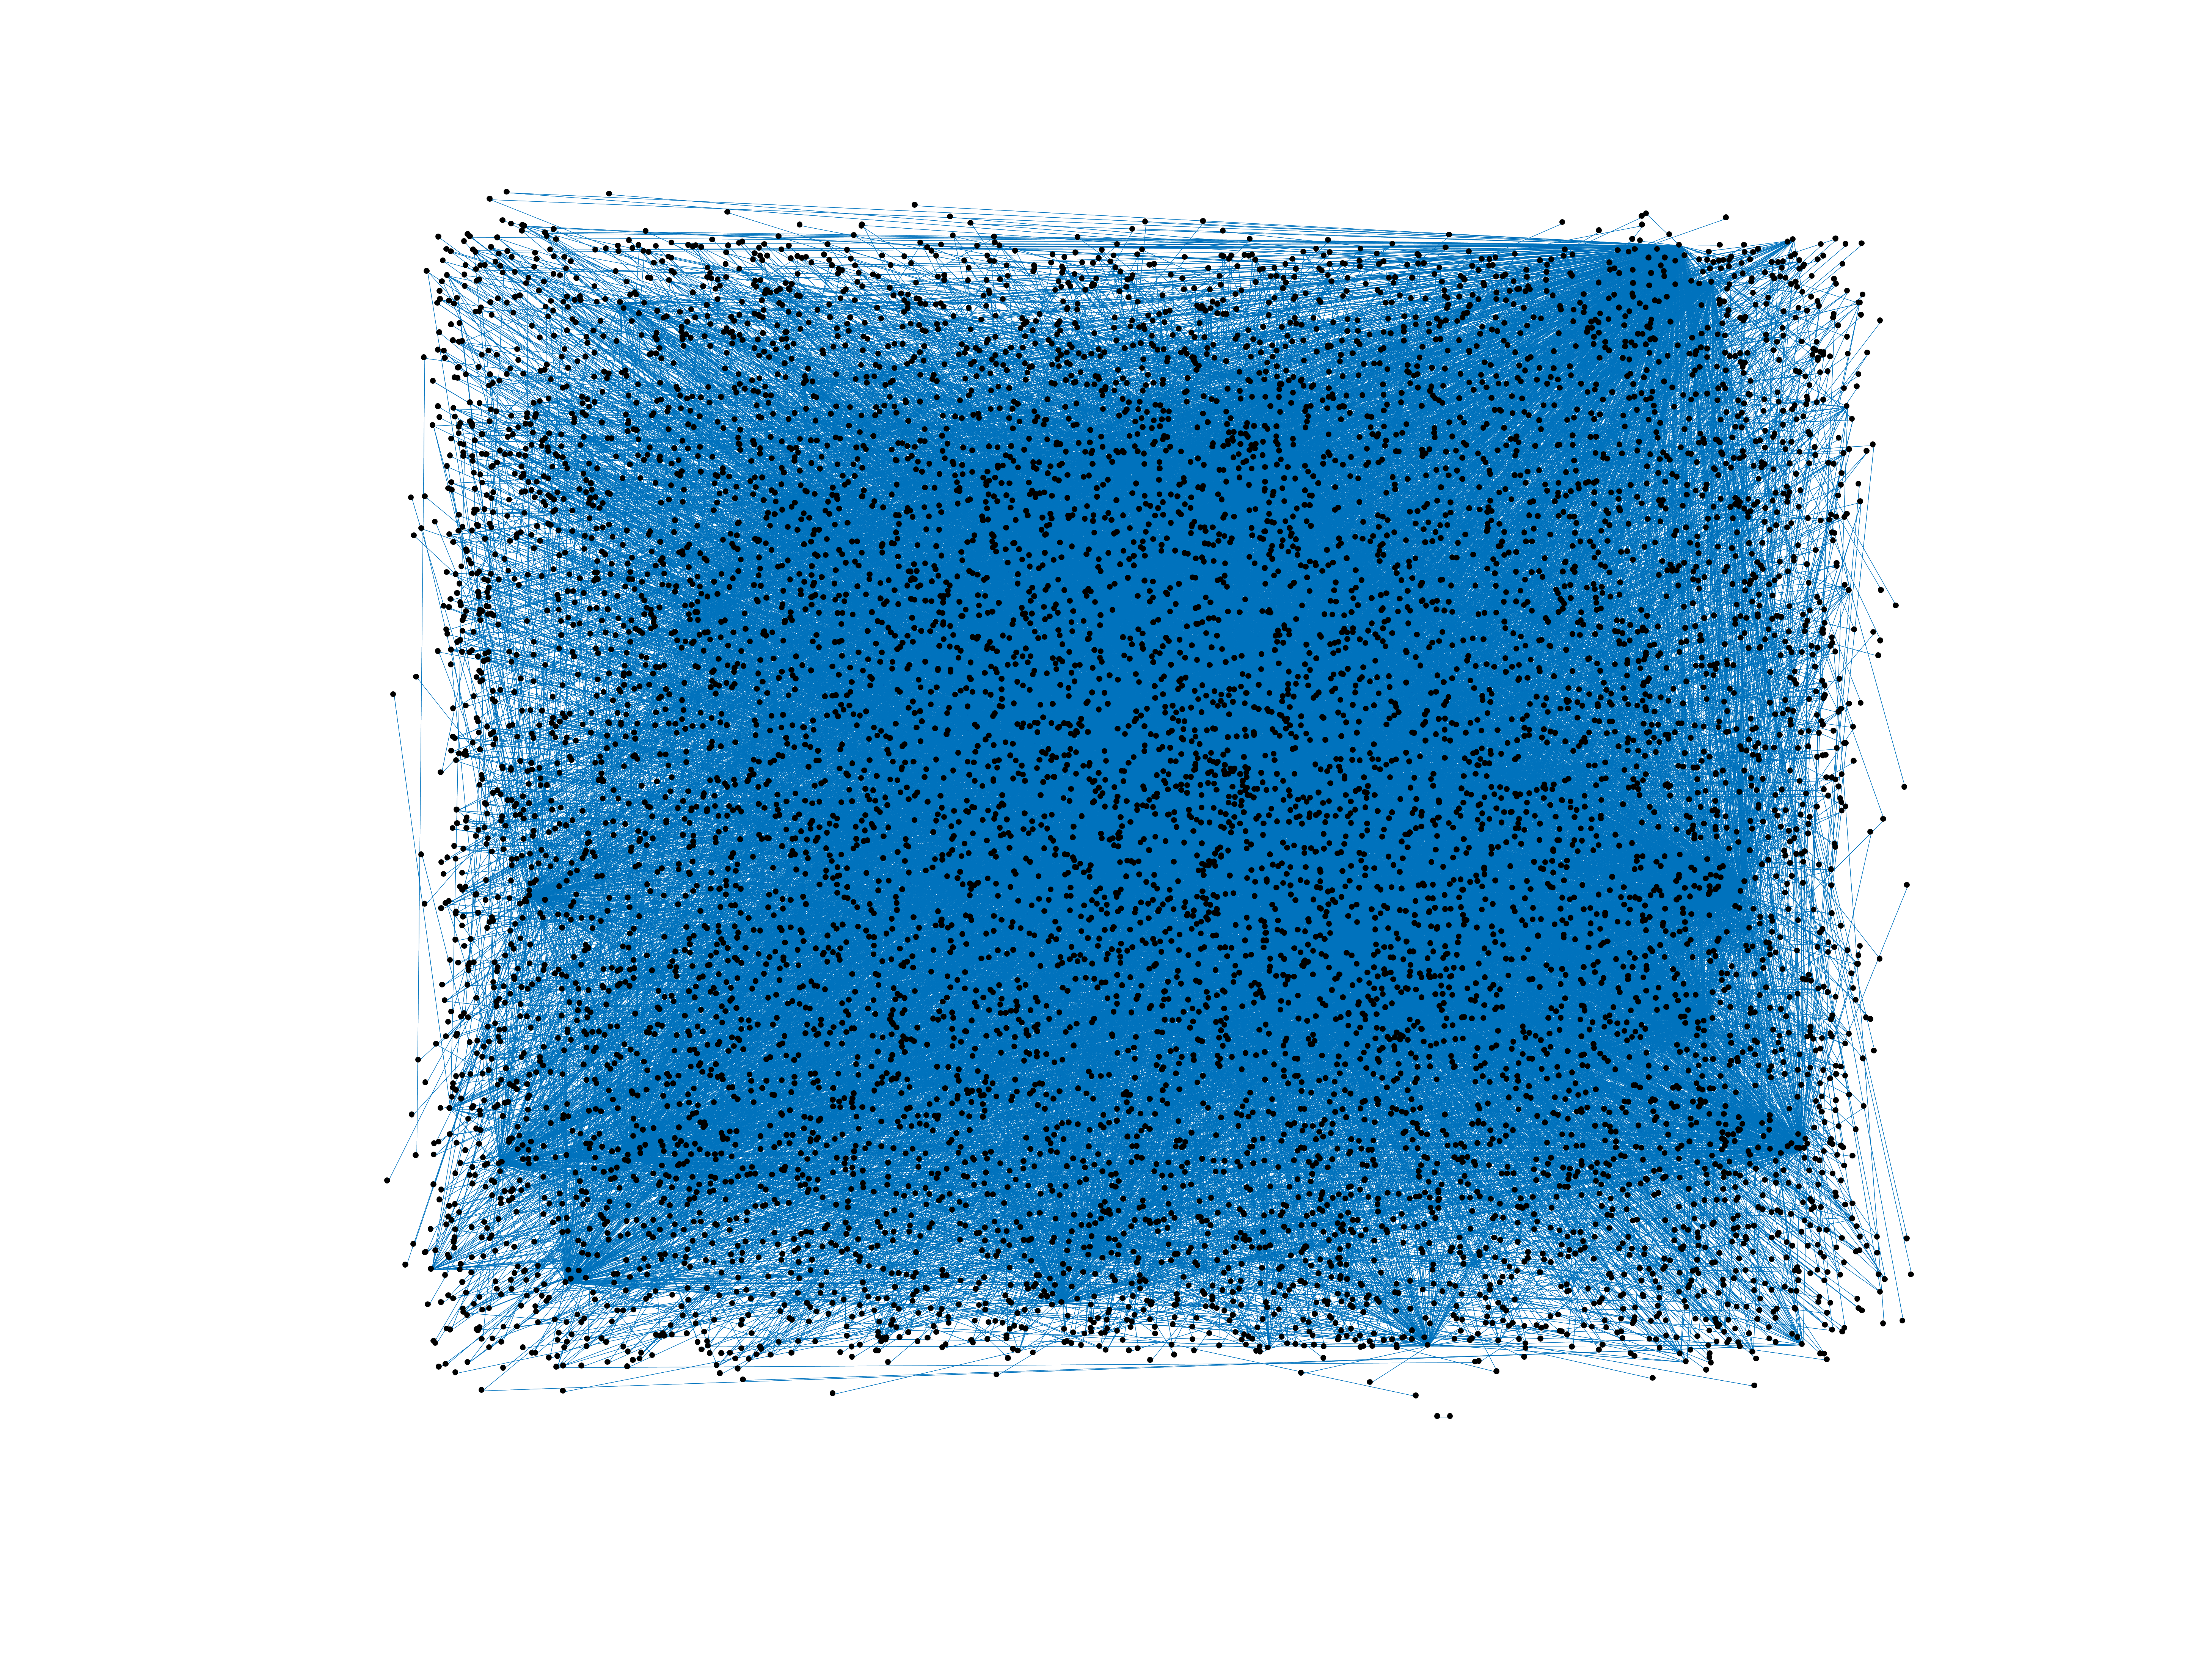
Wikinews edits (sv)
This is the bipartite edit network of the Swedish Wikinews. It contains users
and pages from the Swedish Wikinews, connected by edit events. Each edge
represents an edit. The dataset includes the timestamp of each edit.
Metadata
Statistics
| Size | n = | 9,105
|
| Left size | n1 = | 507
|
| Right size | n2 = | 8,598
|
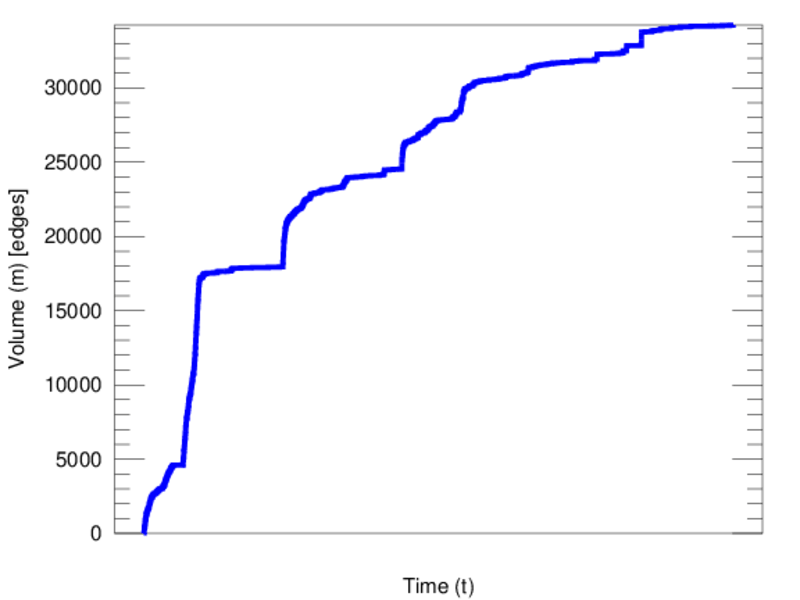
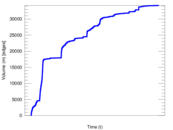
| Volume | m = | 34,241
|
| Unique edge count | m̿ = | 16,085
|
| Wedge count | s = | 9,131,710
|
| Claw count | z = | 8,217,892,978
|
| Cross count | x = | 6,900,289,567,148
|
| Square count | q = | 898,195
|
| 4-Tour count | T4 = | 43,746,766
|
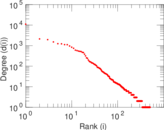
| Maximum degree | dmax = | 11,118
|
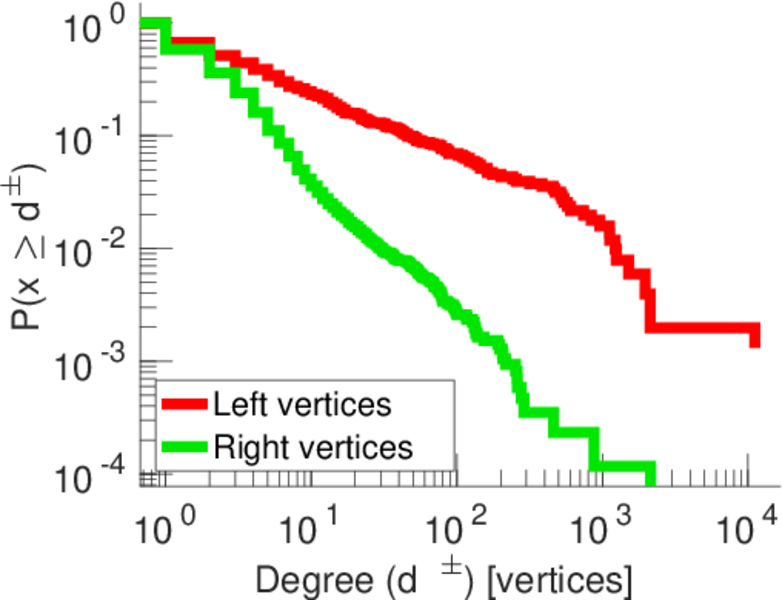
| Maximum left degree | d1max = | 11,118
|
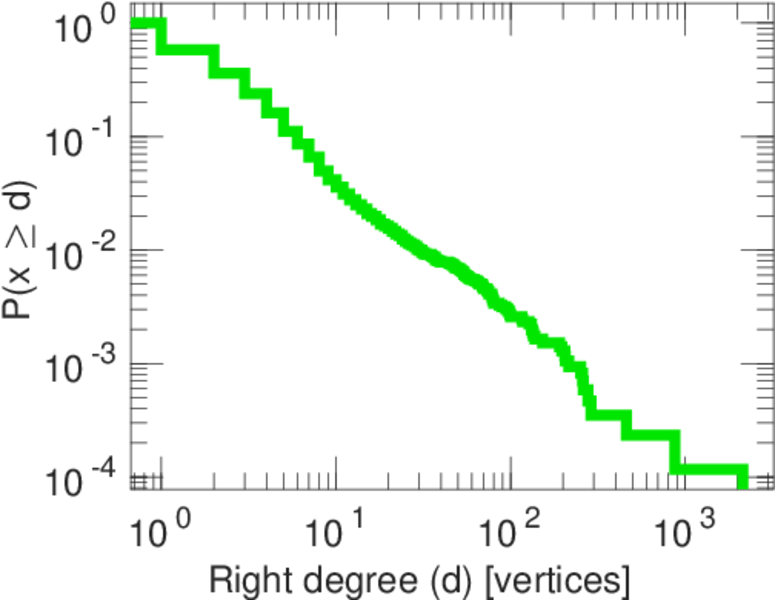
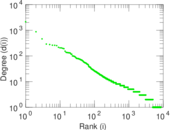
| Maximum right degree | d2max = | 2,138
|
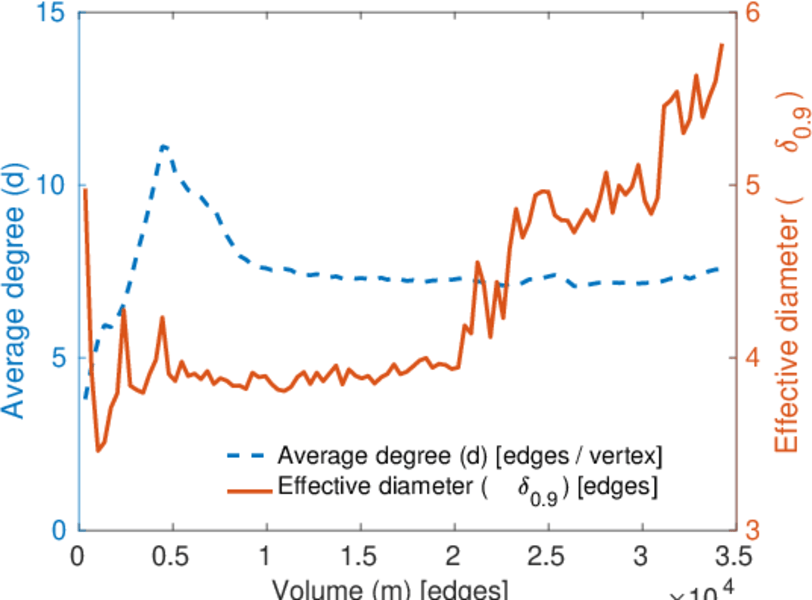
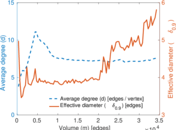
| Average degree | d = | 7.521 36
|
| Average left degree | d1 = | 67.536 5
|
| Average right degree | d2 = | 3.982 44
|
| Fill | p = | 0.003 689 91
|
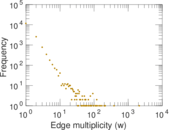
| Average edge multiplicity | m̃ = | 2.128 75
|
| Size of LCC | N = | 8,741
|
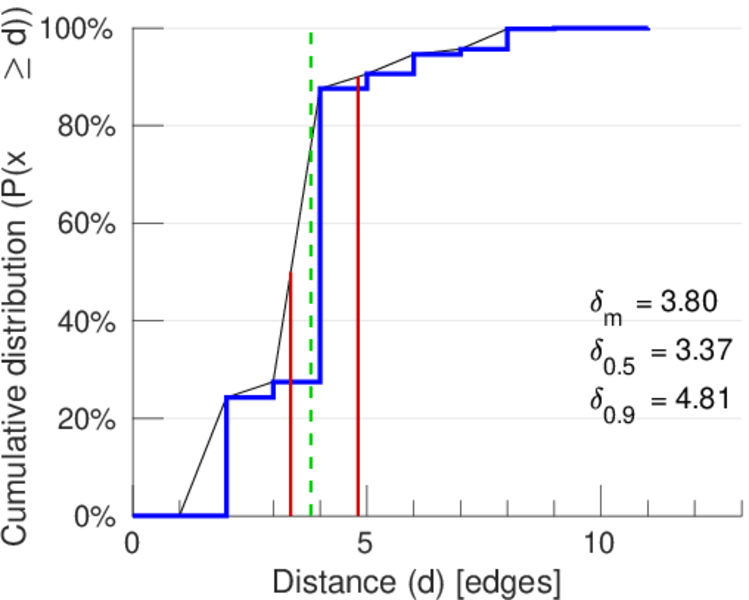
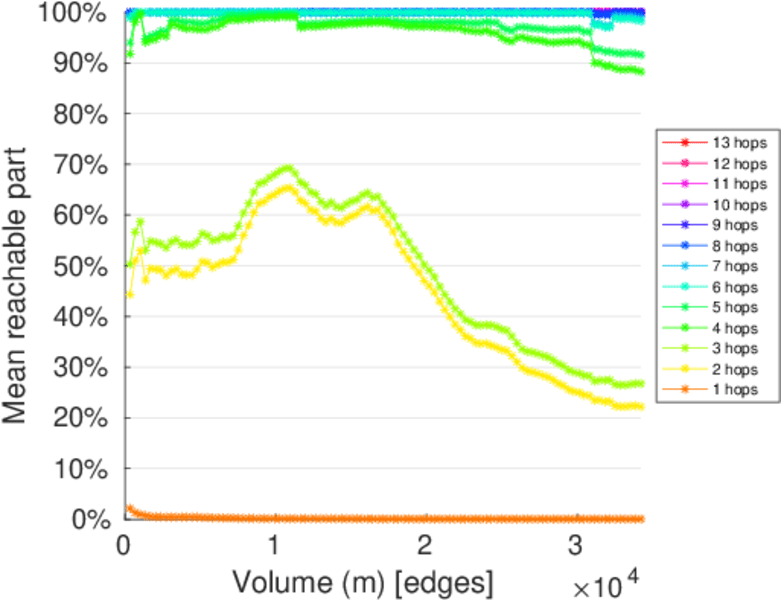
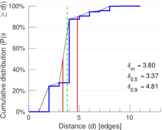
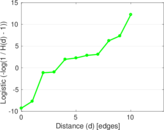
| Diameter | δ = | 12
|
| 50-Percentile effective diameter | δ0.5 = | 3.374 88
|
| 90-Percentile effective diameter | δ0.9 = | 4.813 18
|
| Median distance | δM = | 4
|
| Mean distance | δm = | 3.800 95
|
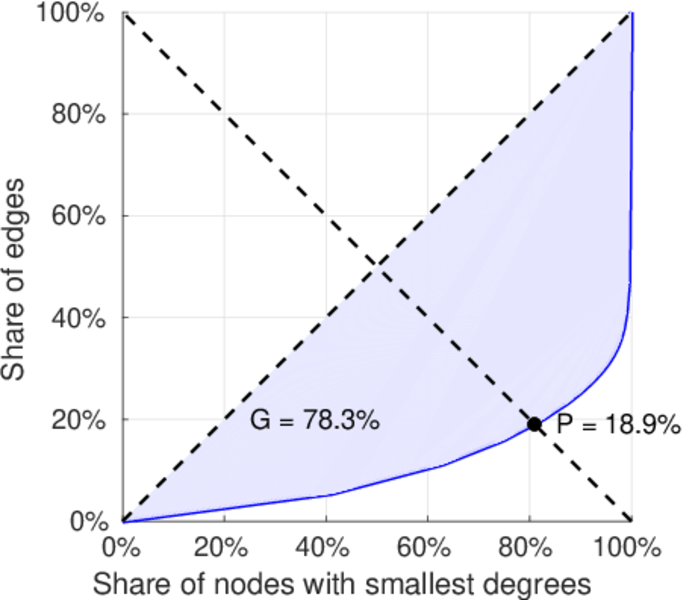
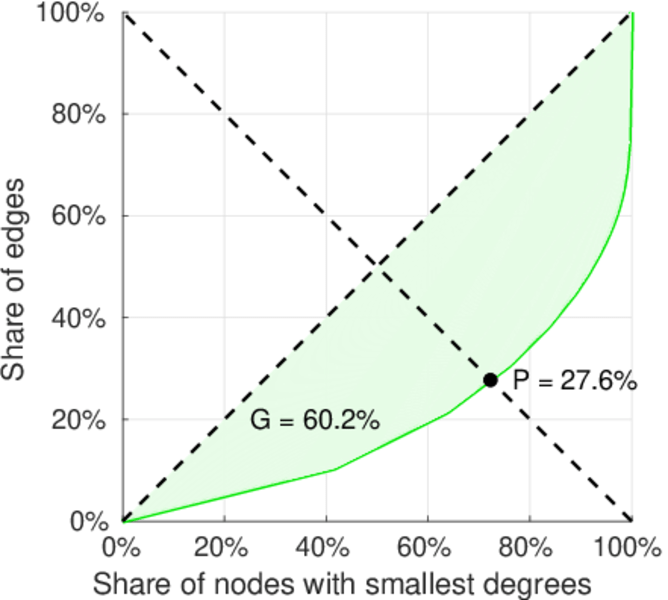
| Gini coefficient | G = | 0.790 166
|
| Balanced inequality ratio | P = | 0.184 851
|
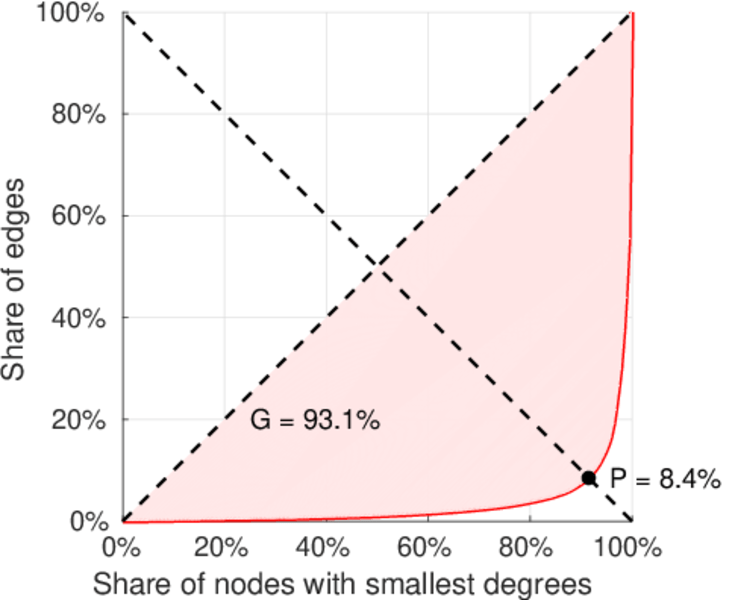
| Left balanced inequality ratio | P1 = | 0.083 584 0
|
| Right balanced inequality ratio | P2 = | 0.275 839
|
| Relative edge distribution entropy | Her = | 0.760 425
|
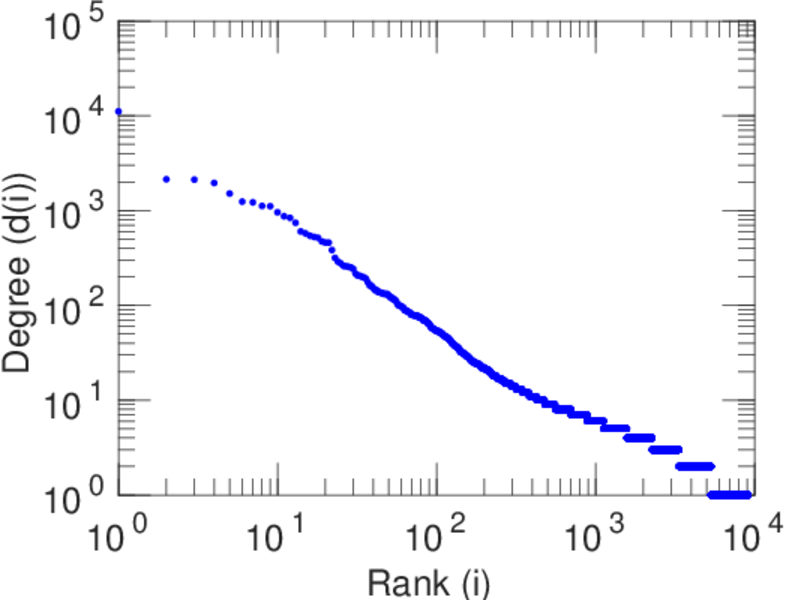
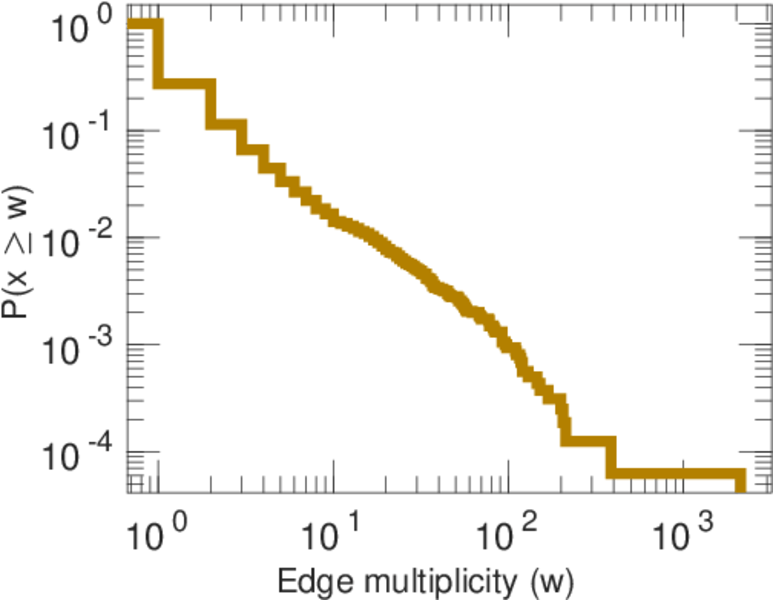
| Power law exponent | γ = | 3.147 93
|
| Tail power law exponent | γt = | 2.601 00
|
| Tail power law exponent with p | γ3 = | 2.601 00
|
| p-value | p = | 0.000 00
|
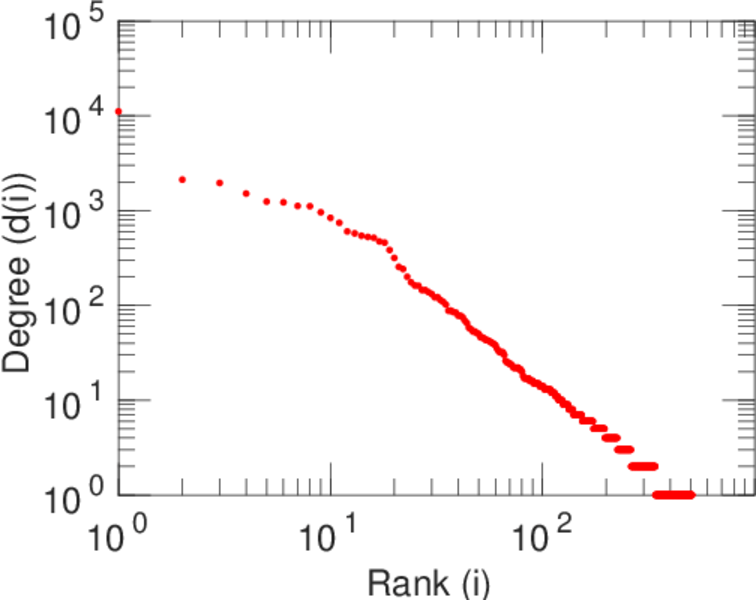
| Left tail power law exponent with p | γ3,1 = | 1.601 00
|
| Left p-value | p1 = | 0.797 000
|
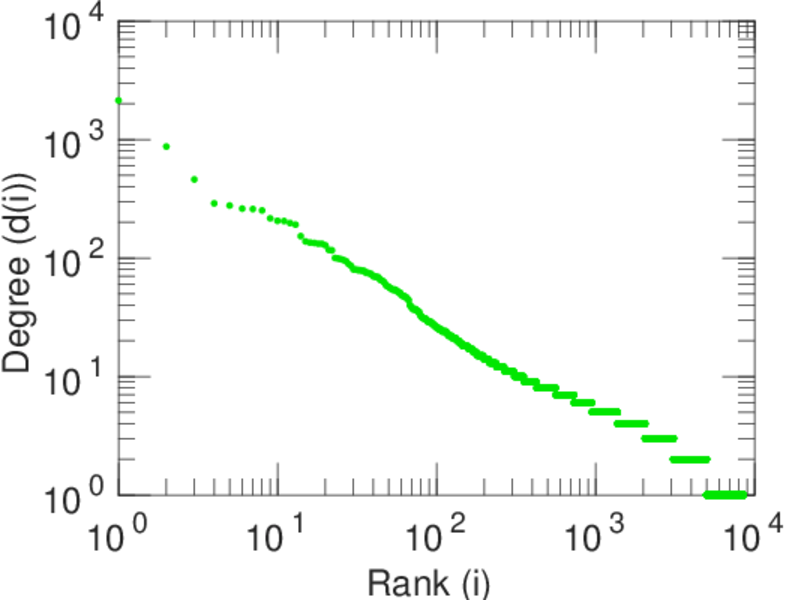
| Right tail power law exponent with p | γ3,2 = | 4.401 00
|
| Right p-value | p2 = | 0.072 000 0
|
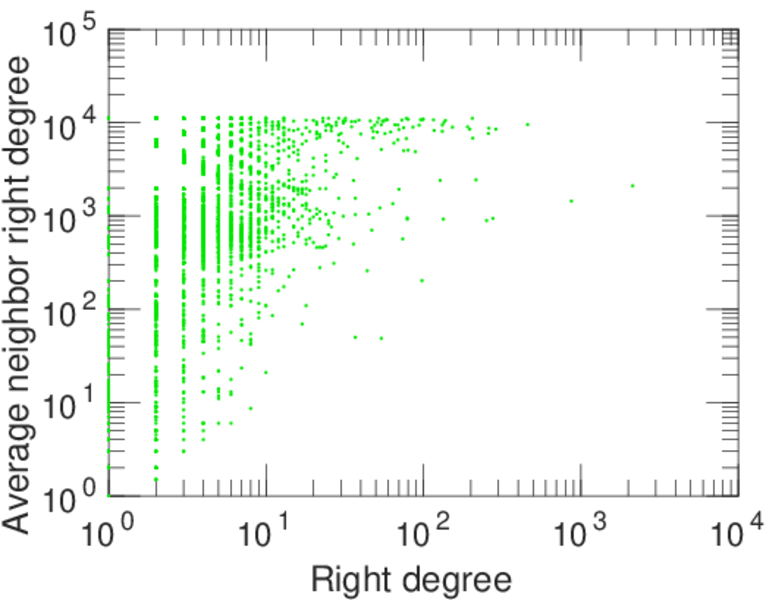
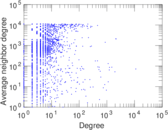
| Degree assortativity | ρ = | −0.152 786
|
| Degree assortativity p-value | pρ = | 1.326 64 × 10−84
|
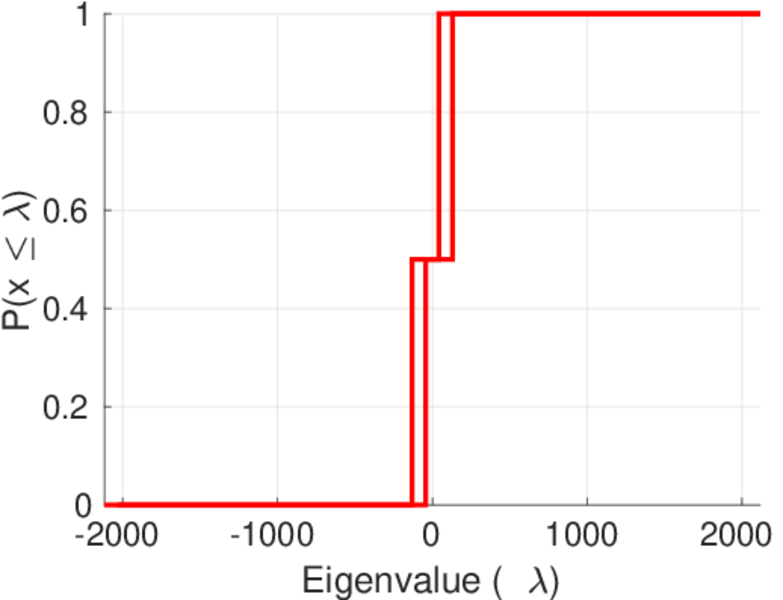
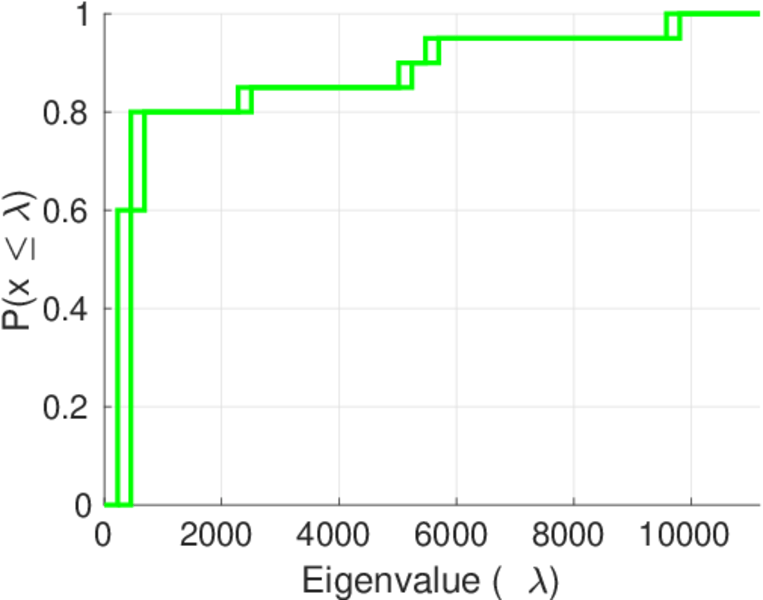
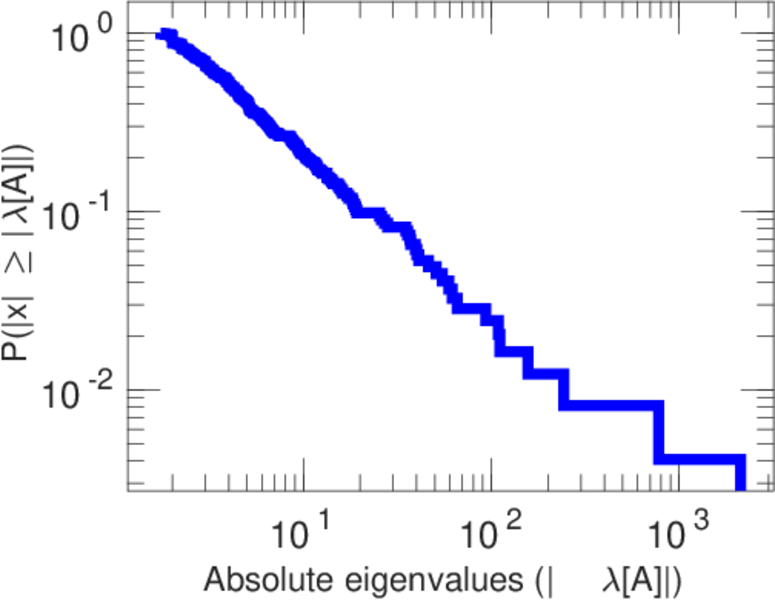
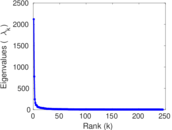
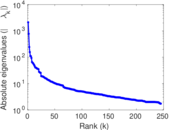
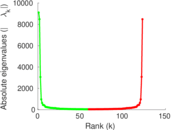
| Spectral norm | α = | 2,119.09
|
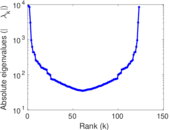
| Algebraic connectivity | a = | 0.009 641 00
|
| Spectral separation | |λ1[A] / λ2[A]| = | 2.729 84
|
| Controllability | C = | 8,117
|
| Relative controllability | Cr = | 0.896 411
|
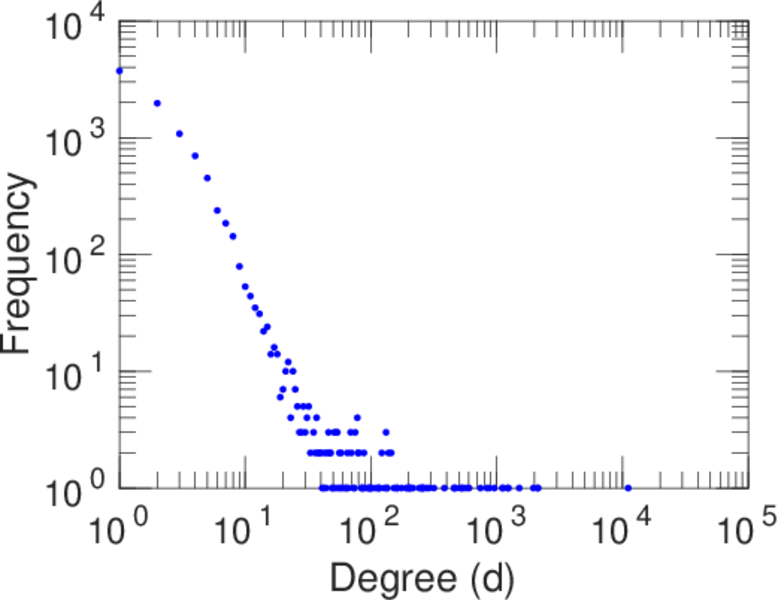
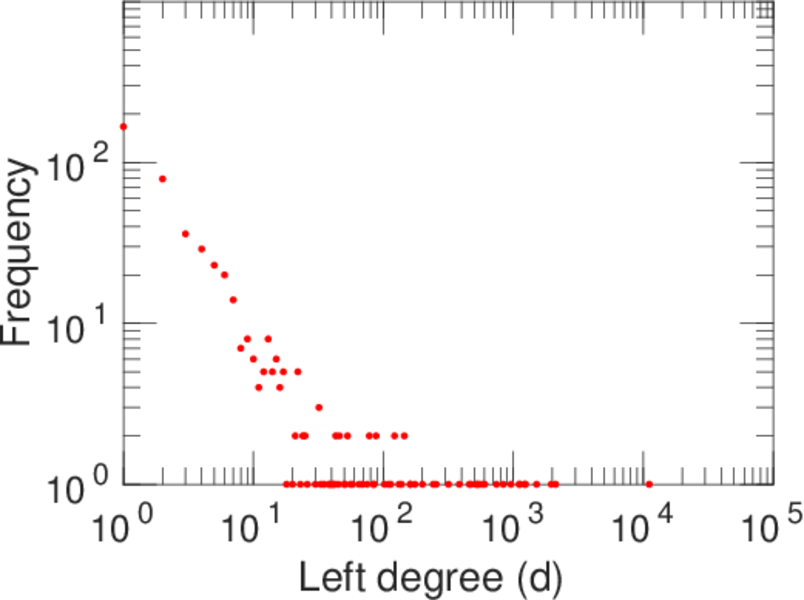
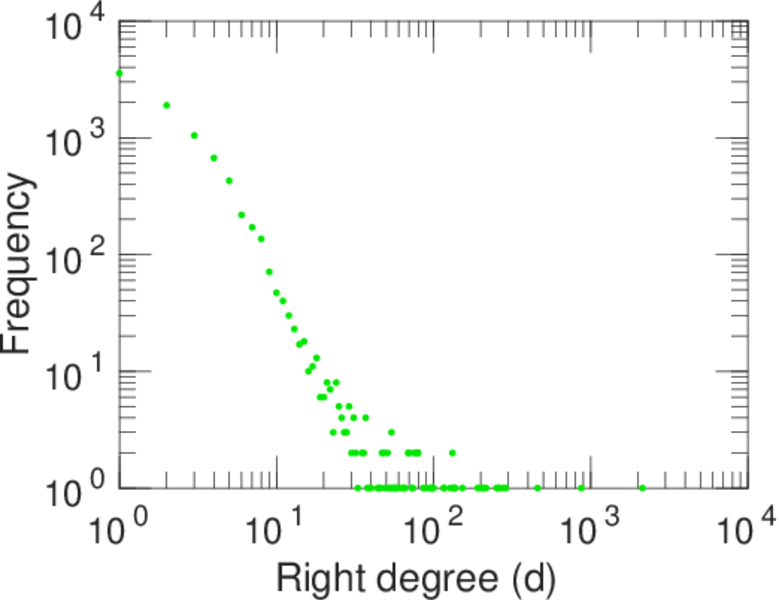
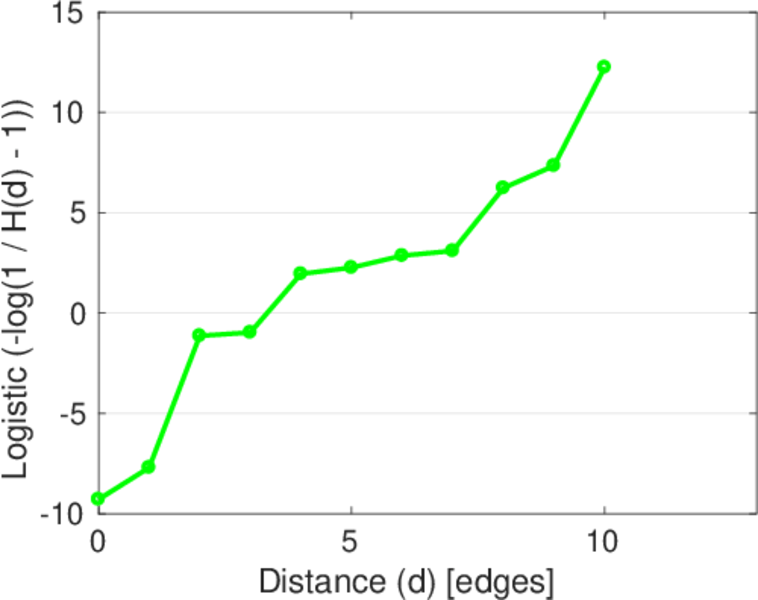
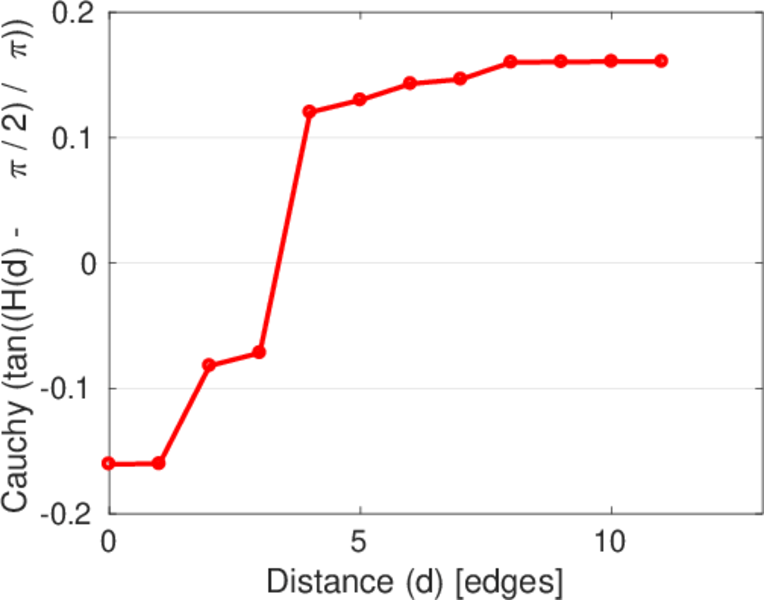
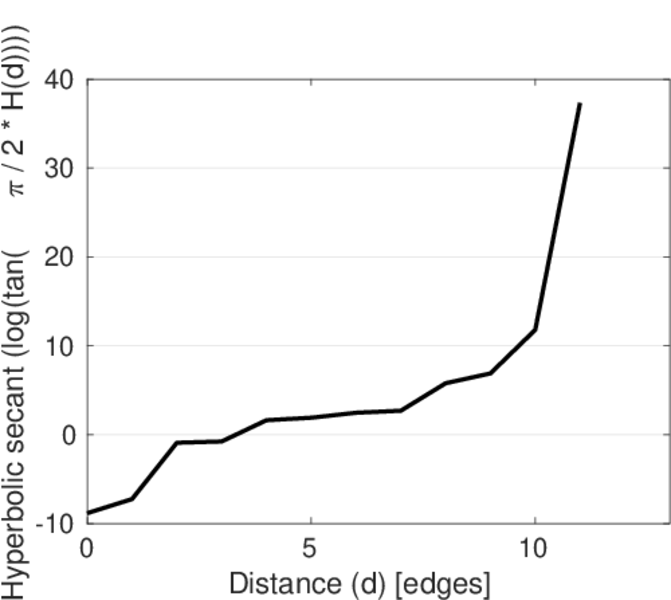
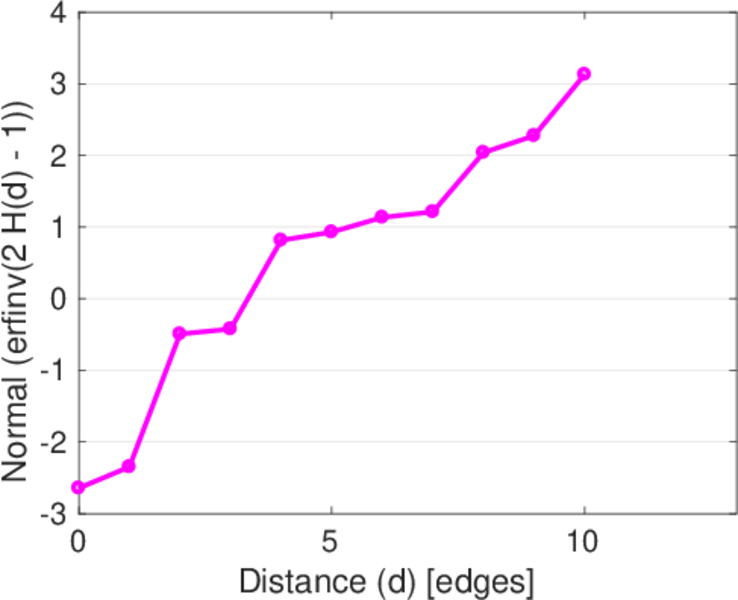
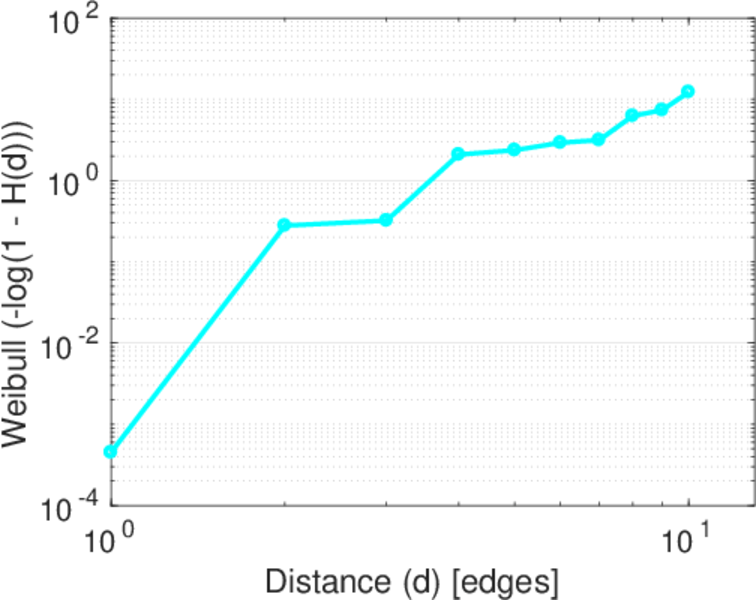
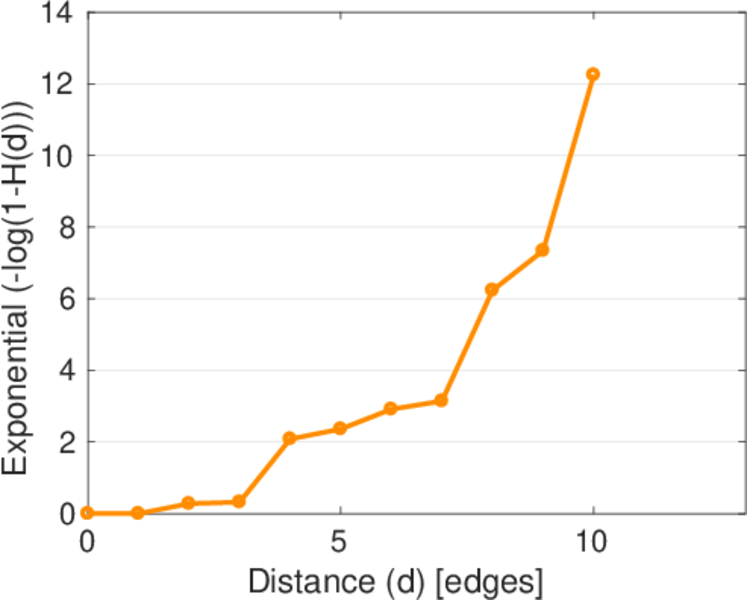
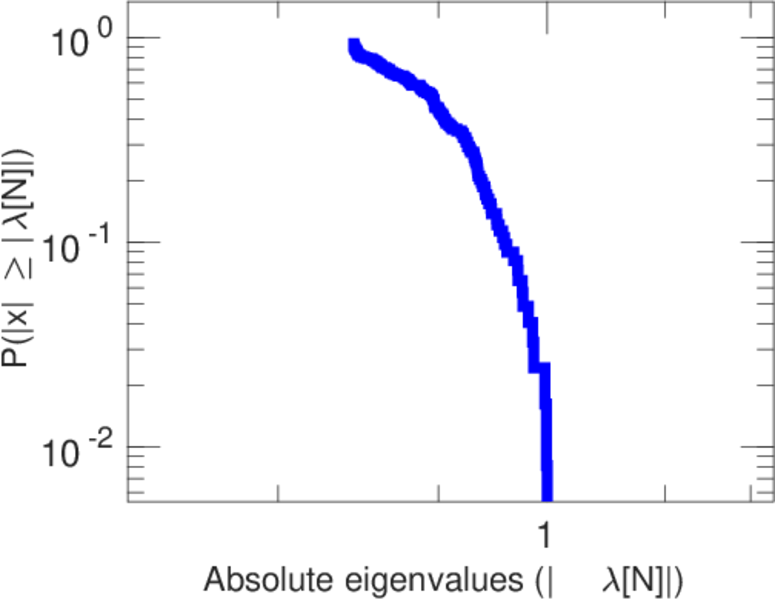
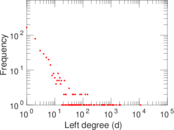
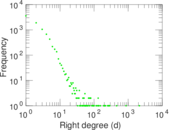
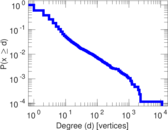
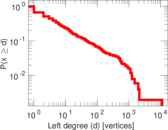
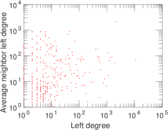
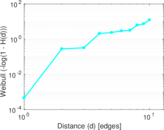
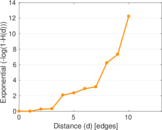
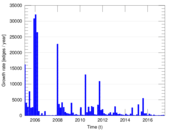
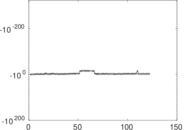
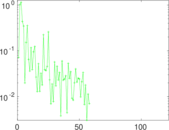
Plots


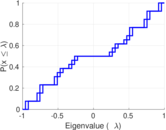
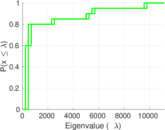


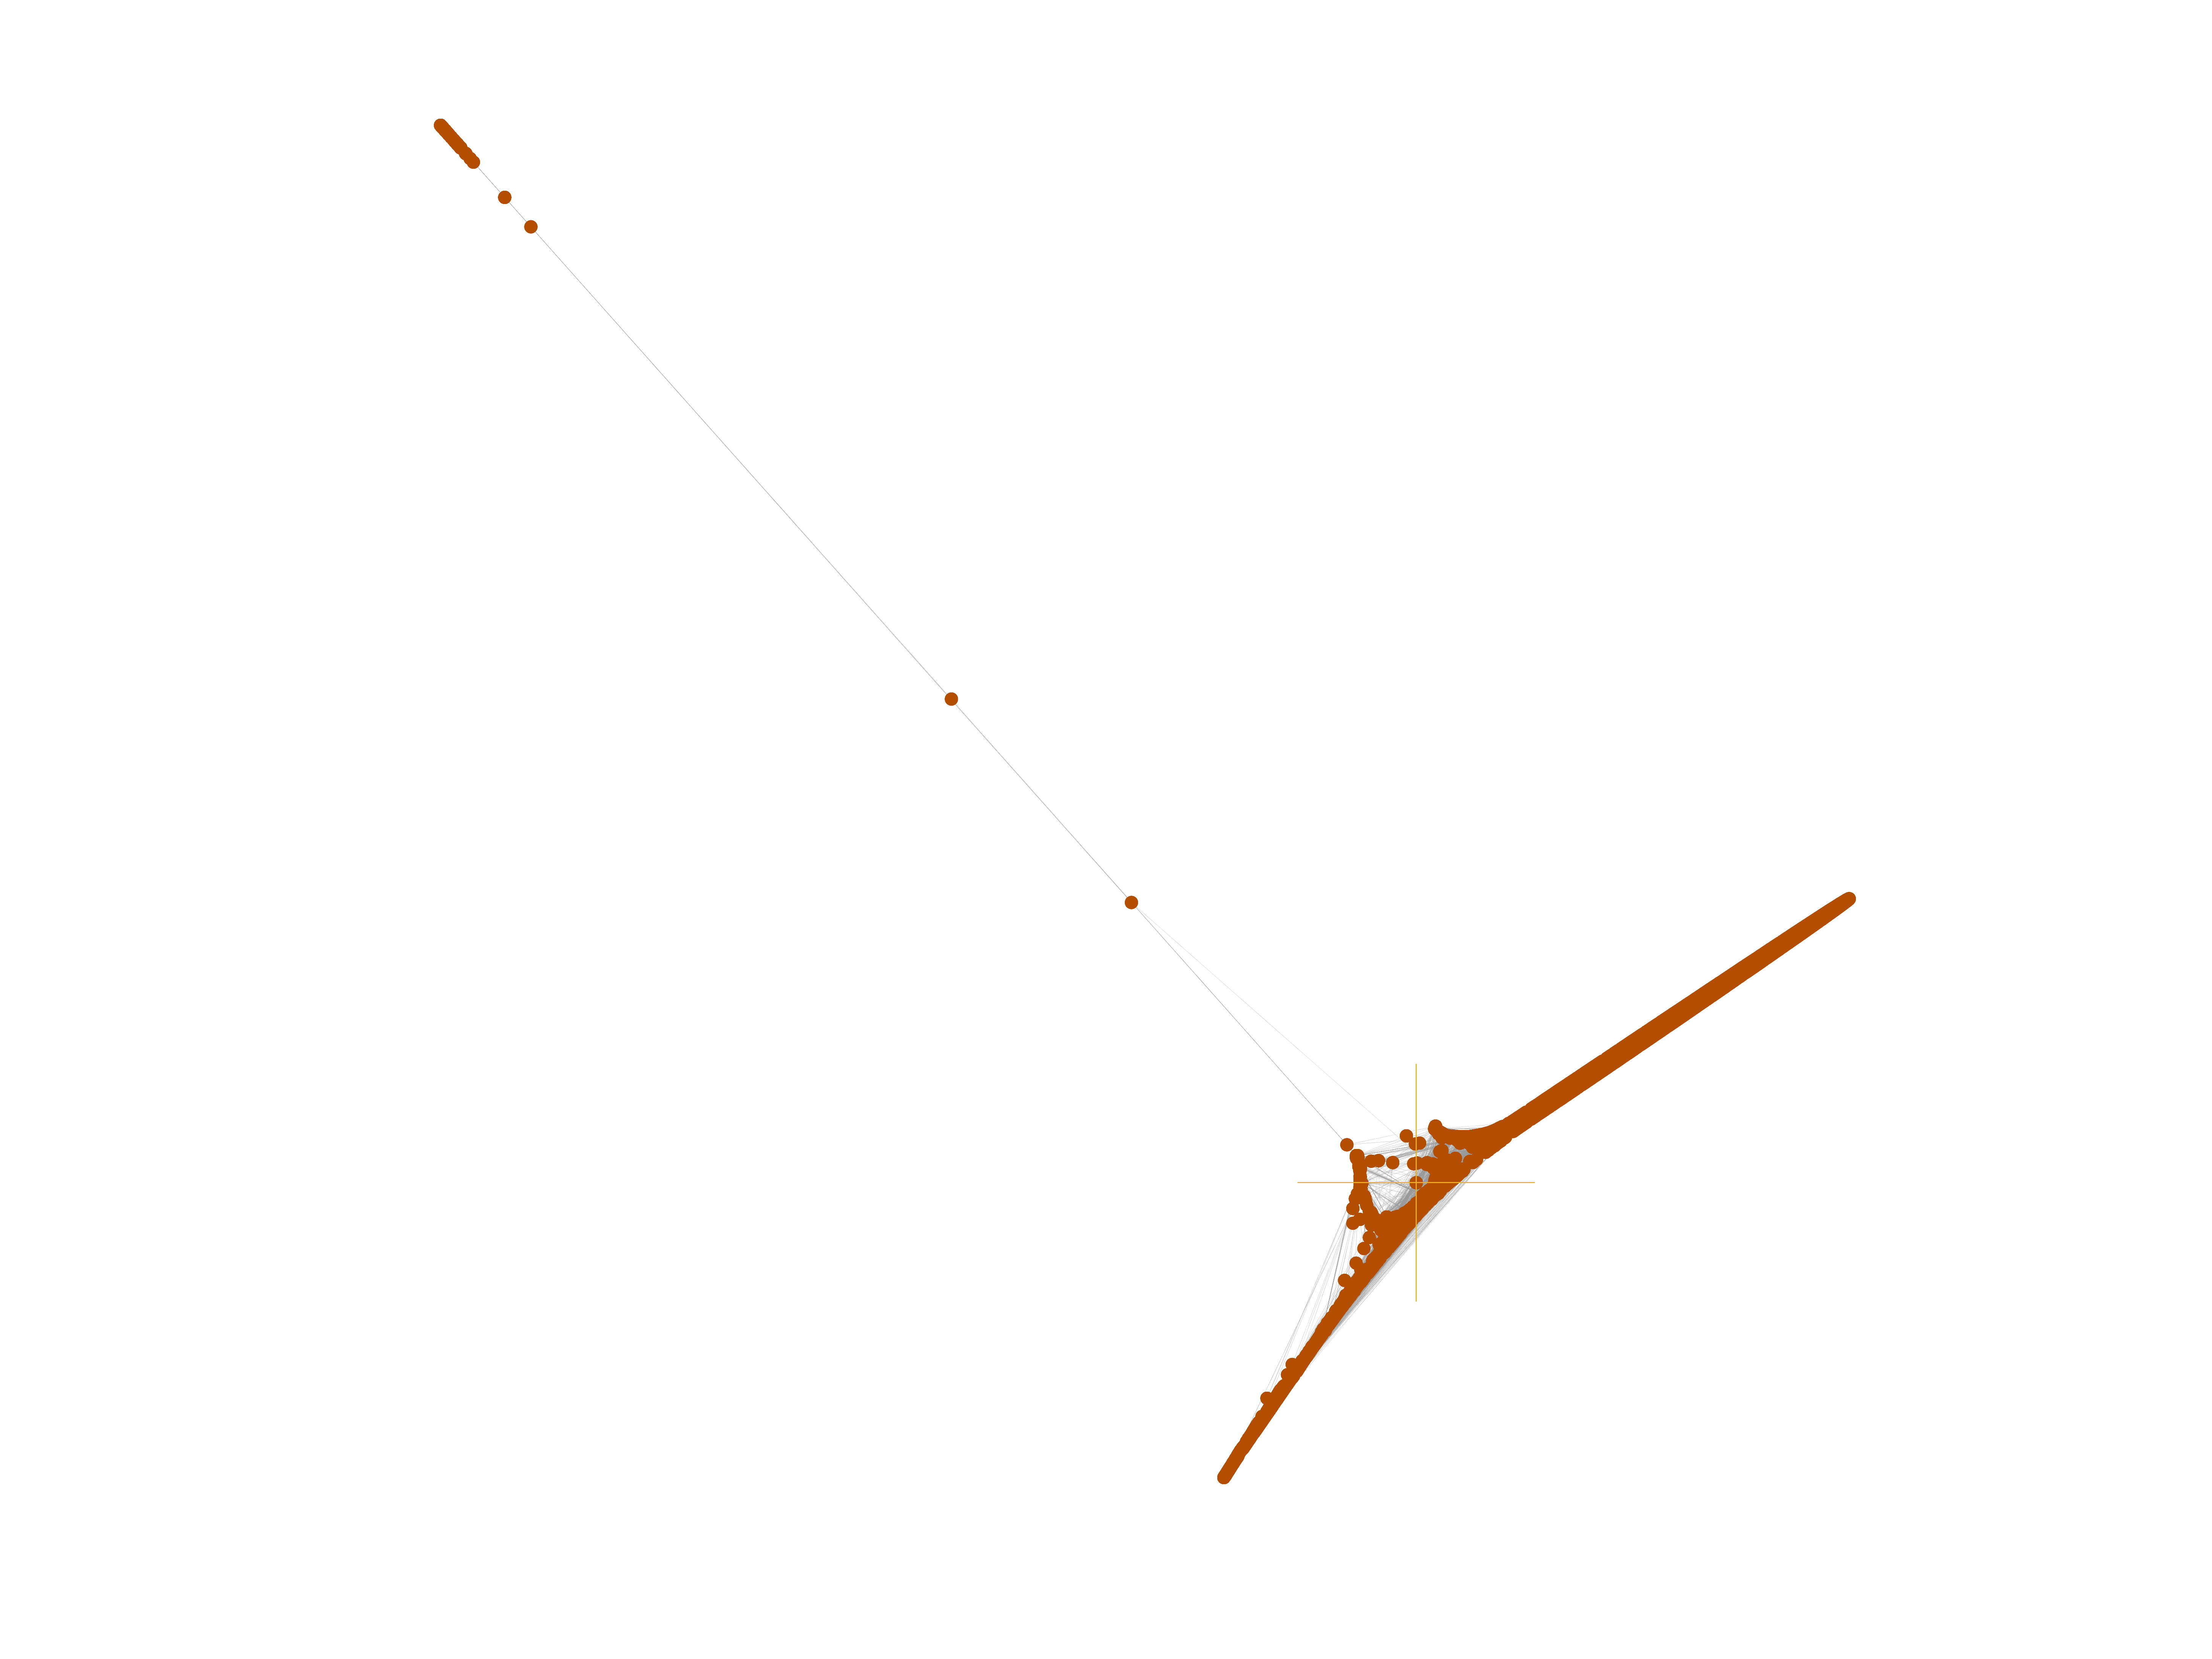
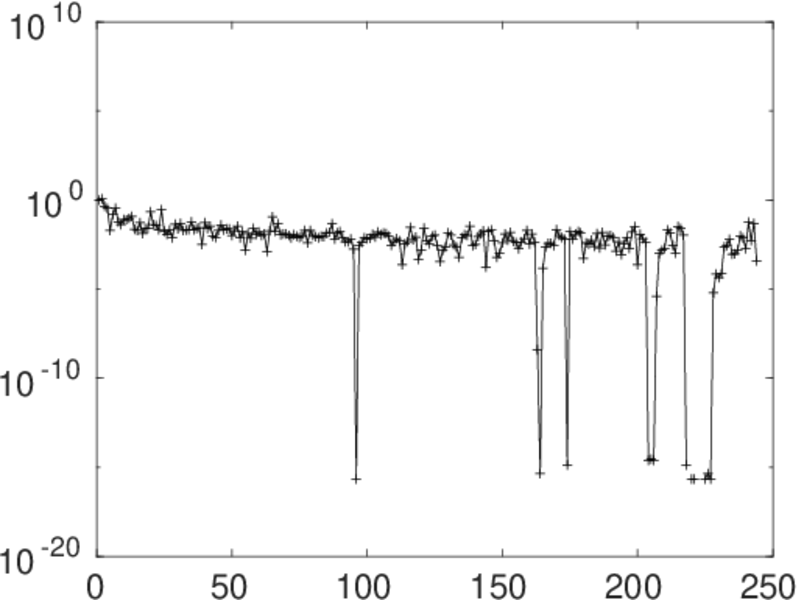
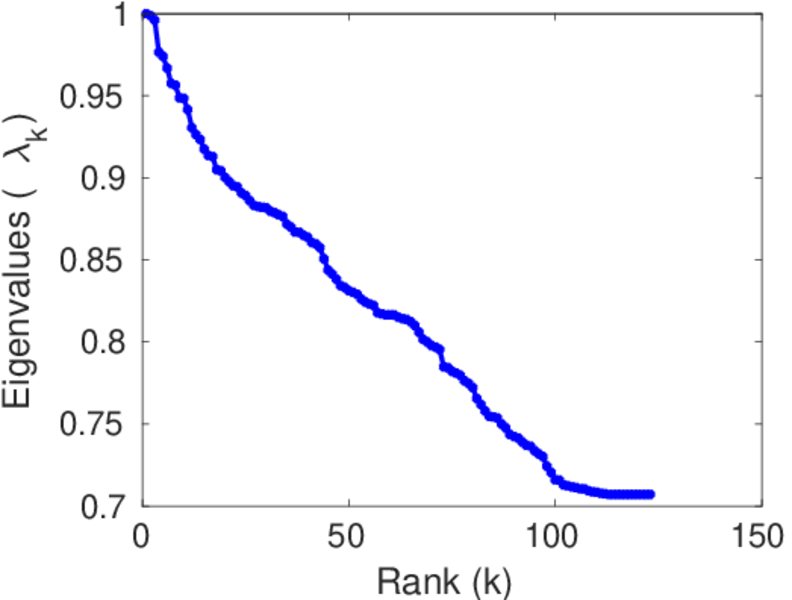
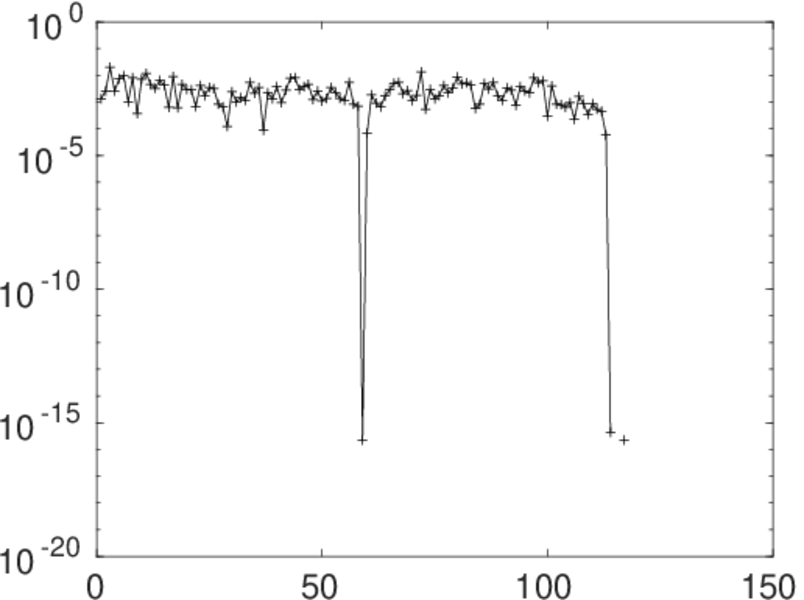
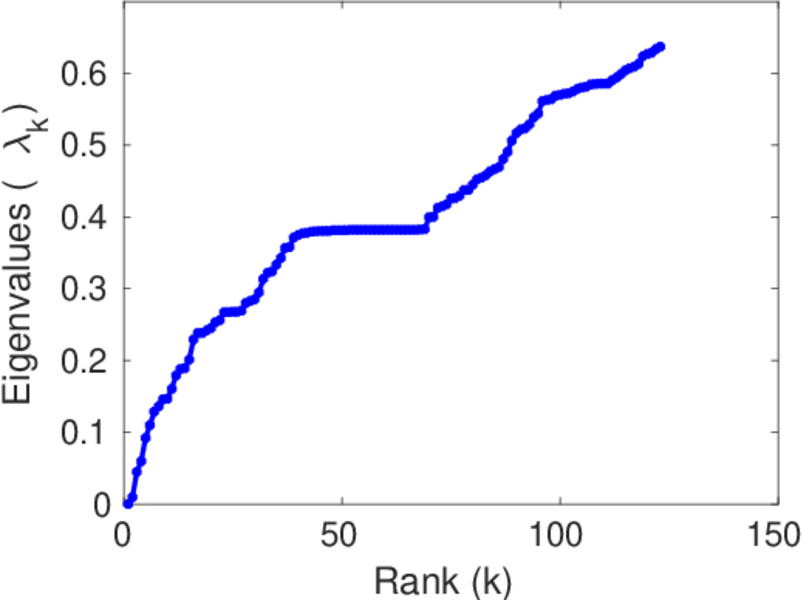
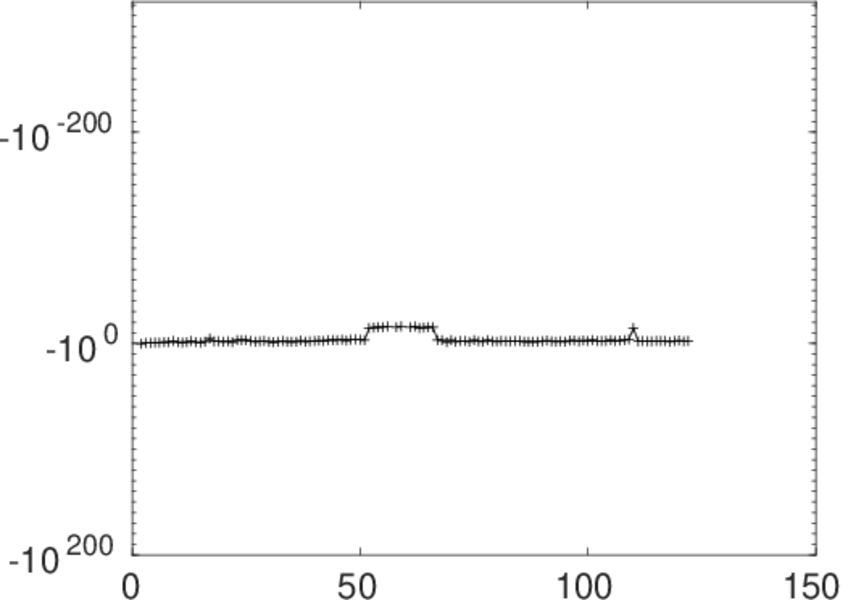
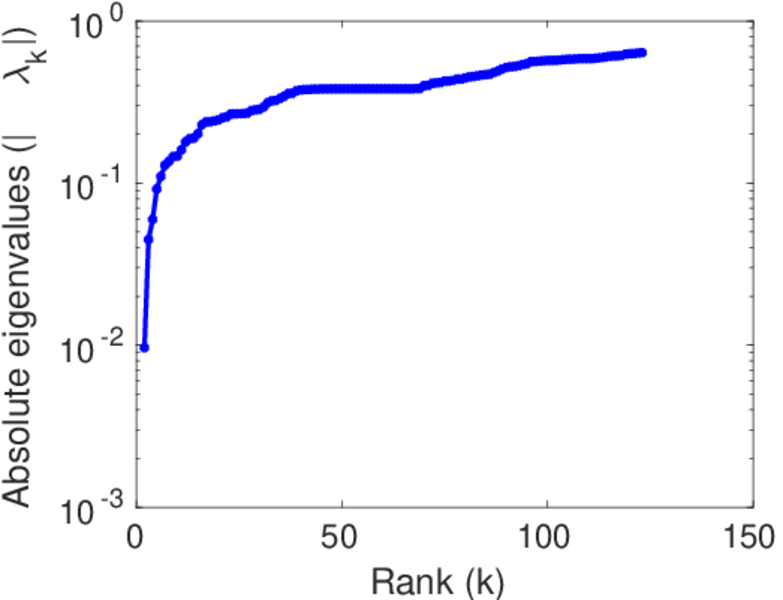
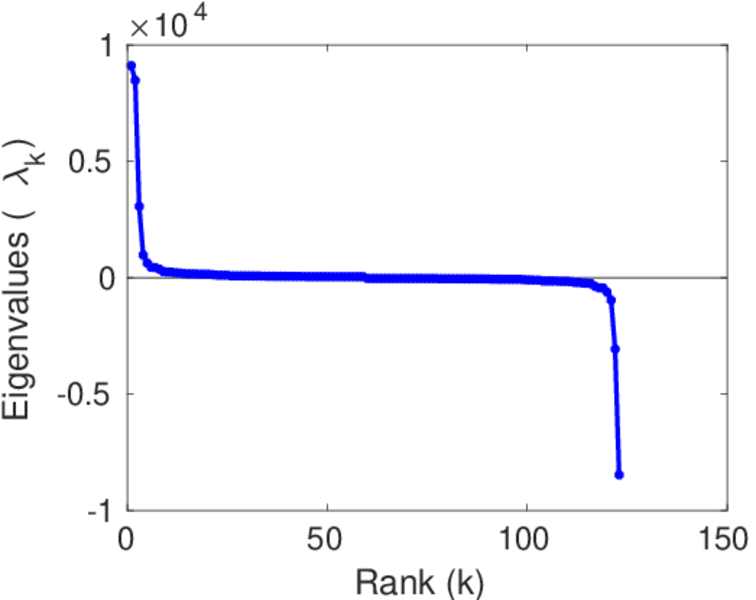
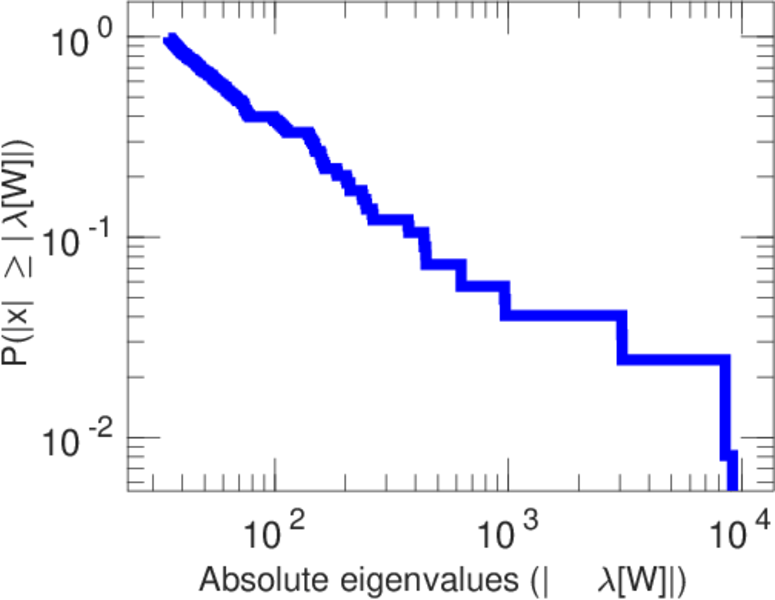
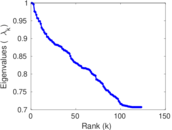
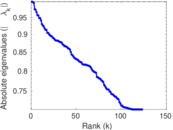
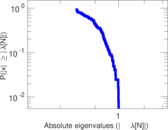
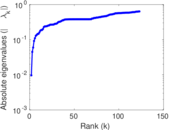
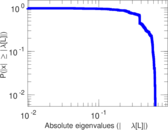
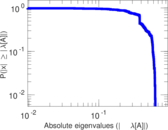
Matrix decompositions plots


Downloads
References
|
[1]
|
Jérôme Kunegis.
KONECT – The Koblenz Network Collection.
In Proc. Int. Conf. on World Wide Web Companion, pages
1343–1350, 2013.
[ http ]
|
|
[2]
|
Wikimedia Foundation.
Wikimedia downloads.
http://dumps.wikimedia.org/, January 2010.
|
 KONECT ‣ Networks ‣
Buy Me a Coffee
KONECT ‣ Networks ‣
Buy Me a Coffee