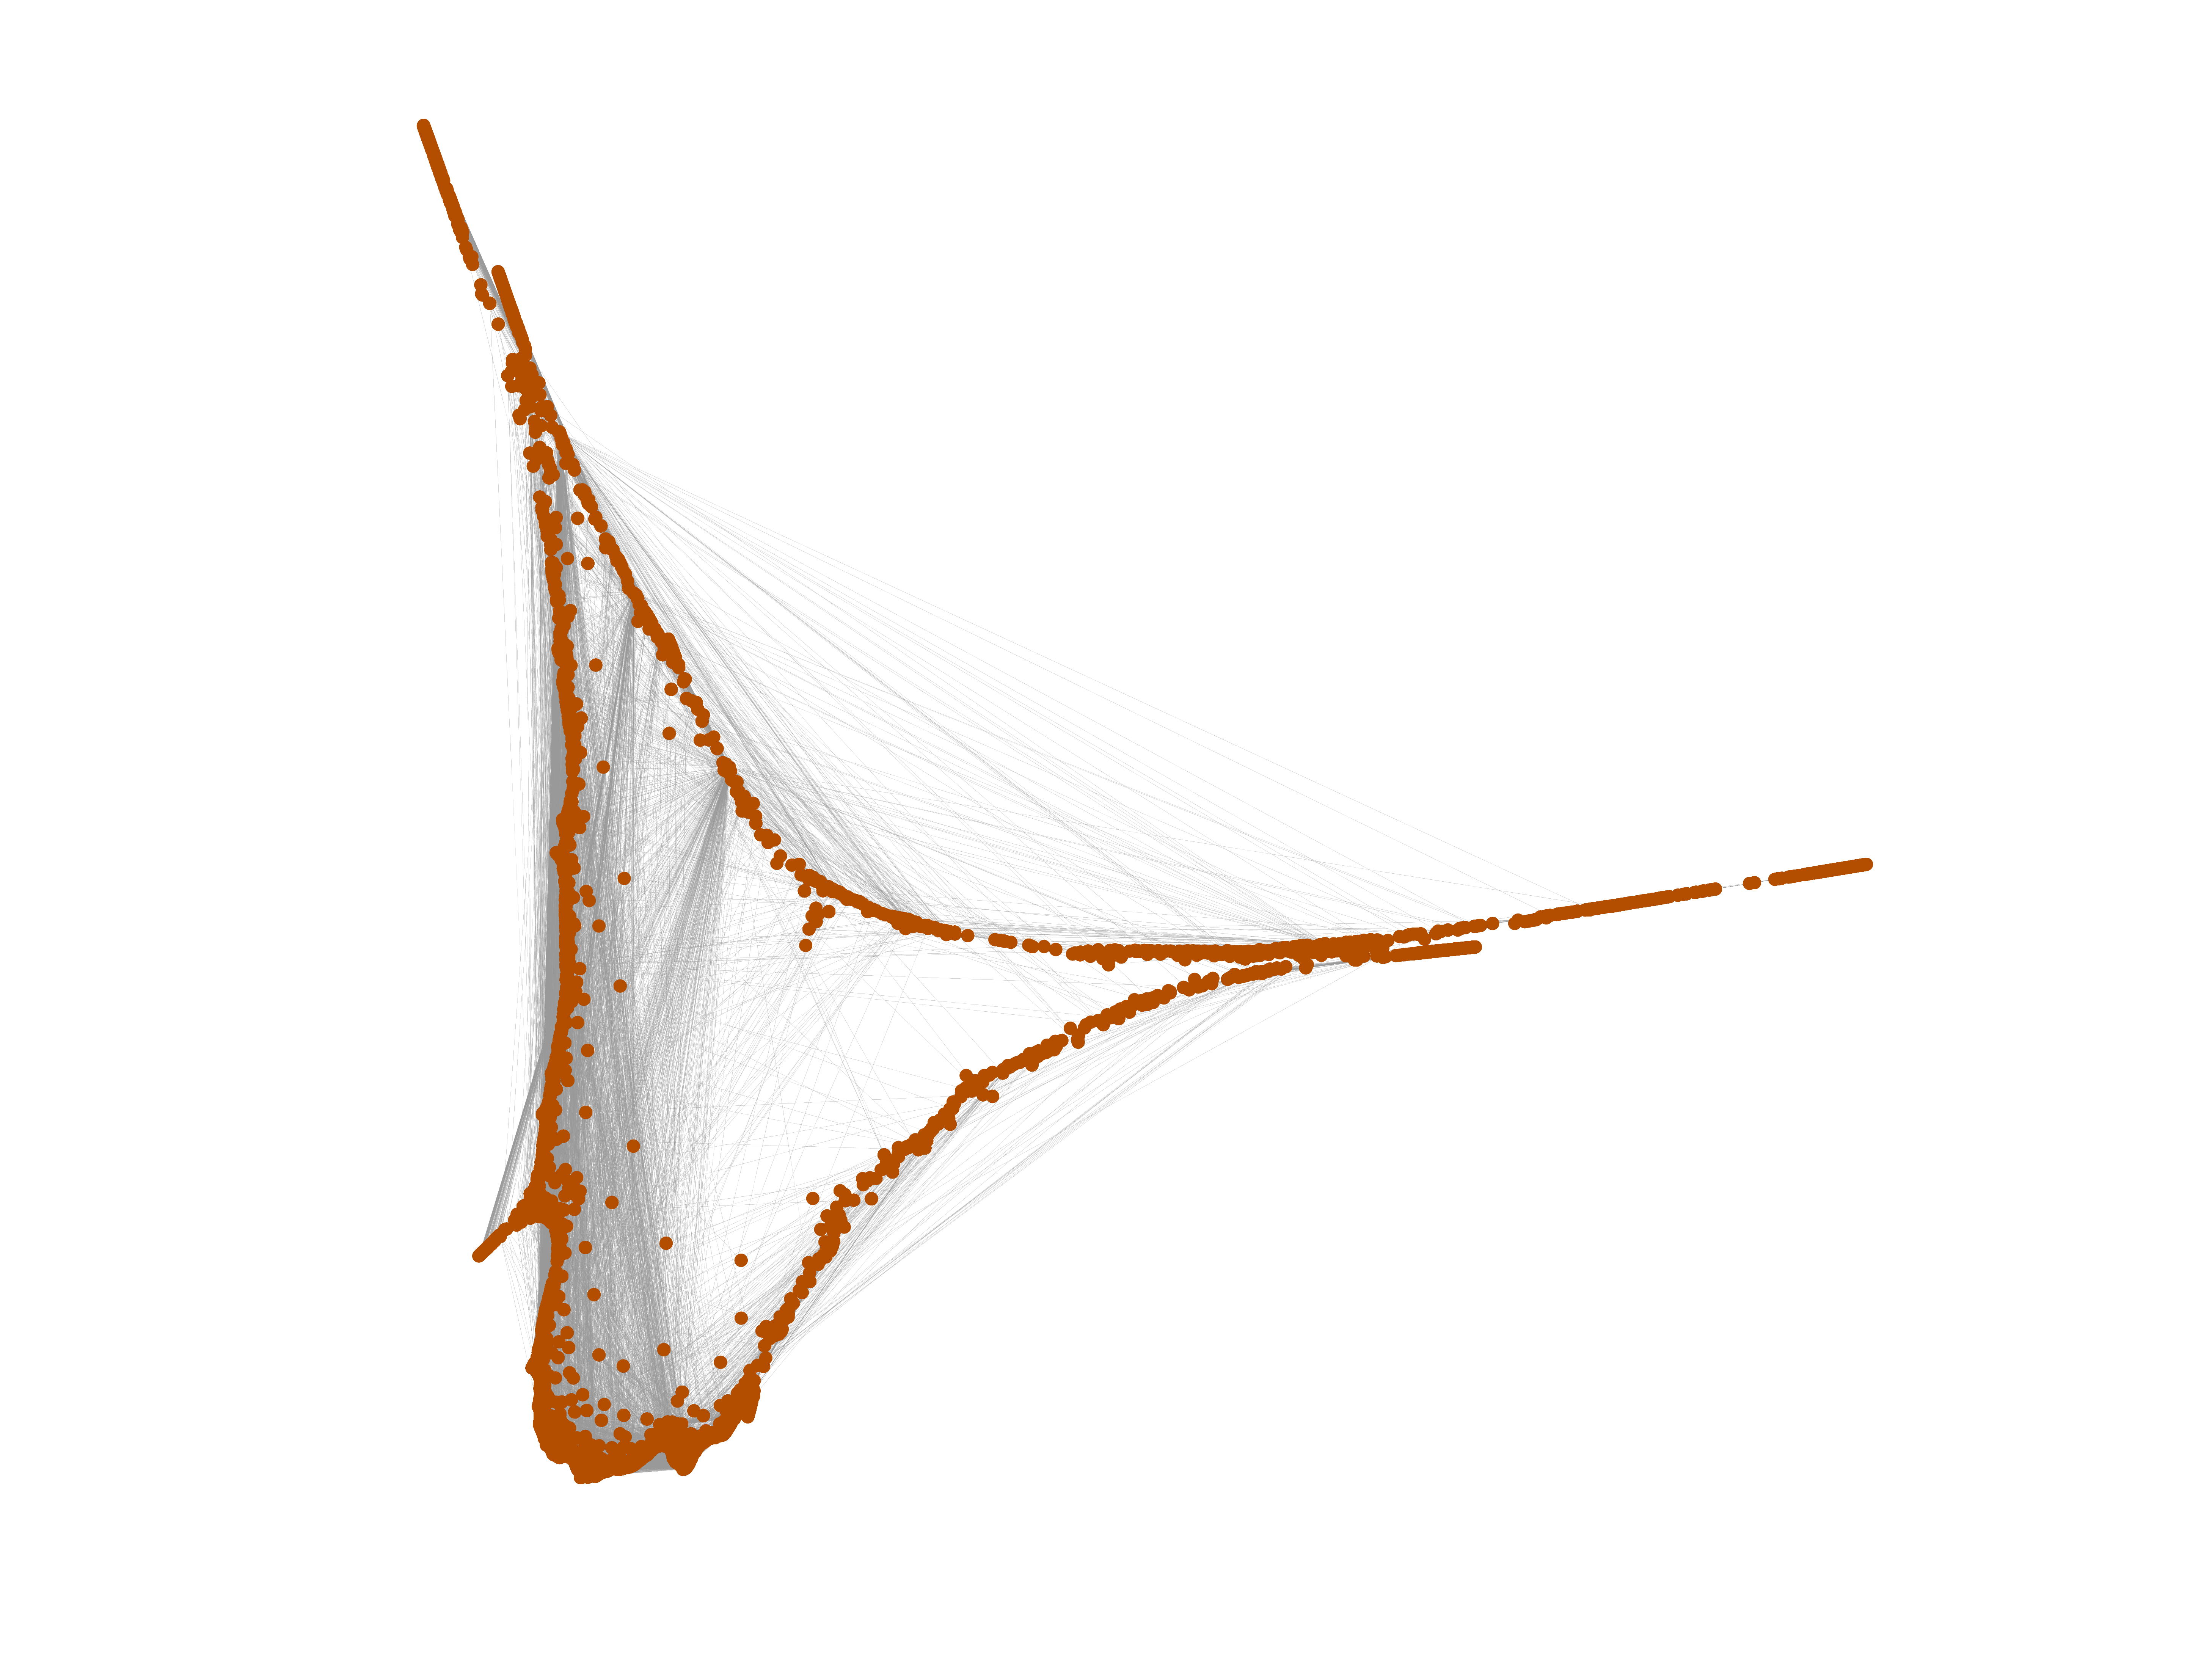
Wikiquote edits (sv)
This is the bipartite edit network of the Swedish Wikiquote. It contains users
and pages from the Swedish Wikiquote, connected by edit events. Each edge
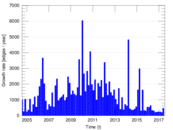
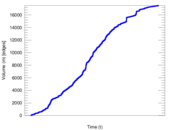
represents an edit. The dataset includes the timestamp of each edit.
Metadata
Statistics
| Size | n = | 4,205
|
| Left size | n1 = | 740
|
| Right size | n2 = | 3,465
|
| Volume | m = | 17,517
|
| Unique edge count | m̿ = | 10,116
|
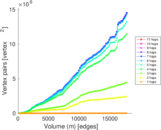
| Wedge count | s = | 1,617,629
|
| Claw count | z = | 358,421,201
|
| Cross count | x = | 79,572,410,115
|
| Square count | q = | 652,640
|
| 4-Tour count | T4 = | 11,716,176
|
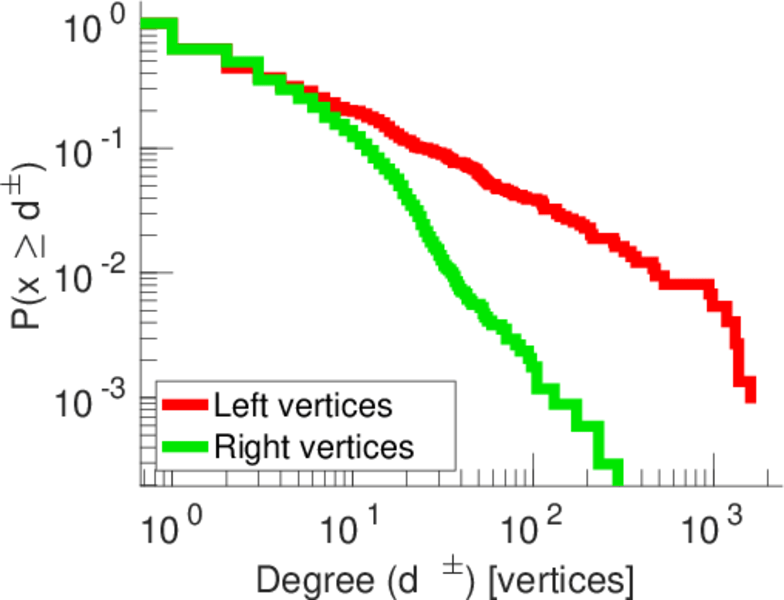
| Maximum degree | dmax = | 1,608
|
| Maximum left degree | d1max = | 1,608
|
| Maximum right degree | d2max = | 296
|
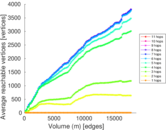
| Average degree | d = | 8.331 51
|
| Average left degree | d1 = | 23.671 6
|
| Average right degree | d2 = | 5.055 41
|
| Fill | p = | 0.003 945 24
|
| Average edge multiplicity | m̃ = | 1.731 61
|
| Size of LCC | N = | 3,812
|
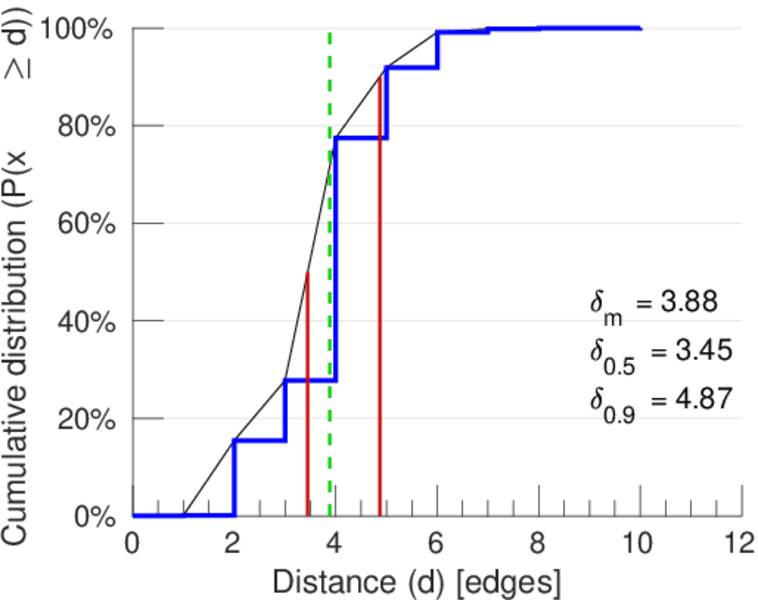
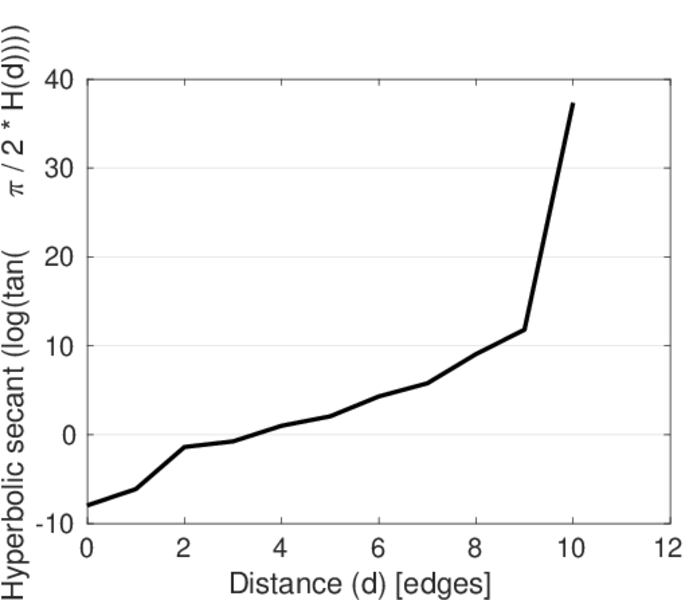
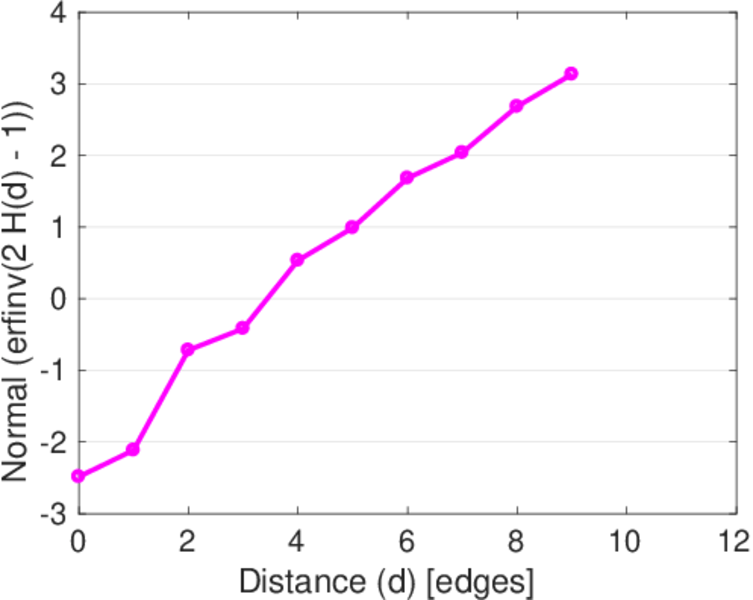
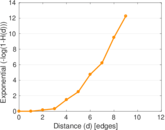
| Diameter | δ = | 11
|
| 50-Percentile effective diameter | δ0.5 = | 3.447 38
|
| 90-Percentile effective diameter | δ0.9 = | 4.867 67
|
| Median distance | δM = | 4
|
| Mean distance | δm = | 3.882 98
|
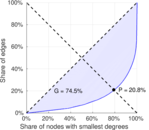
| Gini coefficient | G = | 0.759 626
|
| Balanced inequality ratio | P = | 0.198 835
|
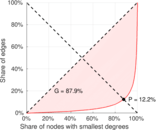
| Left balanced inequality ratio | P1 = | 0.121 596
|
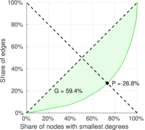
| Right balanced inequality ratio | P2 = | 0.268 197
|
| Relative edge distribution entropy | Her = | 0.814 245
|
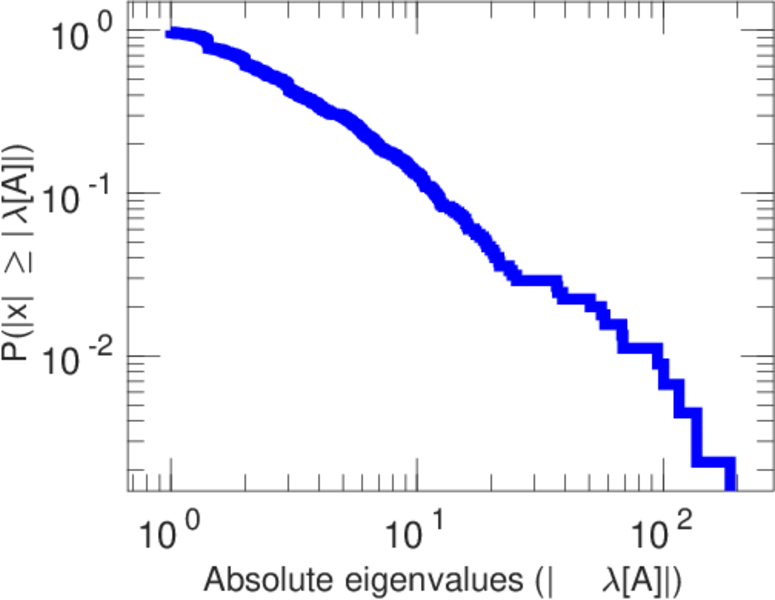
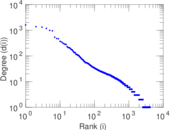
| Power law exponent | γ = | 2.339 34
|
| Tail power law exponent | γt = | 2.051 00
|
| Tail power law exponent with p | γ3 = | 2.051 00
|
| p-value | p = | 0.000 00
|
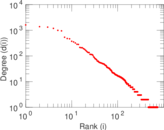
| Left tail power law exponent with p | γ3,1 = | 1.721 00
|
| Left p-value | p1 = | 0.277 000
|
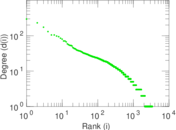
| Right tail power law exponent with p | γ3,2 = | 4.901 00
|
| Right p-value | p2 = | 0.892 000
|
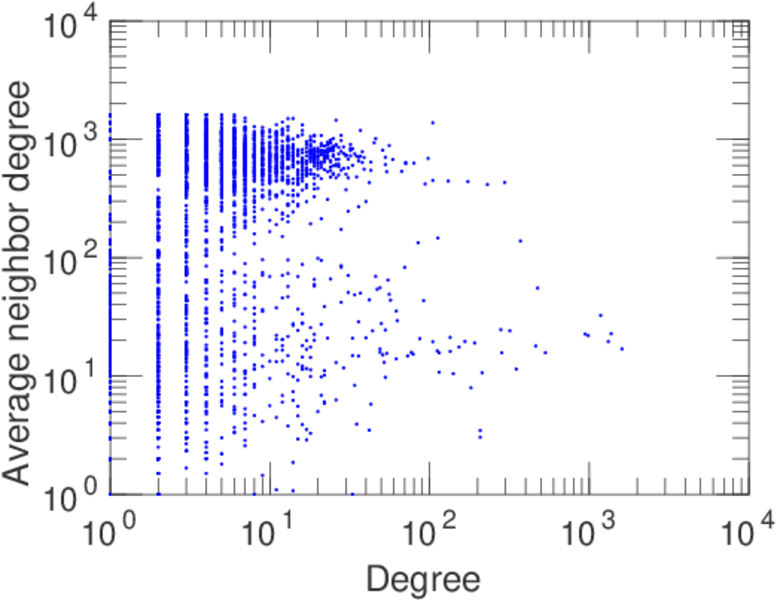
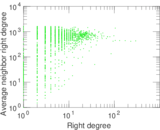
| Degree assortativity | ρ = | −0.154 351
|
| Degree assortativity p-value | pρ = | 5.651 84 × 10−55
|
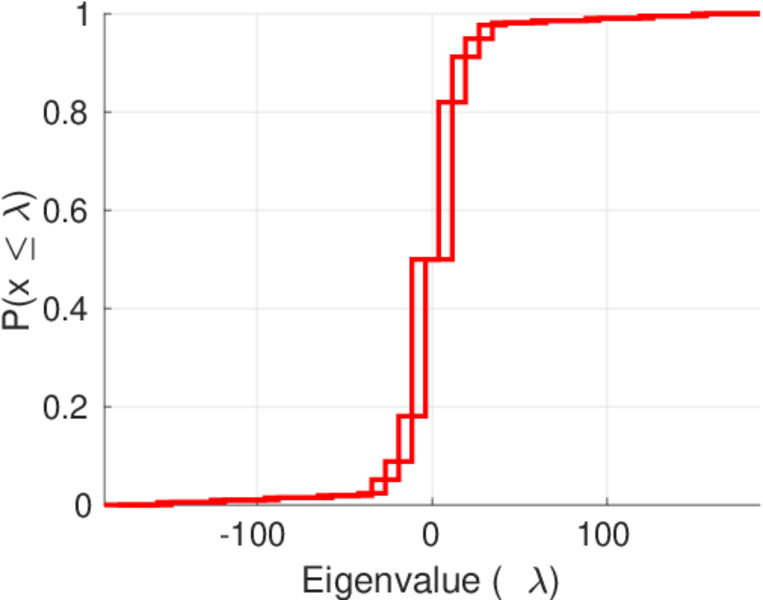
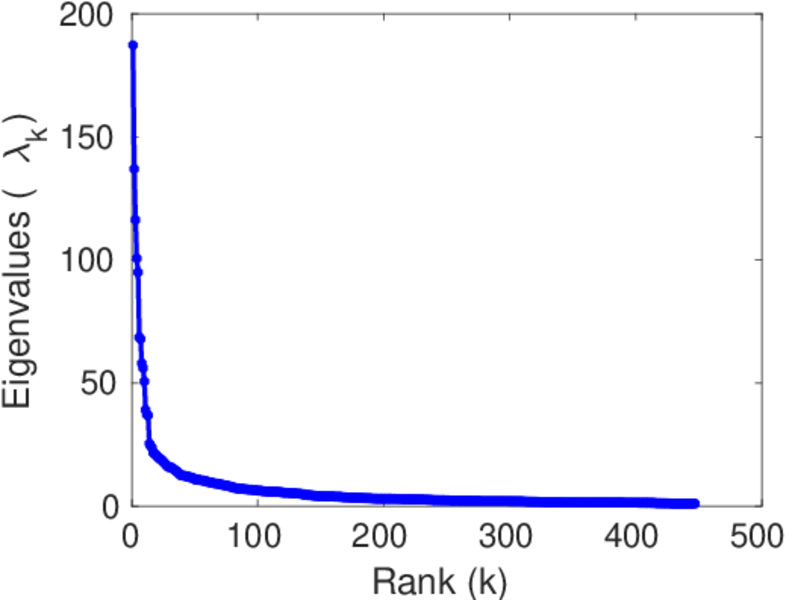
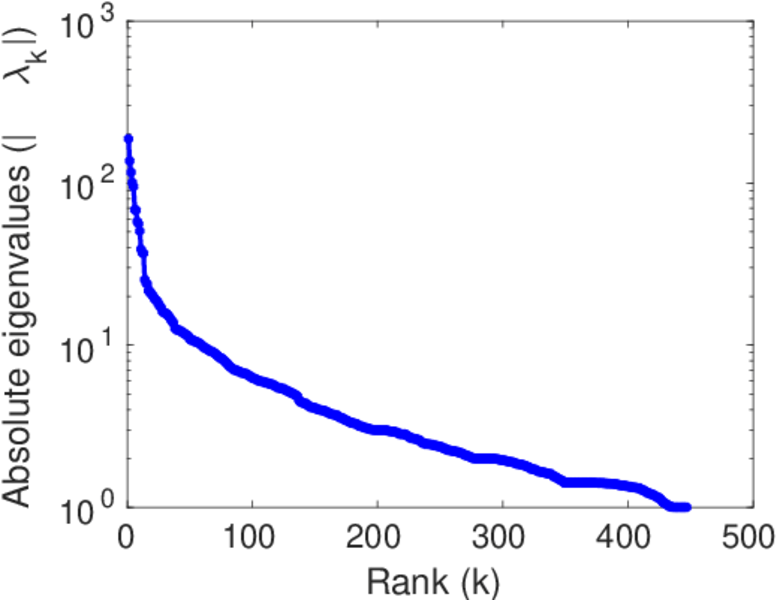
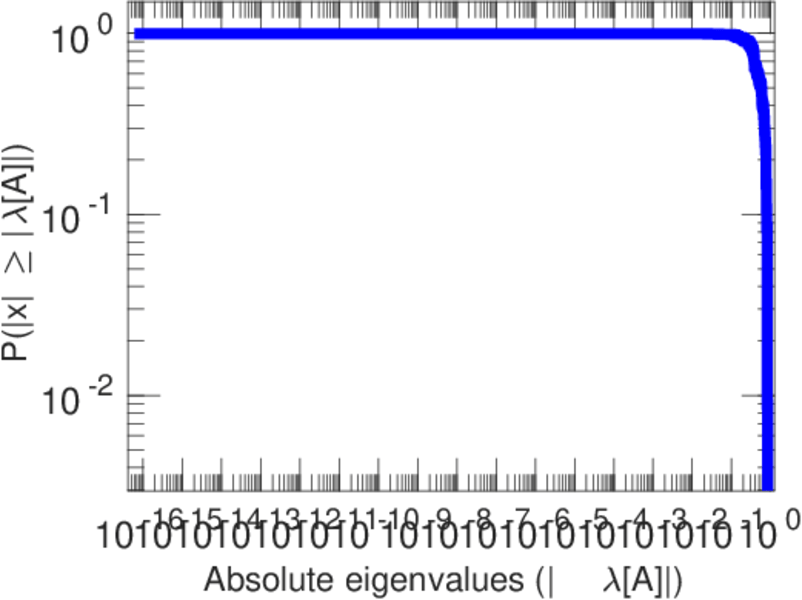
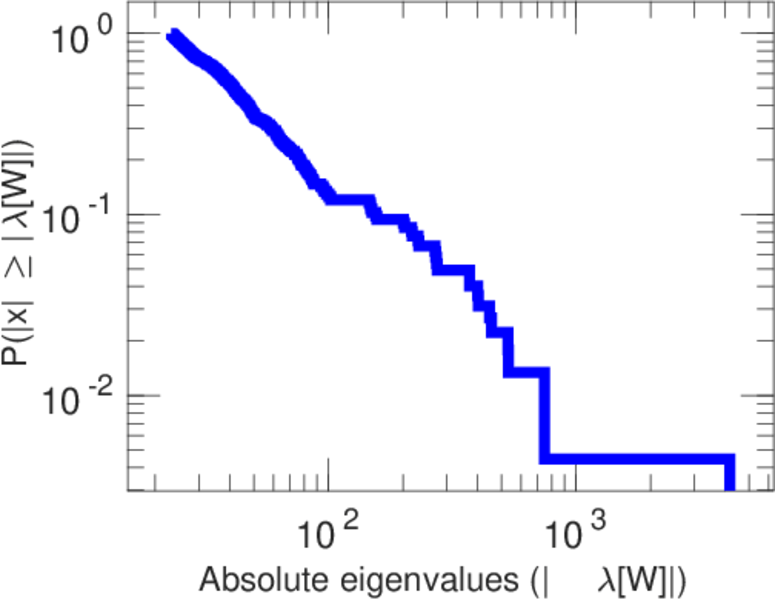
| Spectral norm | α = | 187.180
|
| Algebraic connectivity | a = | 0.025 050 8
|
| Spectral separation | |λ1[A] / λ2[A]| = | 1.367 51
|
| Controllability | C = | 2,799
|
| Relative controllability | Cr = | 0.676 904
|
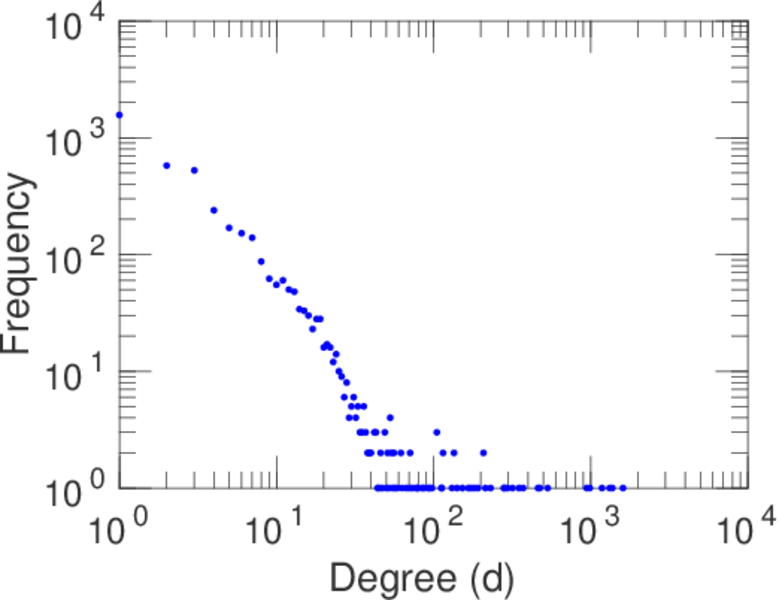
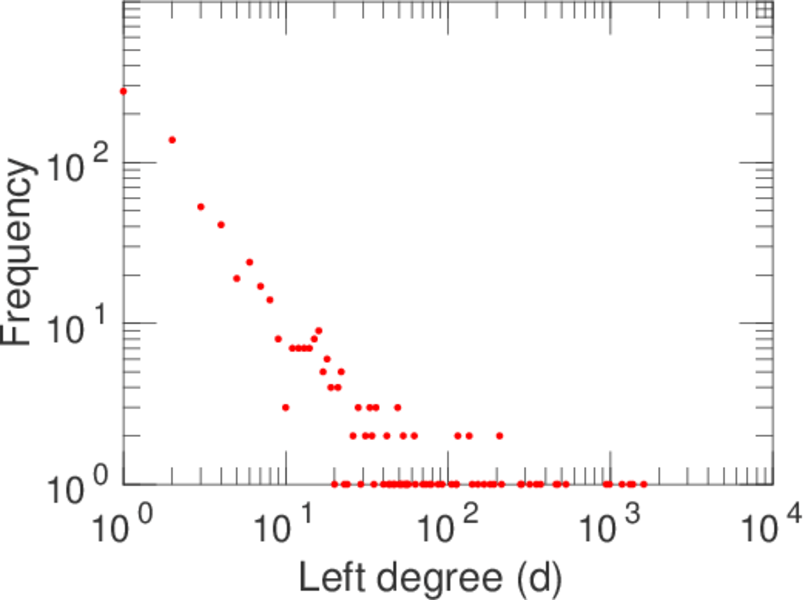
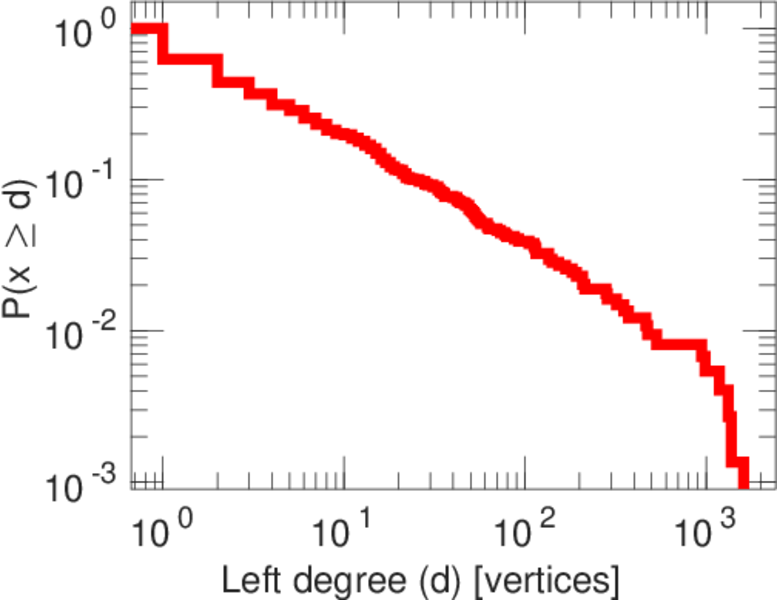
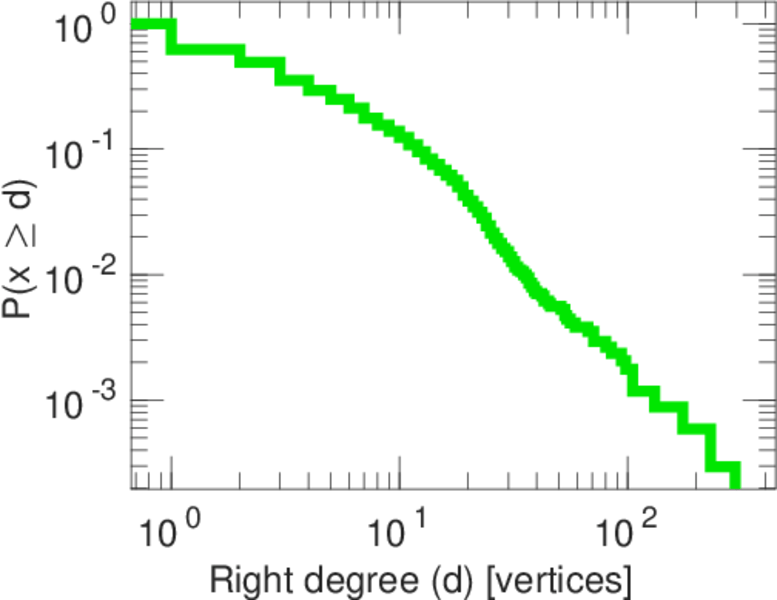
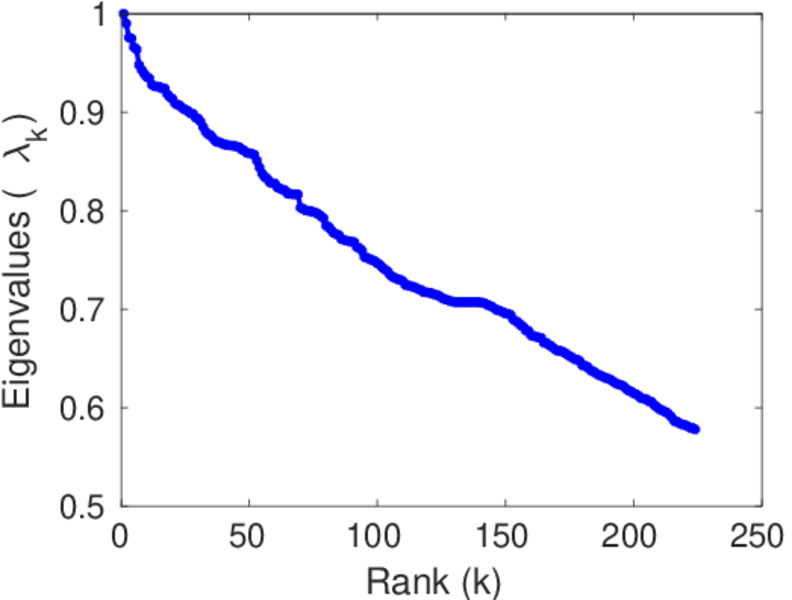
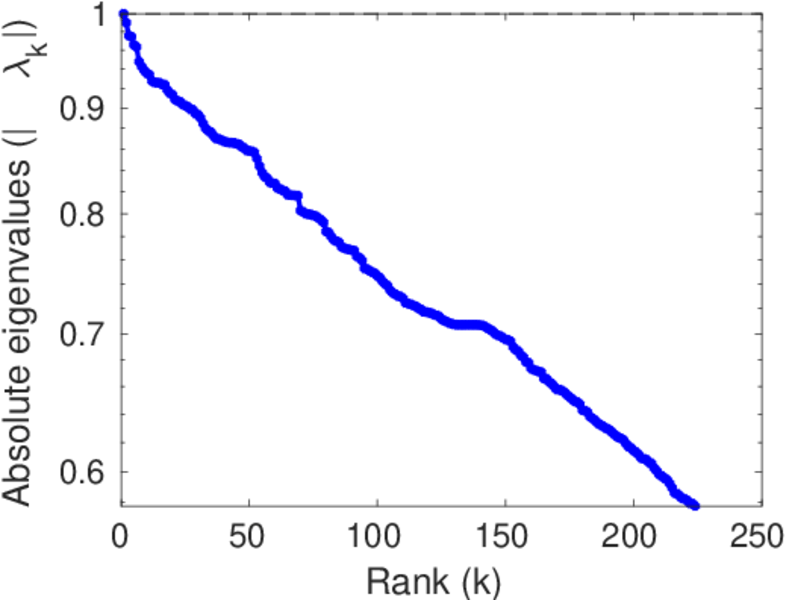
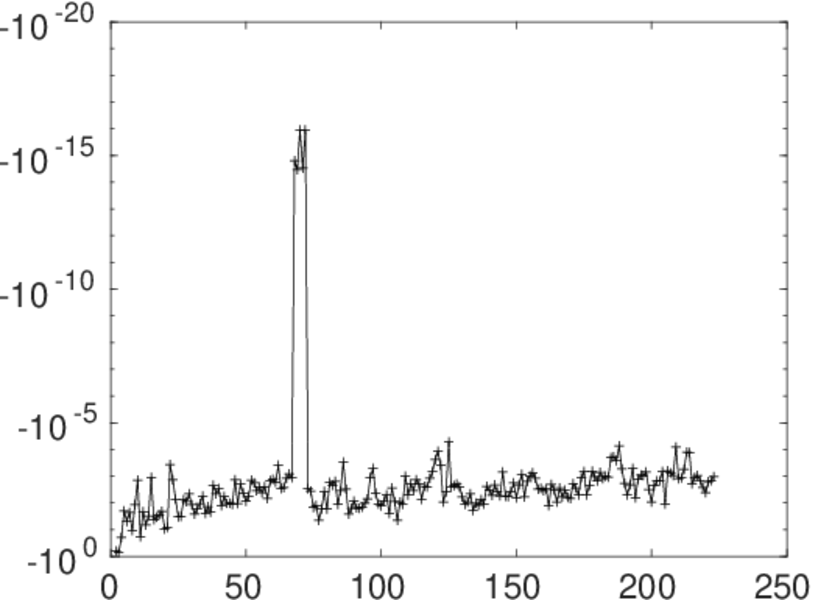
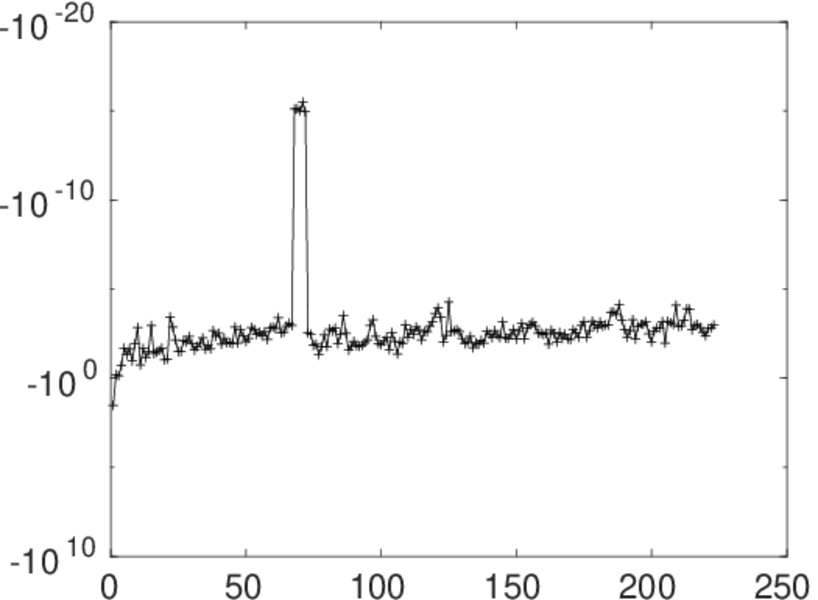
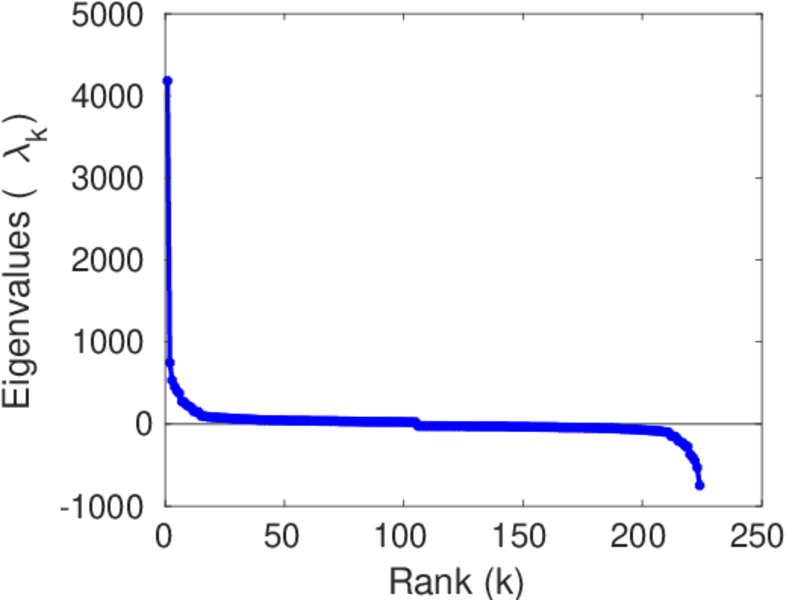
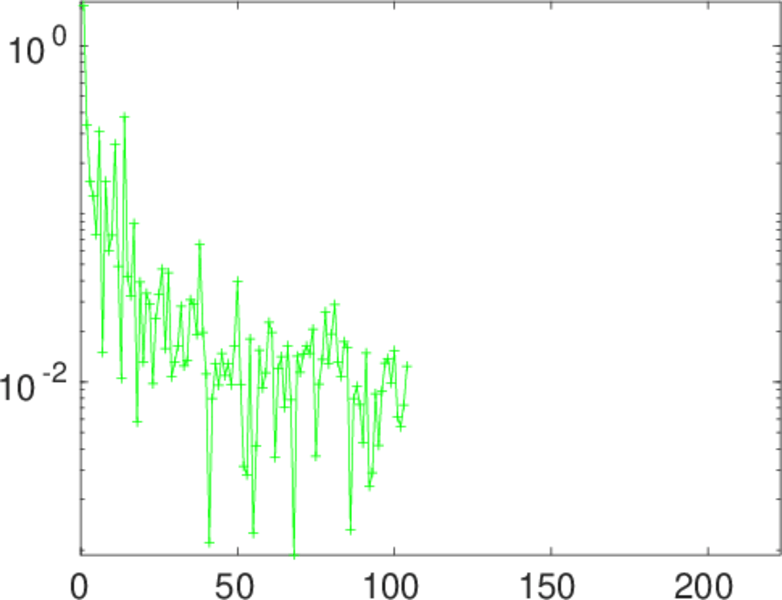
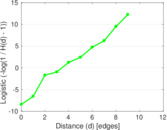
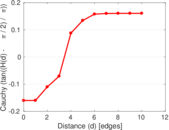
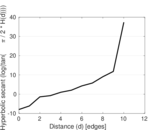
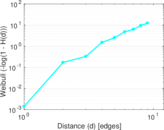
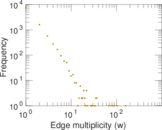
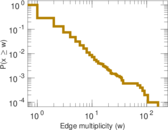
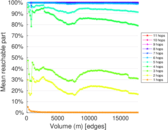
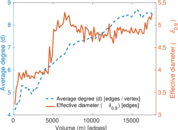
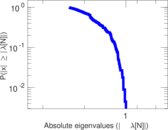
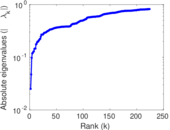
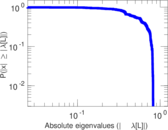
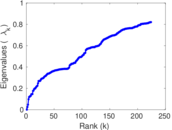
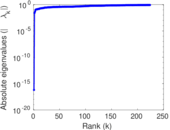
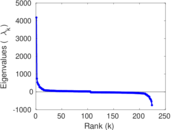
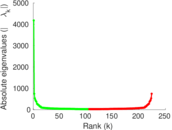
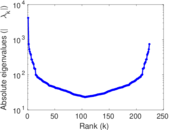
Plots


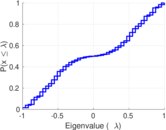
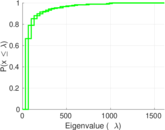
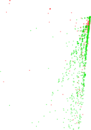
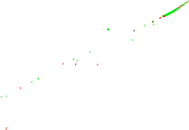
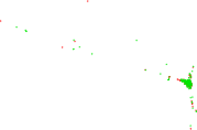


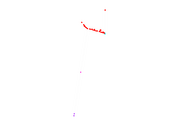
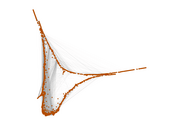
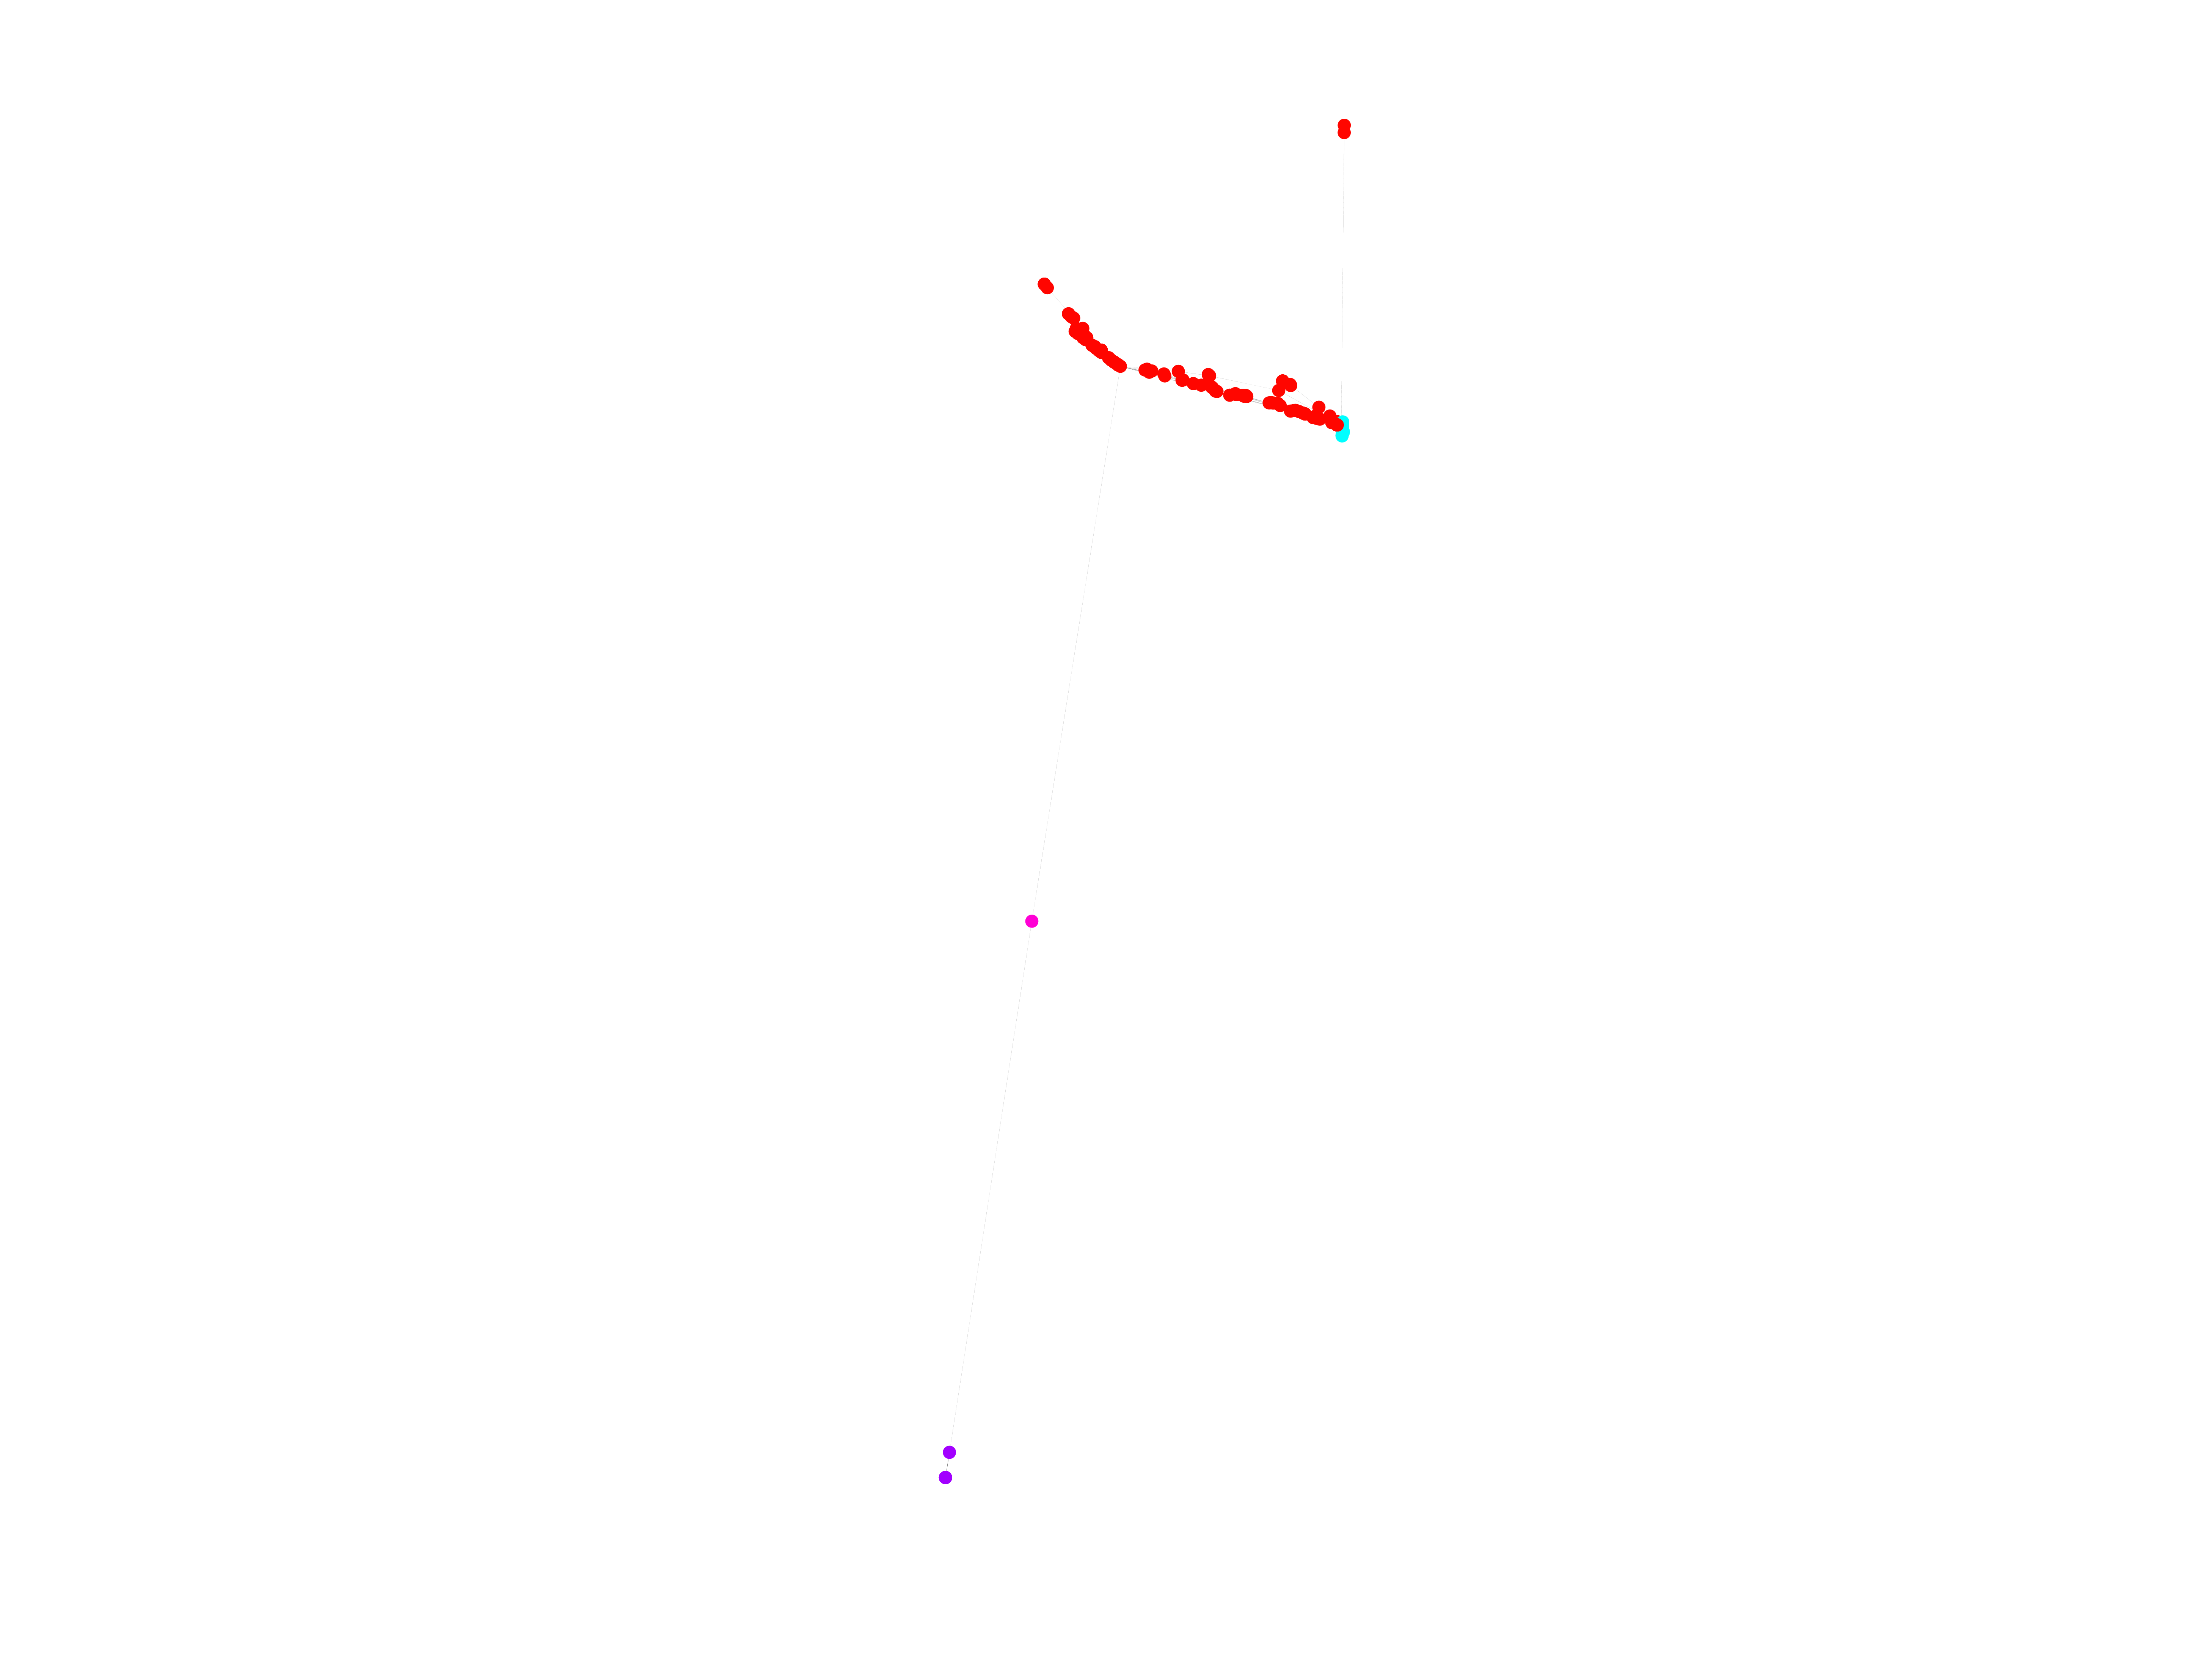
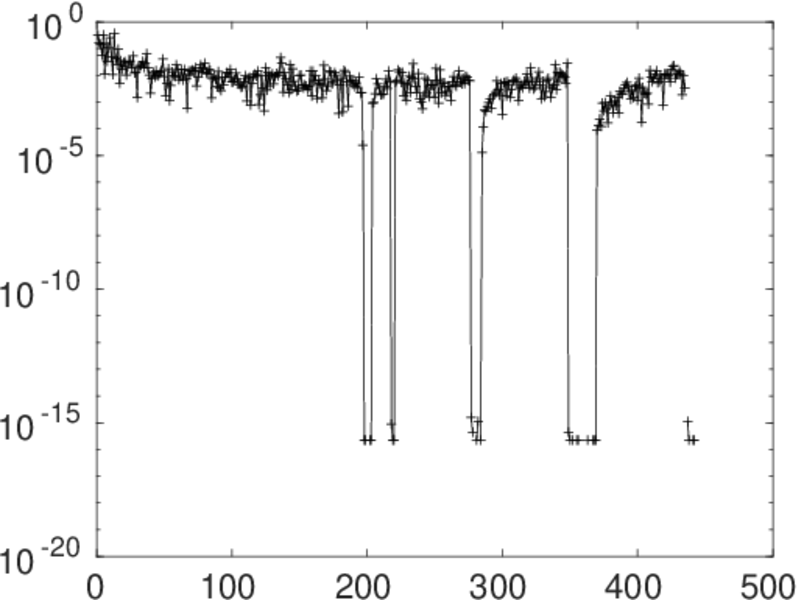
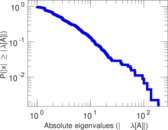
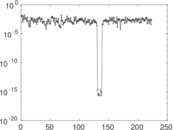
Matrix decompositions plots


Downloads
References
|
[1]
|
Jérôme Kunegis.
KONECT – The Koblenz Network Collection.
In Proc. Int. Conf. on World Wide Web Companion, pages
1343–1350, 2013.
[ http ]
|
|
[2]
|
Wikimedia Foundation.
Wikimedia downloads.
http://dumps.wikimedia.org/, January 2010.
|
 KONECT ‣ Networks ‣
Buy Me a Coffee
KONECT ‣ Networks ‣
Buy Me a Coffee