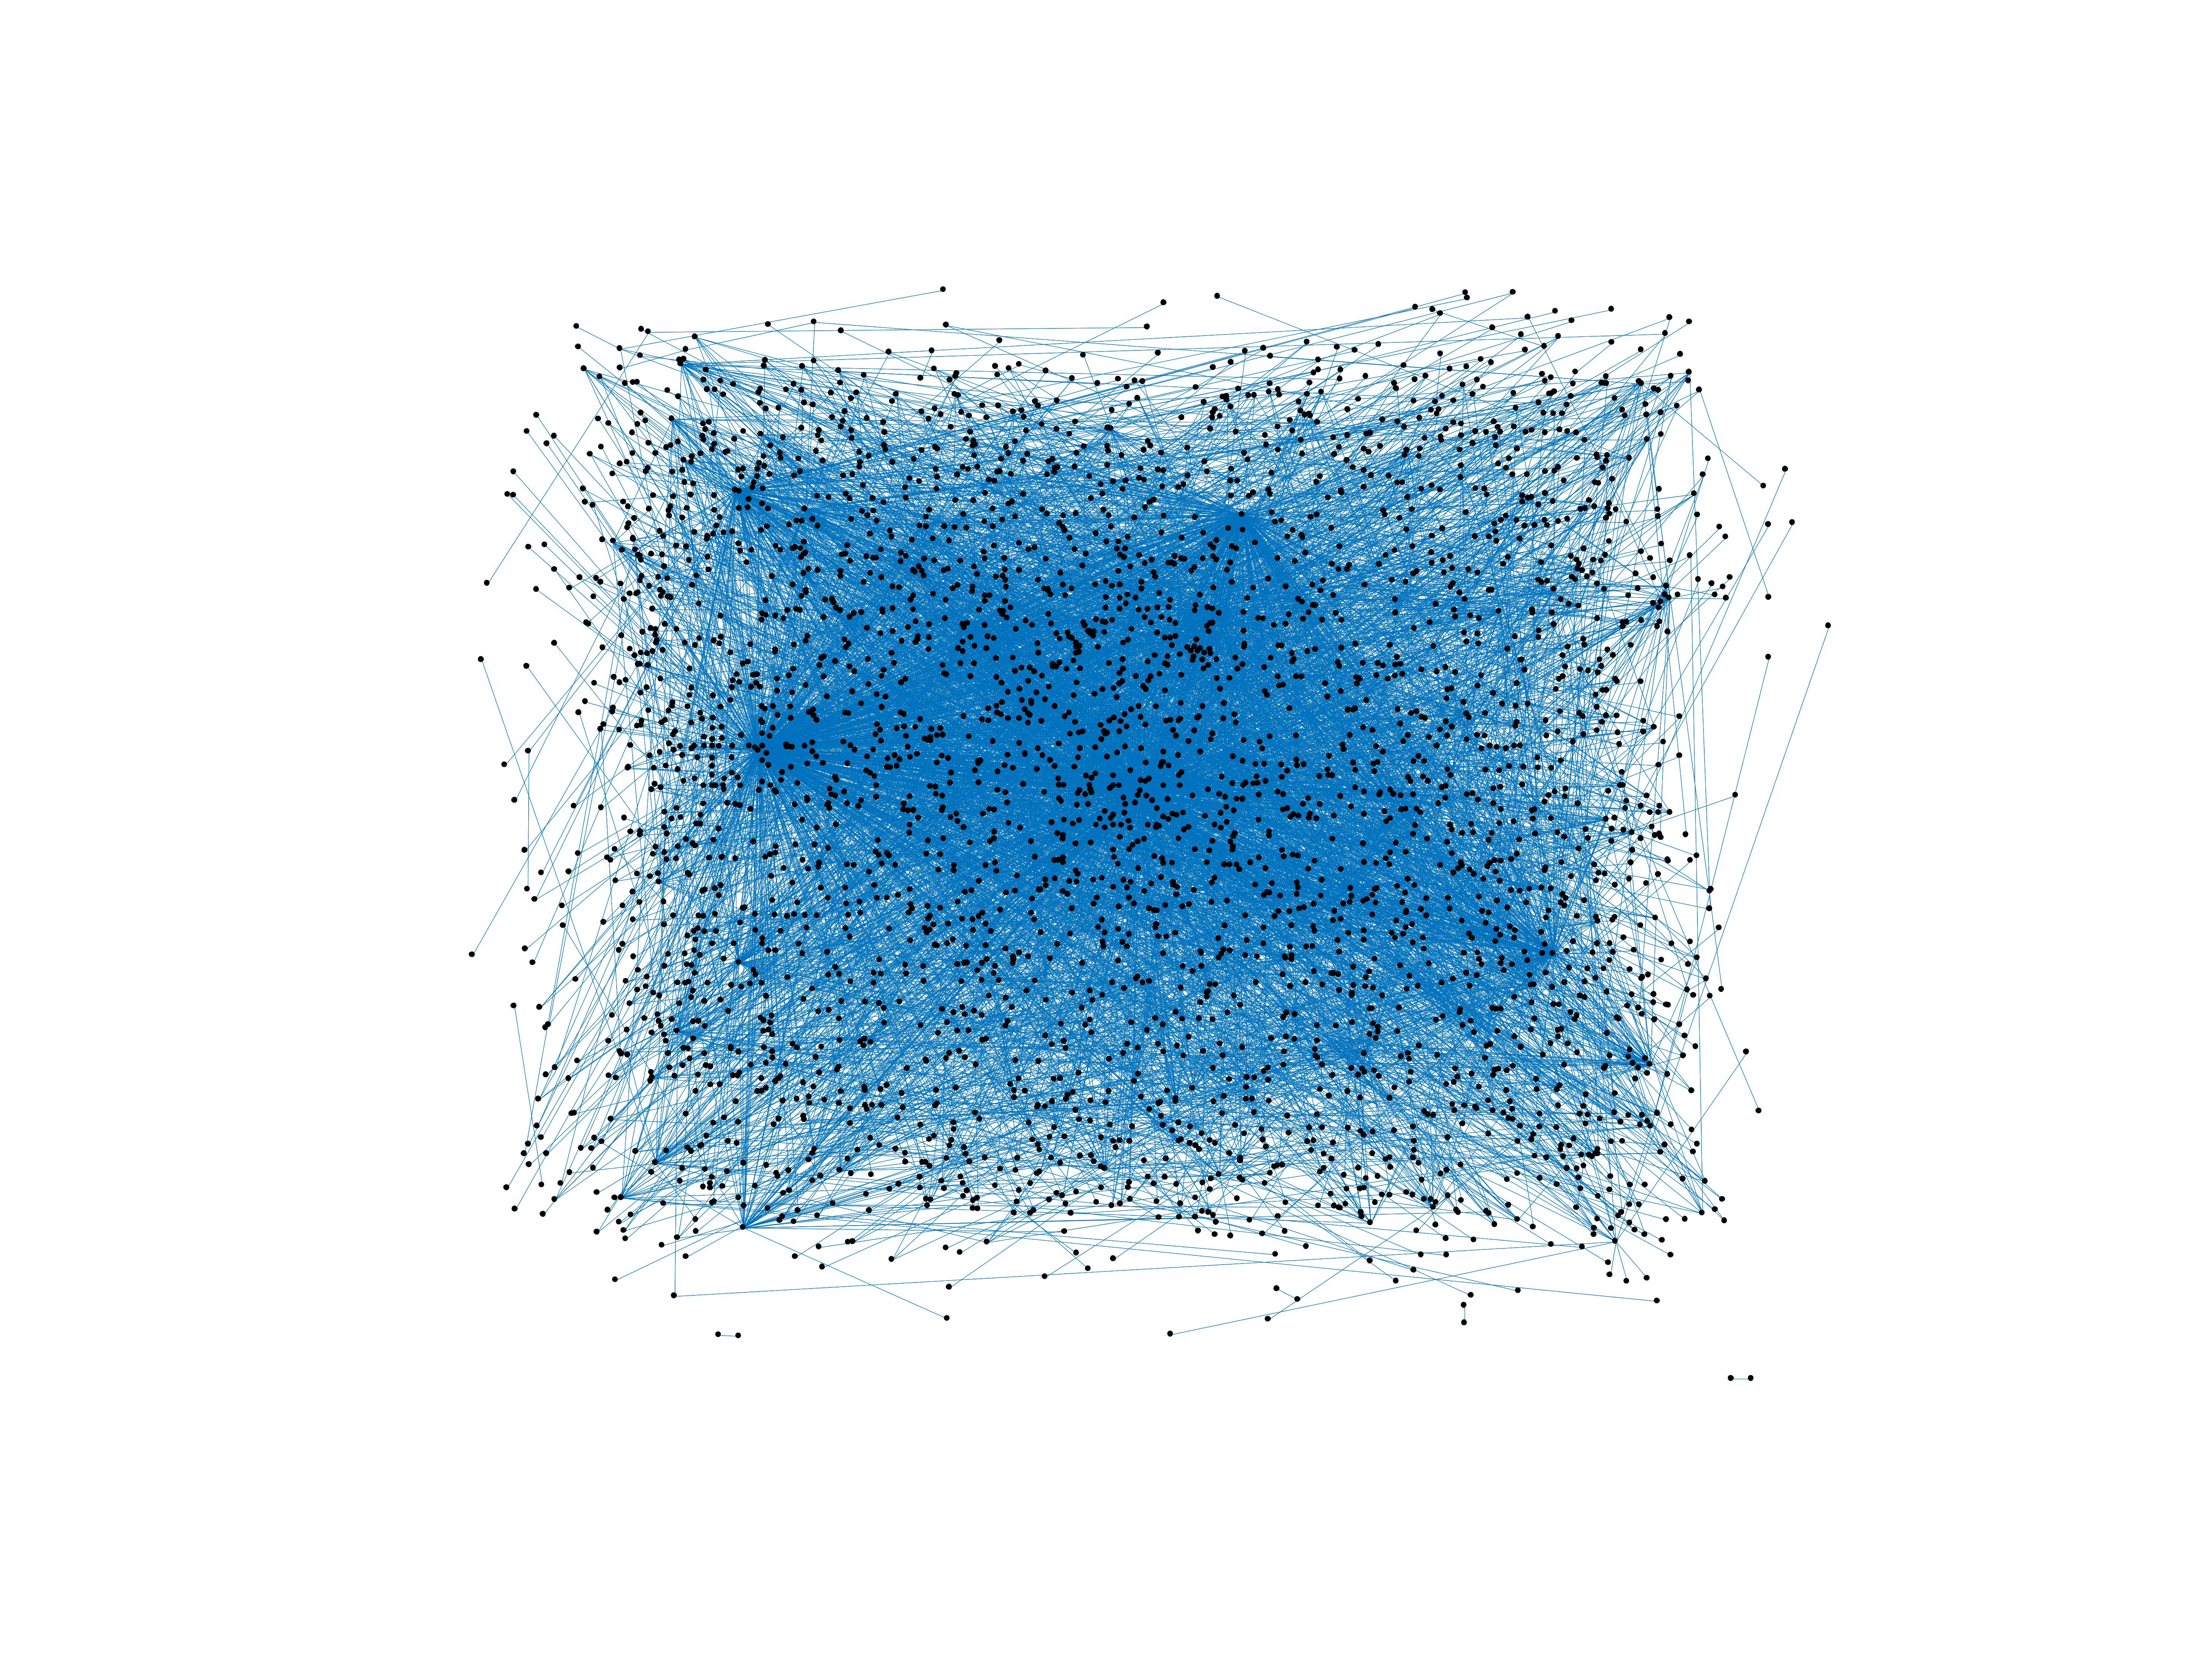
Wikiversity edits (sv)
This is the bipartite edit network of the Swedish Wikiversity. It contains
users and pages from the Swedish Wikiversity, connected by edit events. Each
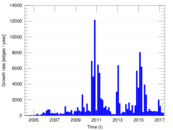
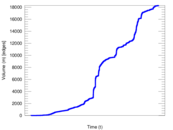
edge represents an edit. The dataset includes the timestamp of each edit.
Metadata
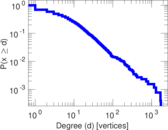
Statistics
| Size | n = | 3,417
|
| Left size | n1 = | 806
|
| Right size | n2 = | 2,611
|
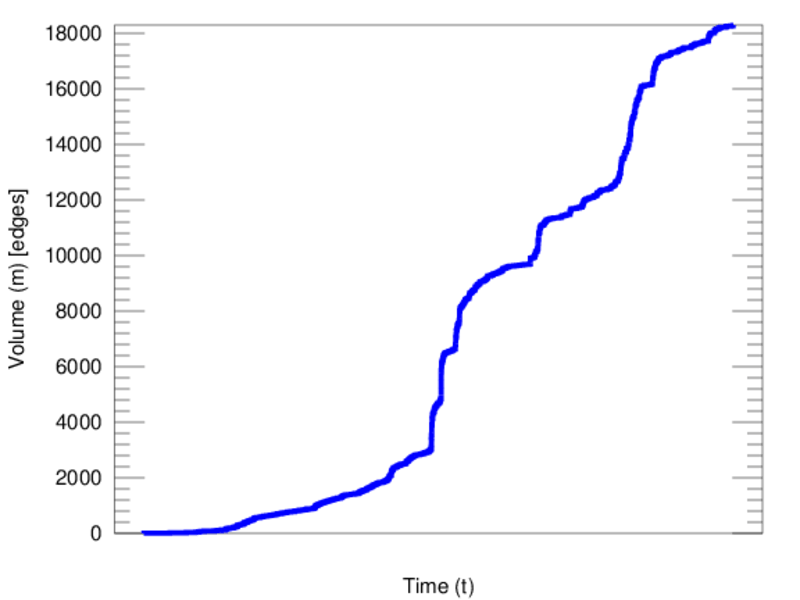
| Volume | m = | 18,300
|
| Unique edge count | m̿ = | 5,761
|
| Wedge count | s = | 656,692
|
| Claw count | z = | 123,074,822
|
| Cross count | x = | 20,337,674,407
|
| Square count | q = | 127,030
|
| 4-Tour count | T4 = | 3,654,758
|
| Maximum degree | dmax = | 1,730
|
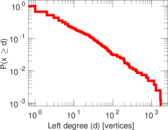
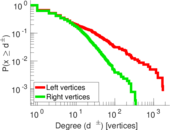
| Maximum left degree | d1max = | 1,730
|
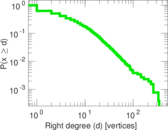
| Maximum right degree | d2max = | 345
|
| Average degree | d = | 10.711 2
|
| Average left degree | d1 = | 22.704 7
|
| Average right degree | d2 = | 7.008 81
|
| Fill | p = | 0.002 737 51
|
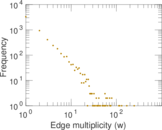
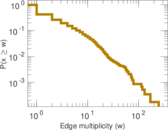
| Average edge multiplicity | m̃ = | 3.176 53
|
| Size of LCC | N = | 3,184
|
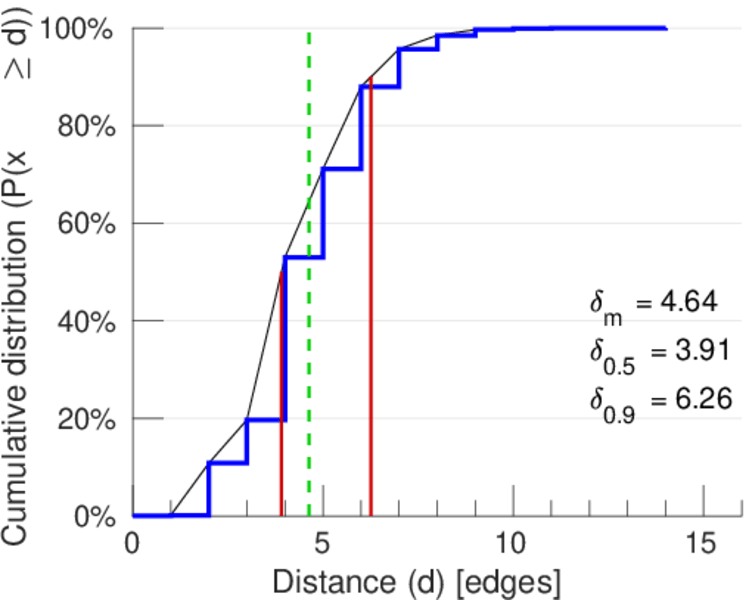
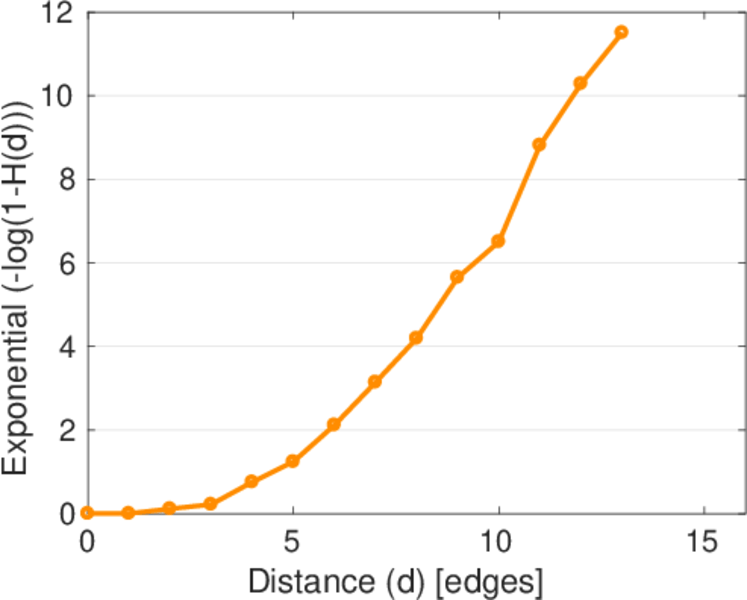
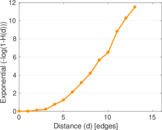
| Diameter | δ = | 15
|
| 50-Percentile effective diameter | δ0.5 = | 3.910 13
|
| 90-Percentile effective diameter | δ0.9 = | 6.263 20
|
| Median distance | δM = | 4
|
| Mean distance | δm = | 4.636 42
|
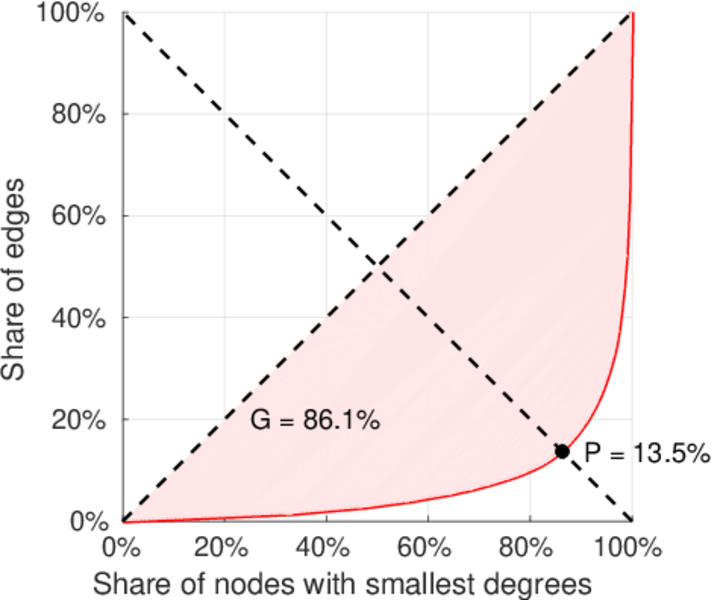
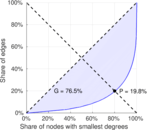
| Gini coefficient | G = | 0.761 704
|
| Balanced inequality ratio | P = | 0.203 934
|
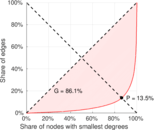
| Left balanced inequality ratio | P1 = | 0.135 355
|
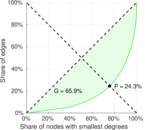
| Right balanced inequality ratio | P2 = | 0.242 514
|
| Relative edge distribution entropy | Her = | 0.830 588
|
| Power law exponent | γ = | 2.905 47
|
| Tail power law exponent | γt = | 2.181 00
|
| Tail power law exponent with p | γ3 = | 2.181 00
|
| p-value | p = | 0.400 000
|
| Left tail power law exponent with p | γ3,1 = | 1.841 00
|
| Left p-value | p1 = | 0.067 000 0
|
| Right tail power law exponent with p | γ3,2 = | 2.561 00
|
| Right p-value | p2 = | 0.287 000
|
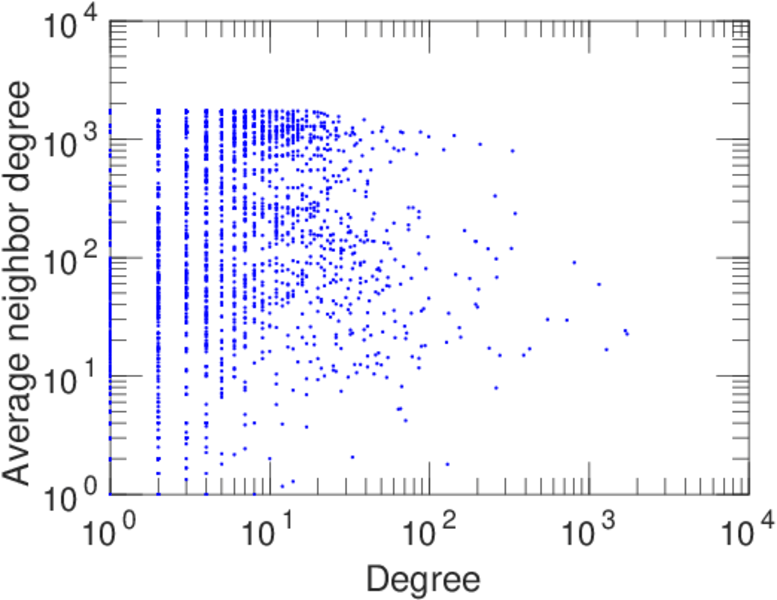
| Degree assortativity | ρ = | −0.277 999
|
| Degree assortativity p-value | pρ = | 9.794 31 × 10−103
|
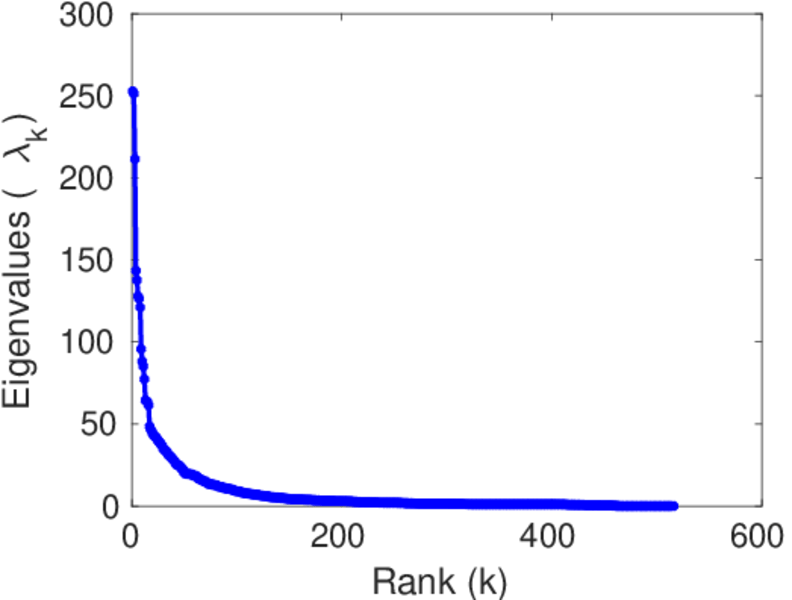
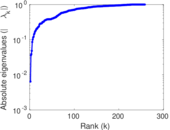
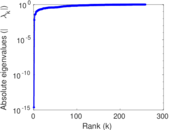
| Spectral norm | α = | 252.726
|
| Algebraic connectivity | a = | 0.006 421 33
|
| Spectral separation | |λ1[A] / λ2[A]| = | 1.005 81
|
| Controllability | C = | 2,474
|
| Relative controllability | Cr = | 0.728 075
|
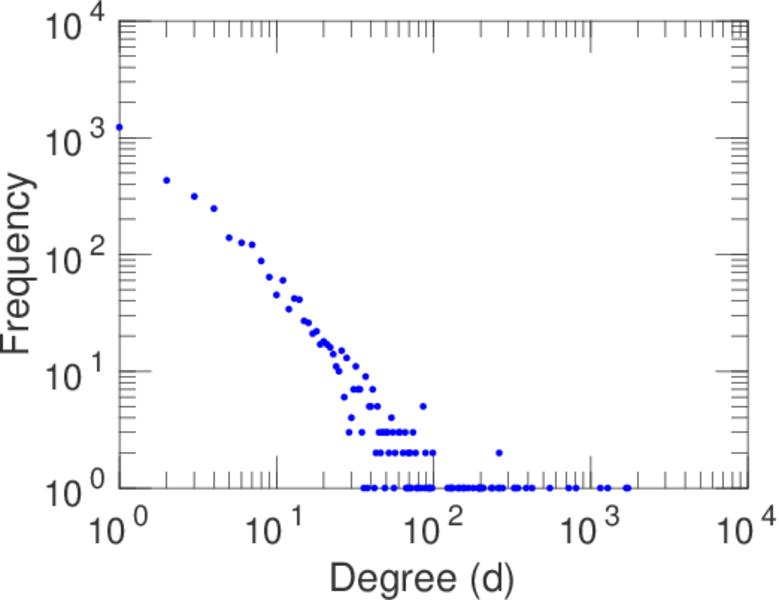
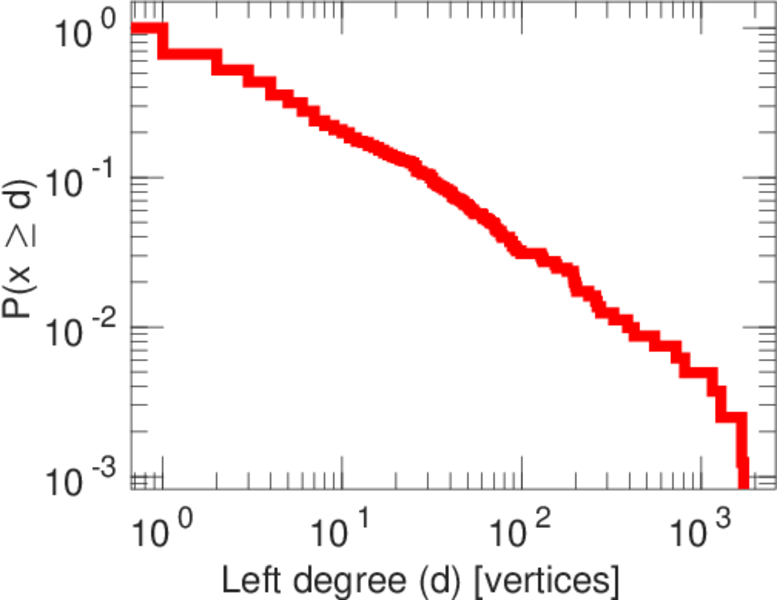
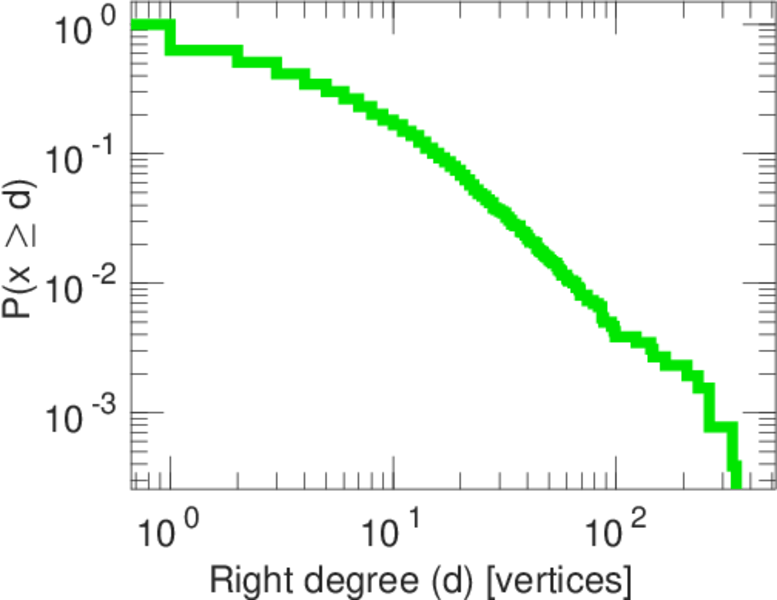
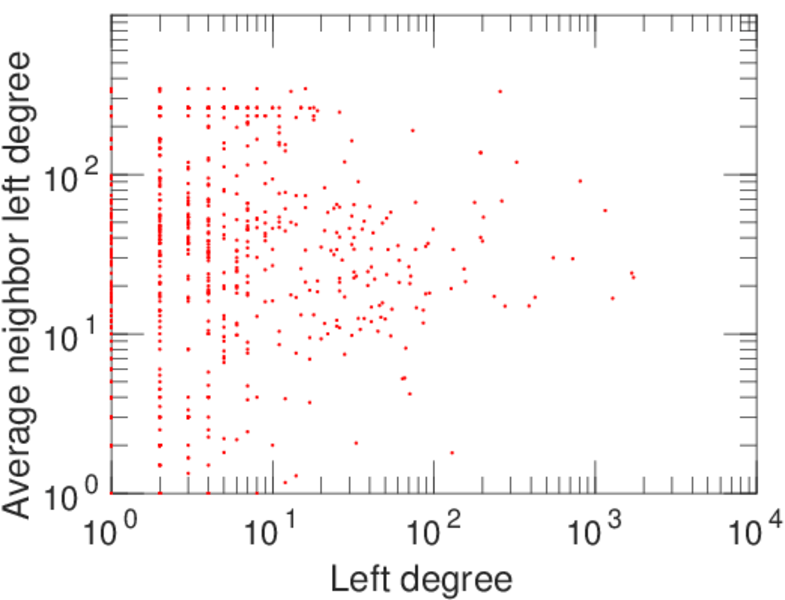
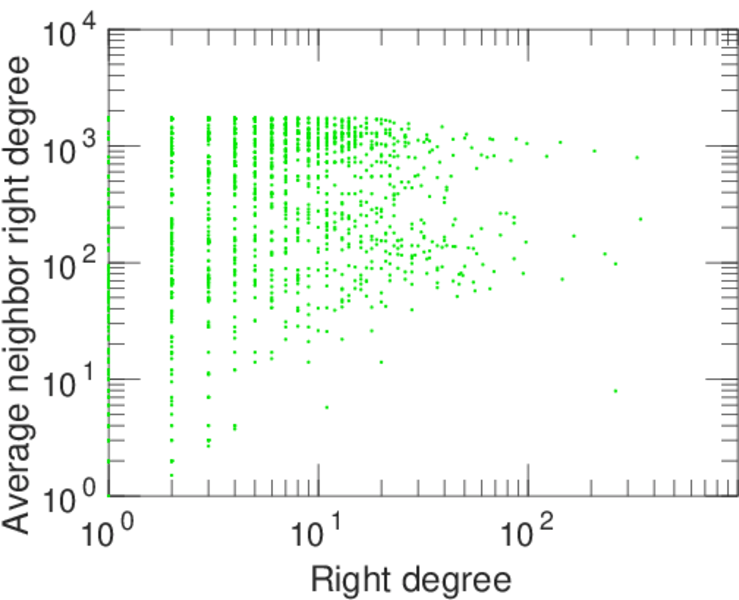
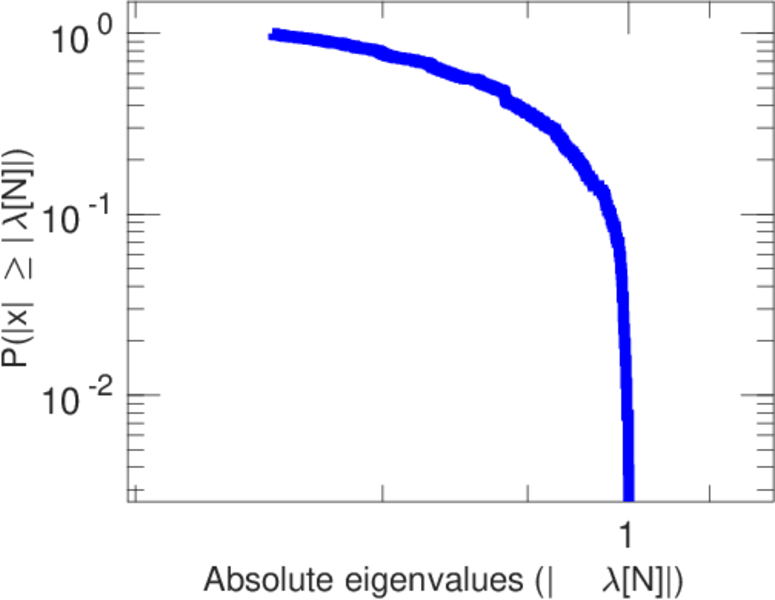
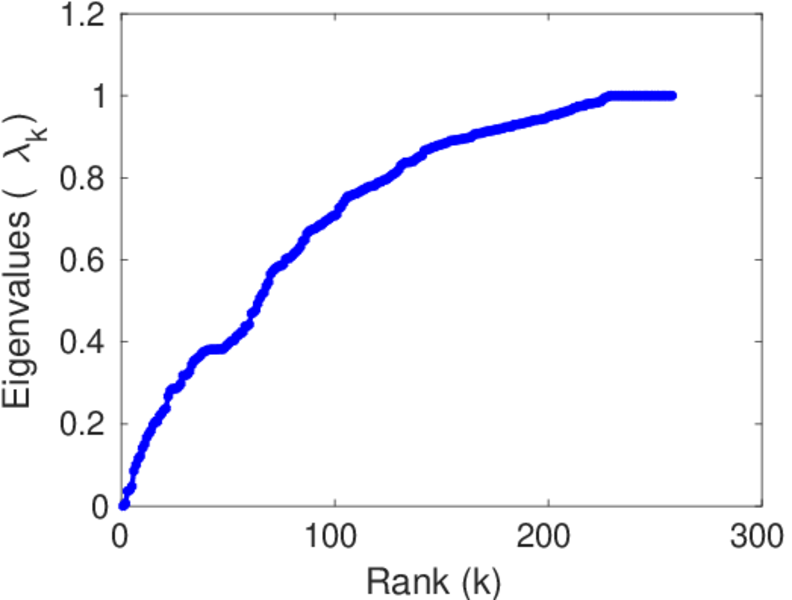
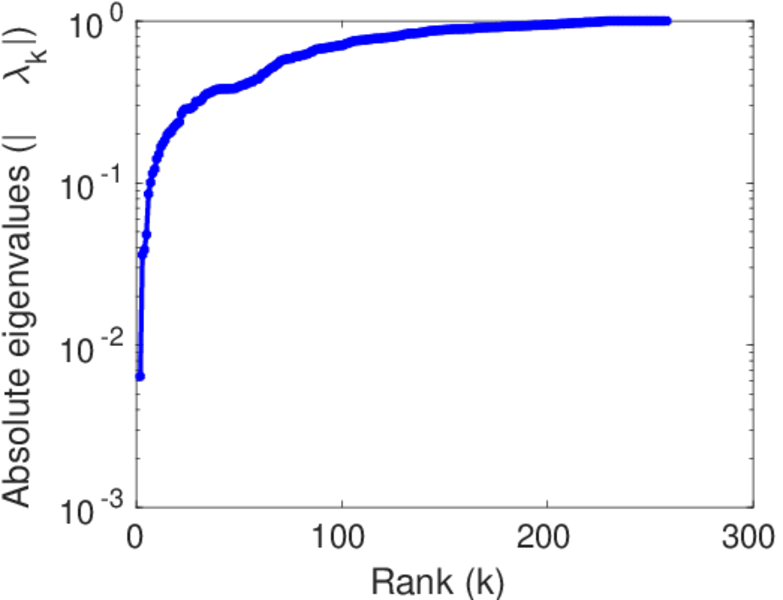
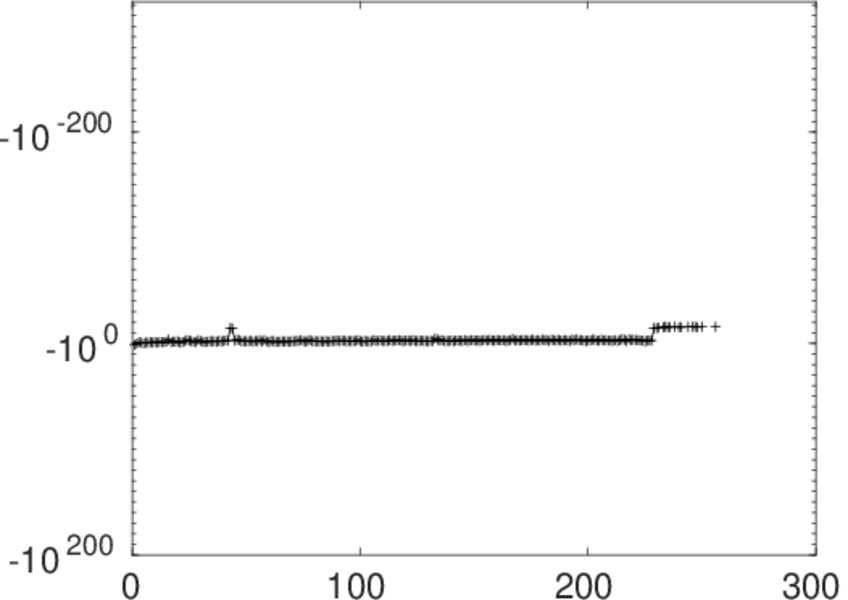
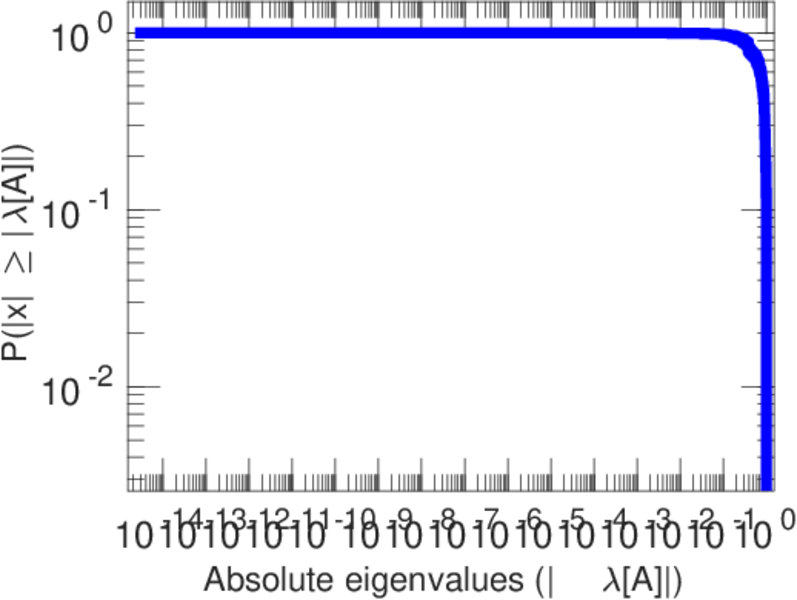
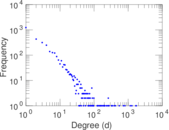
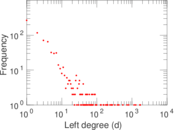
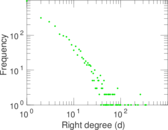
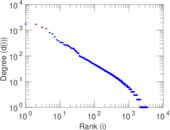
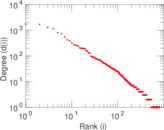
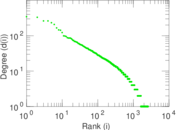
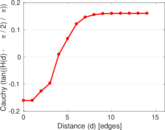
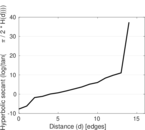
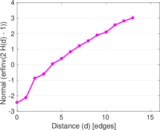
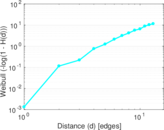
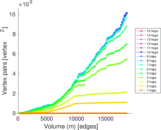
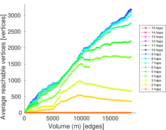
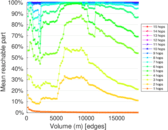
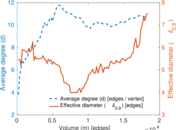
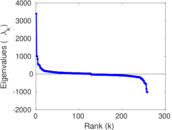
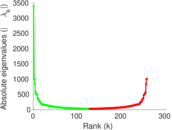
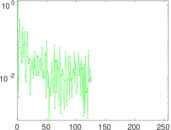
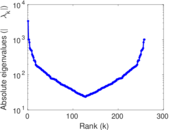
Plots


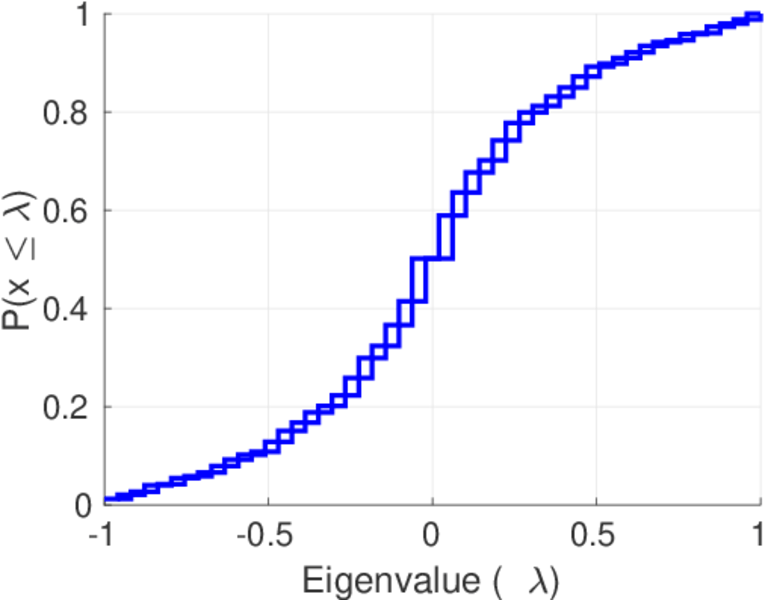
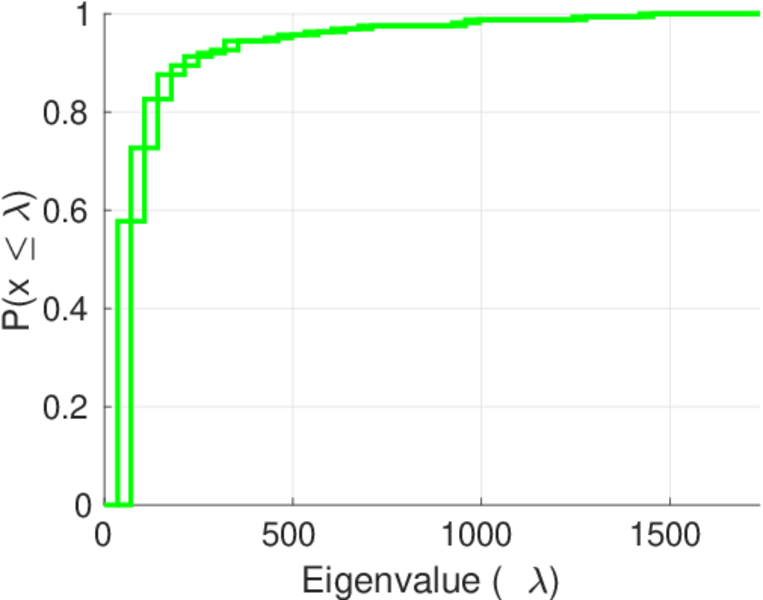
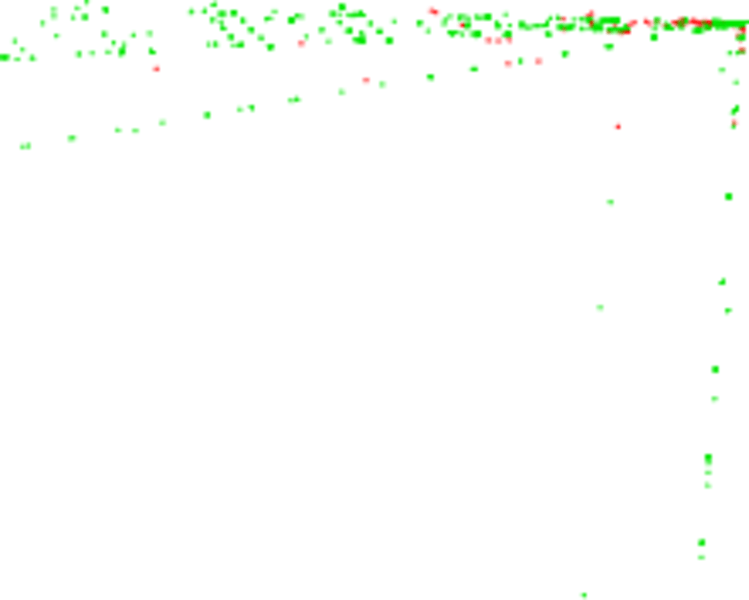
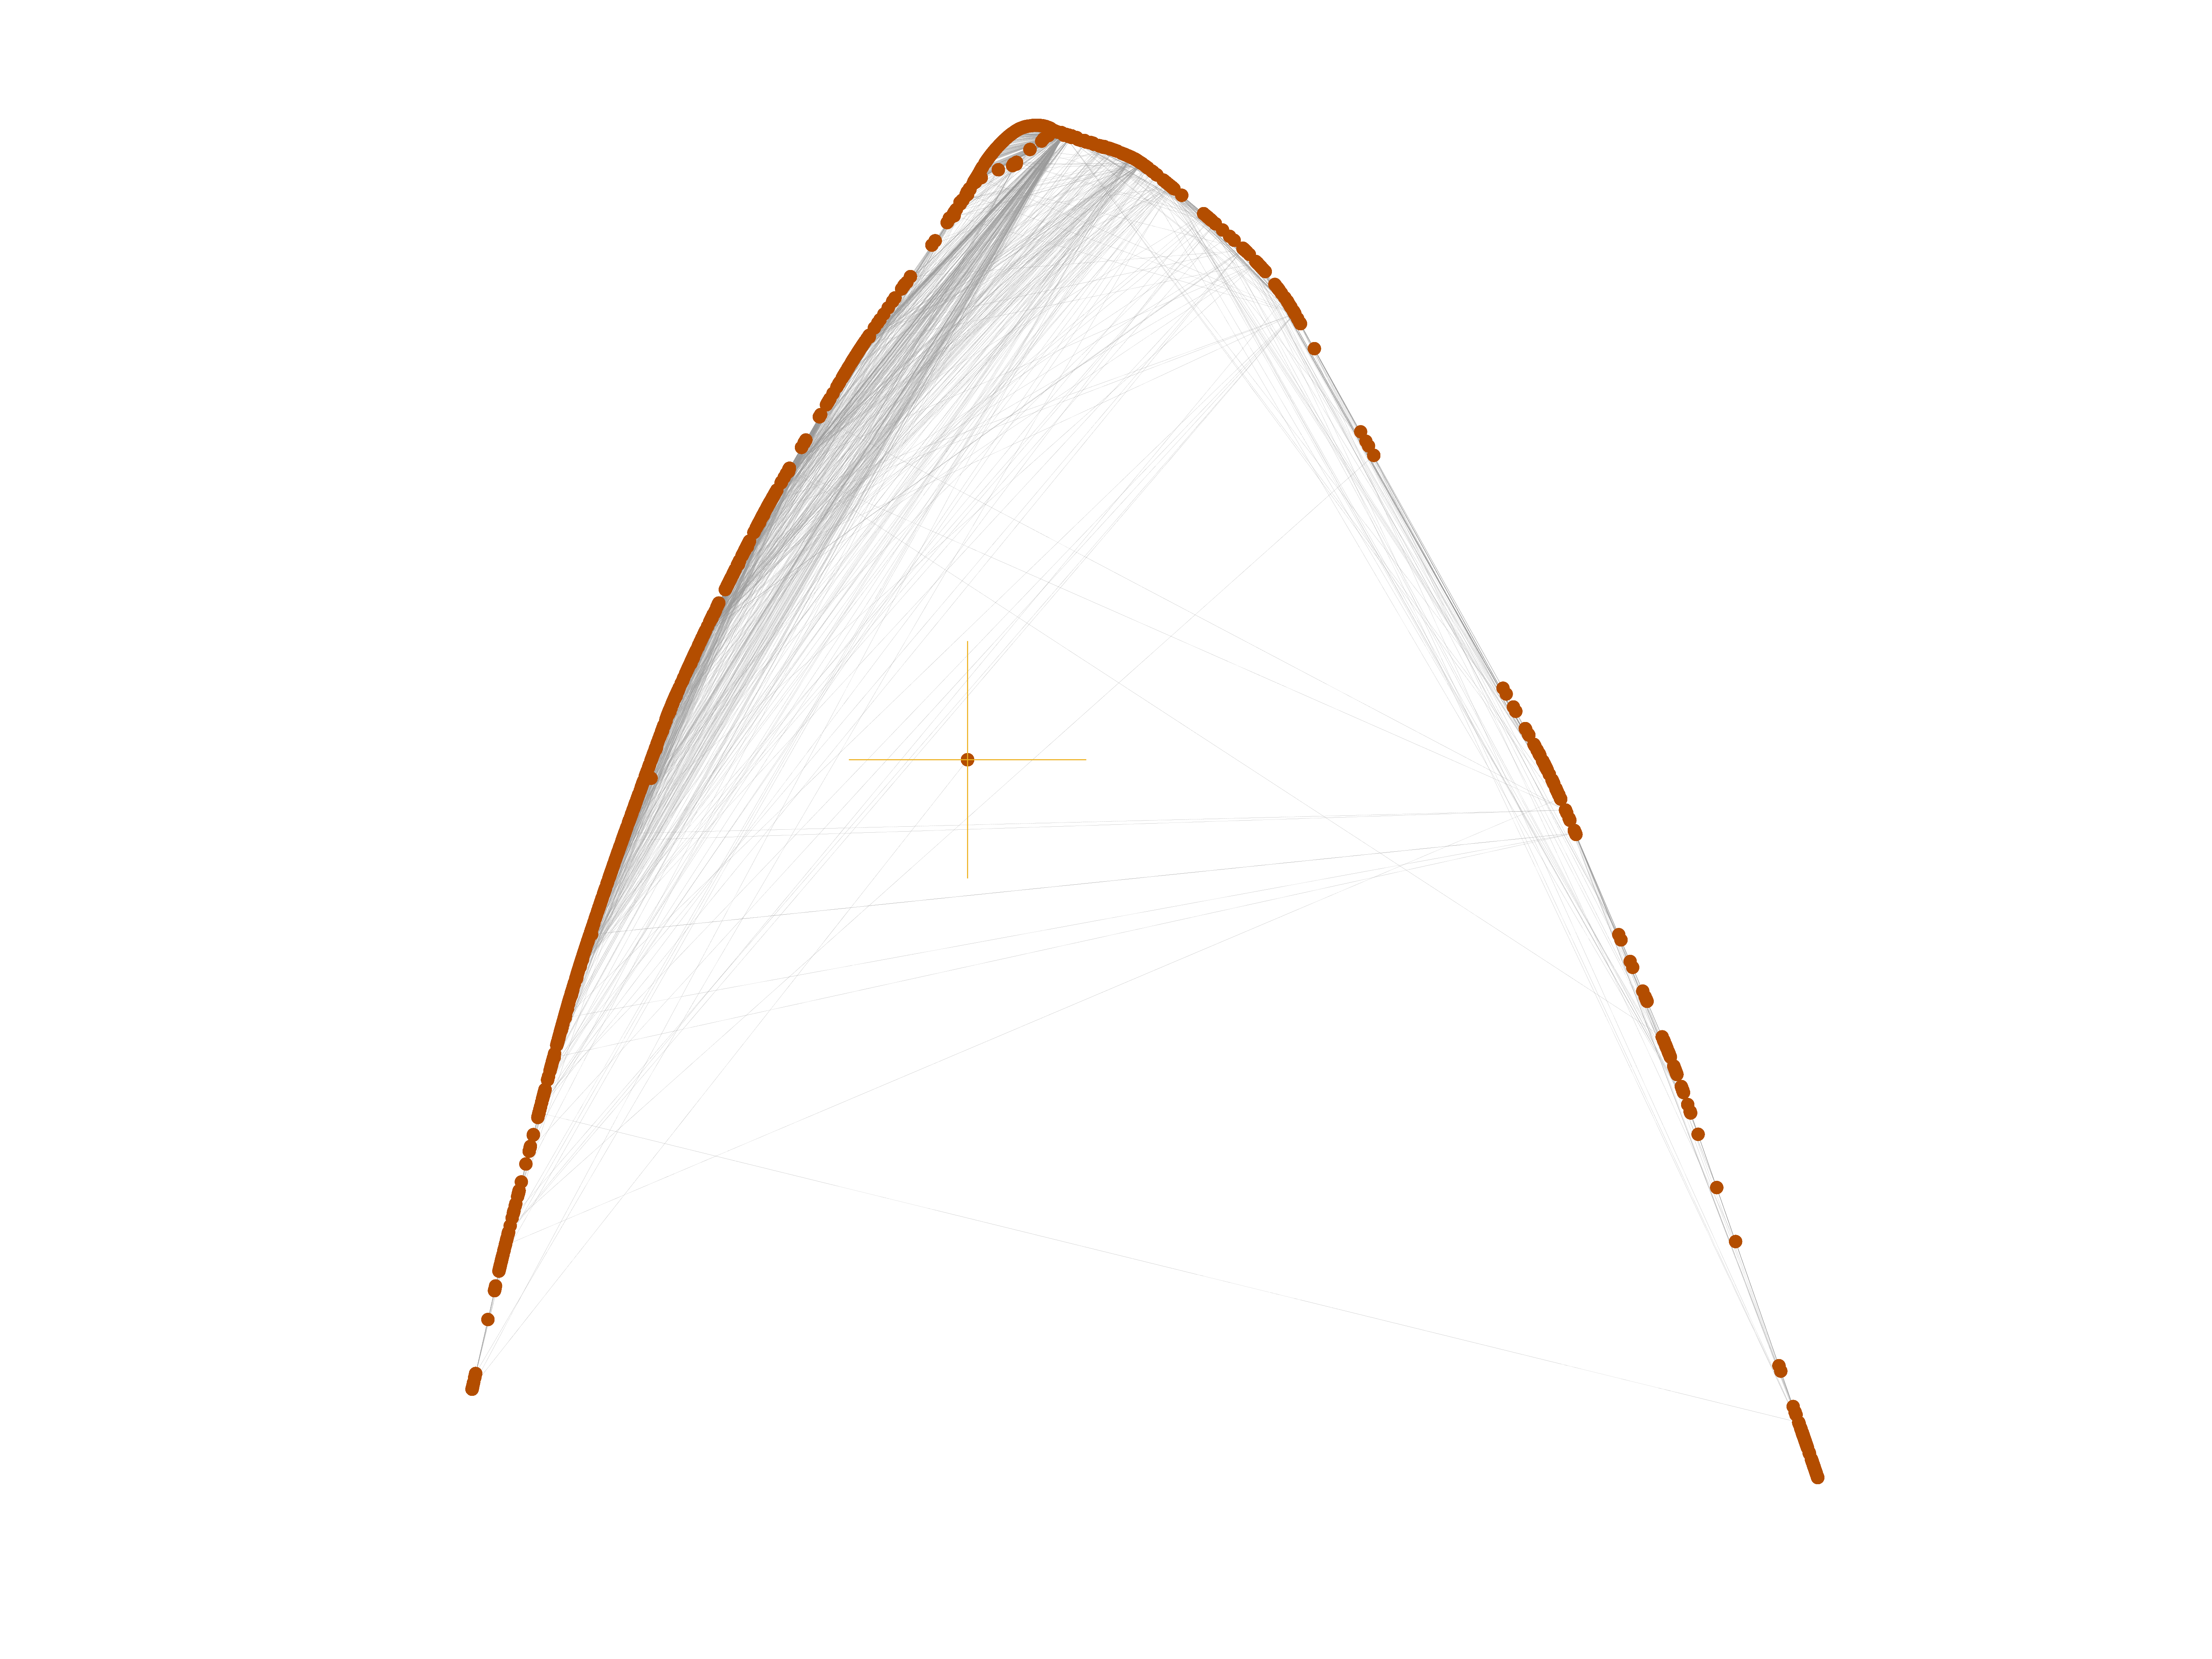
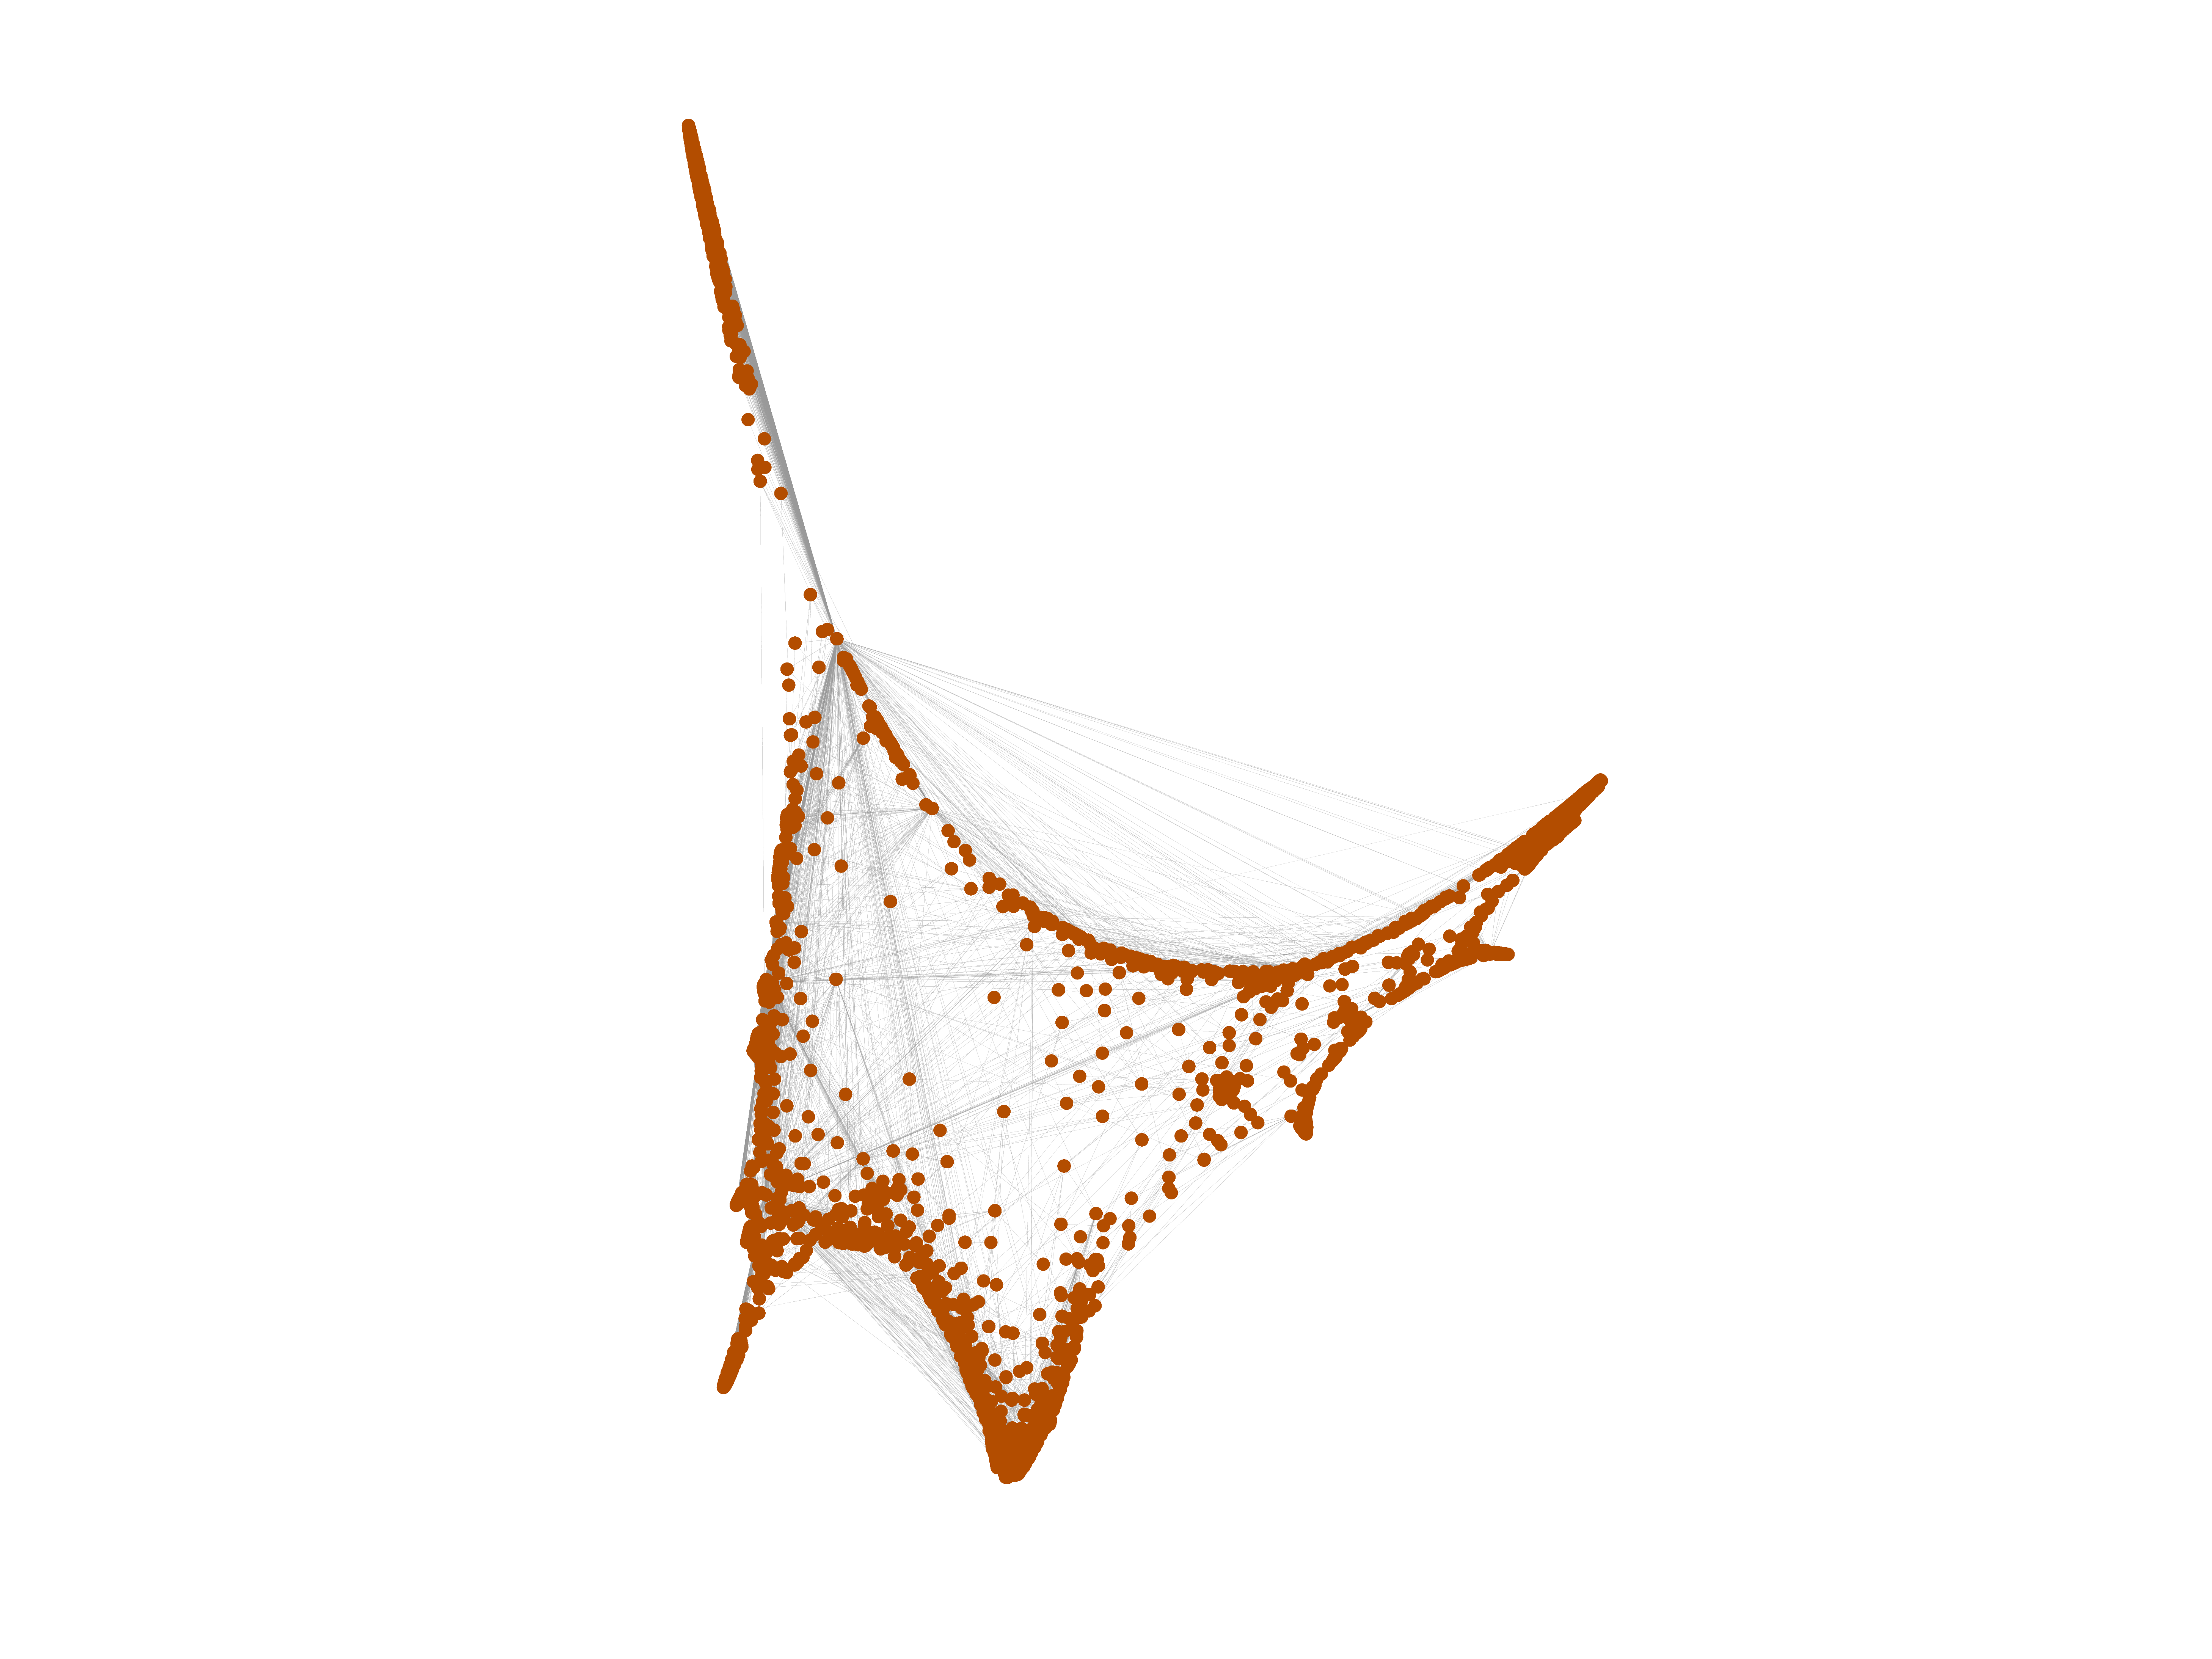
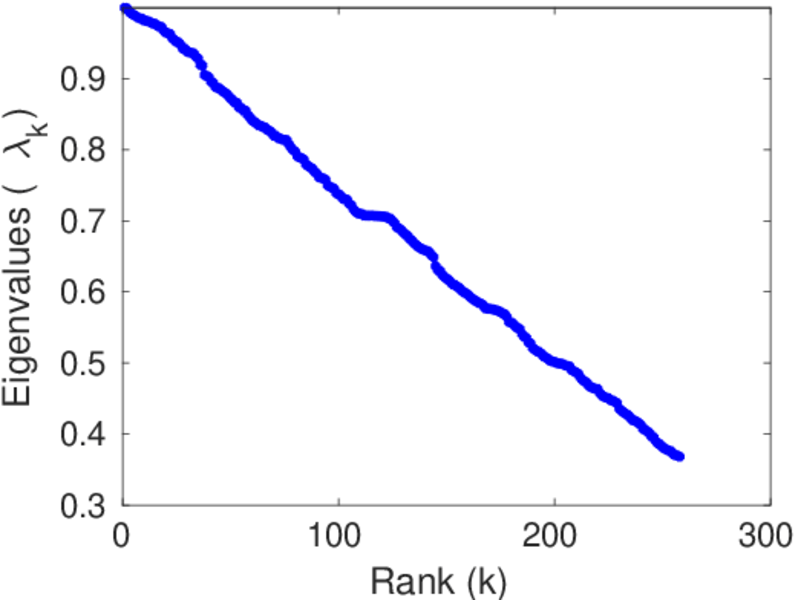
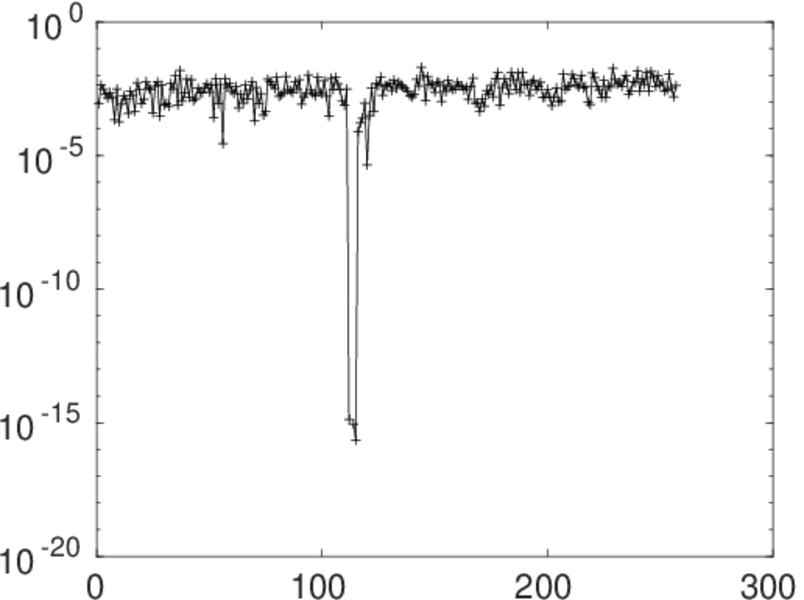
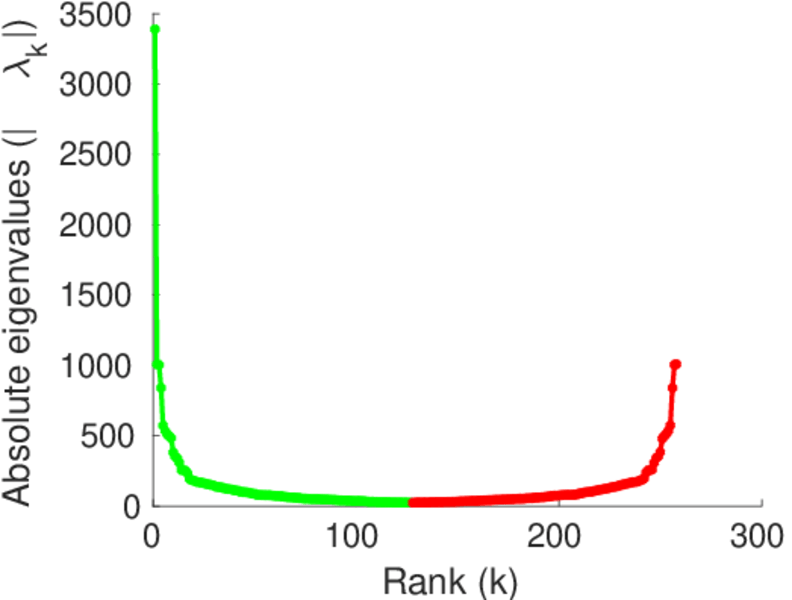
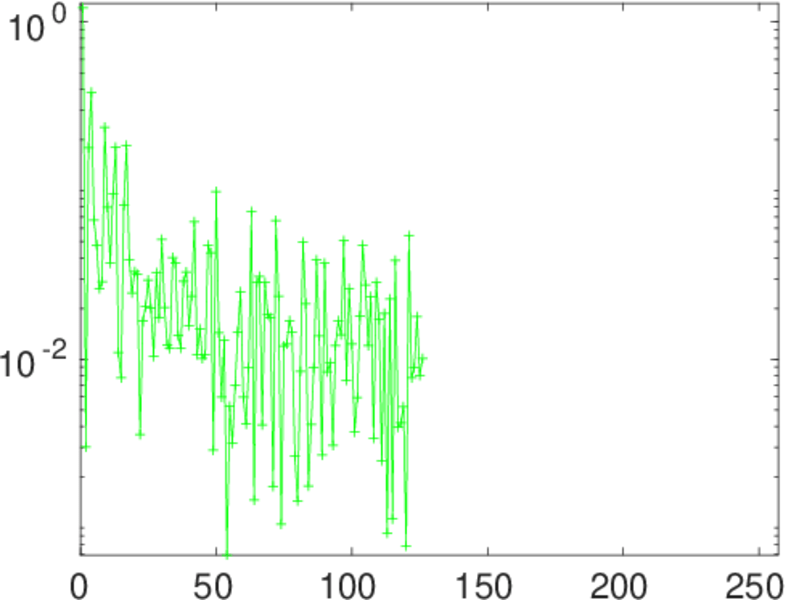
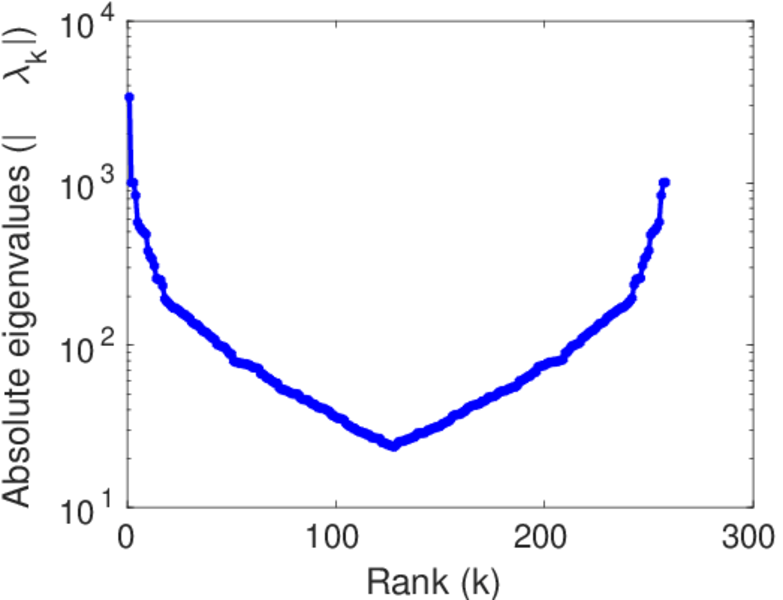
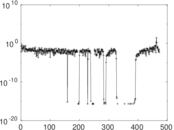
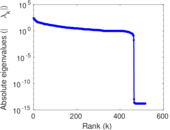
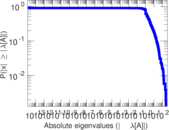
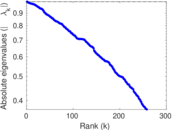
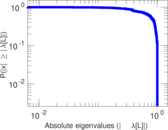
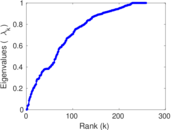
Matrix decompositions plots


Downloads
References
|
[1]
|
Jérôme Kunegis.
KONECT – The Koblenz Network Collection.
In Proc. Int. Conf. on World Wide Web Companion, pages
1343–1350, 2013.
[ http ]
|
|
[2]
|
Wikimedia Foundation.
Wikimedia downloads.
http://dumps.wikimedia.org/, January 2010.
|
 KONECT ‣ Networks ‣
Buy Me a Coffee
KONECT ‣ Networks ‣
Buy Me a Coffee