Wikivoyage edits (sv)
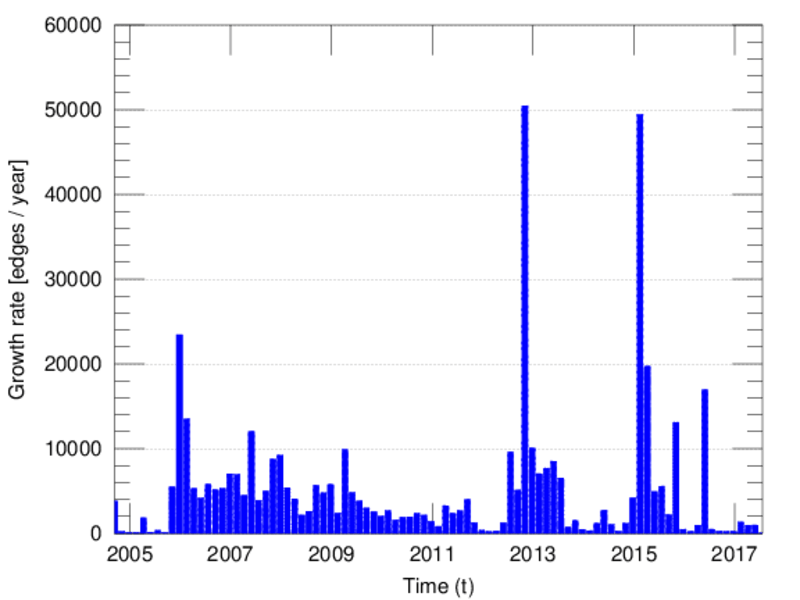
This is the bipartite edit network of the Swedish Wikivoyage. It contains users
and pages from the Swedish Wikivoyage, connected by edit events. Each edge
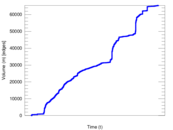
represents an edit. The dataset includes the timestamp of each edit.
Metadata
Statistics
| Size | n = | 11,151
|
| Left size | n1 = | 748
|
| Right size | n2 = | 10,403
|
| Volume | m = | 65,410
|
| Unique edge count | m̿ = | 27,511
|
| Wedge count | s = | 21,383,567
|
| Claw count | z = | 21,614,599,387
|
| Cross count | x = | 21,088,263,378,154
|
| Square count | q = | 17,051,705
|
| 4-Tour count | T4 = | 222,064,018
|
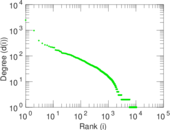
| Maximum degree | dmax = | 15,402
|
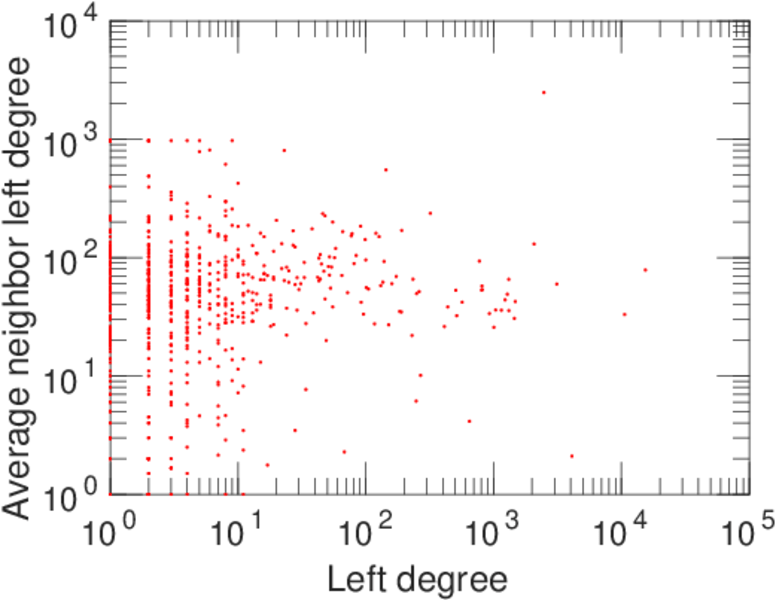
| Maximum left degree | d1max = | 15,402
|
| Maximum right degree | d2max = | 2,479
|
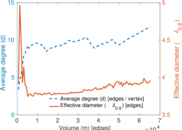
| Average degree | d = | 11.731 7
|
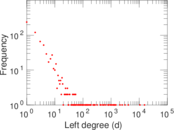
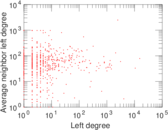
| Average left degree | d1 = | 87.446 5
|
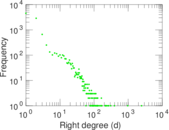
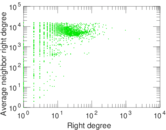
| Average right degree | d2 = | 6.287 61
|
| Fill | p = | 0.003 535 46
|
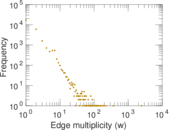
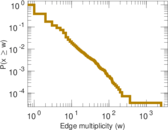
| Average edge multiplicity | m̃ = | 2.377 59
|
| Size of LCC | N = | 10,922
|
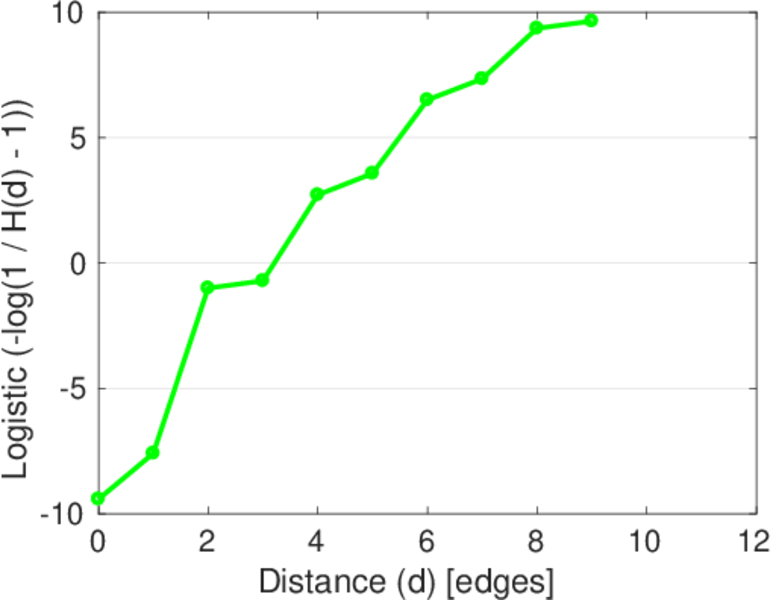
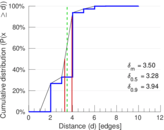
| Diameter | δ = | 11
|
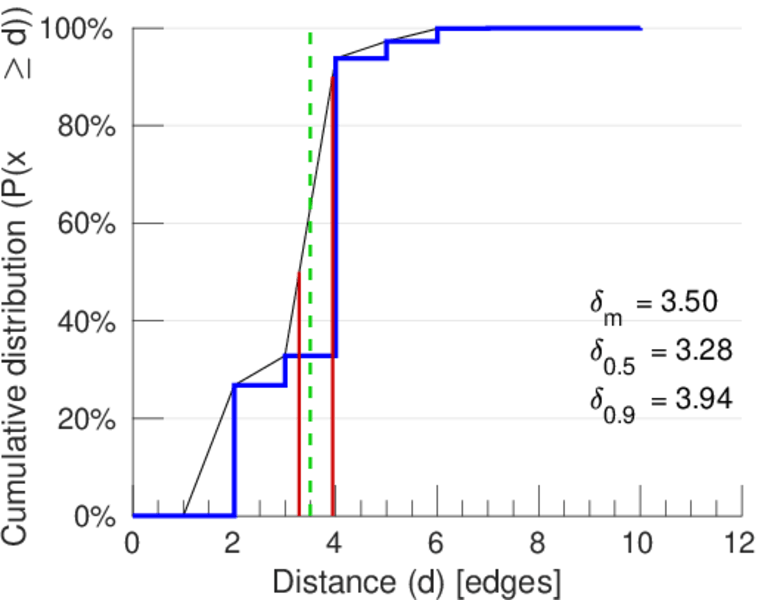
| 50-Percentile effective diameter | δ0.5 = | 3.281 89
|
| 90-Percentile effective diameter | δ0.9 = | 3.938 34
|
| Median distance | δM = | 4
|
| Mean distance | δm = | 3.495 81
|
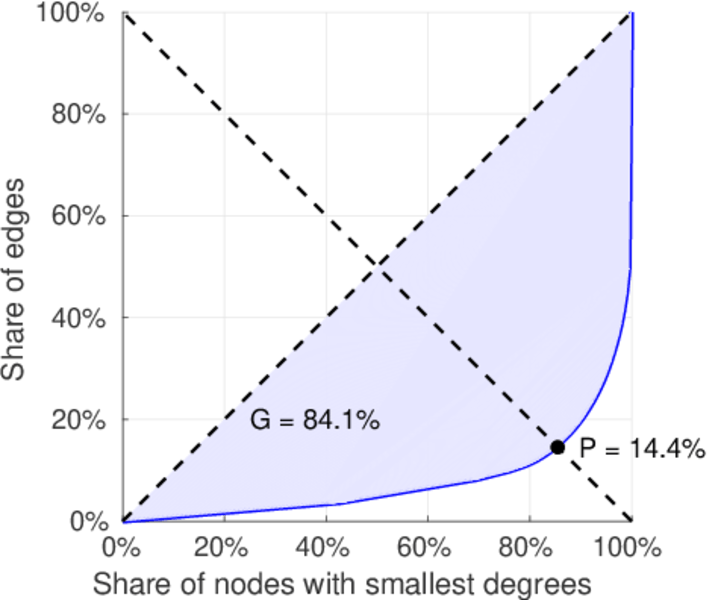
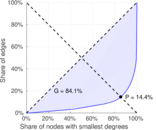
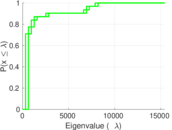
| Gini coefficient | G = | 0.847 715
|
| Balanced inequality ratio | P = | 0.138 993
|
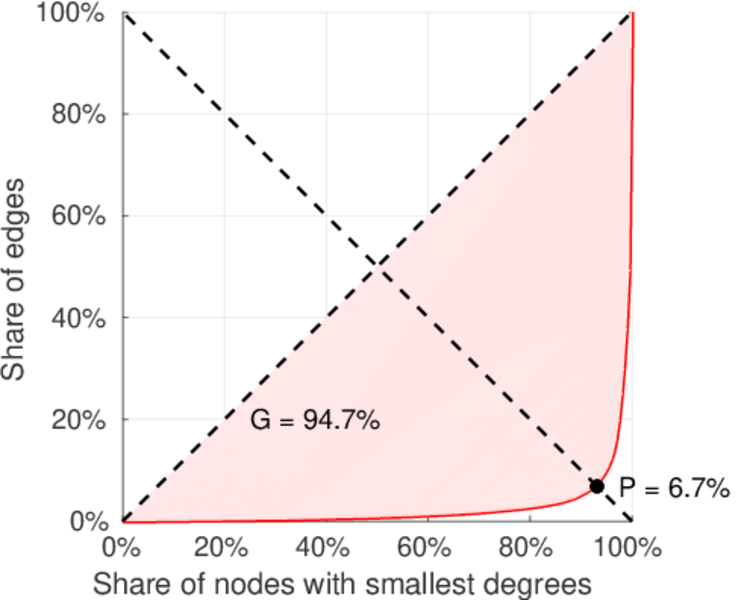
| Left balanced inequality ratio | P1 = | 0.066 809 4
|
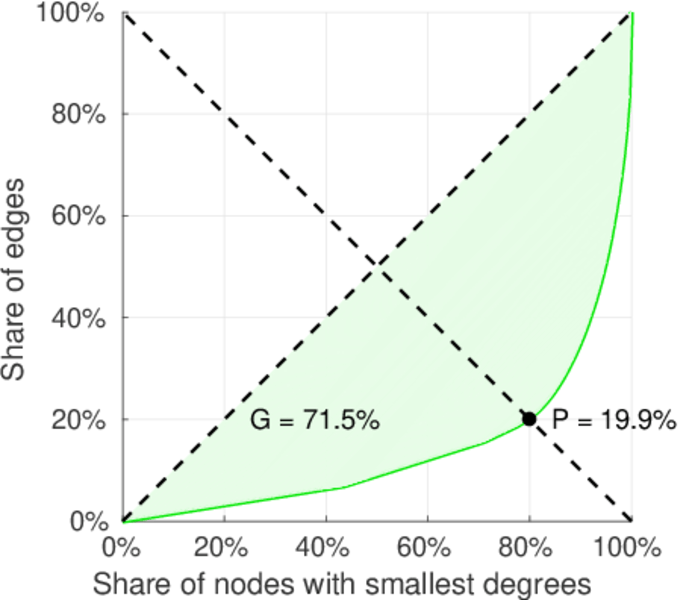
| Right balanced inequality ratio | P2 = | 0.199 159
|
| Relative edge distribution entropy | Her = | 0.733 330
|
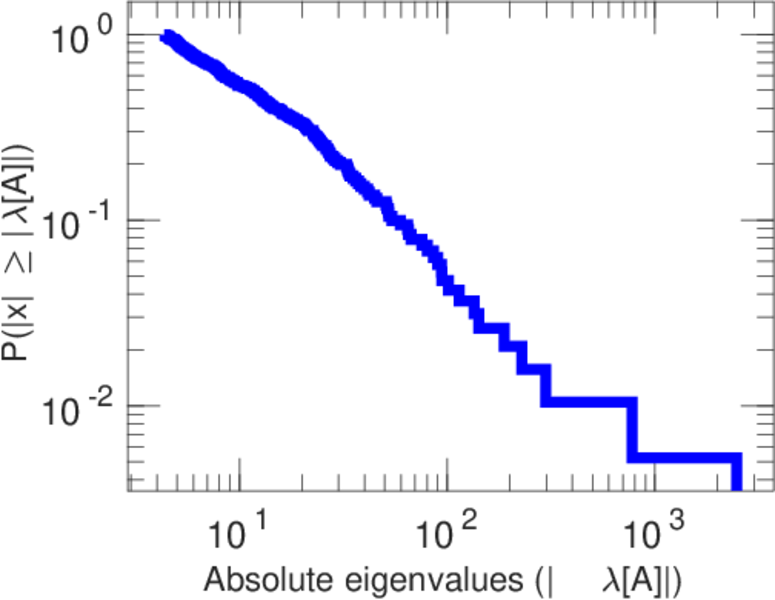
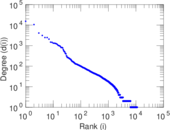
| Power law exponent | γ = | 2.991 89
|
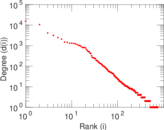
| Tail power law exponent | γt = | 2.081 00
|
| Tail power law exponent with p | γ3 = | 2.081 00
|
| p-value | p = | 0.000 00
|
| Left tail power law exponent with p | γ3,1 = | 1.731 00
|
| Left p-value | p1 = | 0.004 000 00
|
| Right tail power law exponent with p | γ3,2 = | 2.121 00
|
| Right p-value | p2 = | 0.000 00
|
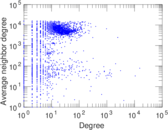
| Degree assortativity | ρ = | −0.332 302
|
| Degree assortativity p-value | pρ = | 0.000 00
|
| Spectral norm | α = | 2,479.00
|
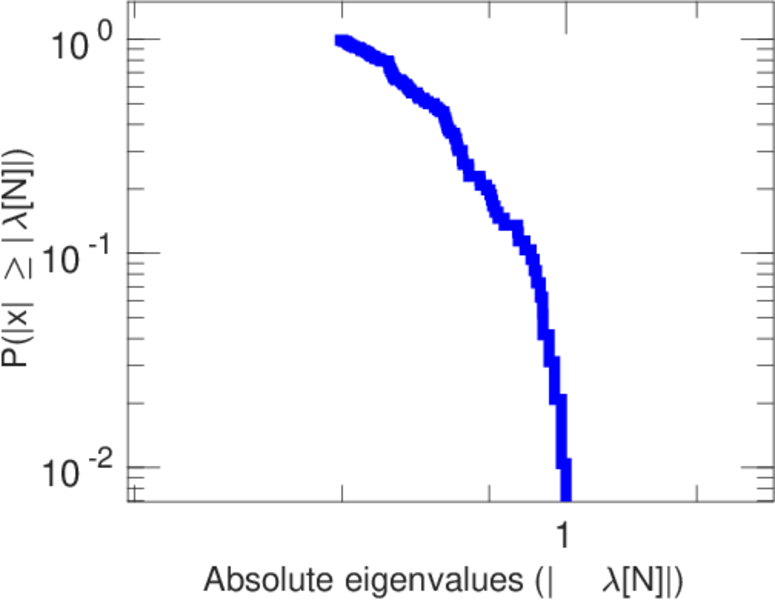
| Algebraic connectivity | a = | 0.042 021 6
|
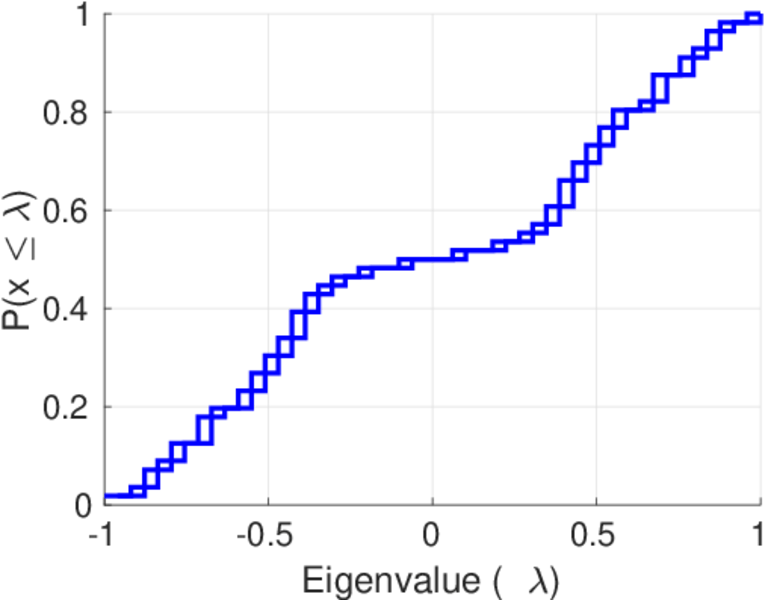
| Spectral separation | |λ1[A] / λ2[A]| = | 3.198 18
|
| Controllability | C = | 9,884
|
| Relative controllability | Cr = | 0.888 849
|
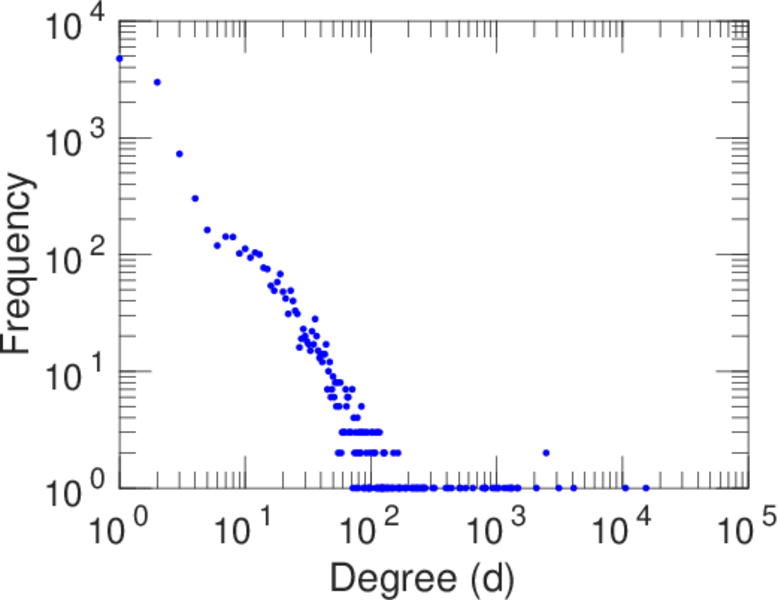
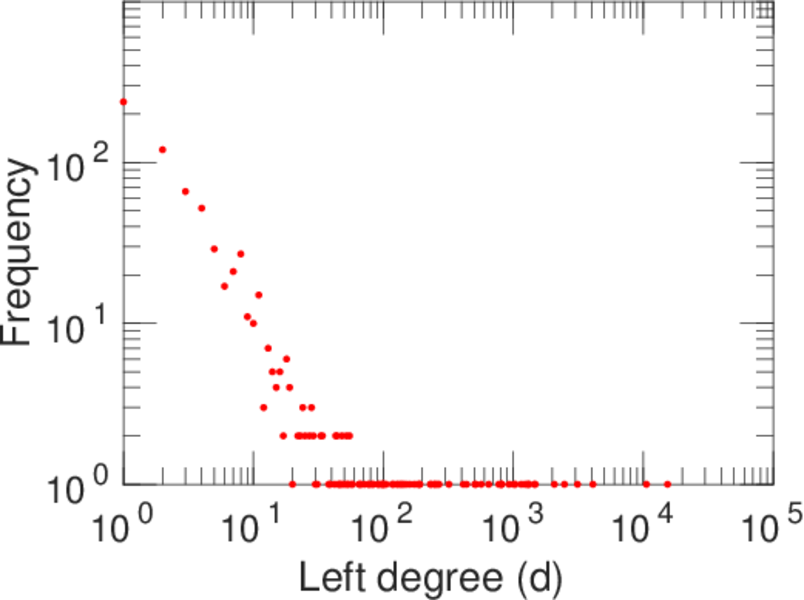
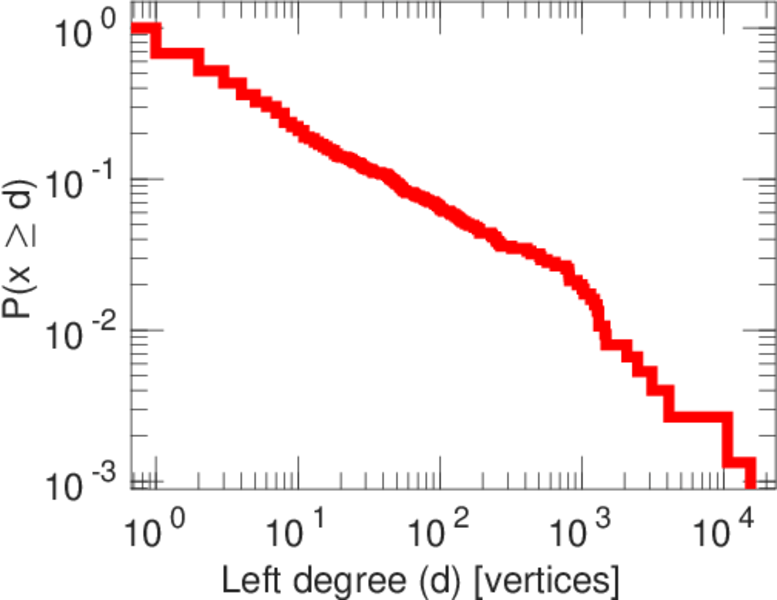
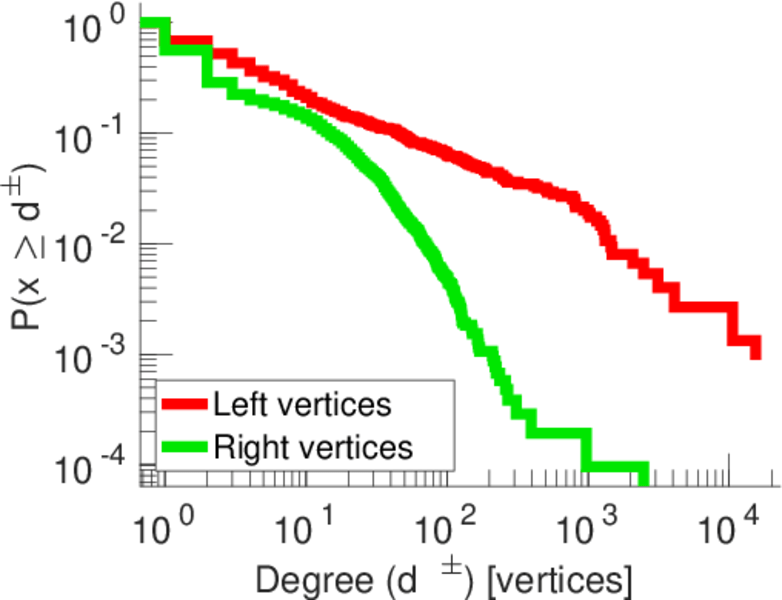
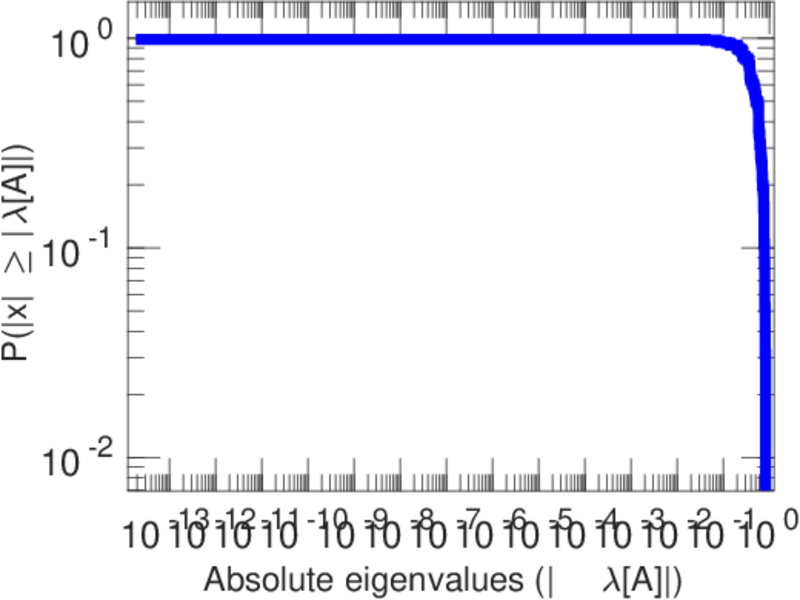
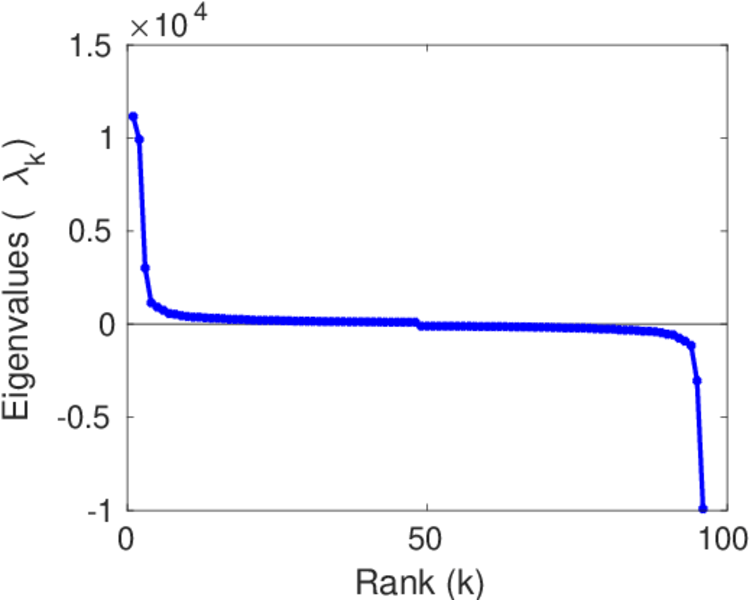
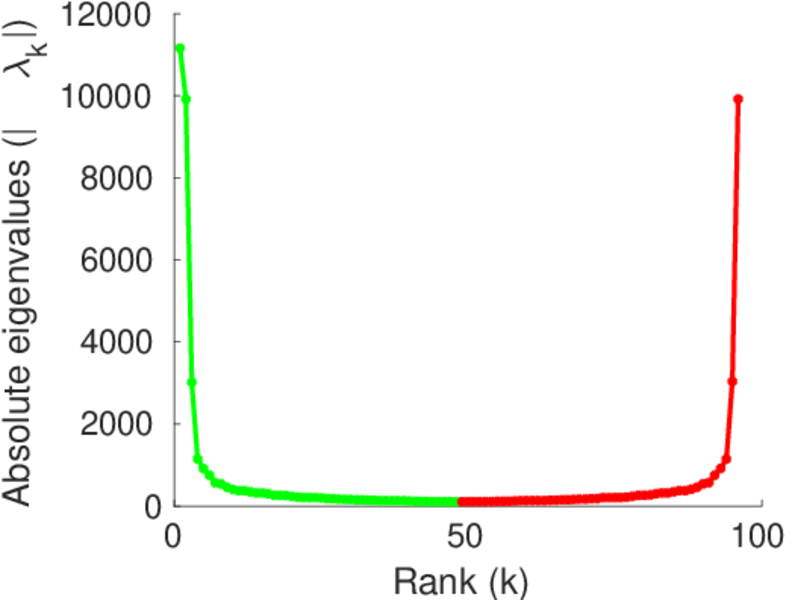
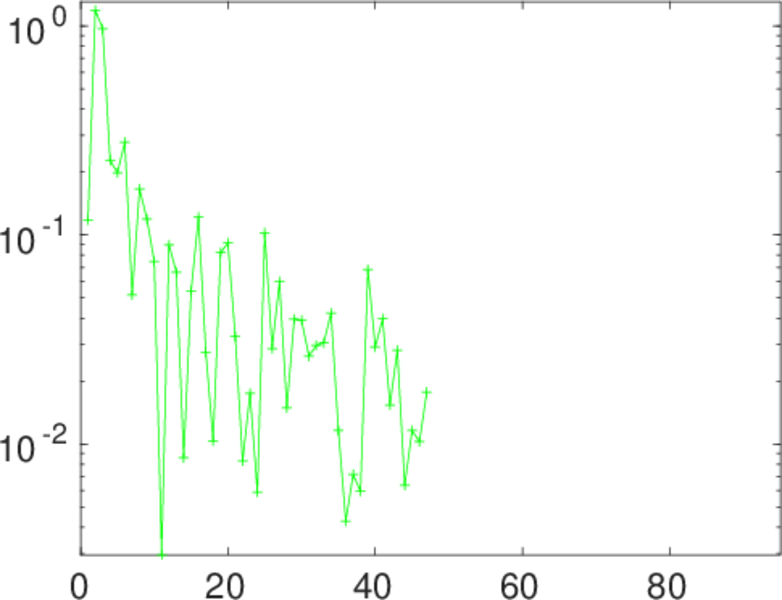
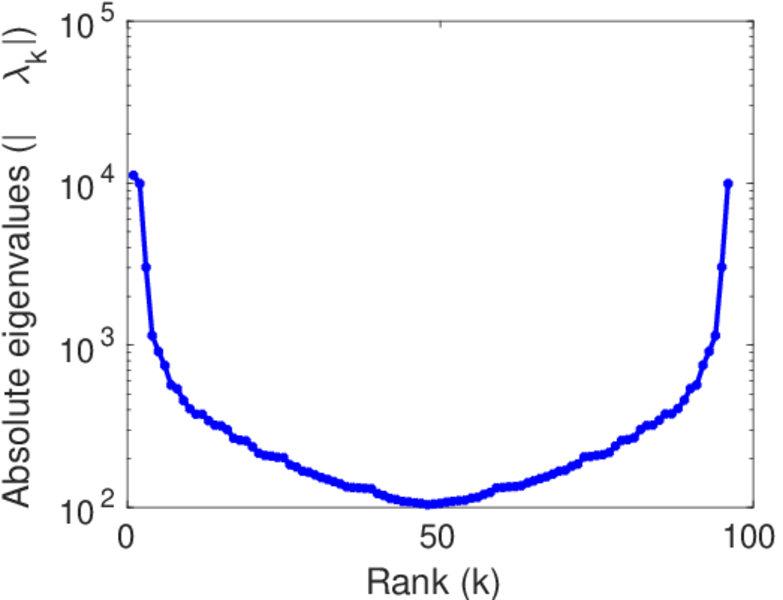
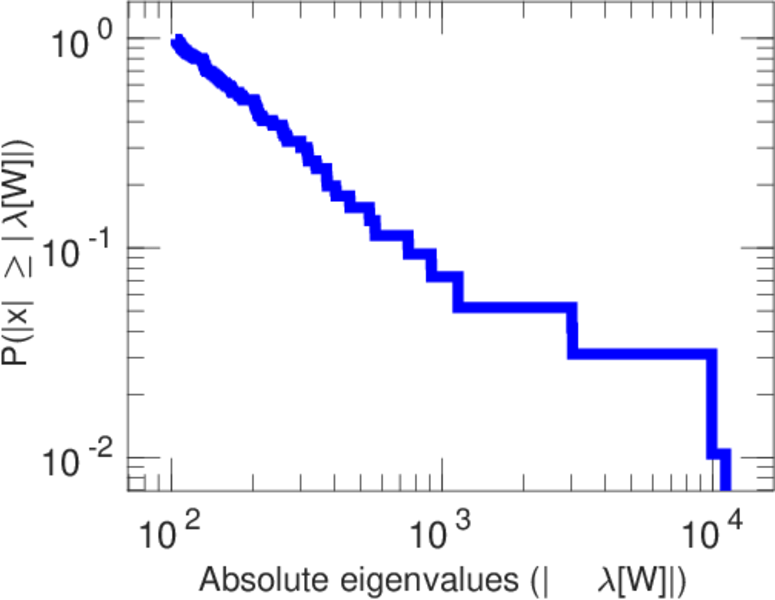
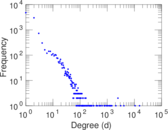
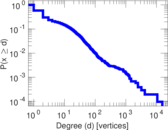
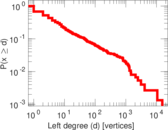
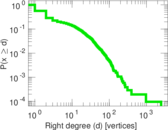
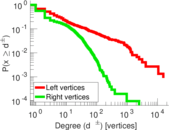
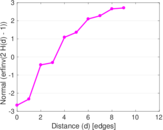
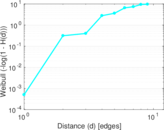
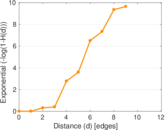
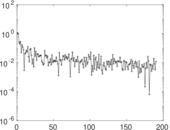
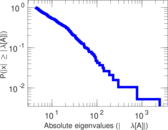
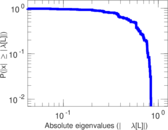
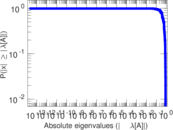
Plots


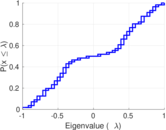

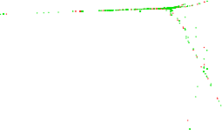
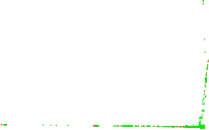


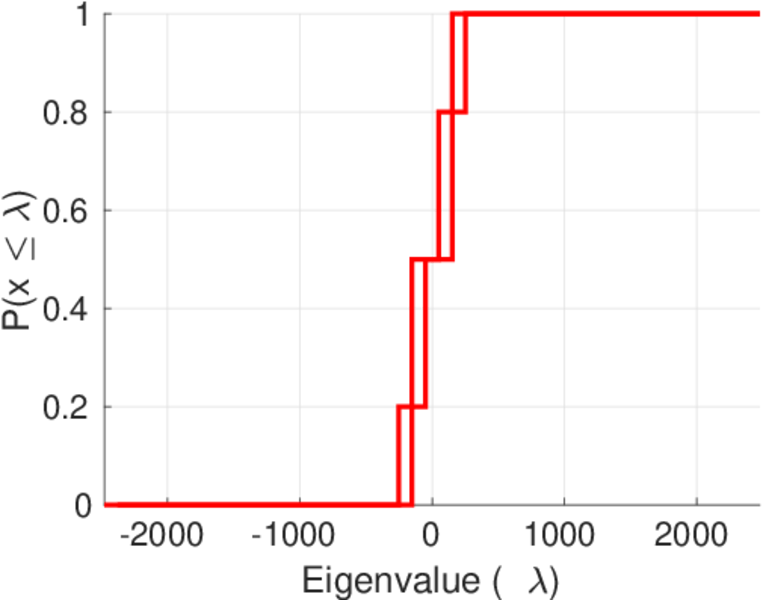
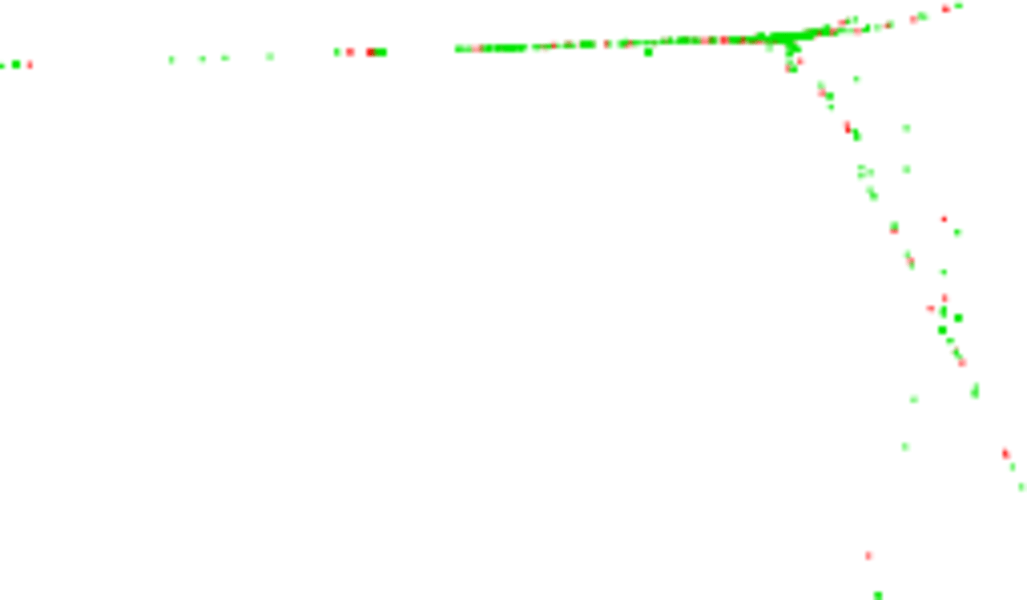
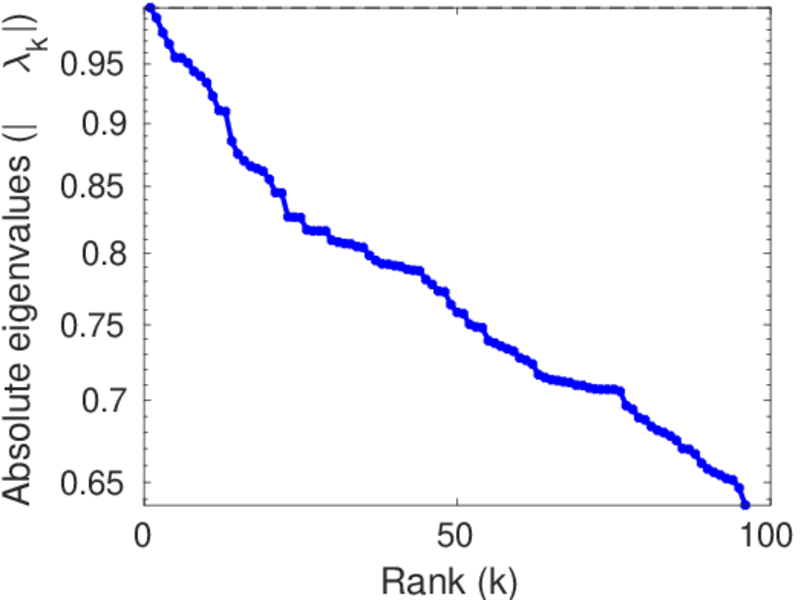
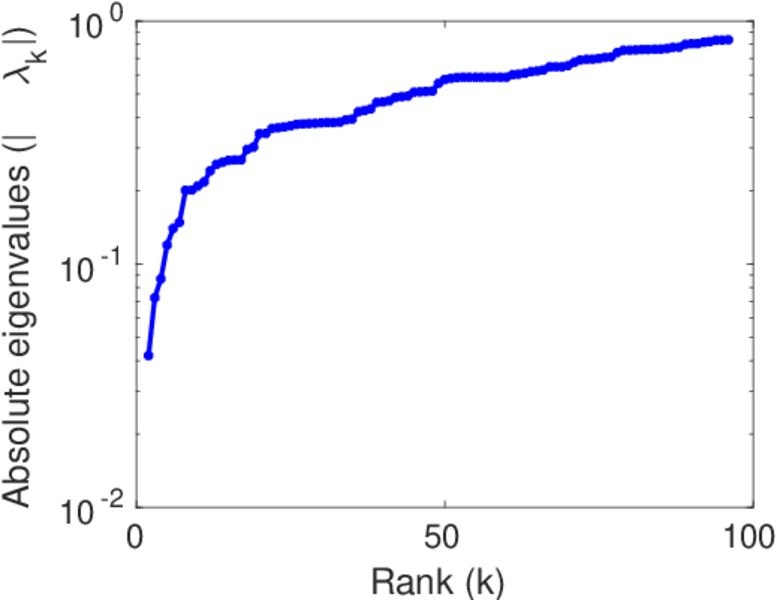
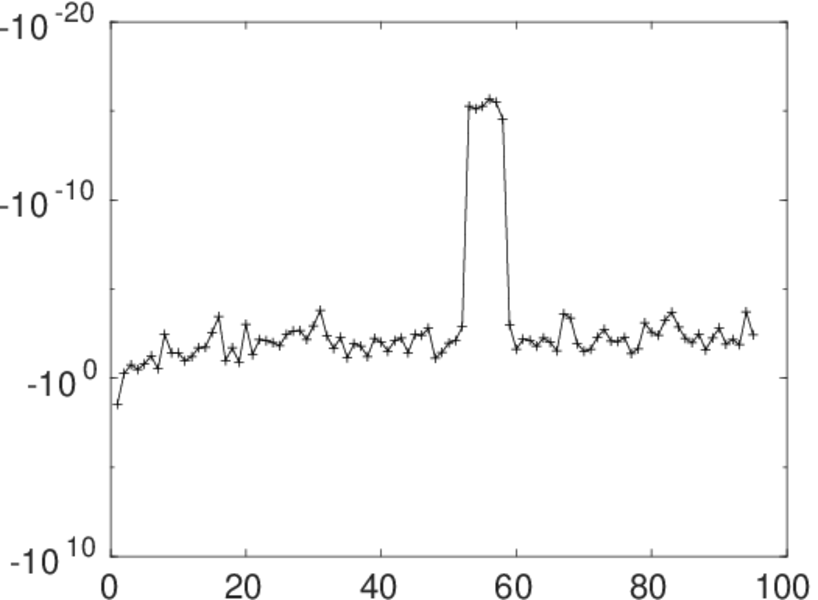
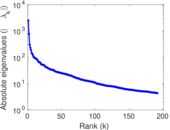
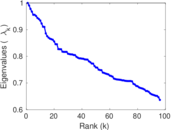
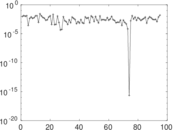
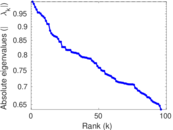
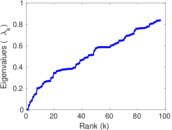
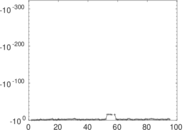
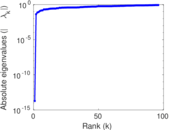
Matrix decompositions plots


Downloads
References
|
[1]
|
Jérôme Kunegis.
KONECT – The Koblenz Network Collection.
In Proc. Int. Conf. on World Wide Web Companion, pages
1343–1350, 2013.
[ http ]
|
|
[2]
|
Wikimedia Foundation.
Wikimedia downloads.
http://dumps.wikimedia.org/, January 2010.
|
 KONECT ‣ Networks ‣
Buy Me a Coffee
KONECT ‣ Networks ‣
Buy Me a Coffee