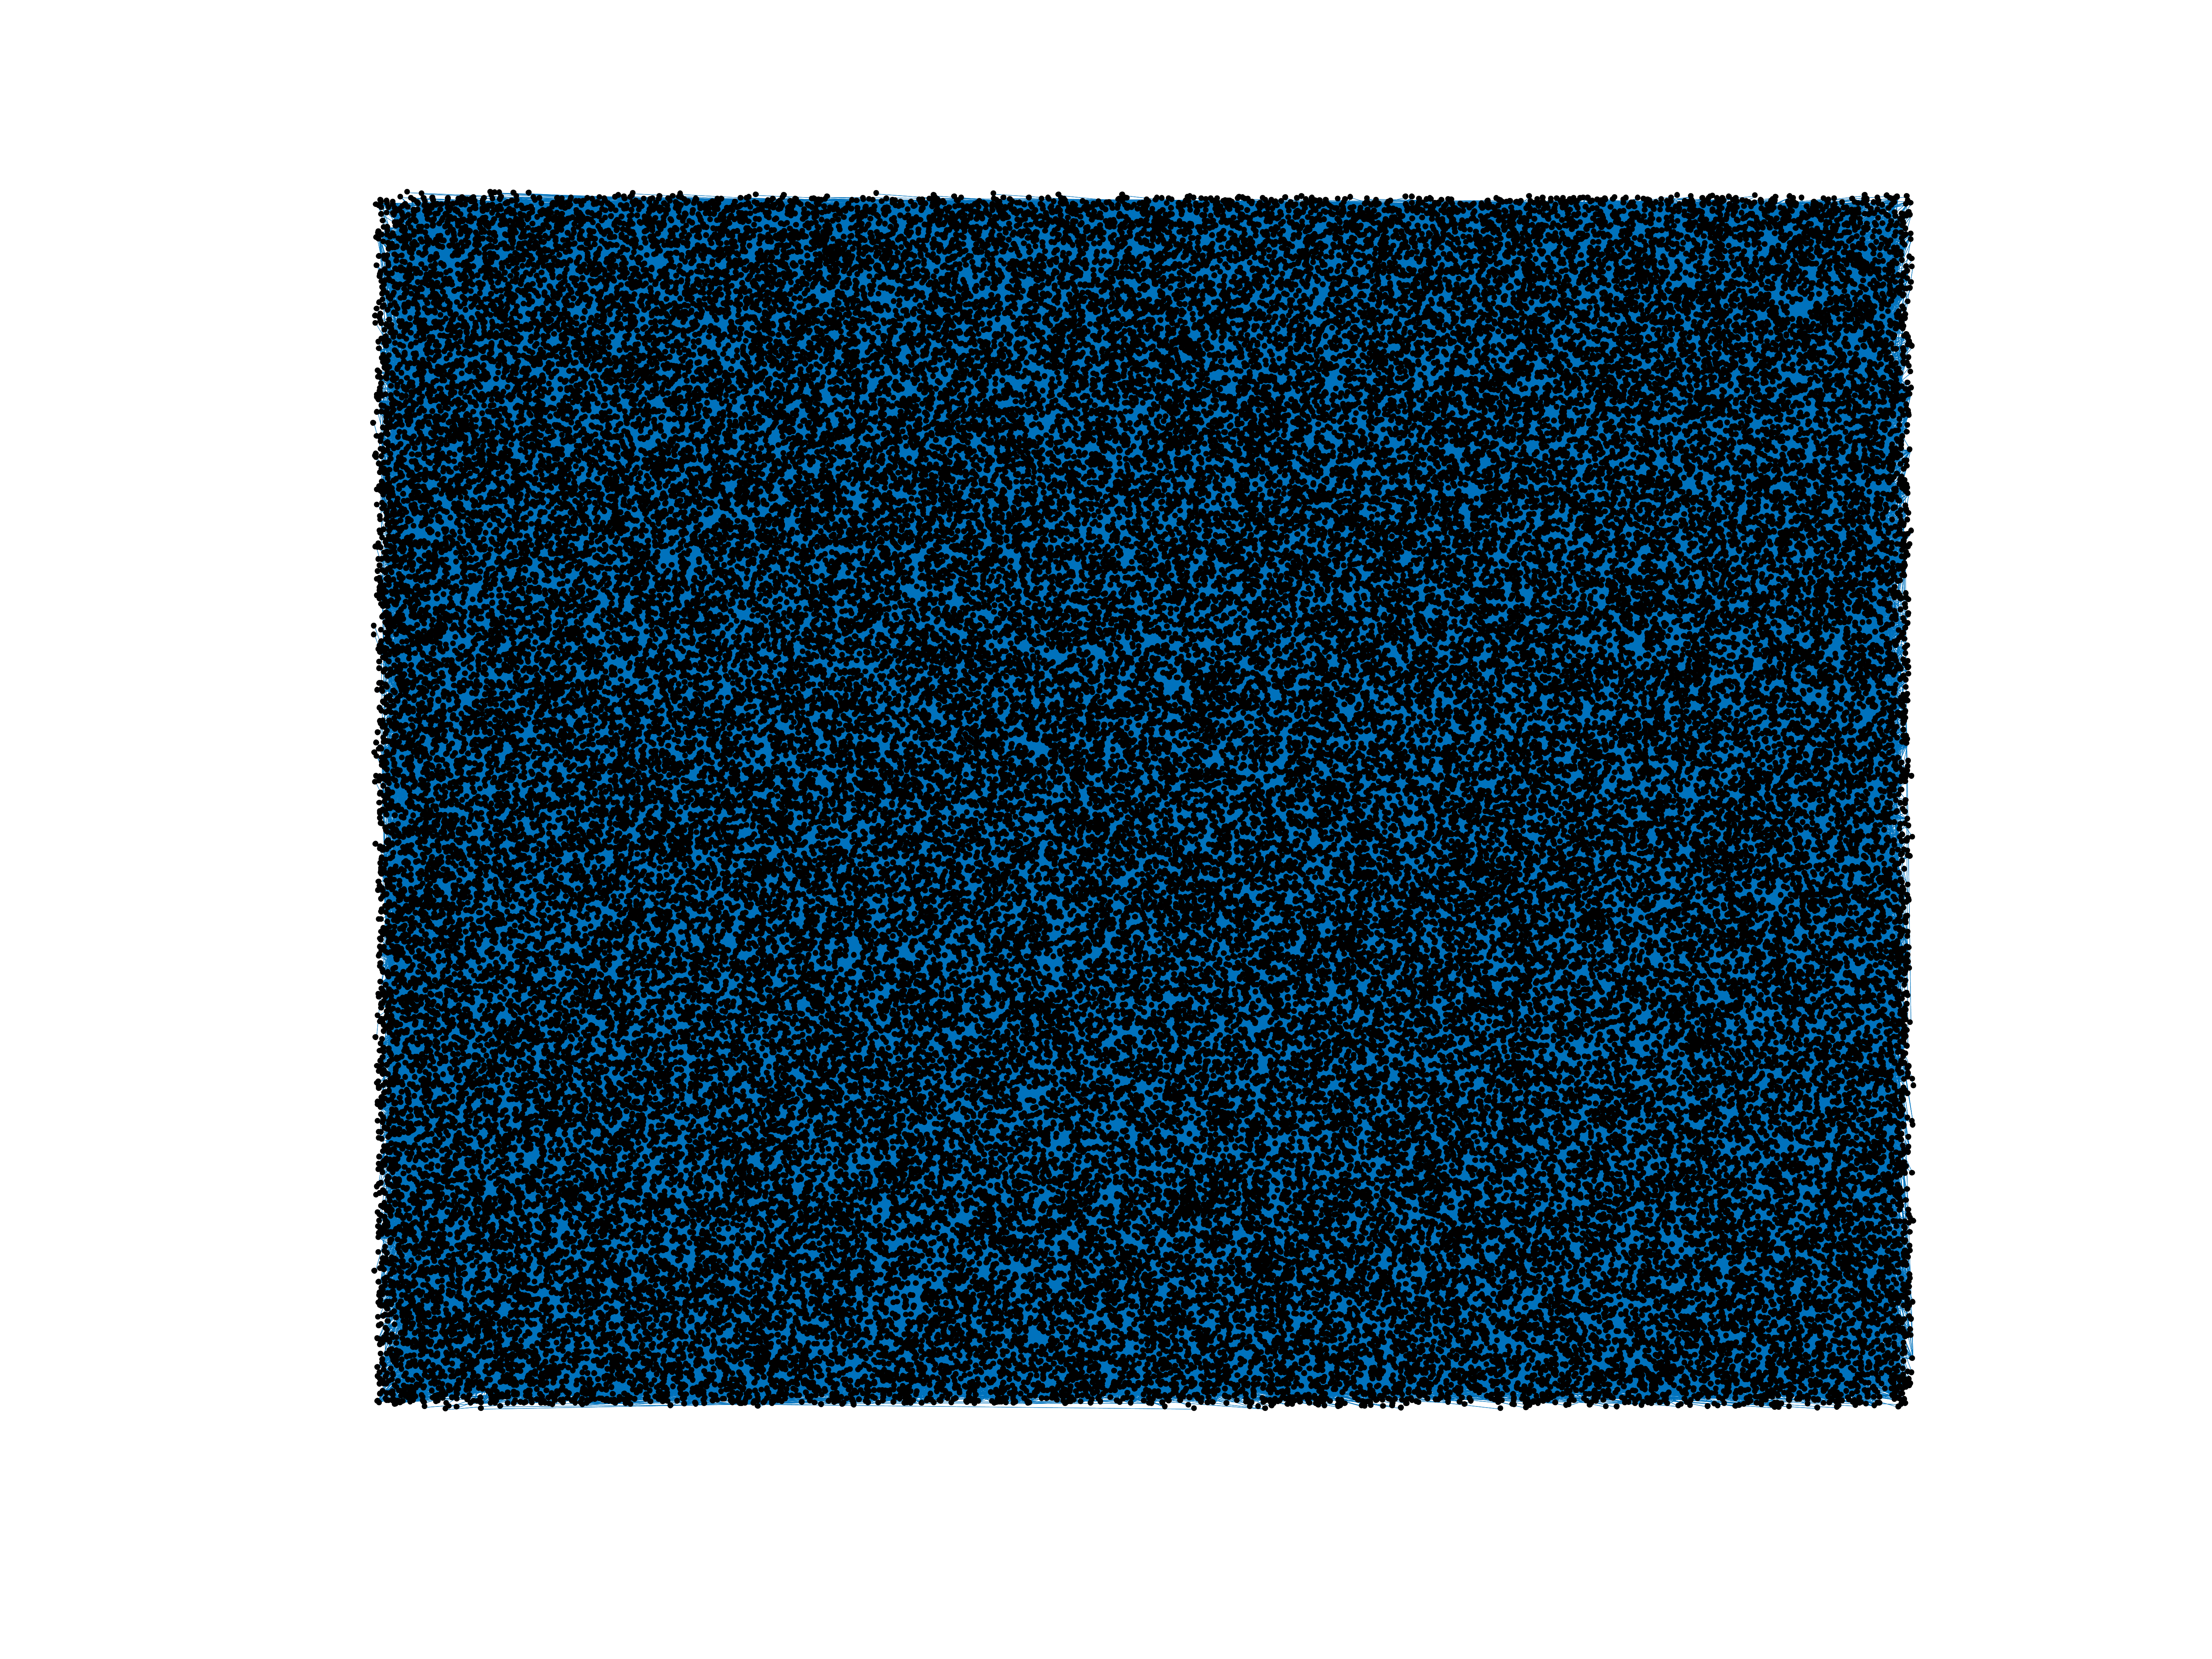
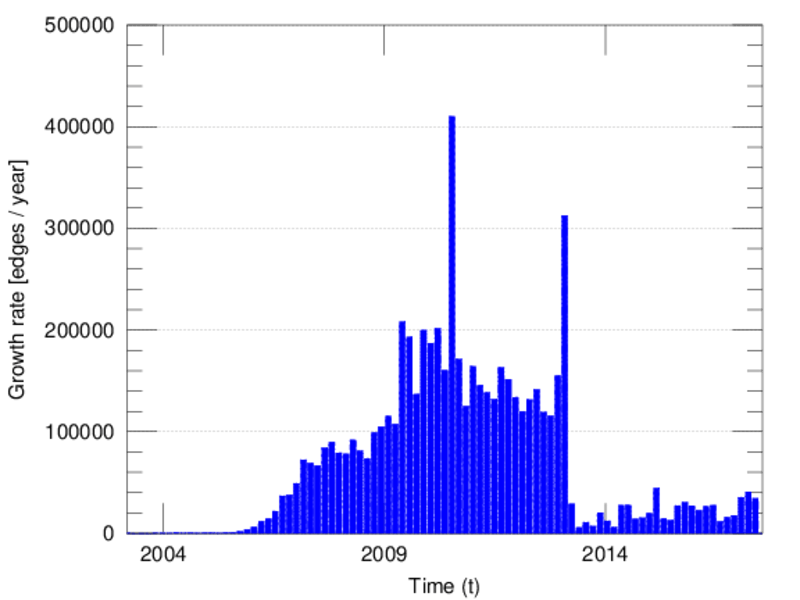
Wikipedia edits (sw)
This is the bipartite edit network of the Swahili Wikipedia. It contains users
and pages from the Swahili Wikipedia, connected by edit events. Each edge
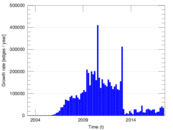
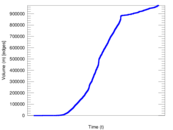
represents an edit. The dataset includes the timestamp of each edit.
Metadata
Statistics
| Size | n = | 90,112
|
| Left size | n1 = | 3,800
|
| Right size | n2 = | 86,312
|
| Volume | m = | 973,846
|
| Unique edge count | m̿ = | 484,536
|
| Wedge count | s = | 2,503,347,769
|
| Square count | q = | 5,765,717,831
|
| 4-Tour count | T4 = | 56,140,274,560
|
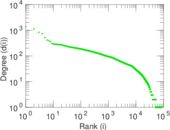
| Maximum degree | dmax = | 69,412
|
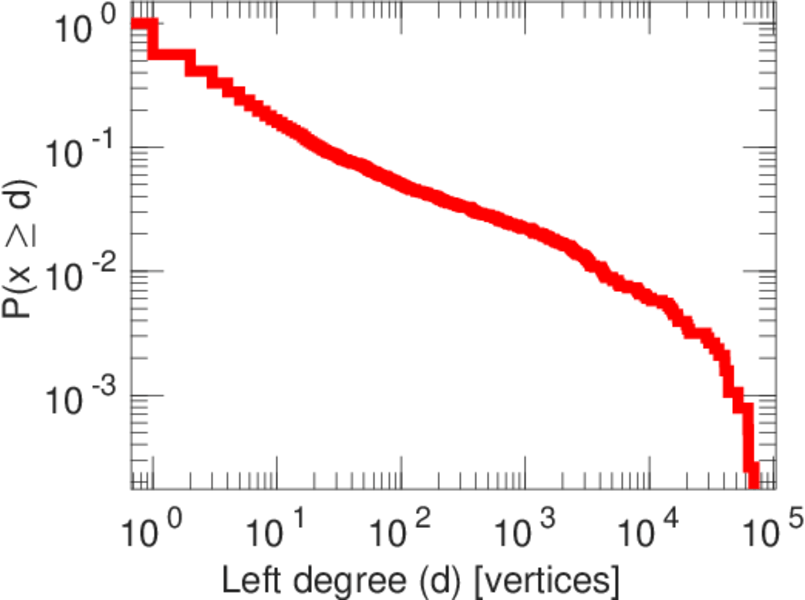
| Maximum left degree | d1max = | 69,412
|
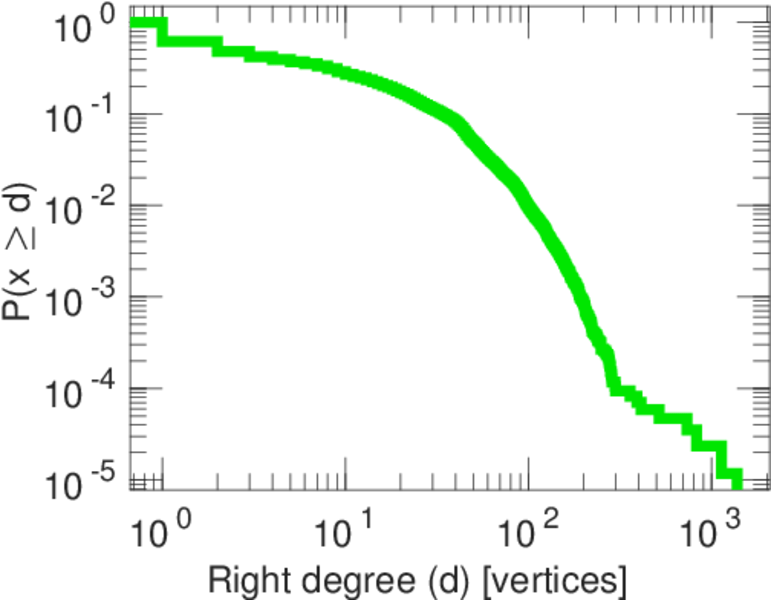
| Maximum right degree | d2max = | 1,378
|
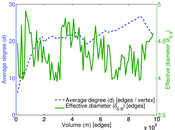
| Average degree | d = | 21.614 1
|
| Average left degree | d1 = | 256.275
|
| Average right degree | d2 = | 11.282 9
|
| Fill | p = | 0.001 477 31
|
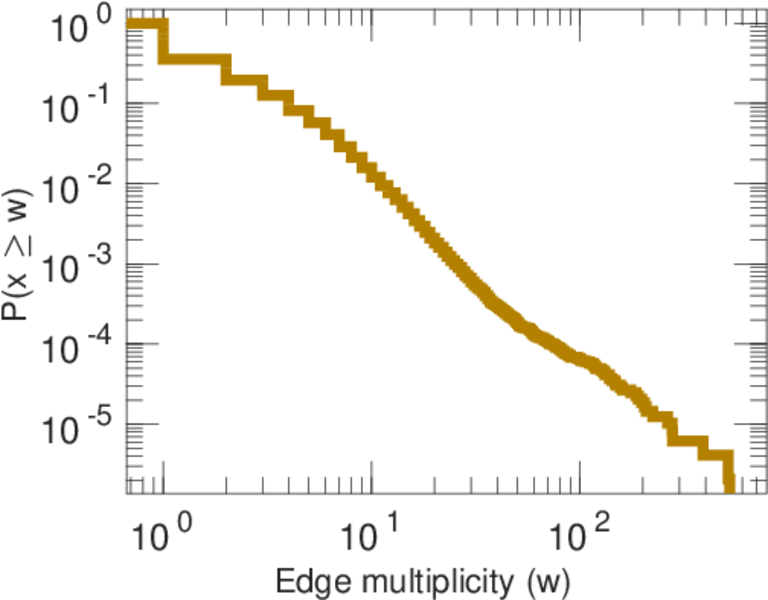
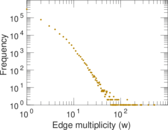
| Average edge multiplicity | m̃ = | 2.009 85
|
| Size of LCC | N = | 87,925
|
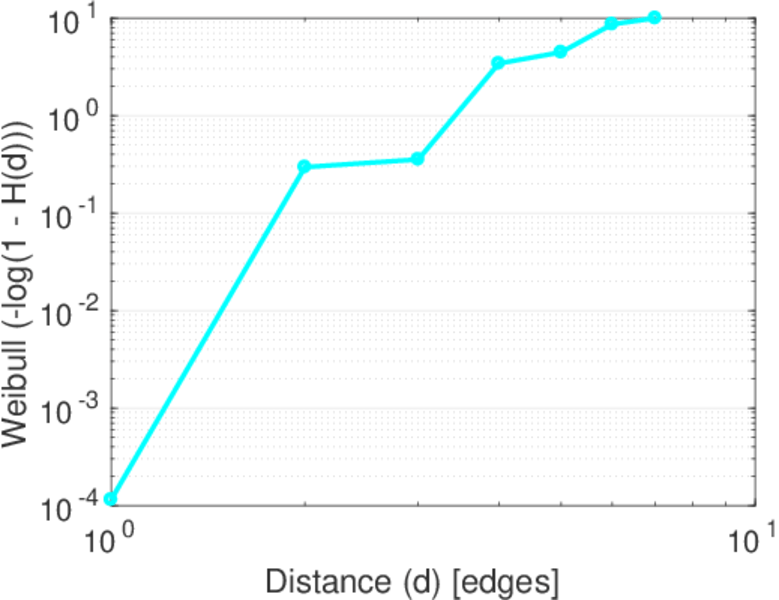
| Diameter | δ = | 10
|
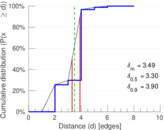
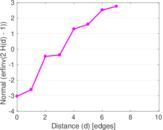
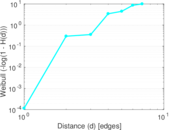
| 50-Percentile effective diameter | δ0.5 = | 3.301 74
|
| 90-Percentile effective diameter | δ0.9 = | 3.899 65
|
| Median distance | δM = | 4
|
| Mean distance | δm = | 3.490 80
|
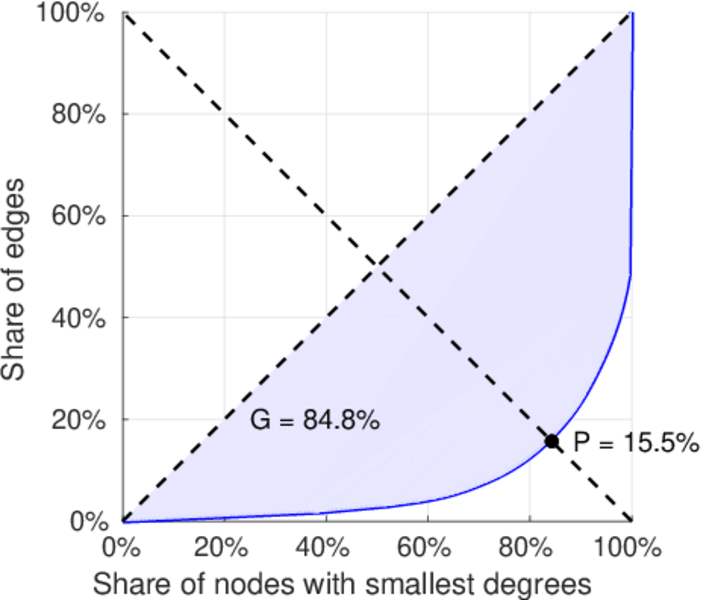
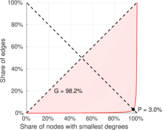
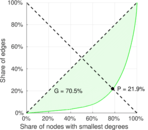
| Gini coefficient | G = | 0.848 440
|
| Balanced inequality ratio | P = | 0.156 539
|
| Left balanced inequality ratio | P1 = | 0.030 077 7
|
| Right balanced inequality ratio | P2 = | 0.218 633
|
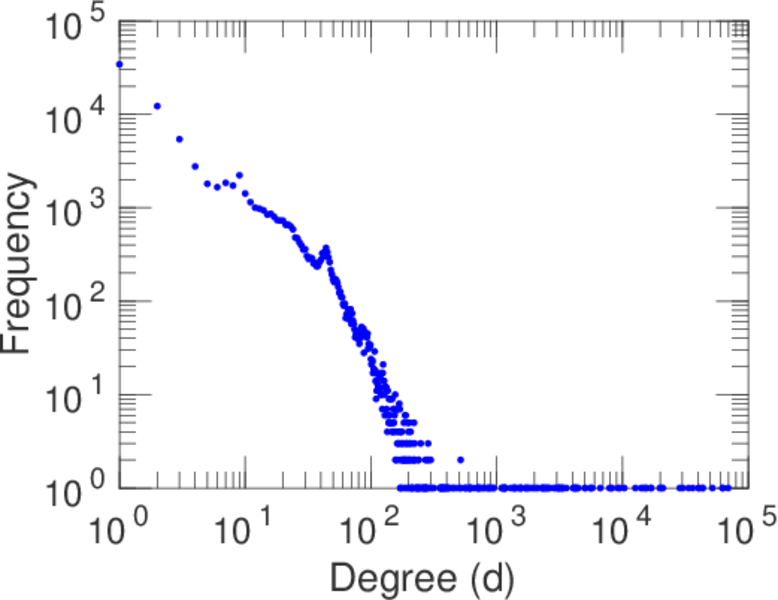
| Power law exponent | γ = | 2.041 47
|
| Tail power law exponent | γt = | 3.351 00
|
| Tail power law exponent with p | γ3 = | 3.351 00
|
| p-value | p = | 0.000 00
|
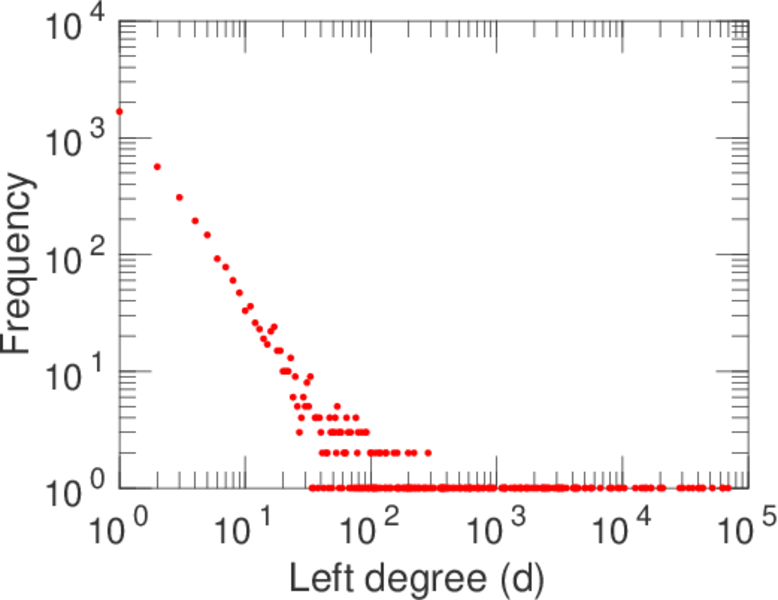
| Left tail power law exponent with p | γ3,1 = | 1.721 00
|
| Left p-value | p1 = | 0.000 00
|
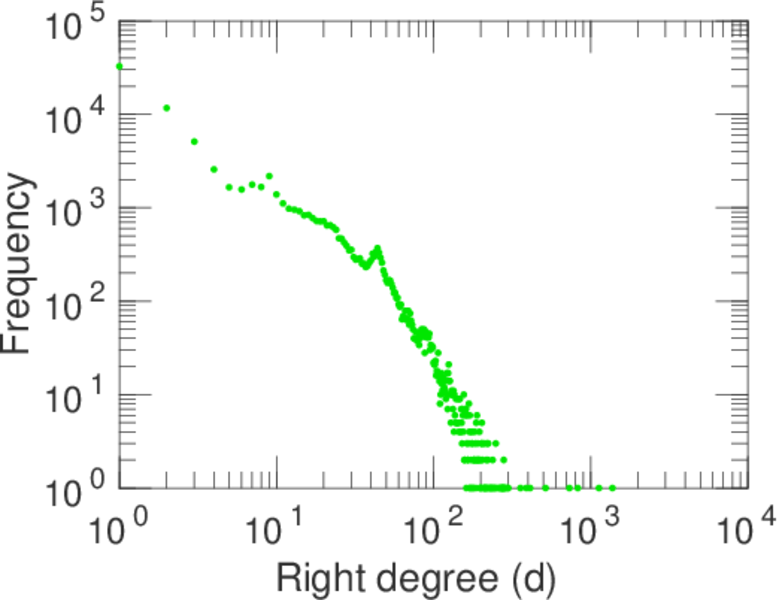
| Right tail power law exponent with p | γ3,2 = | 6.511 00
|
| Right p-value | p2 = | 0.004 000 00
|
| Degree assortativity | ρ = | −0.239 030
|
| Degree assortativity p-value | pρ = | 0.000 00
|
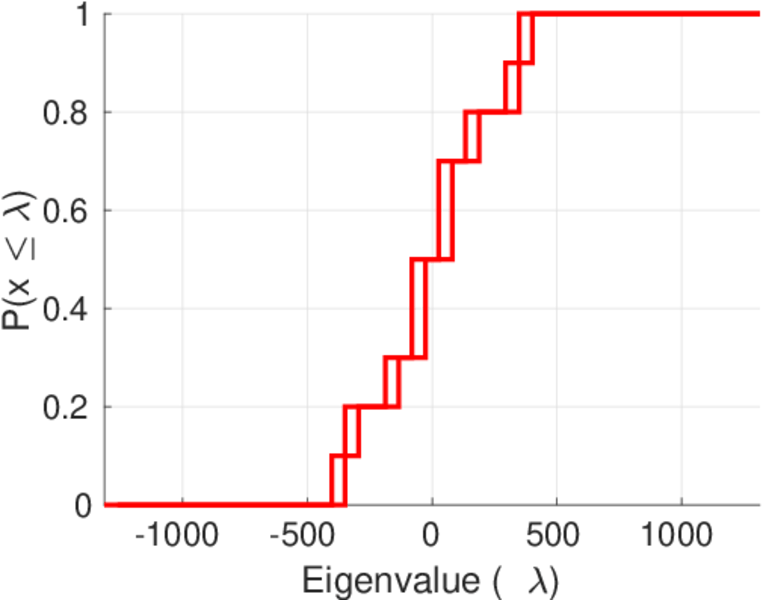
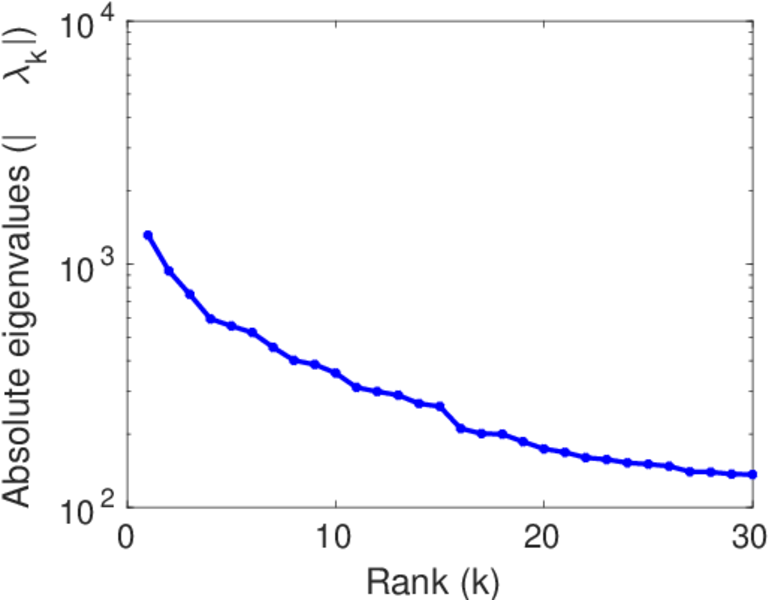
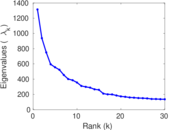
| Spectral norm | α = | 1,314.65
|
| Algebraic connectivity | a = | 0.055 978 8
|
| Spectral separation | |λ1[A] / λ2[A]| = | 1.401 70
|
| Controllability | C = | 82,029
|
| Relative controllability | Cr = | 0.920 247
|
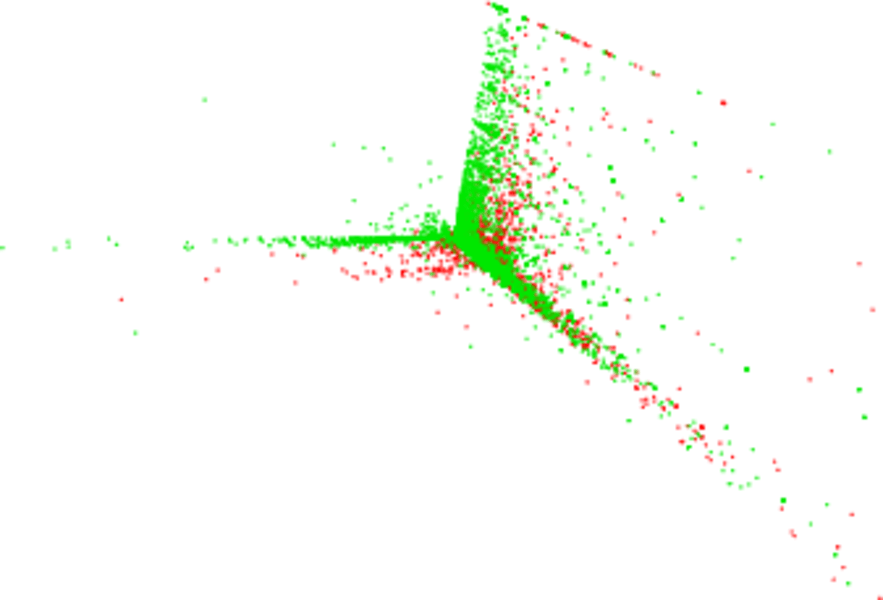
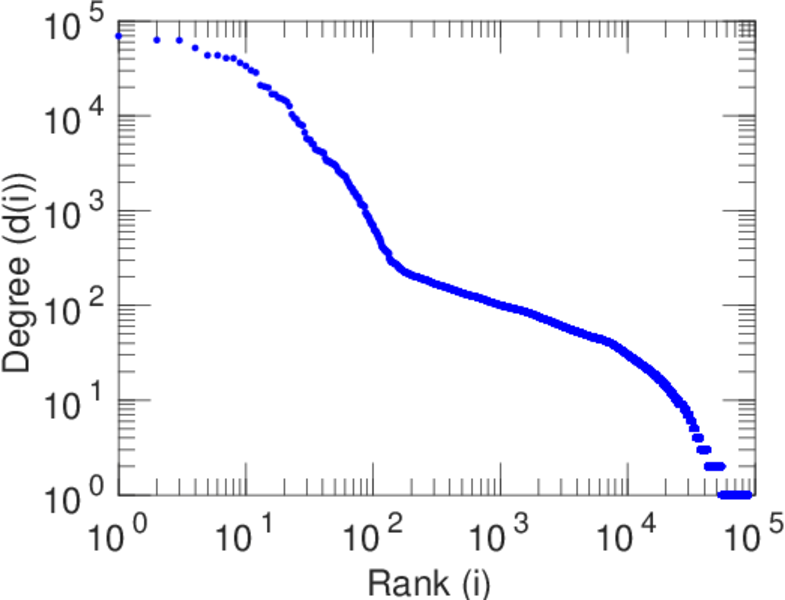
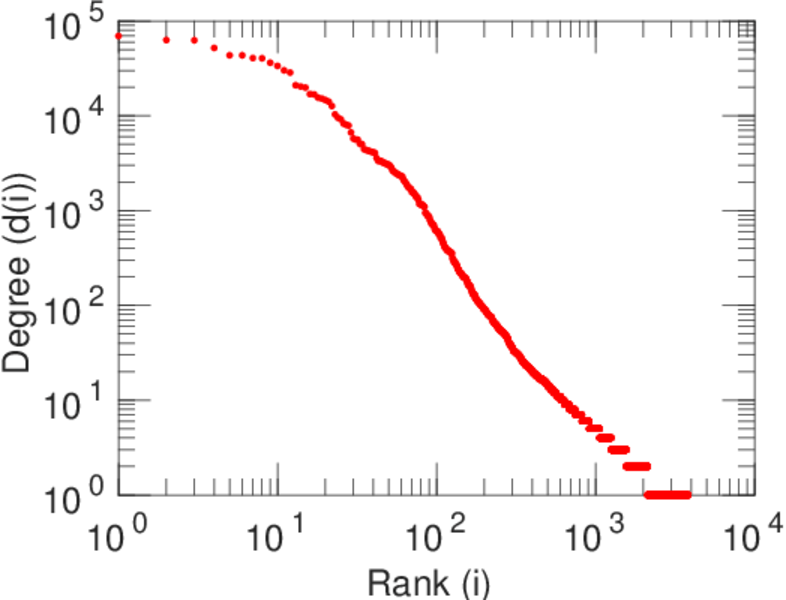
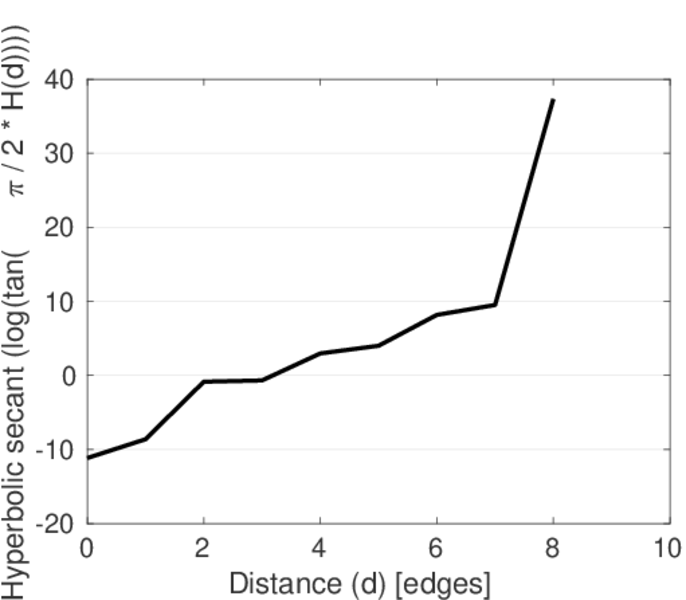
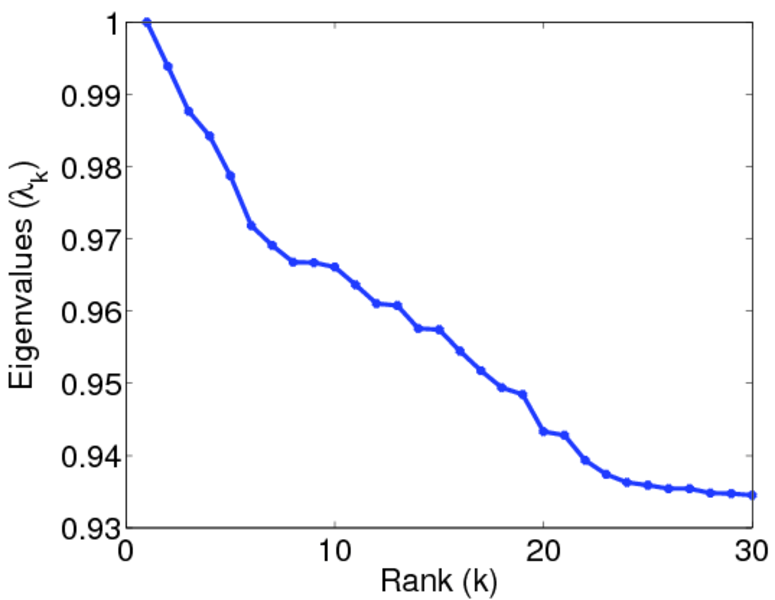
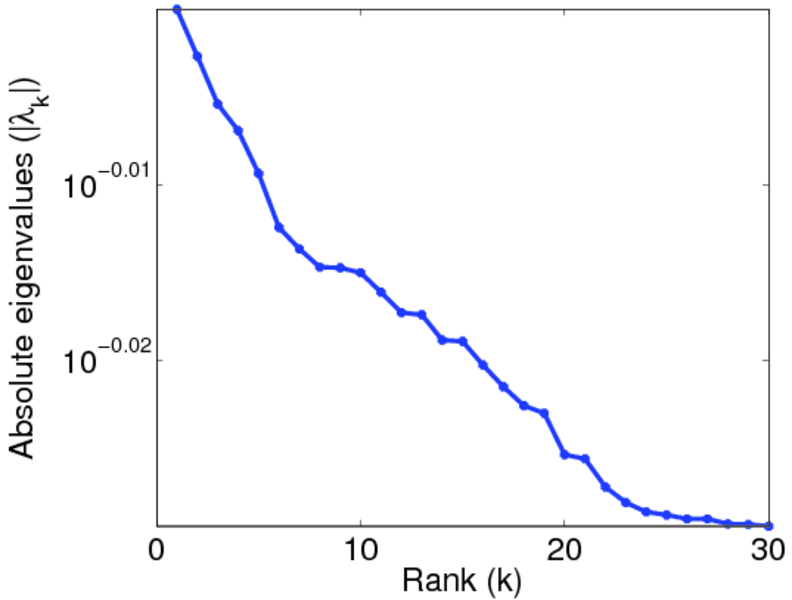
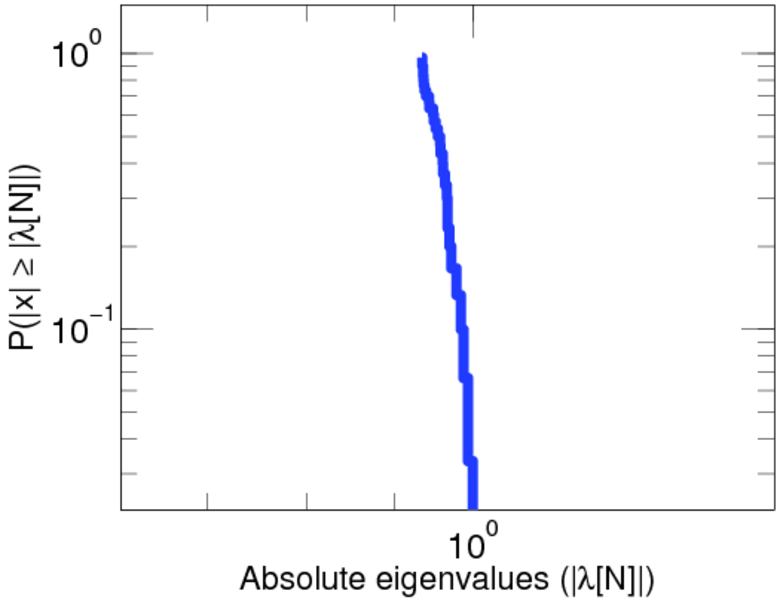
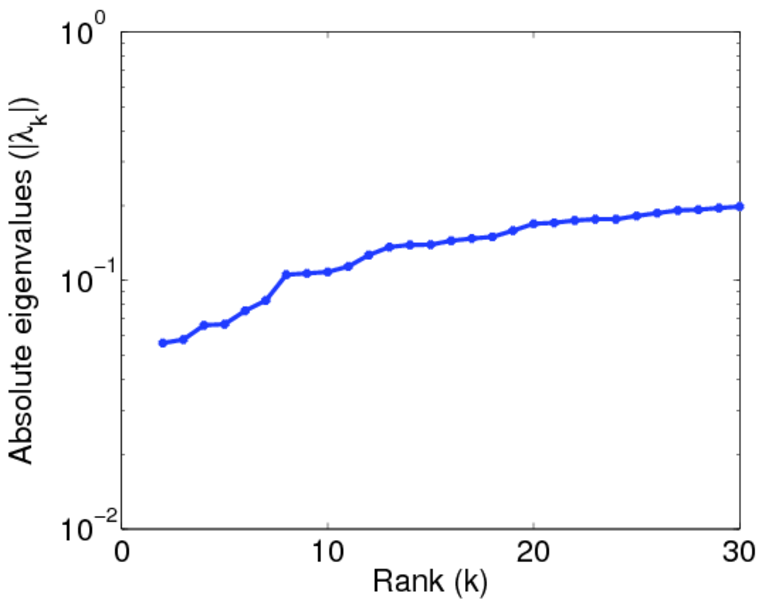
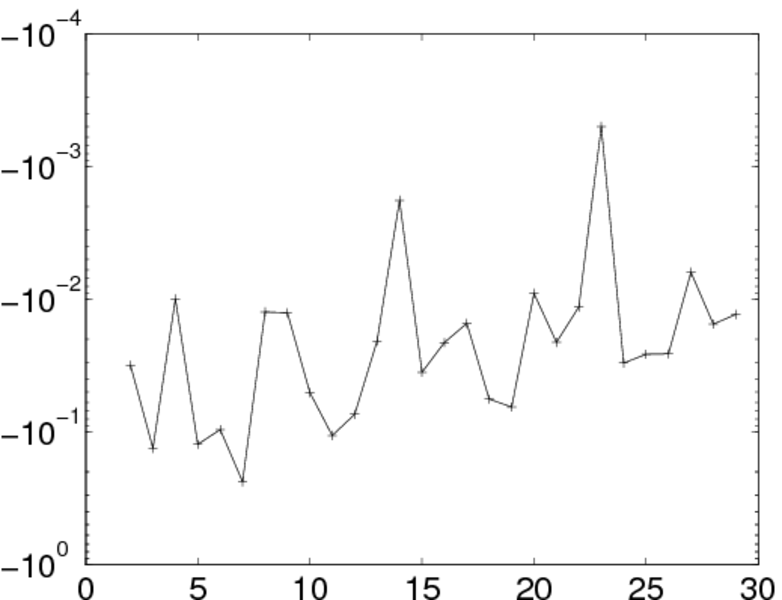
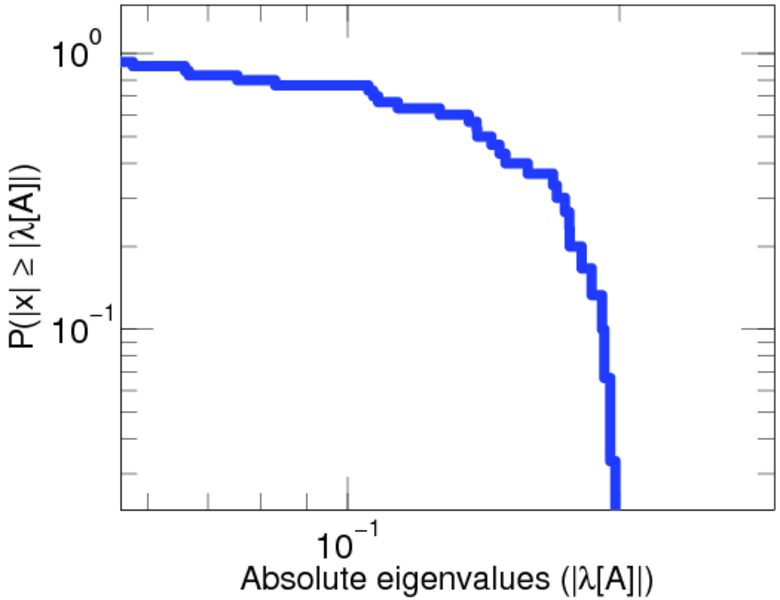
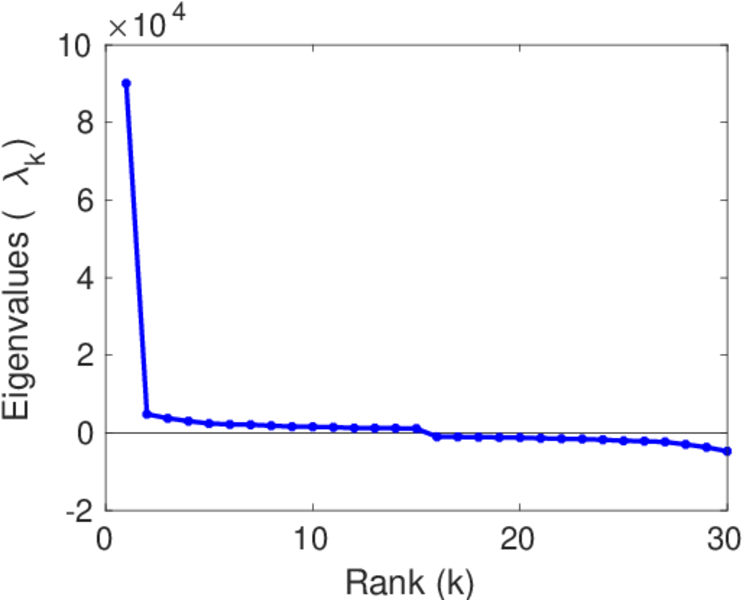
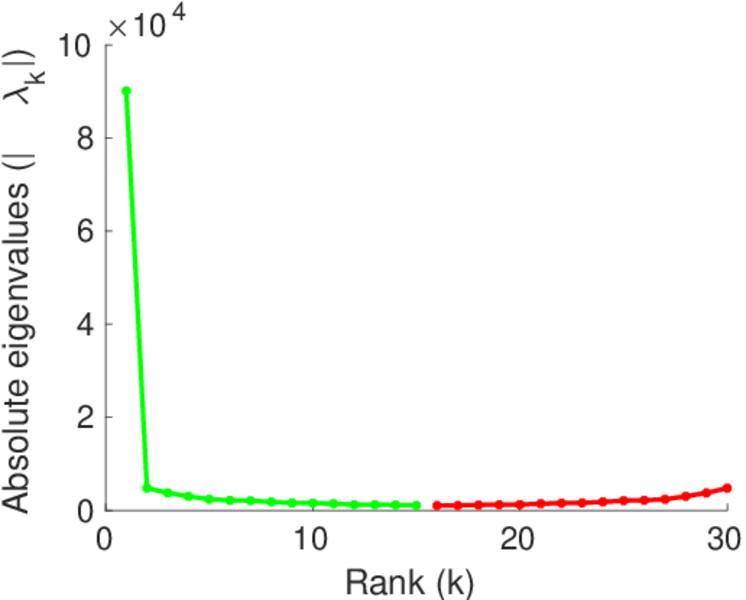
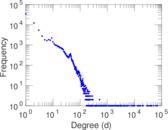
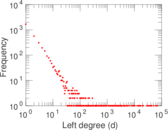
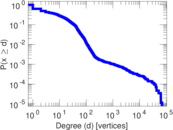
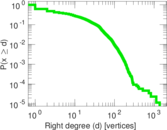
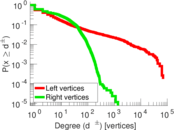
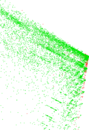
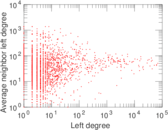
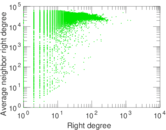
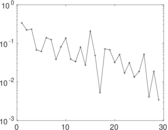
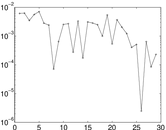
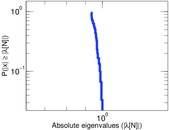
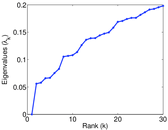
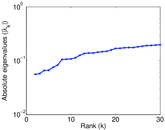
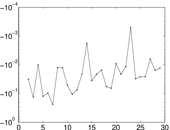
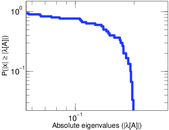
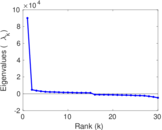
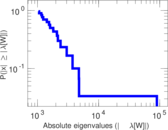
Plots


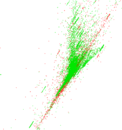


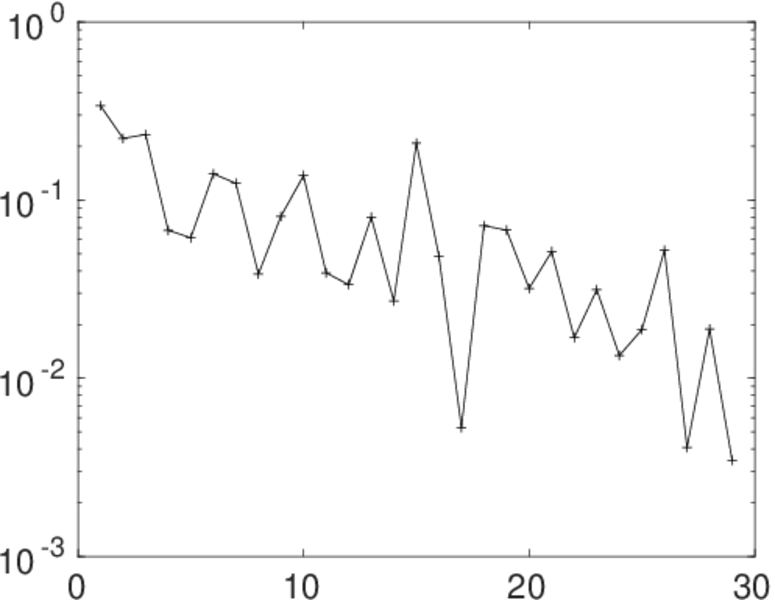
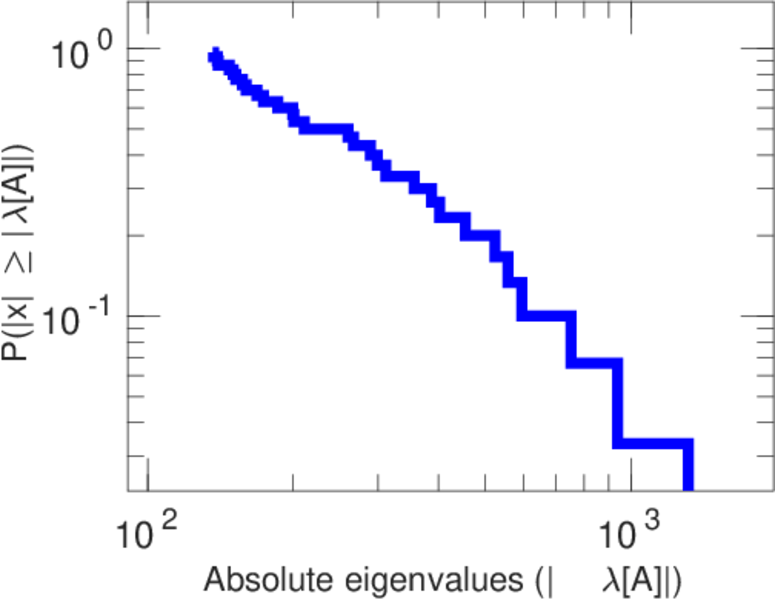
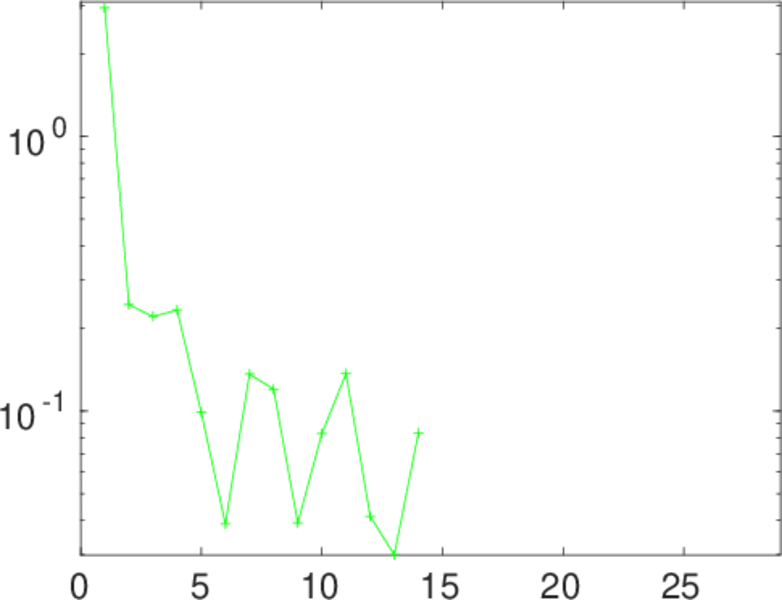
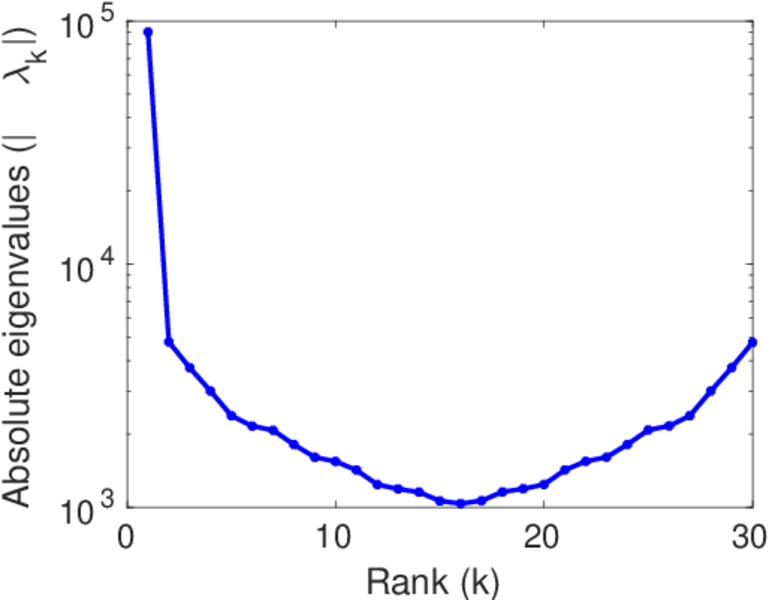
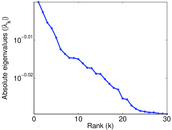
Matrix decompositions plots


Downloads
References
|
[1]
|
Jérôme Kunegis.
KONECT – The Koblenz Network Collection.
In Proc. Int. Conf. on World Wide Web Companion, pages
1343–1350, 2013.
[ http ]
|
|
[2]
|
Wikimedia Foundation.
Wikimedia downloads.
http://dumps.wikimedia.org/, January 2010.
|
 KONECT ‣ Networks ‣
Buy Me a Coffee
KONECT ‣ Networks ‣
Buy Me a Coffee