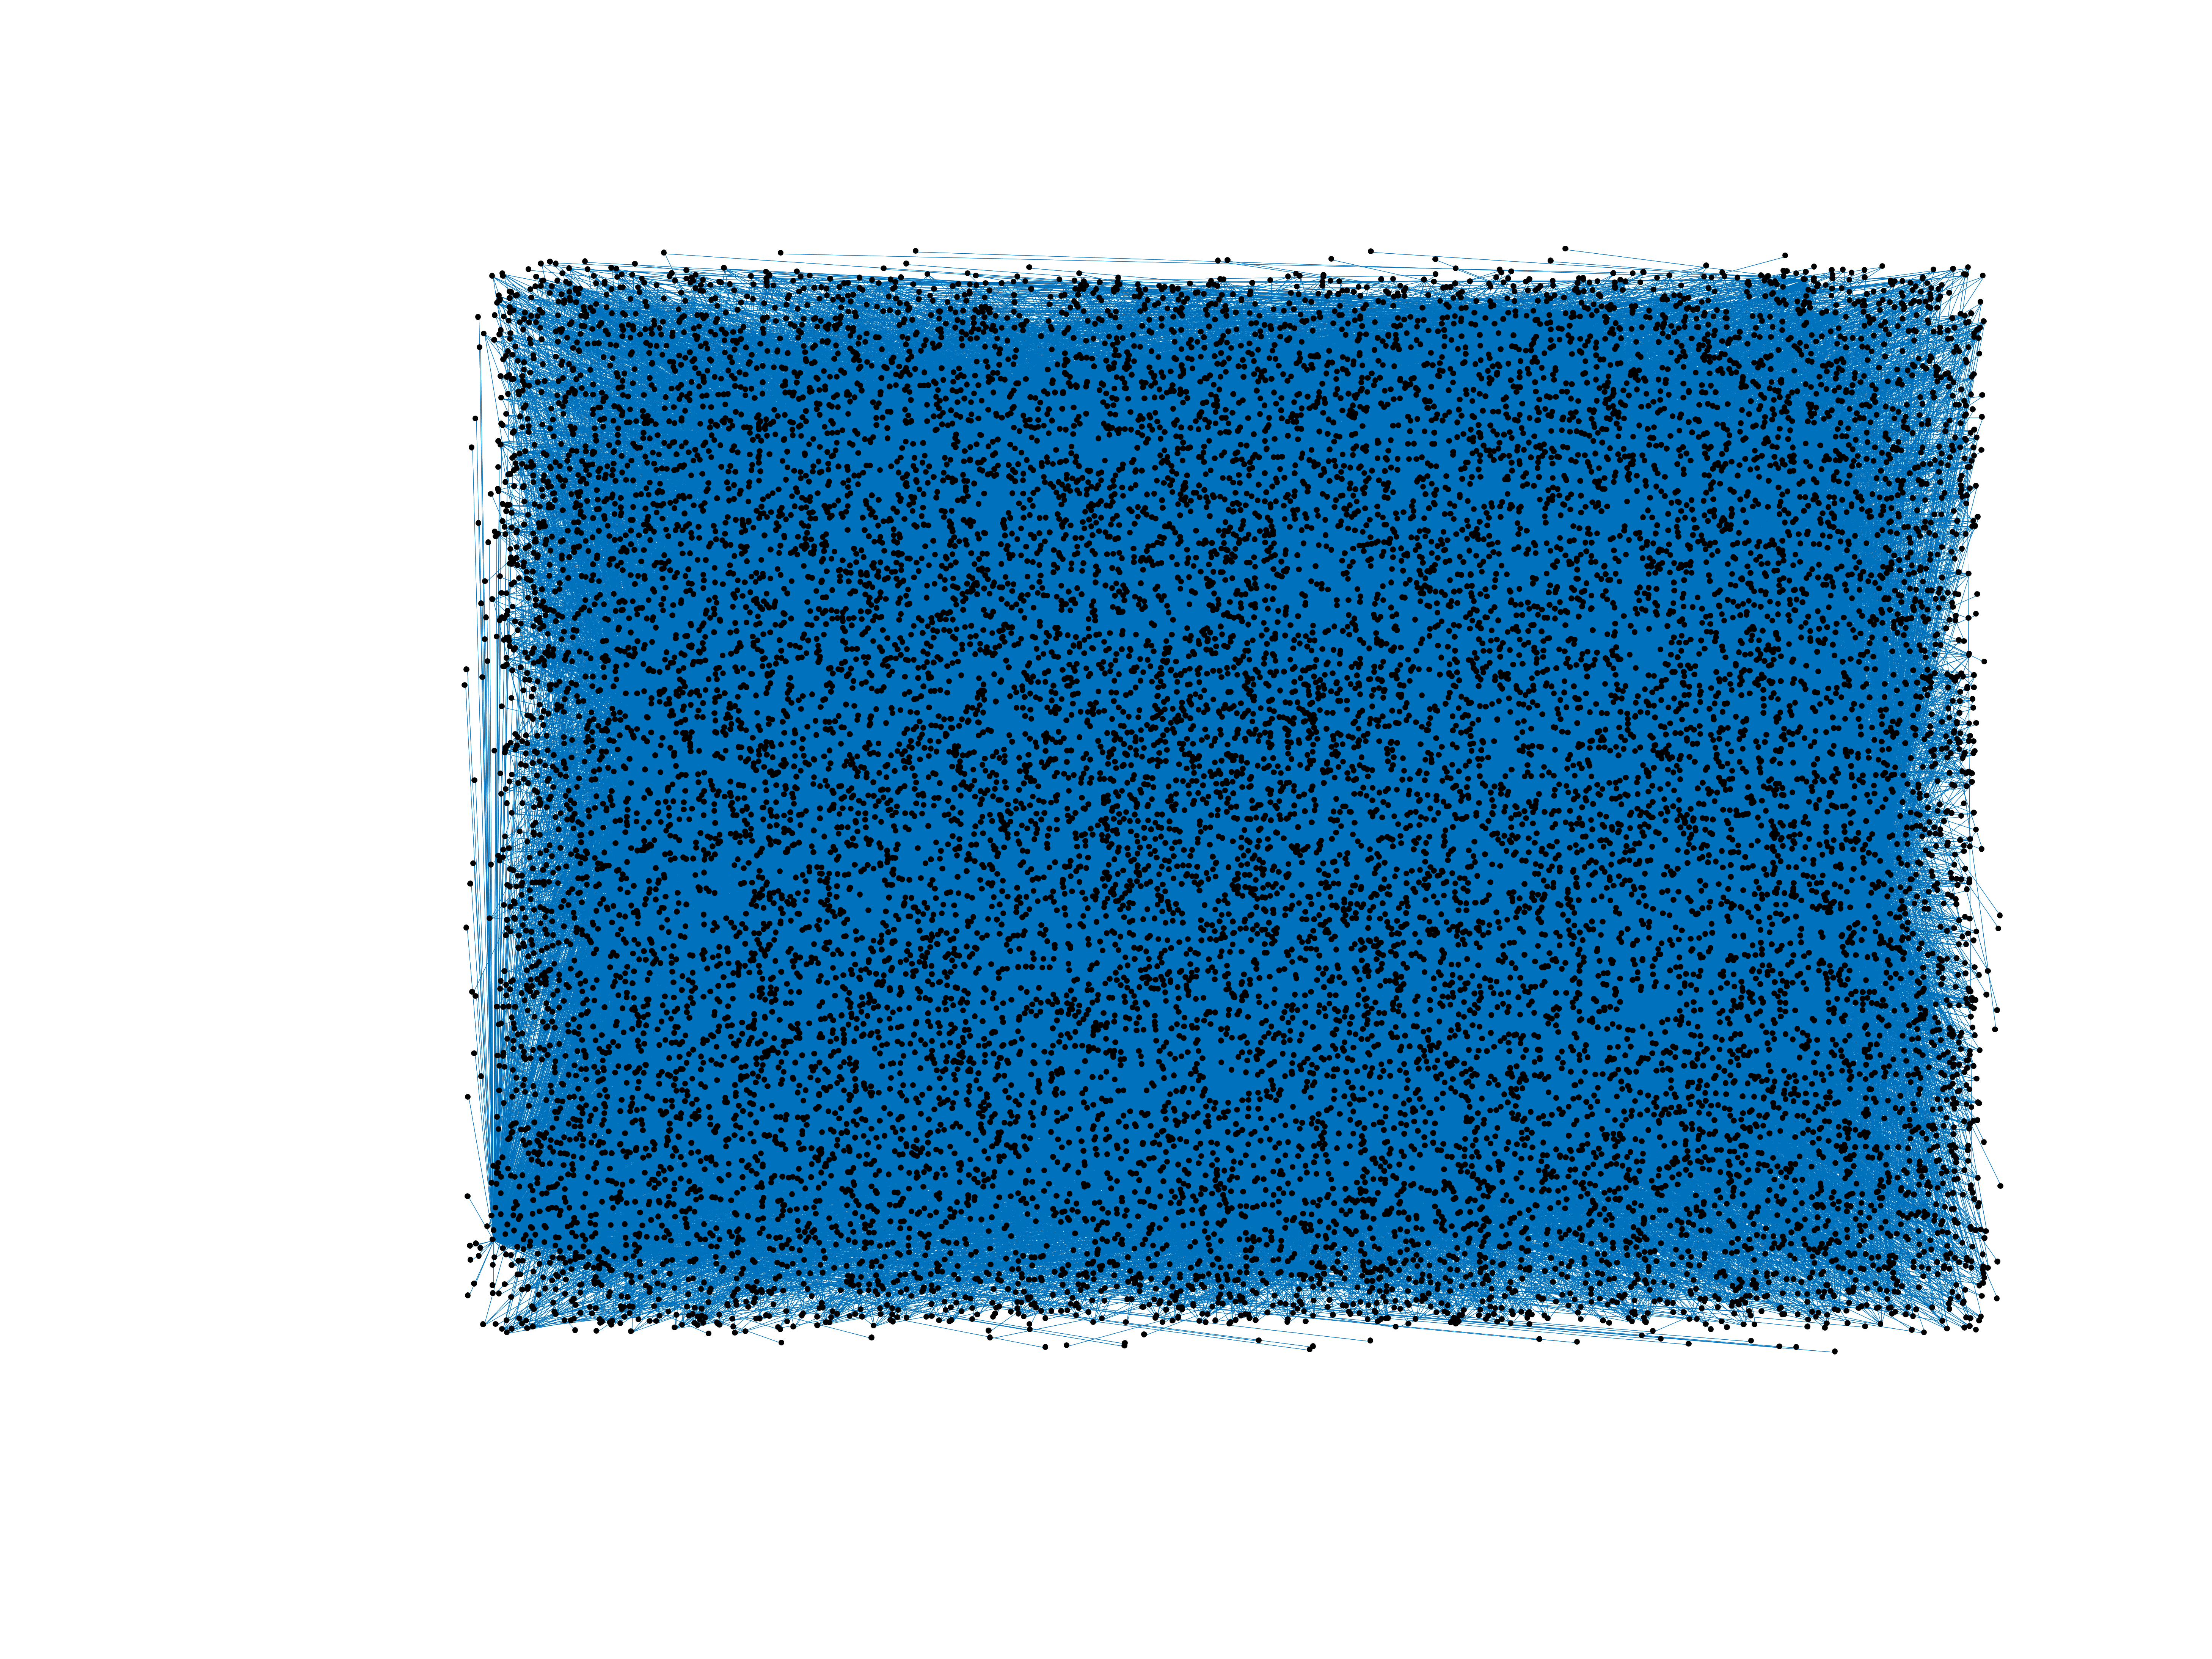
Wiktionary edits (sw)
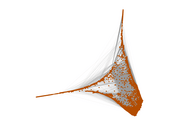
This is the bipartite edit network of the Swahili Wiktionary. It contains users
and pages from the Swahili Wiktionary, connected by edit events. Each edge
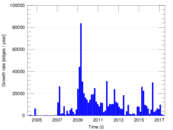
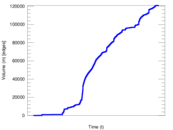
represents an edit. The dataset includes the timestamp of each edit.
Metadata
Statistics
| Size | n = | 16,439
|
| Left size | n1 = | 325
|
| Right size | n2 = | 16,114
|
| Volume | m = | 120,851
|
| Unique edge count | m̿ = | 63,698
|
| Wedge count | s = | 160,663,303
|
| Claw count | z = | 359,069,142,530
|
| Cross count | x = | 670,606,627,188,456
|
| Square count | q = | 179,007,096
|
| 4-Tour count | T4 = | 2,074,841,360
|
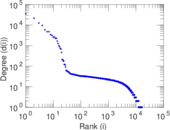
| Maximum degree | dmax = | 35,449
|
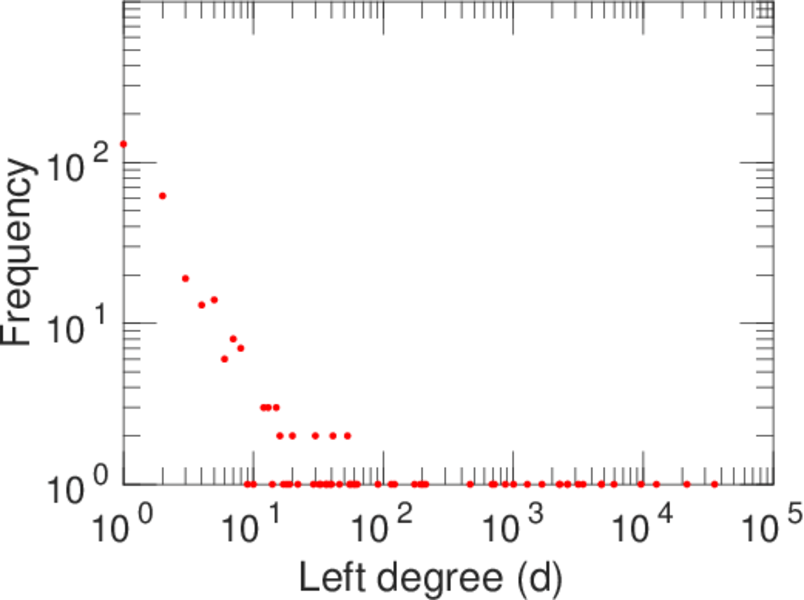
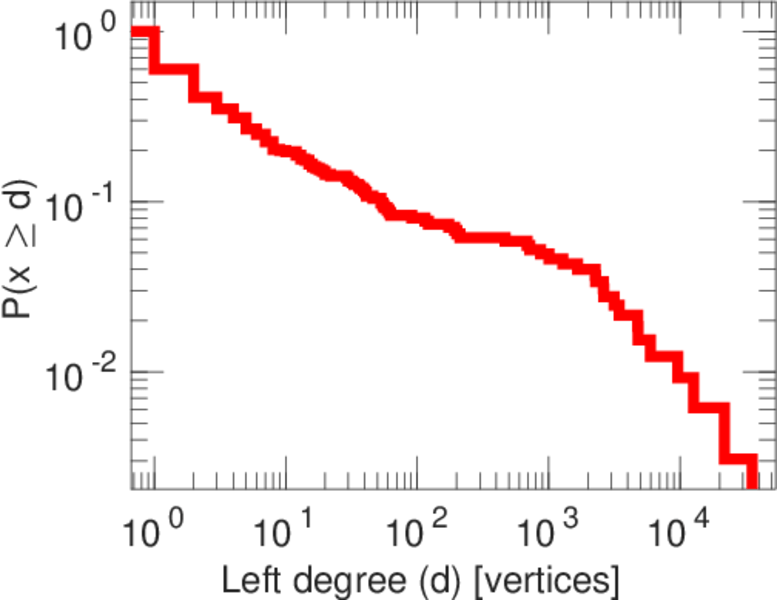
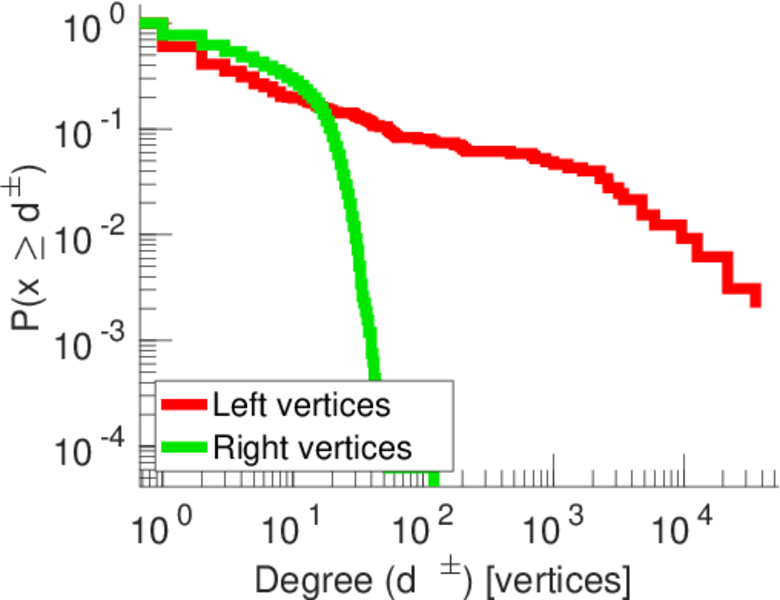
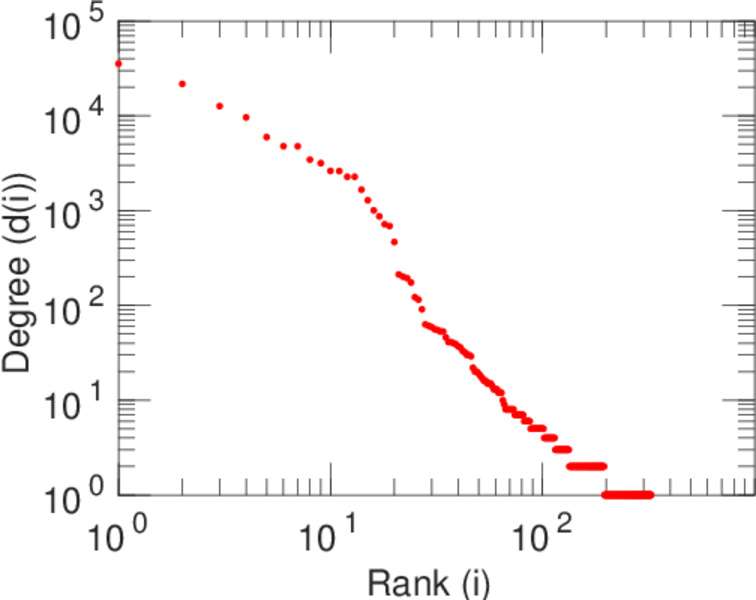
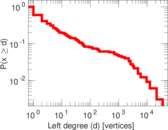
| Maximum left degree | d1max = | 35,449
|
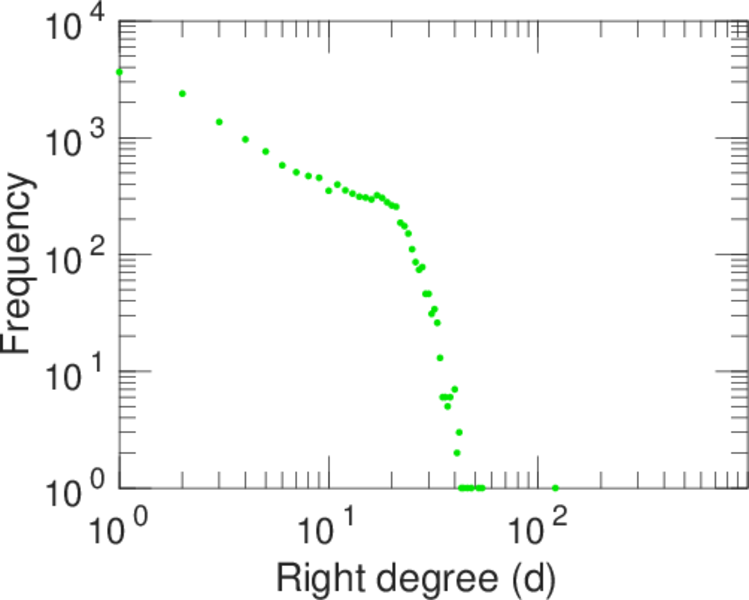
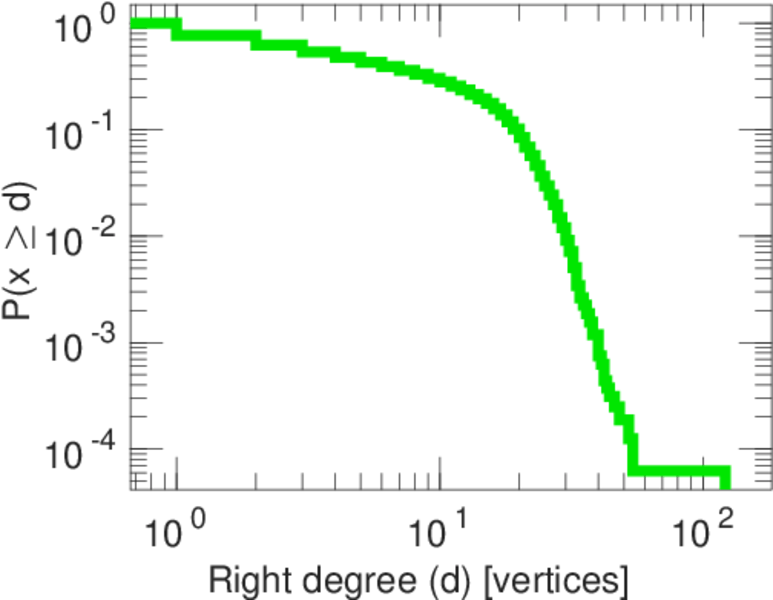
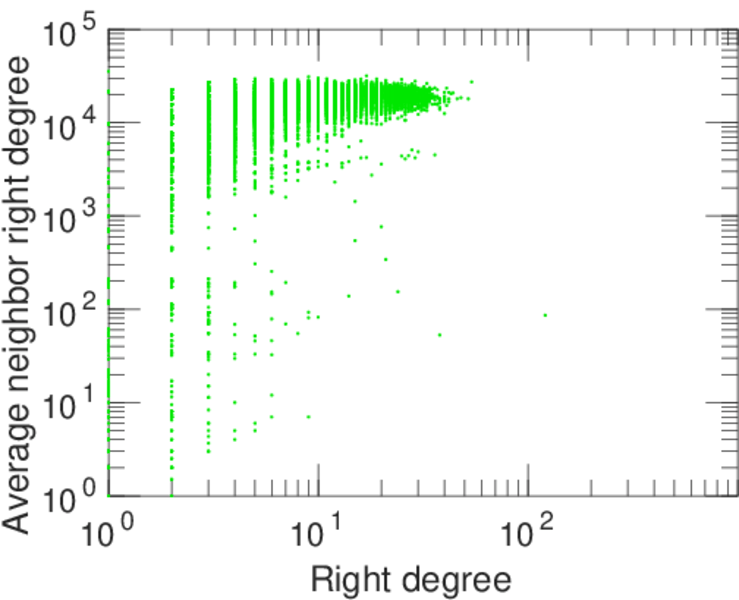
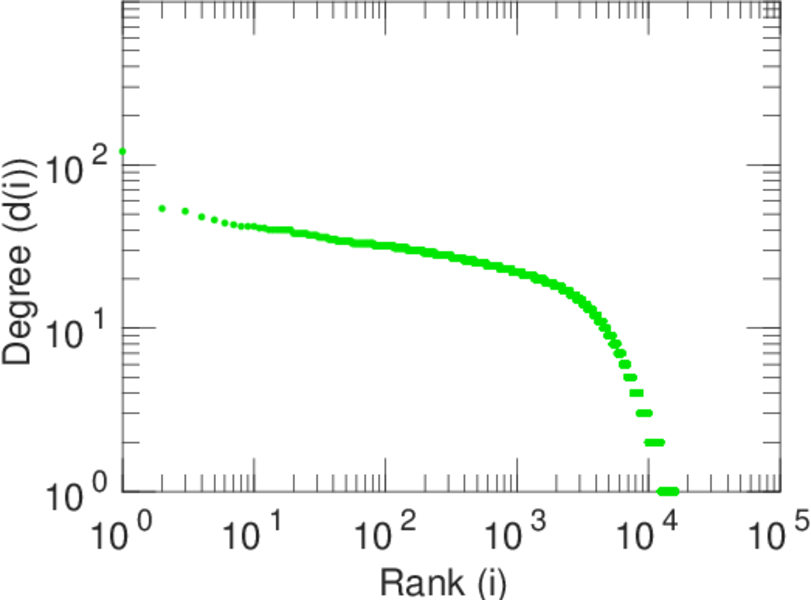
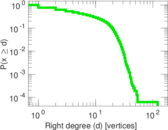
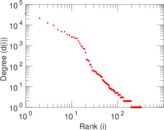
| Maximum right degree | d2max = | 121
|
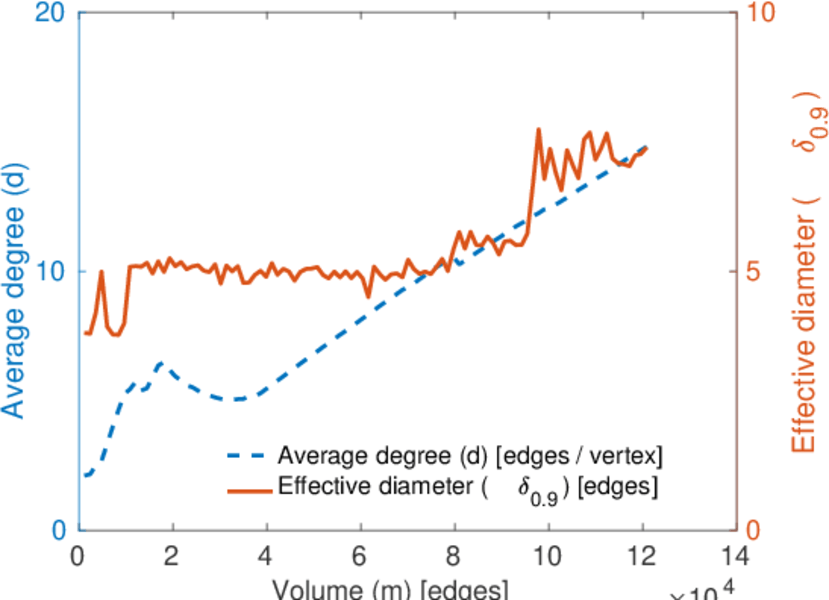
| Average degree | d = | 14.703 0
|
| Average left degree | d1 = | 371.849
|
| Average right degree | d2 = | 7.499 75
|
| Fill | p = | 0.012 163 0
|
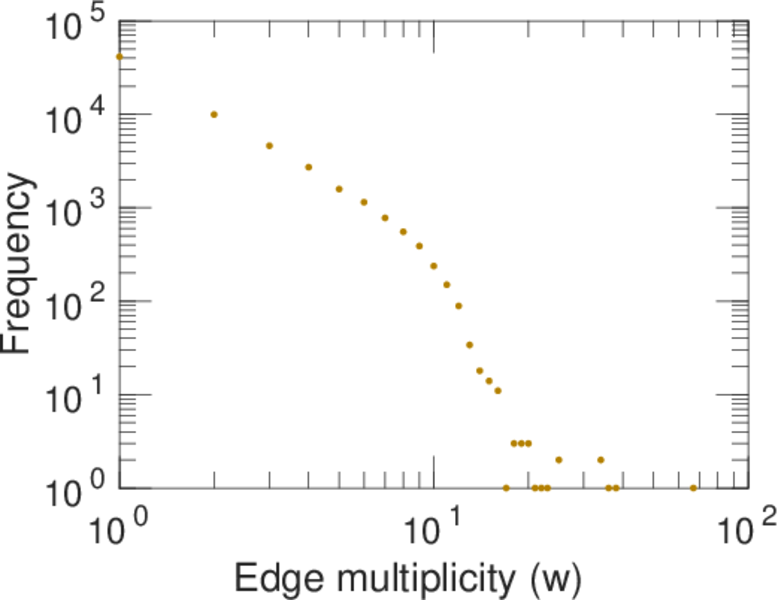
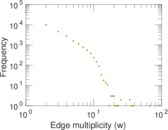
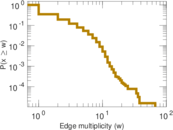
| Average edge multiplicity | m̃ = | 1.897 25
|
| Size of LCC | N = | 16,074
|
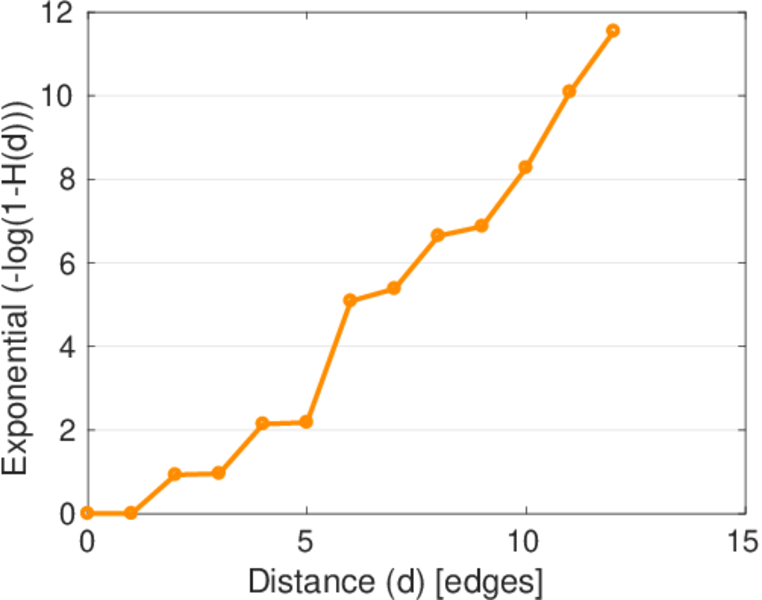
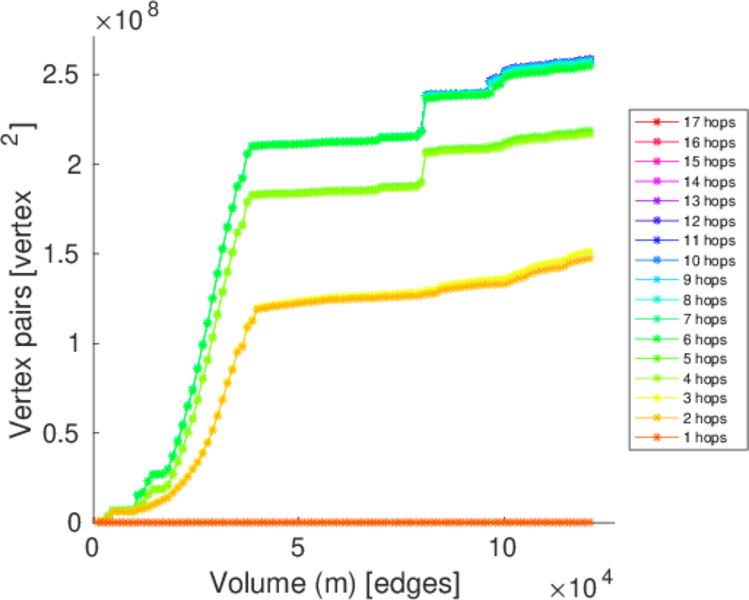
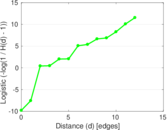
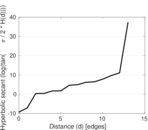
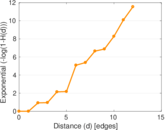
| Diameter | δ = | 15
|
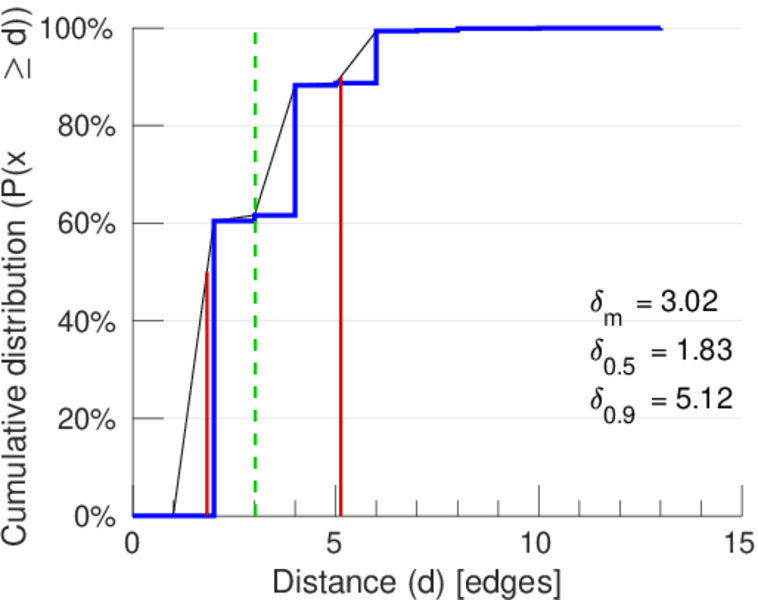
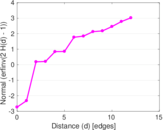
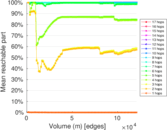
| 50-Percentile effective diameter | δ0.5 = | 1.827 28
|
| 90-Percentile effective diameter | δ0.9 = | 5.122 39
|
| Median distance | δM = | 2
|
| Mean distance | δm = | 3.022 78
|
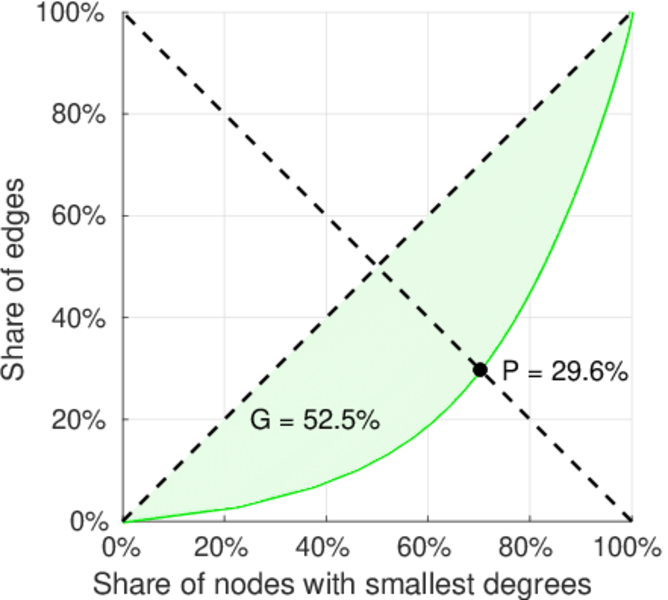
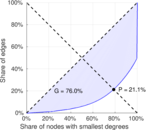
| Gini coefficient | G = | 0.756 081
|
| Balanced inequality ratio | P = | 0.214 156
|
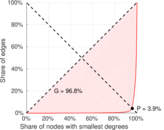
| Left balanced inequality ratio | P1 = | 0.038 841 2
|
| Right balanced inequality ratio | P2 = | 0.295 935
|
| Relative edge distribution entropy | Her = | 0.707 033
|
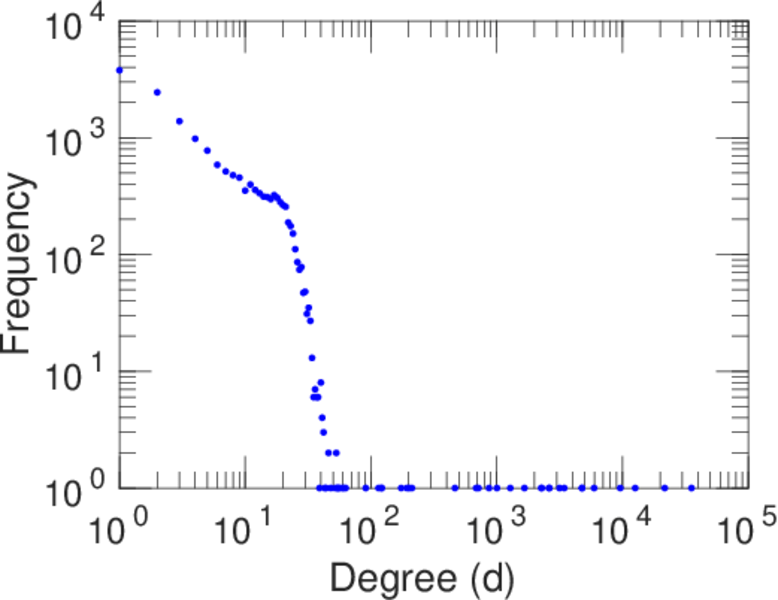
| Power law exponent | γ = | 1.899 29
|
| Tail power law exponent | γt = | 4.731 00
|
| Tail power law exponent with p | γ3 = | 4.731 00
|
| p-value | p = | 0.000 00
|
| Left tail power law exponent with p | γ3,1 = | 1.571 00
|
| Left p-value | p1 = | 0.000 00
|
| Right tail power law exponent with p | γ3,2 = | 8.851 00
|
| Right p-value | p2 = | 0.000 00
|
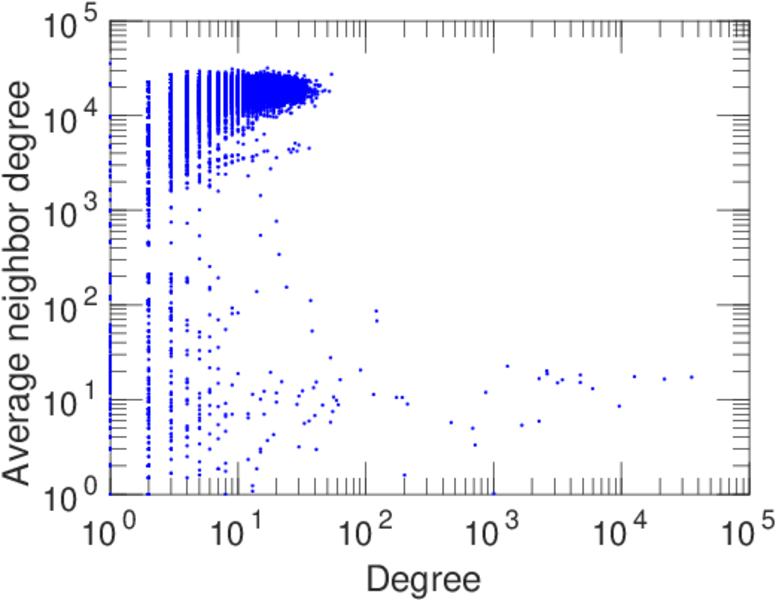
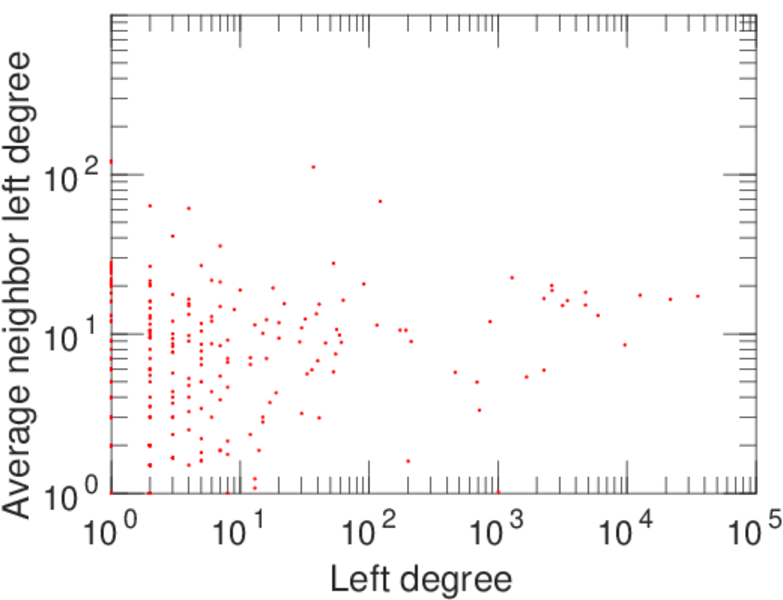
| Degree assortativity | ρ = | −0.067 524 2
|
| Degree assortativity p-value | pρ = | 2.885 32 × 10−65
|
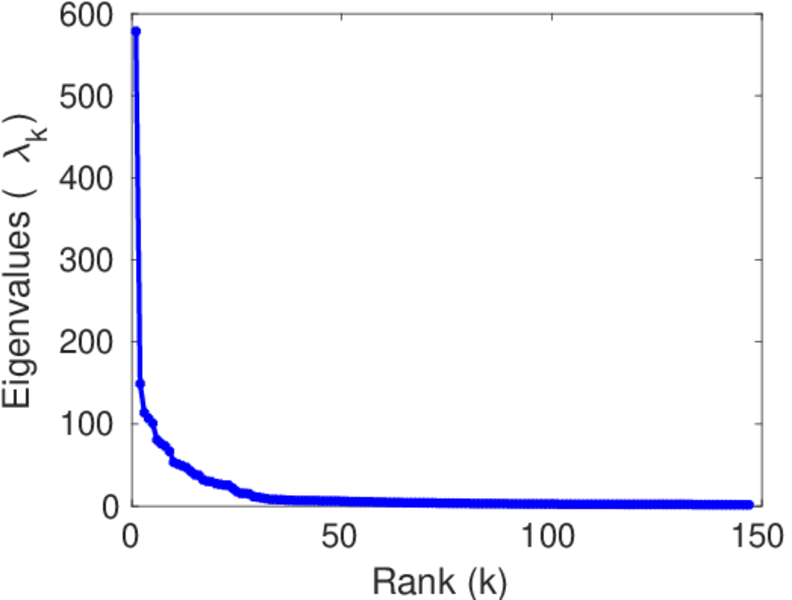
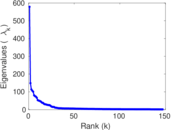
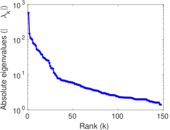
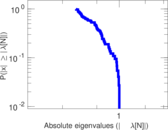
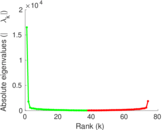
| Spectral norm | α = | 578.690
|
| Algebraic connectivity | a = | 0.000 705 372
|
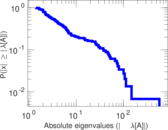
| Spectral separation | |λ1[A] / λ2[A]| = | 3.882 26
|
| Controllability | C = | 15,706
|
| Relative controllability | Cr = | 0.961 788
|
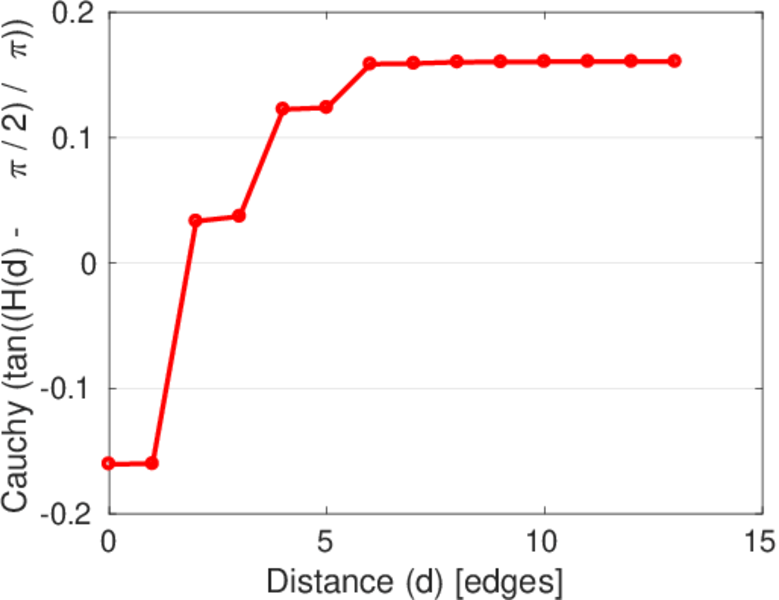
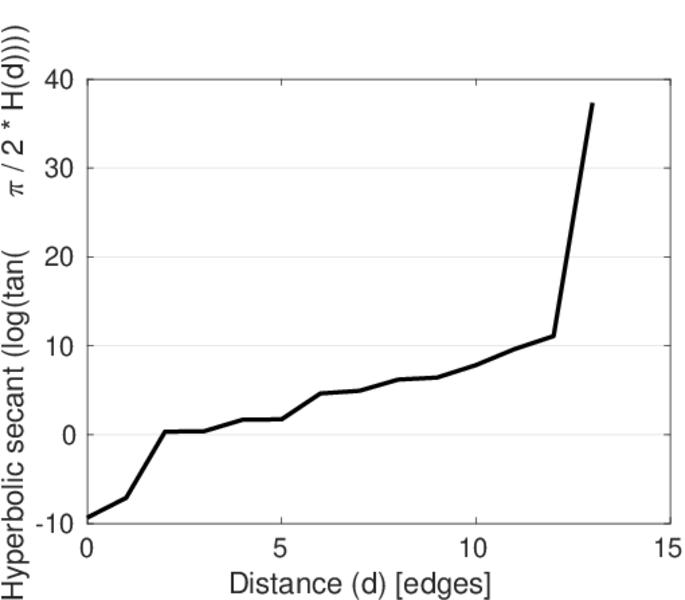
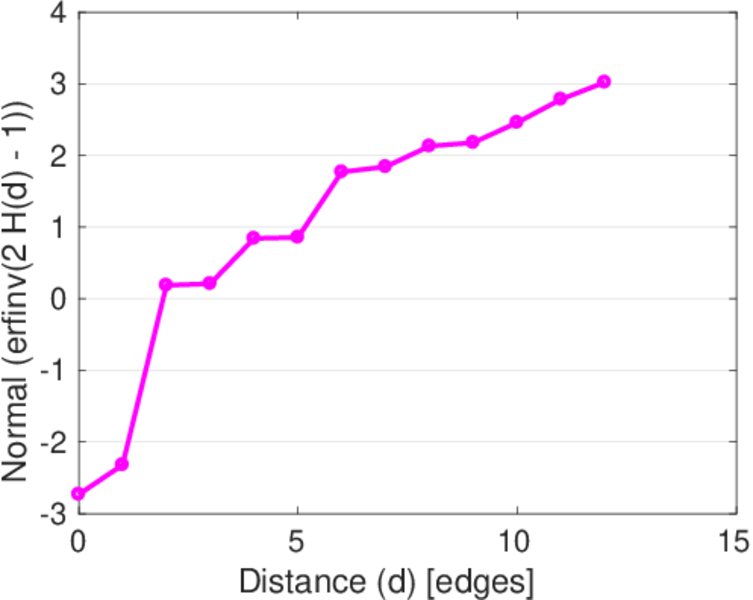
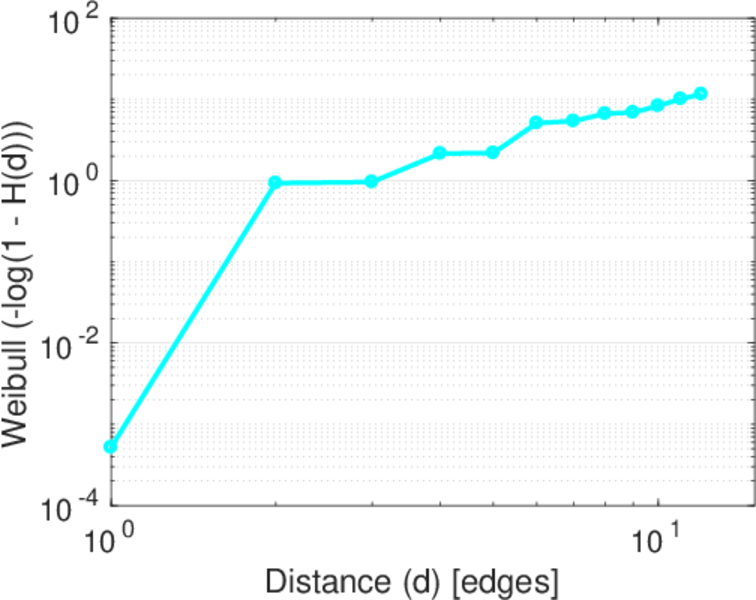
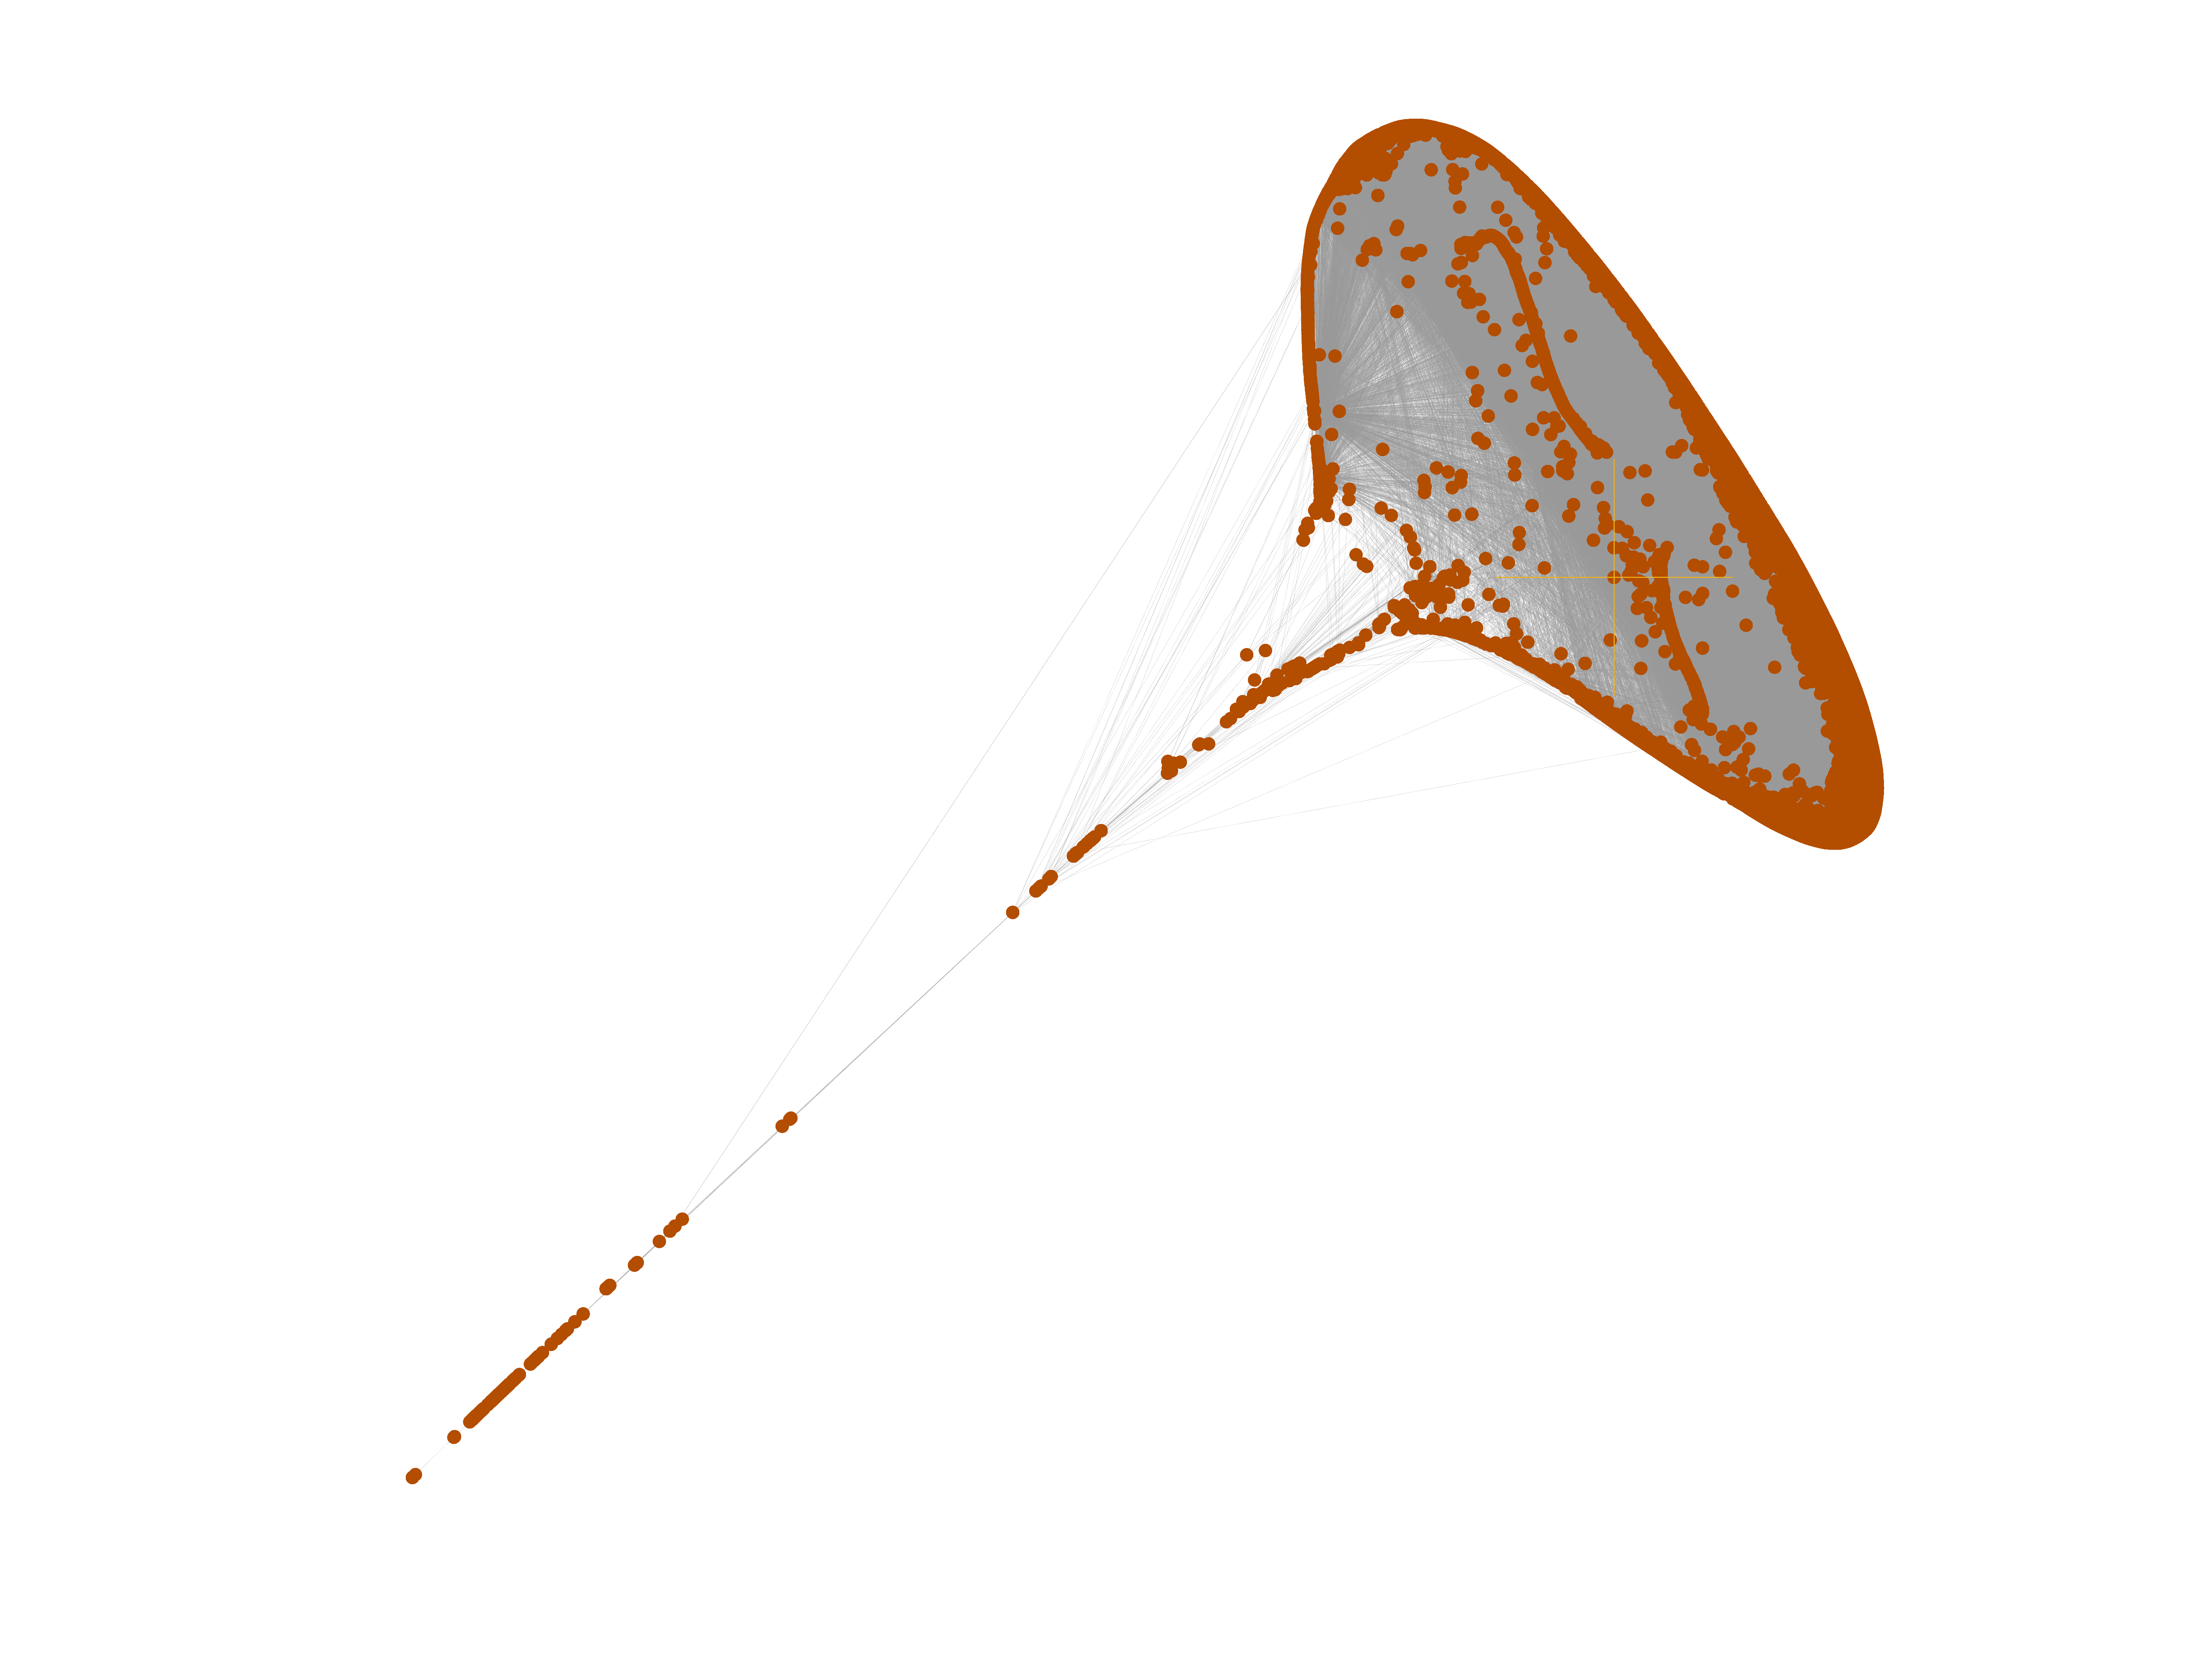
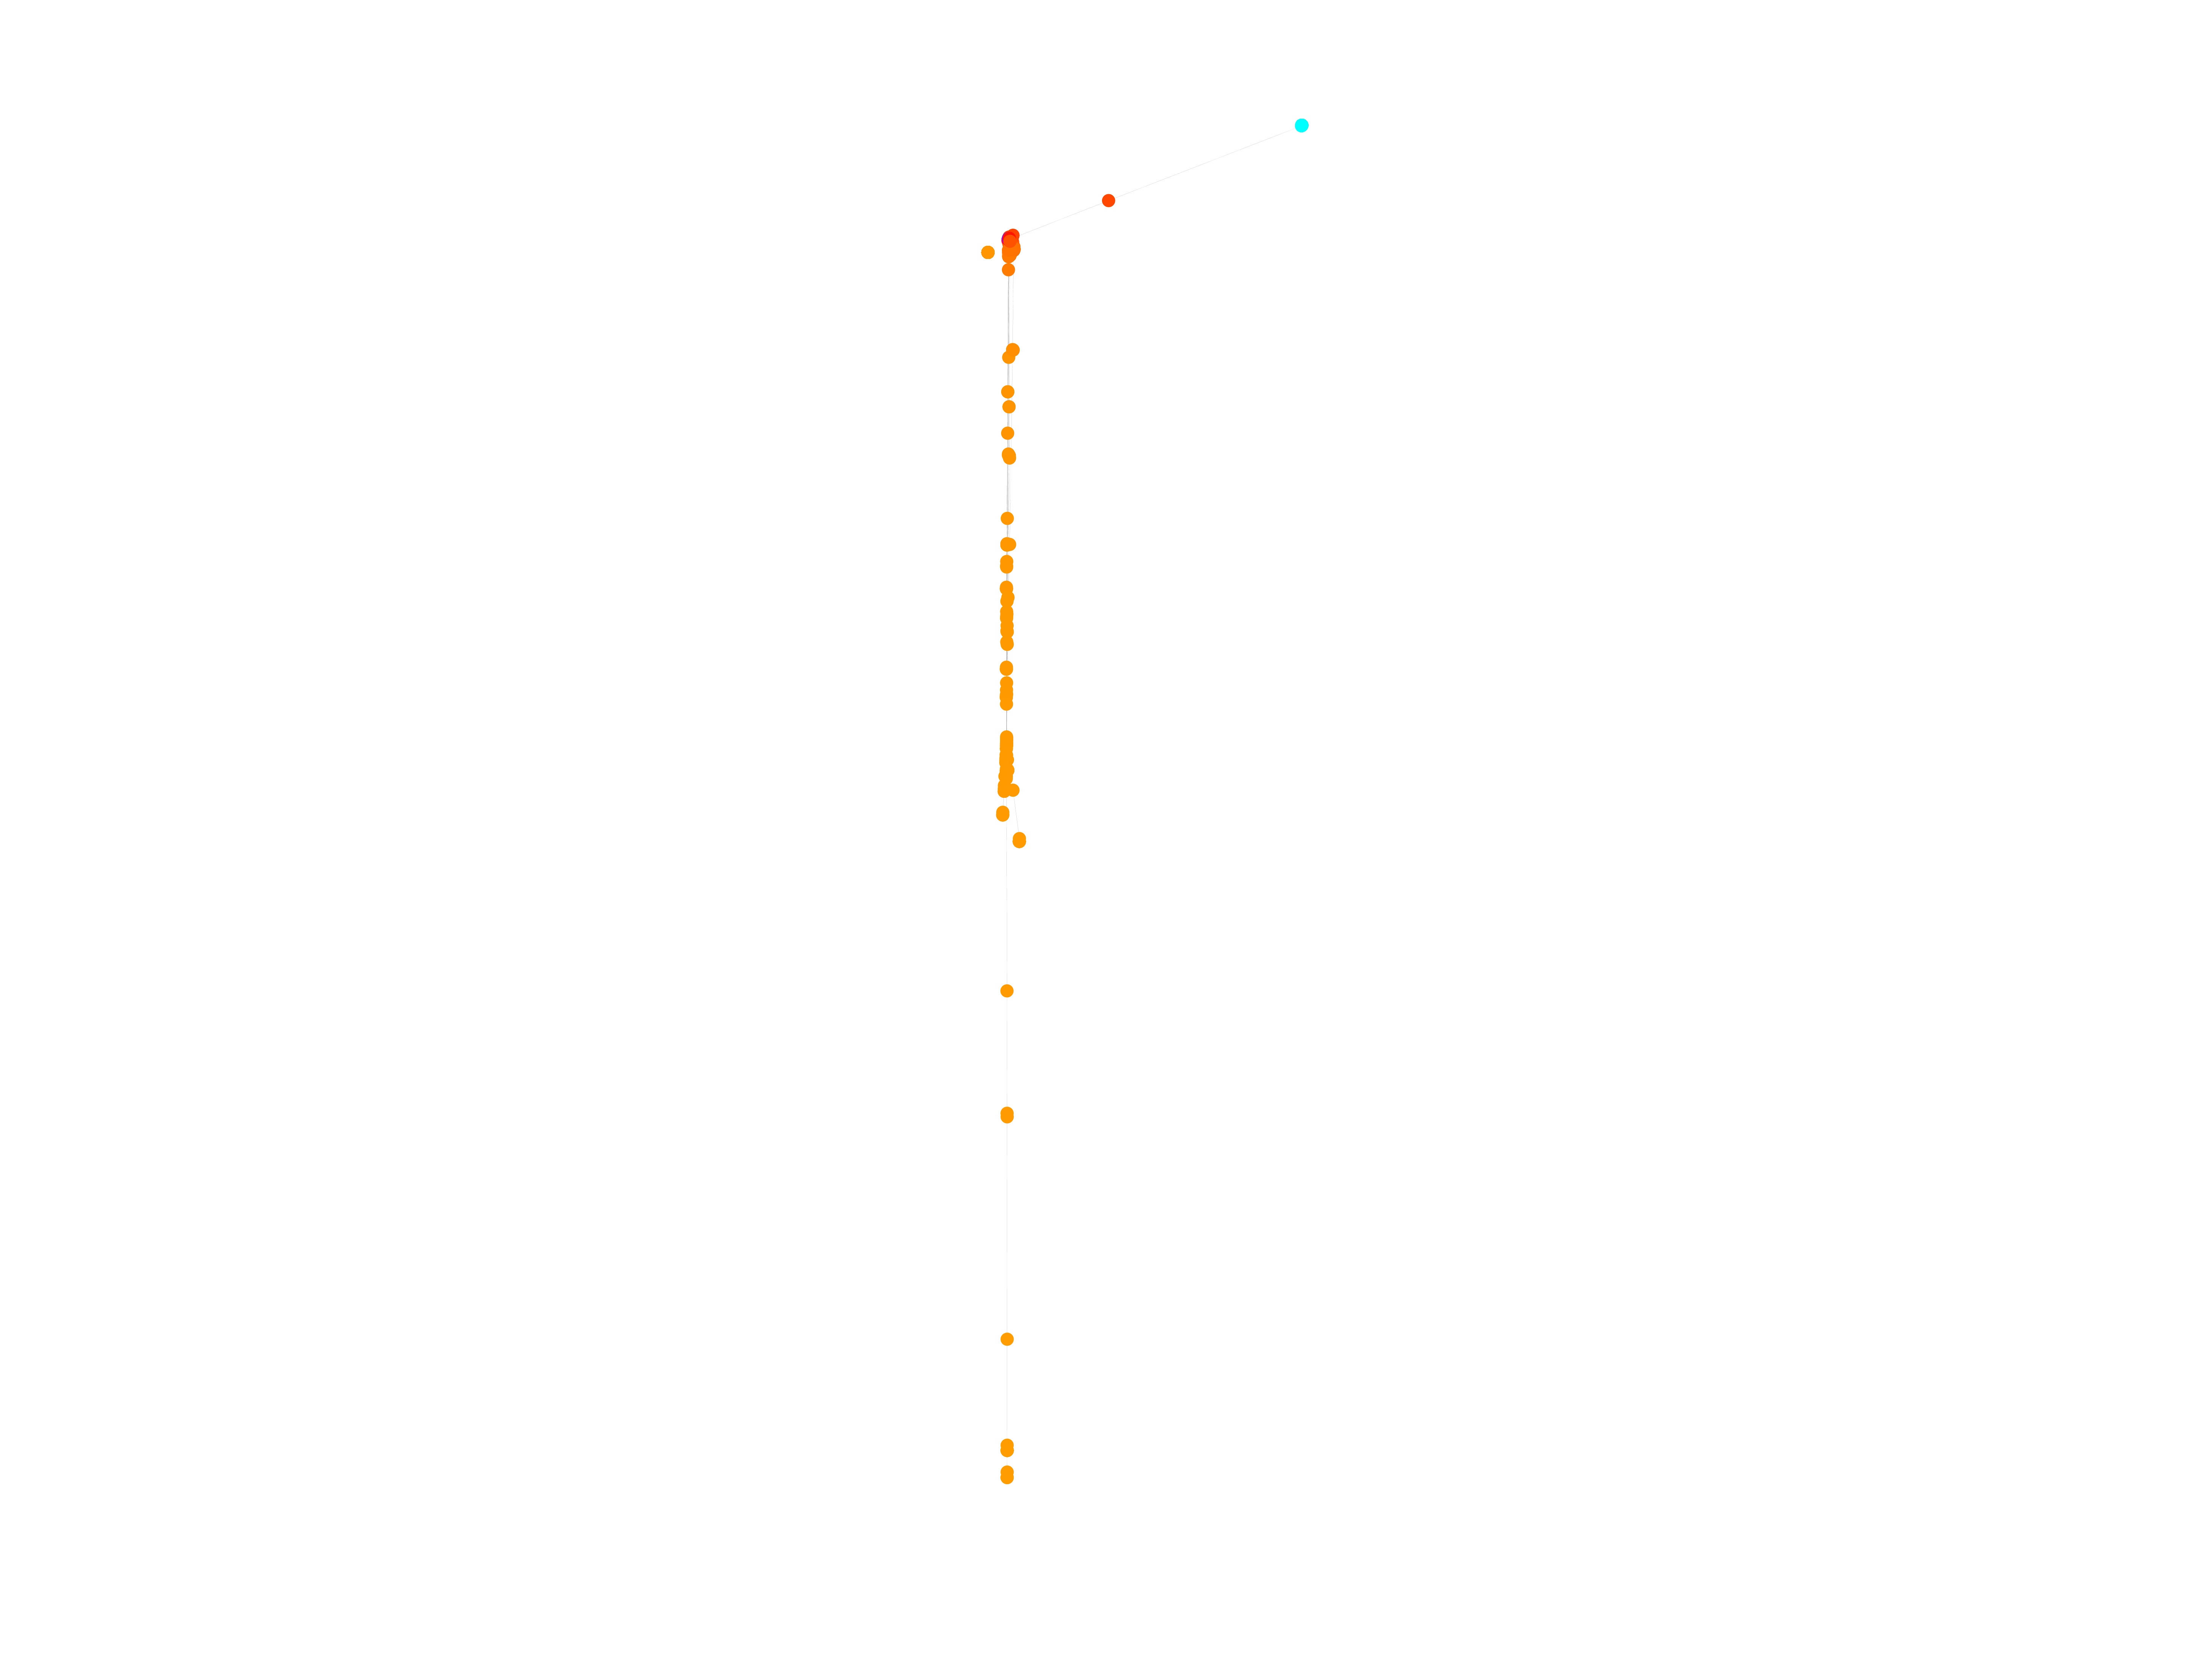
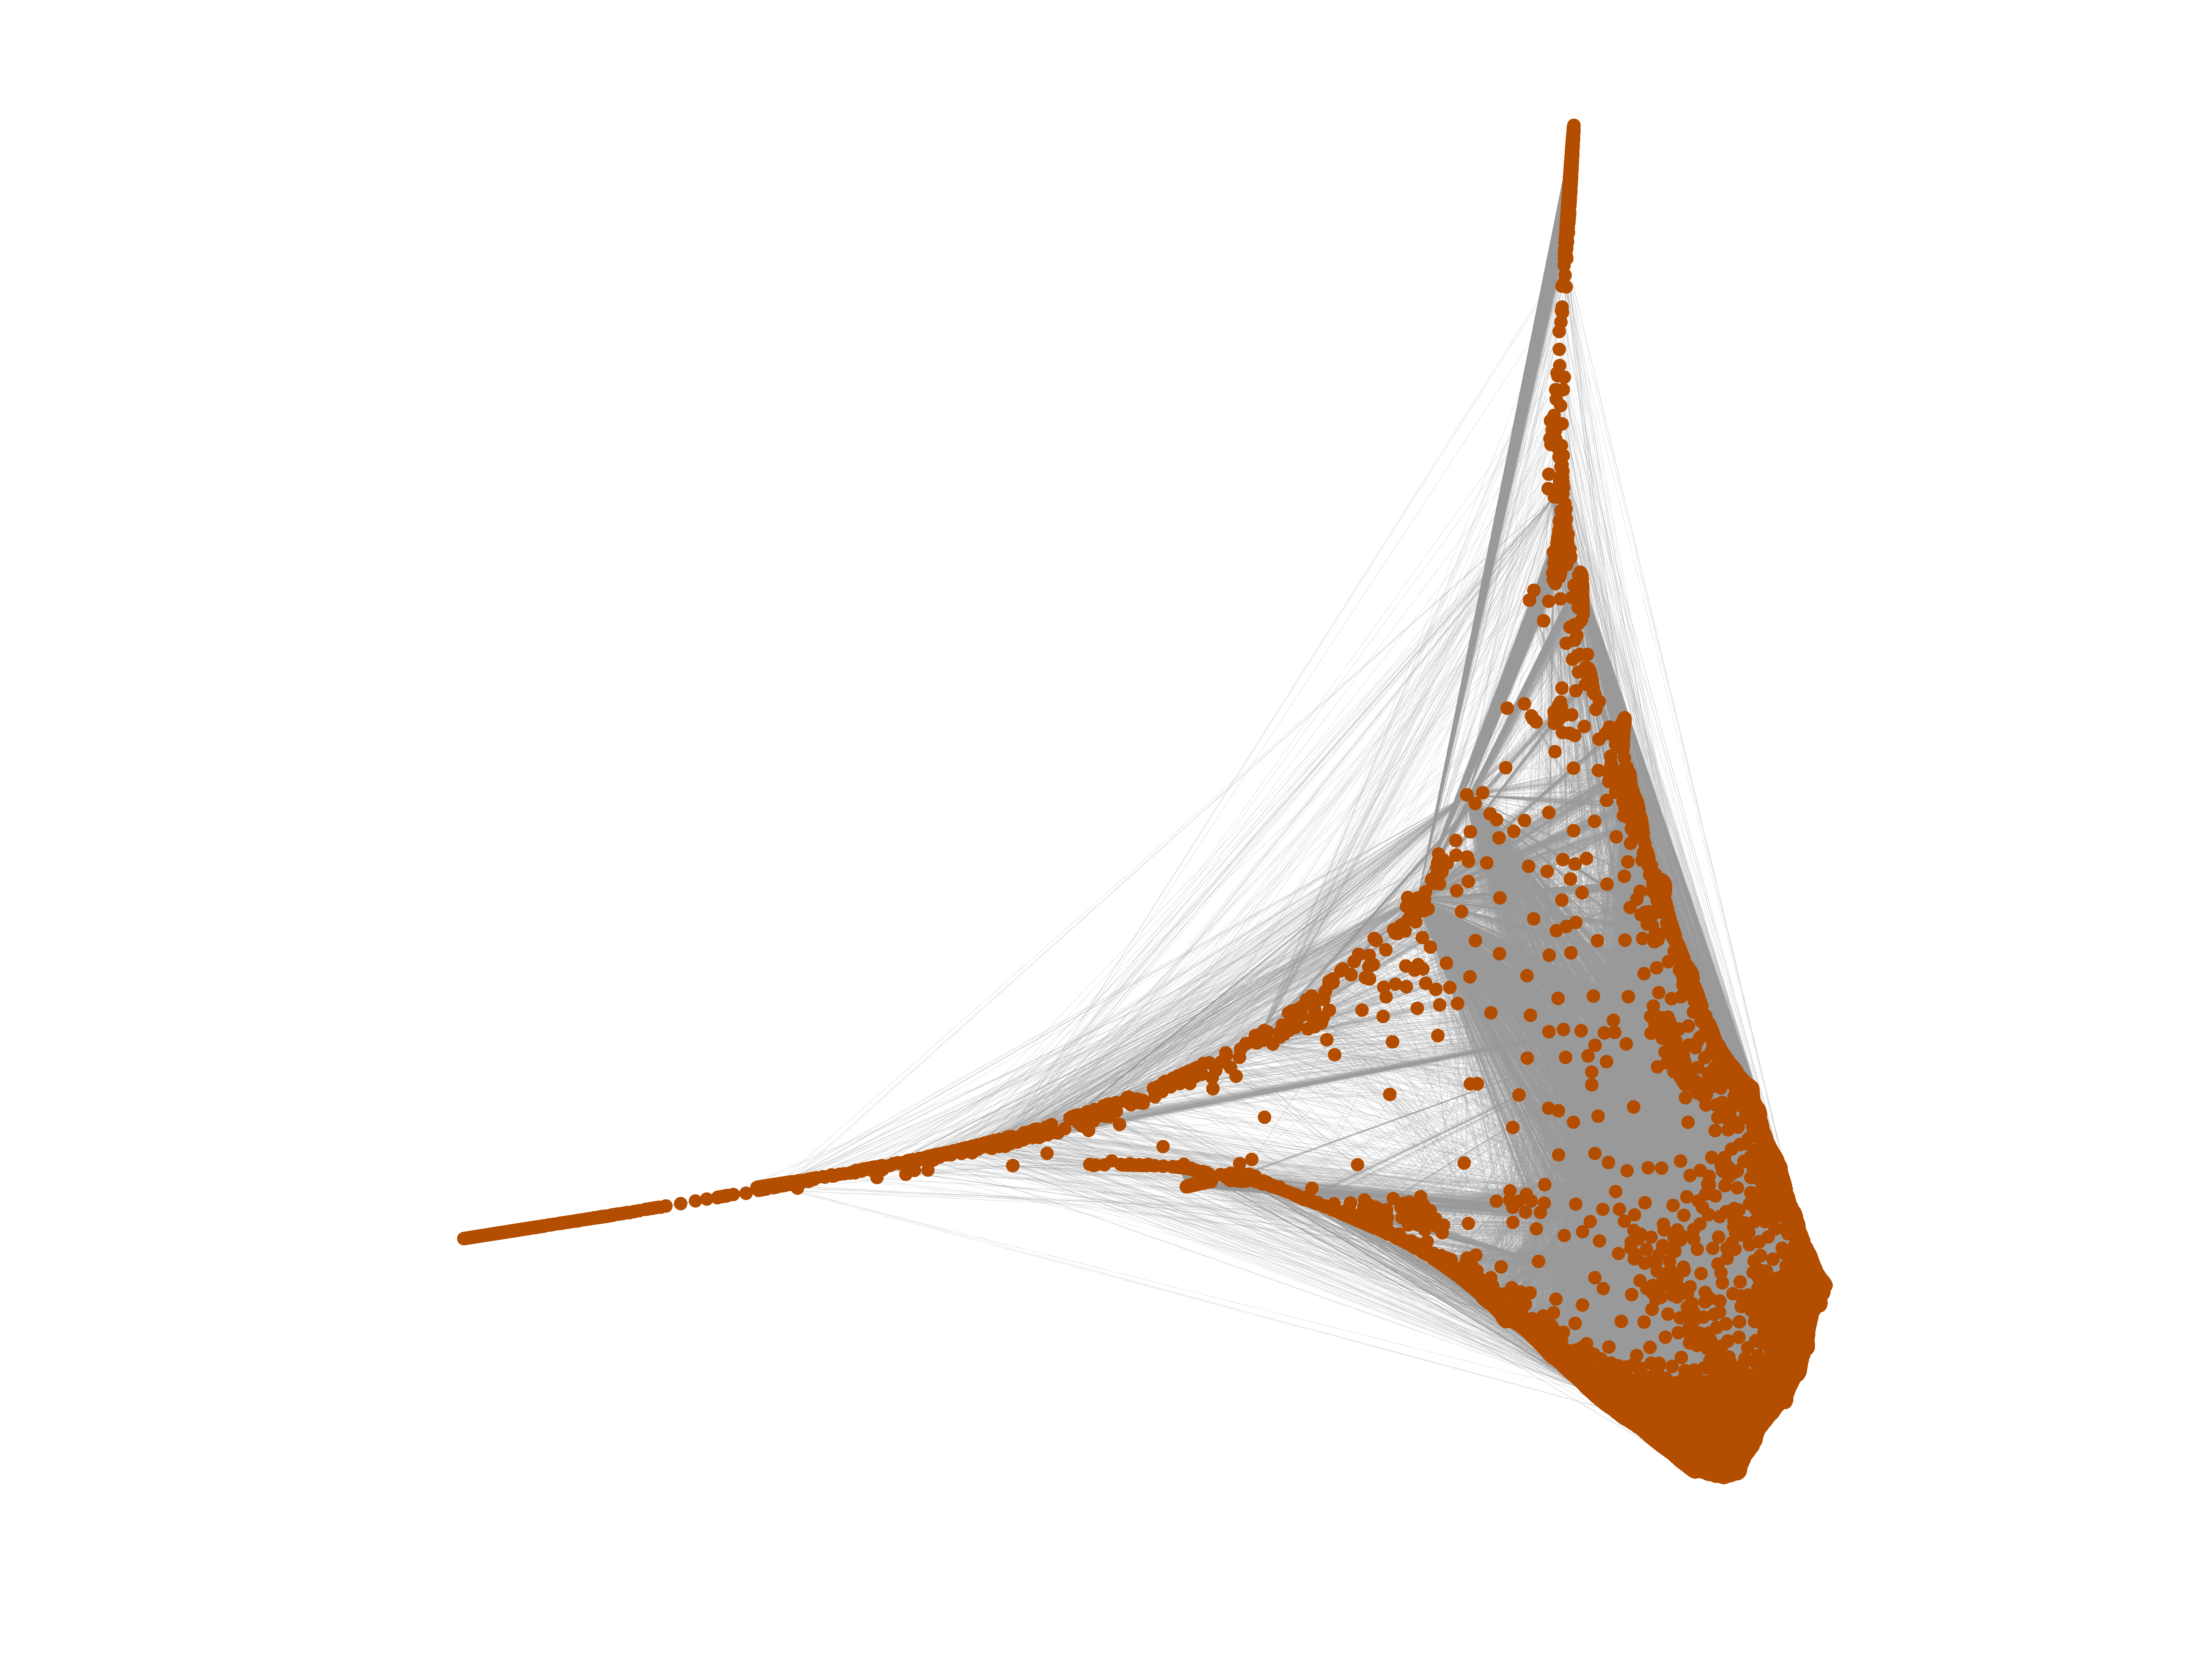
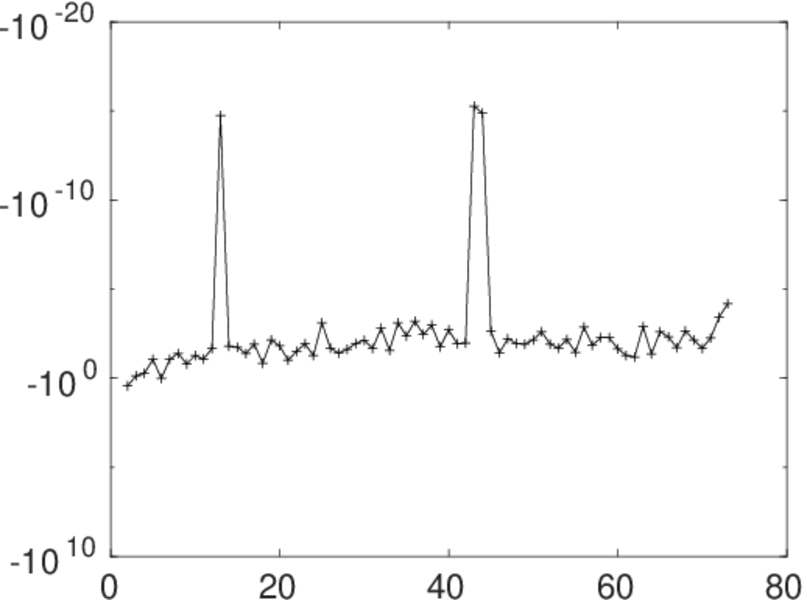
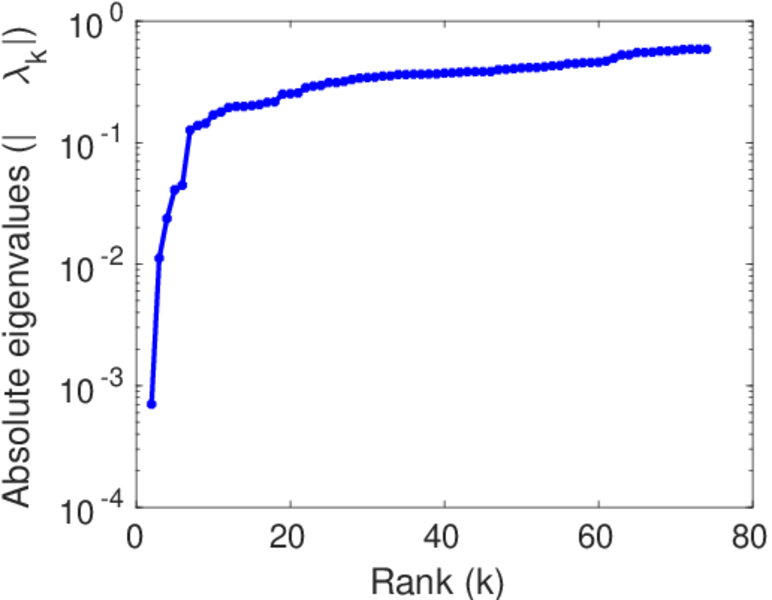
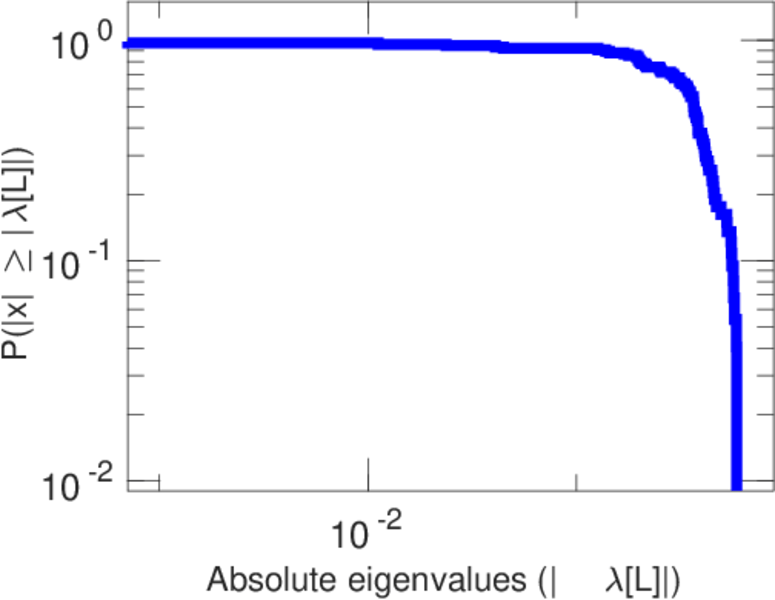
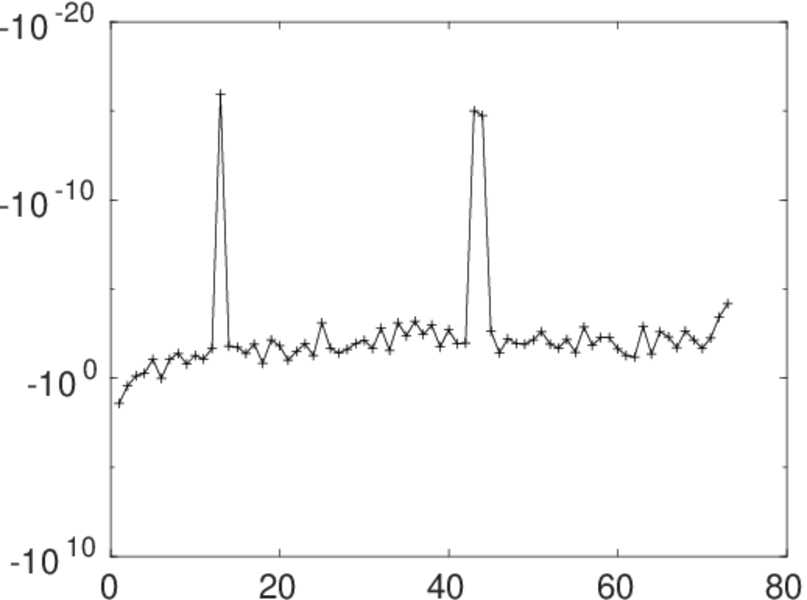
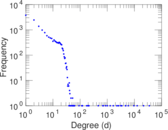
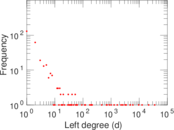
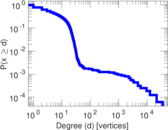
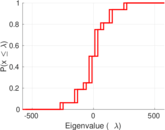
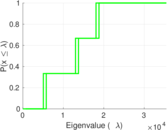
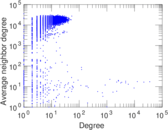
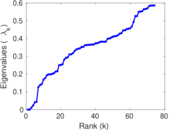
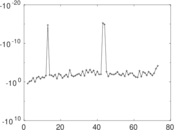
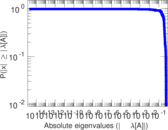
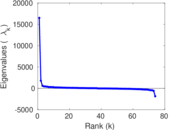
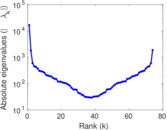
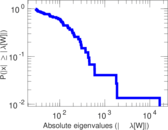
Plots


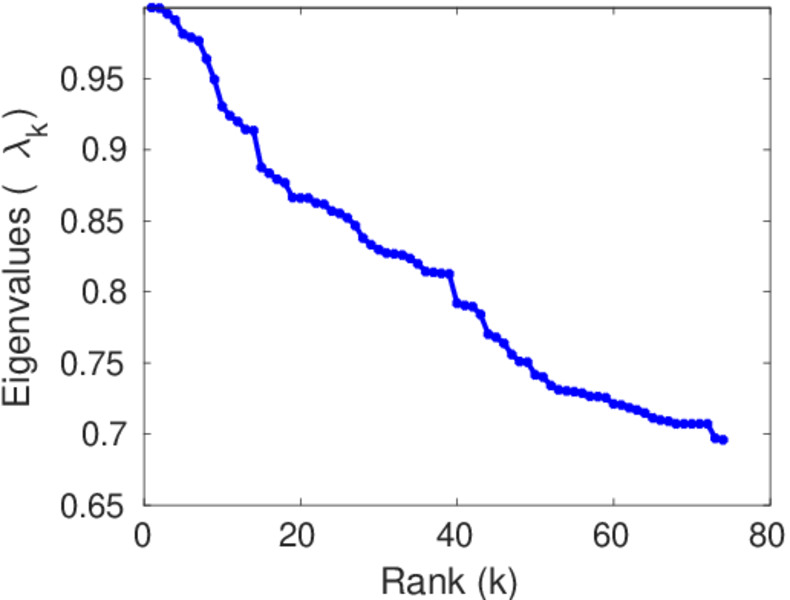
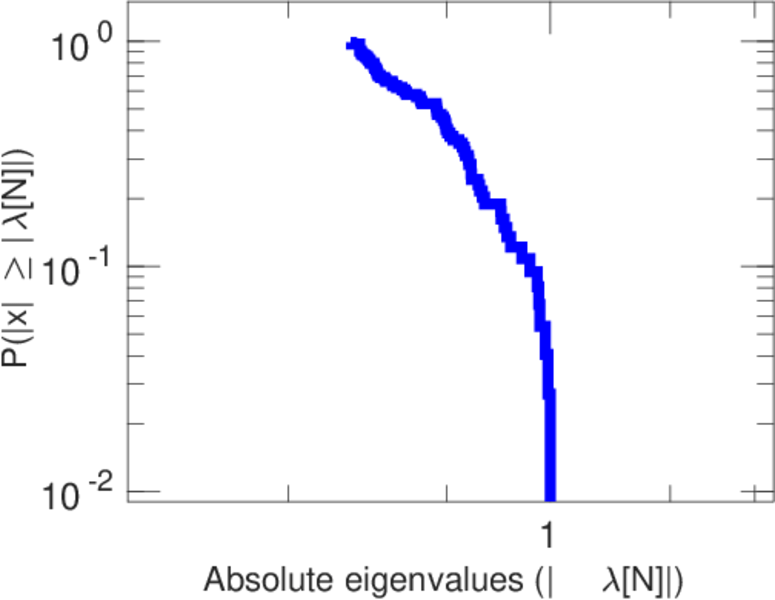
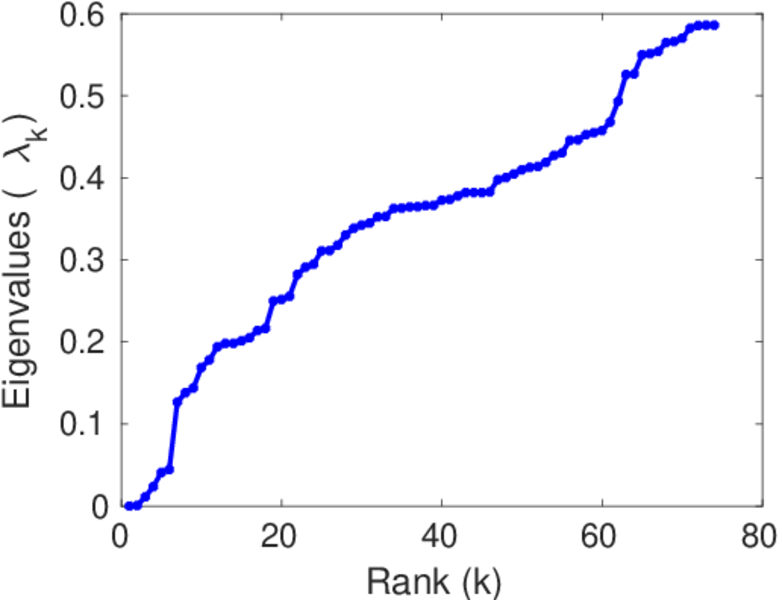
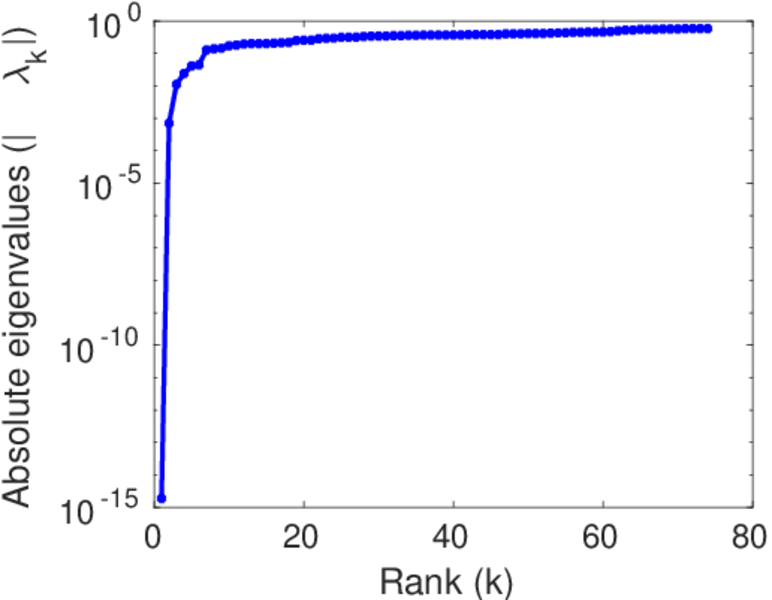
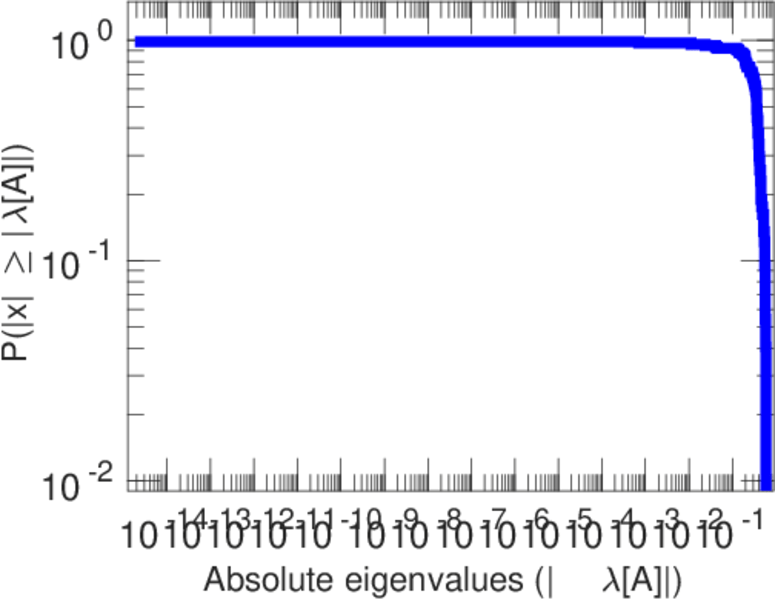
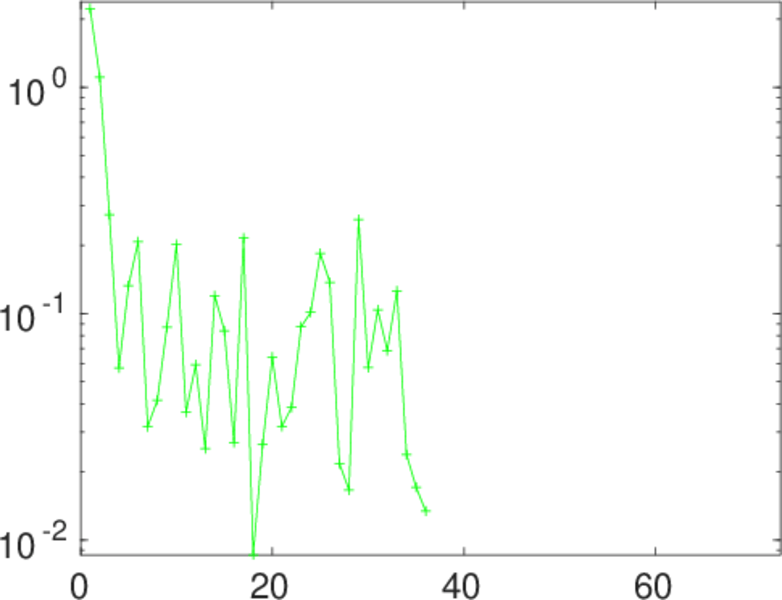
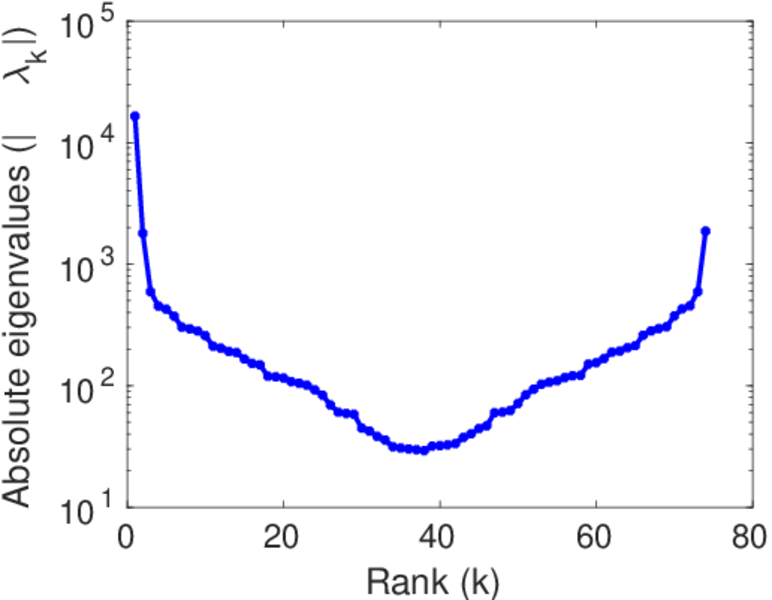
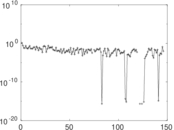
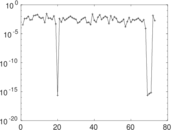
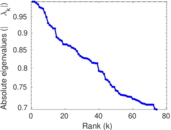
Matrix decompositions plots


Downloads
References
|
[1]
|
Jérôme Kunegis.
KONECT – The Koblenz Network Collection.
In Proc. Int. Conf. on World Wide Web Companion, pages
1343–1350, 2013.
[ http ]
|
|
[2]
|
Wikimedia Foundation.
Wikimedia downloads.
http://dumps.wikimedia.org/, January 2010.
|
 KONECT ‣ Networks ‣
Buy Me a Coffee
KONECT ‣ Networks ‣
Buy Me a Coffee