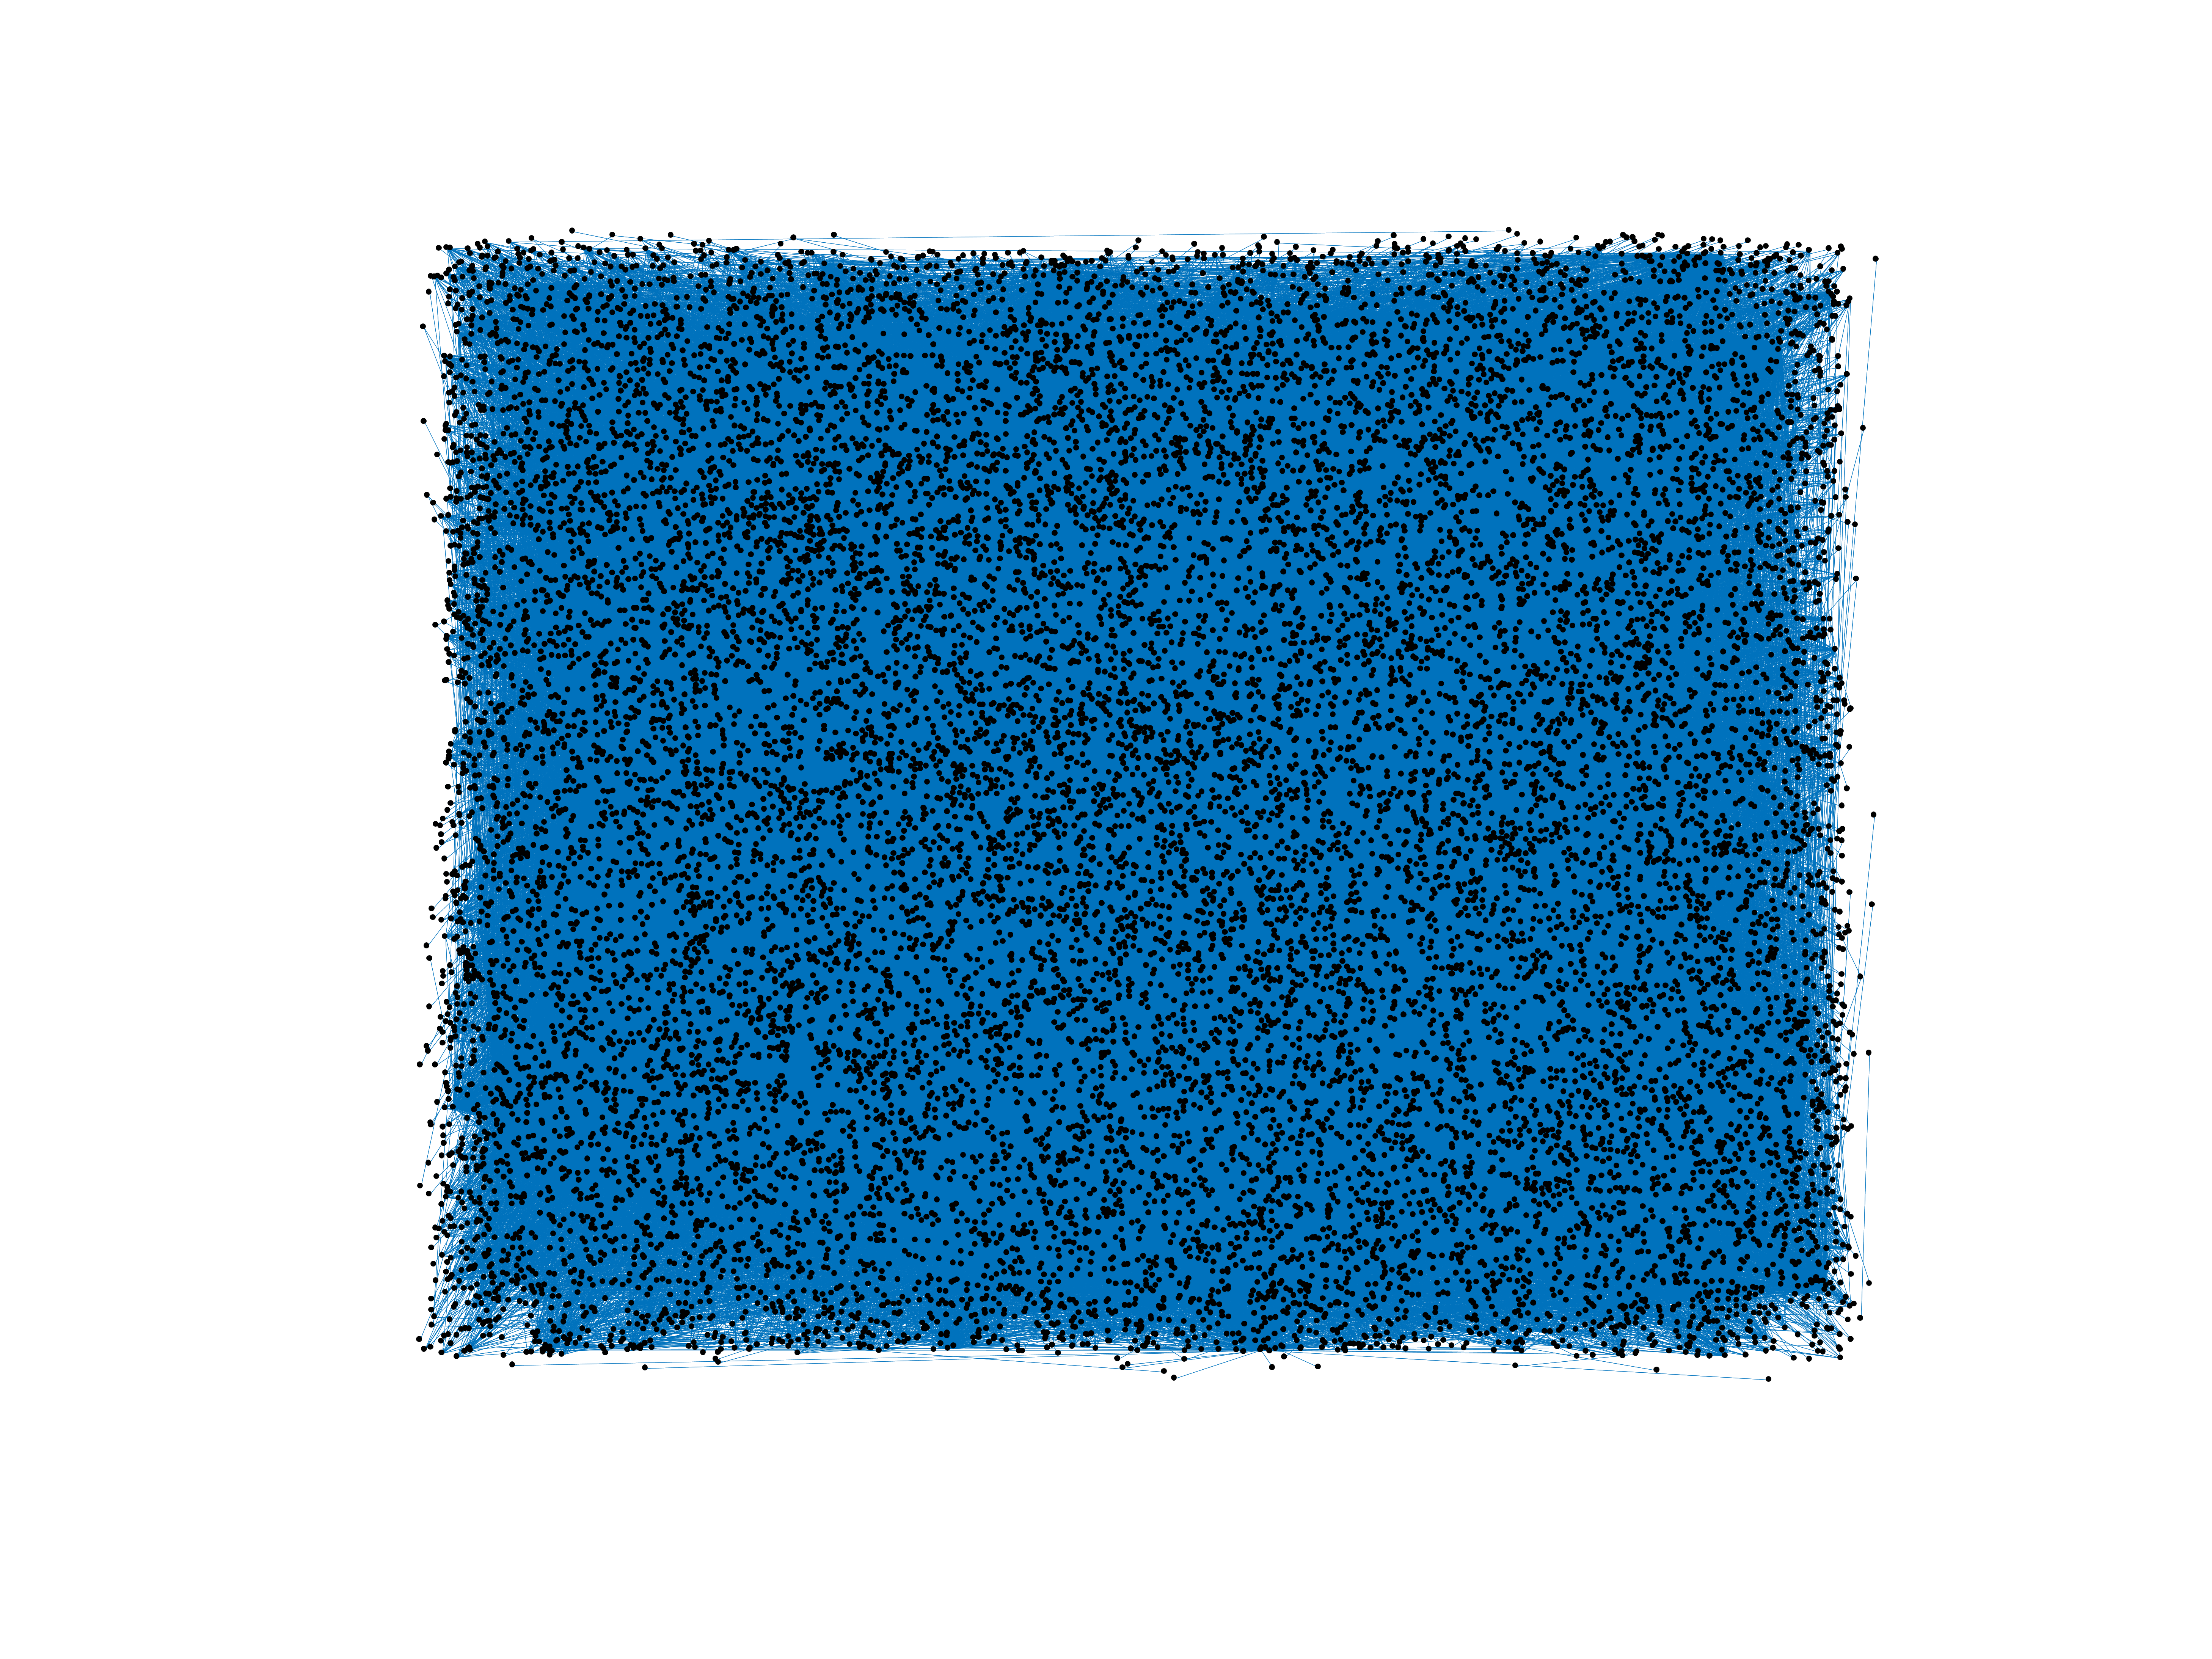
Wikipedia edits (szl)
This is the bipartite edit network of the Silesian Wikipedia. It contains users
and pages from the Silesian Wikipedia, connected by edit events. Each edge
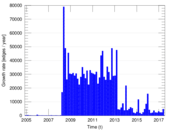
represents an edit. The dataset includes the timestamp of each edit.
Metadata
Statistics
| Size | n = | 17,240
|
| Left size | n1 = | 1,534
|
| Right size | n2 = | 15,706
|
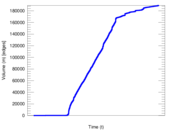
| Volume | m = | 189,325
|
| Unique edge count | m̿ = | 85,957
|
| Wedge count | s = | 101,234,583
|
| Claw count | z = | 130,822,187,617
|
| Cross count | x = | 156,203,255,811,145
|
| Square count | q = | 218,510,518
|
| 4-Tour count | T4 = | 2,153,272,266
|
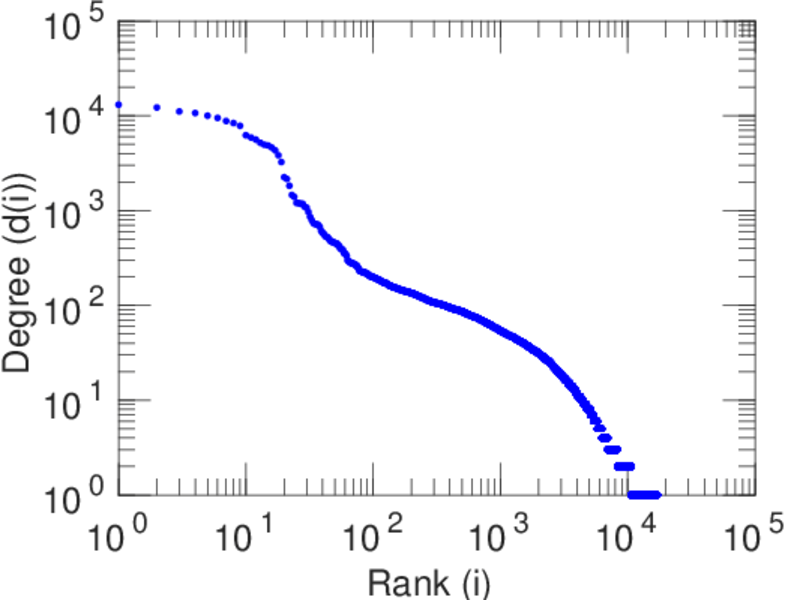
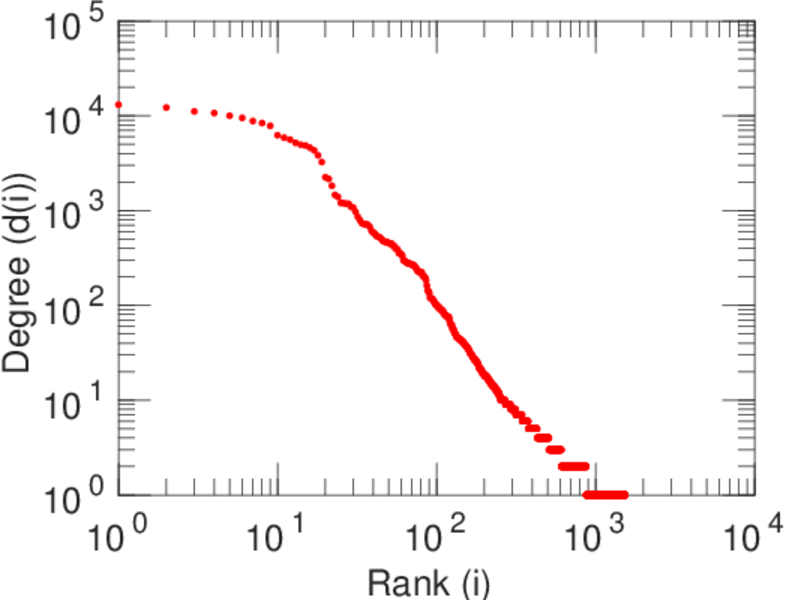
| Maximum degree | dmax = | 13,097
|
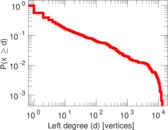
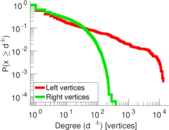
| Maximum left degree | d1max = | 13,097
|
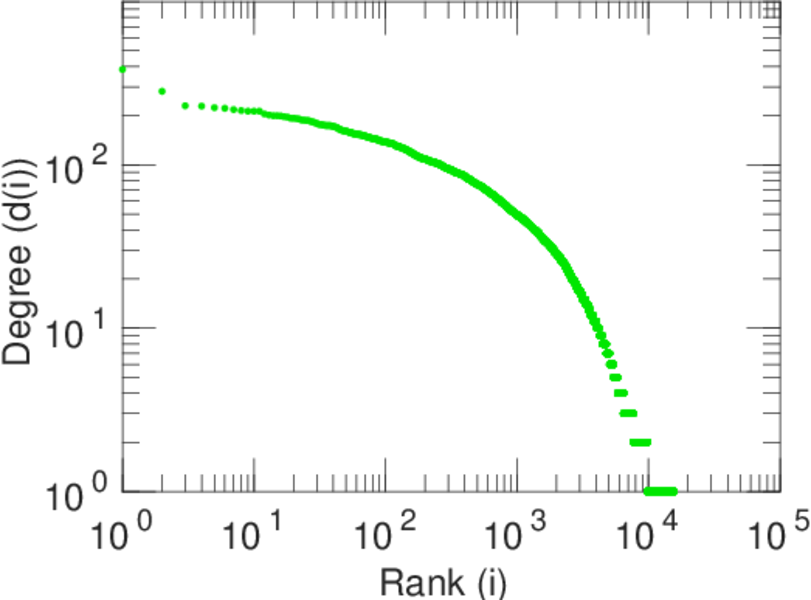
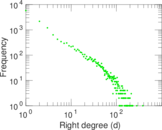
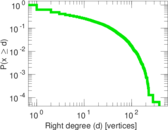
| Maximum right degree | d2max = | 384
|
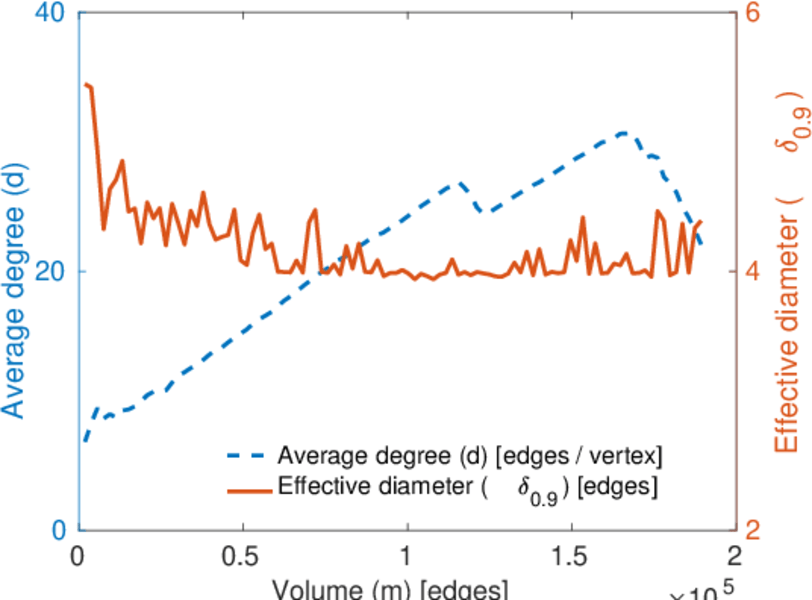
| Average degree | d = | 21.963 5
|
| Average left degree | d1 = | 123.419
|
| Average right degree | d2 = | 12.054 3
|
| Fill | p = | 0.003 567 72
|
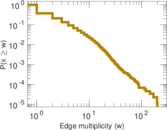
| Average edge multiplicity | m̃ = | 2.202 55
|
| Size of LCC | N = | 16,717
|
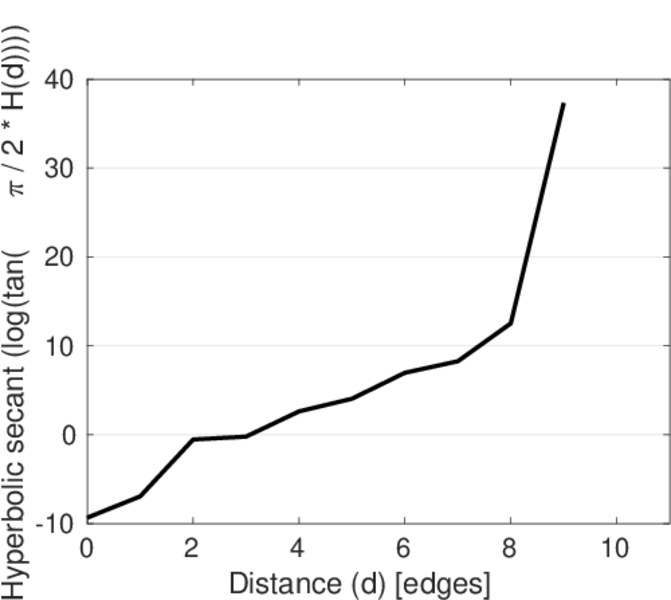
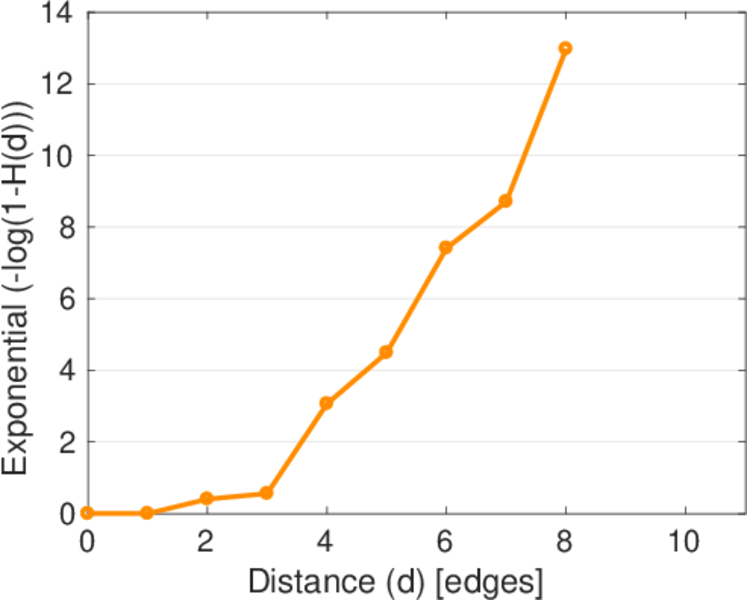
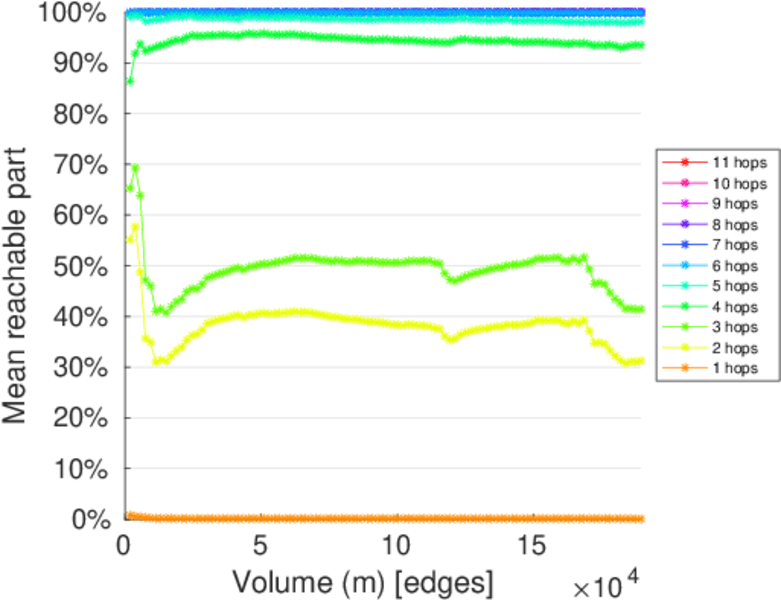
| Diameter | δ = | 11
|
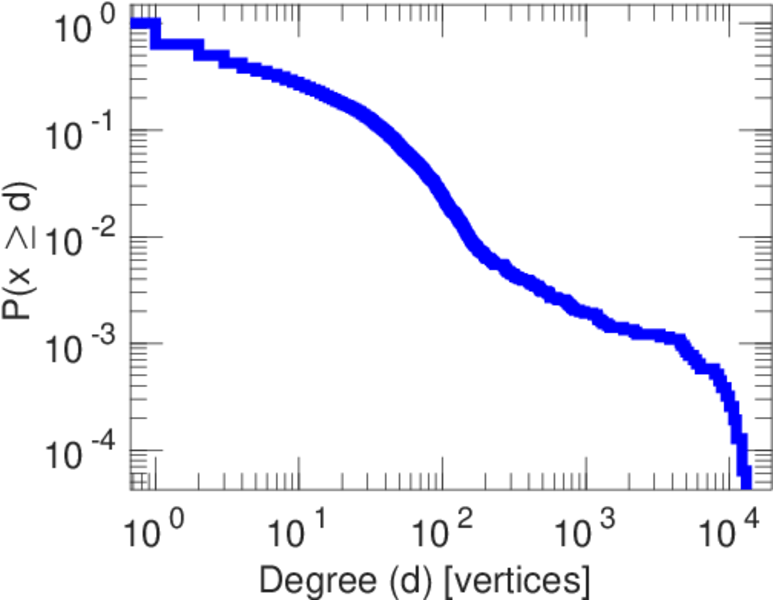
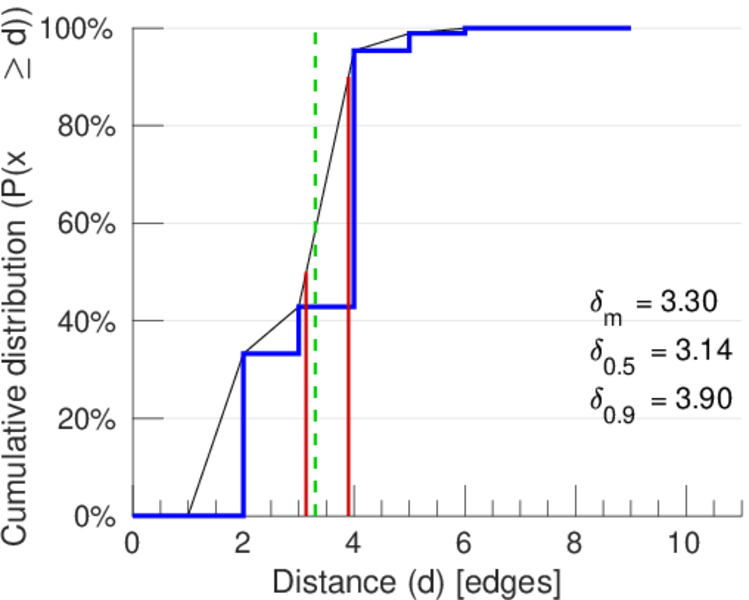
| 50-Percentile effective diameter | δ0.5 = | 3.135 70
|
| 90-Percentile effective diameter | δ0.9 = | 3.898 23
|
| Median distance | δM = | 4
|
| Mean distance | δm = | 3.296 71
|
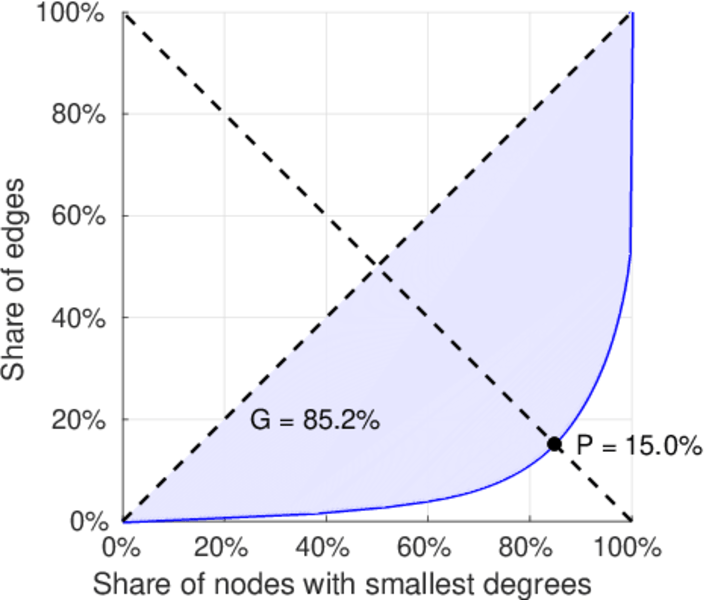
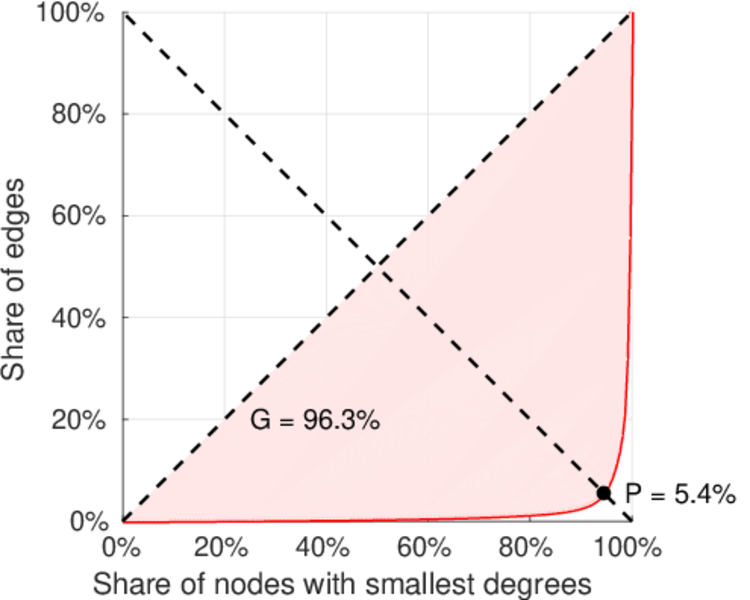
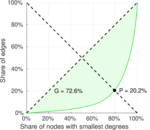
| Gini coefficient | G = | 0.853 680
|
| Balanced inequality ratio | P = | 0.151 169
|
| Left balanced inequality ratio | P1 = | 0.053 812 2
|
| Right balanced inequality ratio | P2 = | 0.202 467
|
| Relative edge distribution entropy | Her = | 0.750 485
|
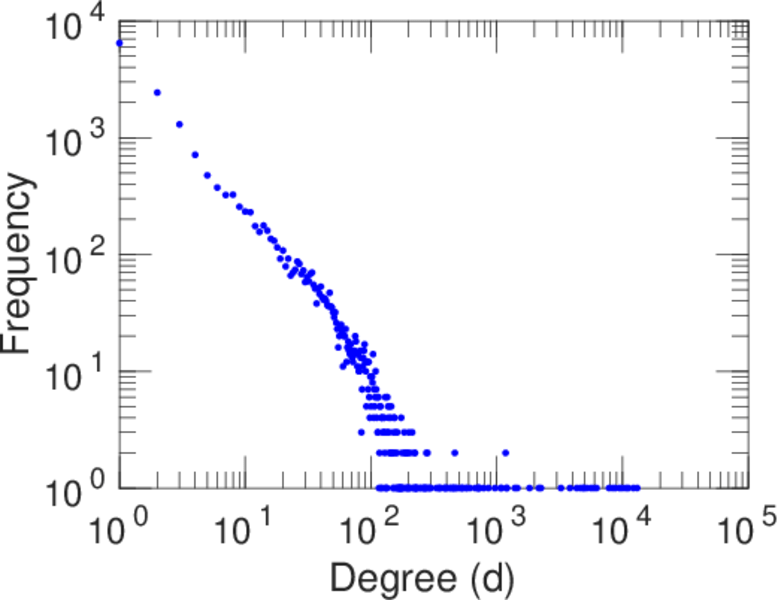
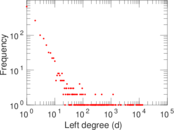
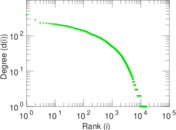
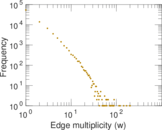
| Power law exponent | γ = | 2.019 05
|
| Tail power law exponent | γt = | 1.691 00
|
| Tail power law exponent with p | γ3 = | 1.691 00
|
| p-value | p = | 0.000 00
|
| Left tail power law exponent with p | γ3,1 = | 1.691 00
|
| Left p-value | p1 = | 0.000 00
|
| Right tail power law exponent with p | γ3,2 = | 8.911 00
|
| Right p-value | p2 = | 0.210 000
|
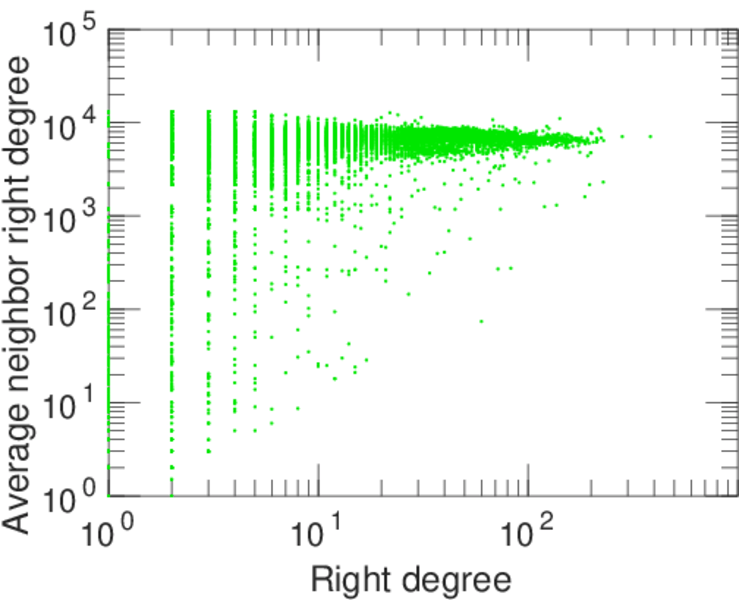
| Degree assortativity | ρ = | −0.295 206
|
| Degree assortativity p-value | pρ = | 0.000 00
|
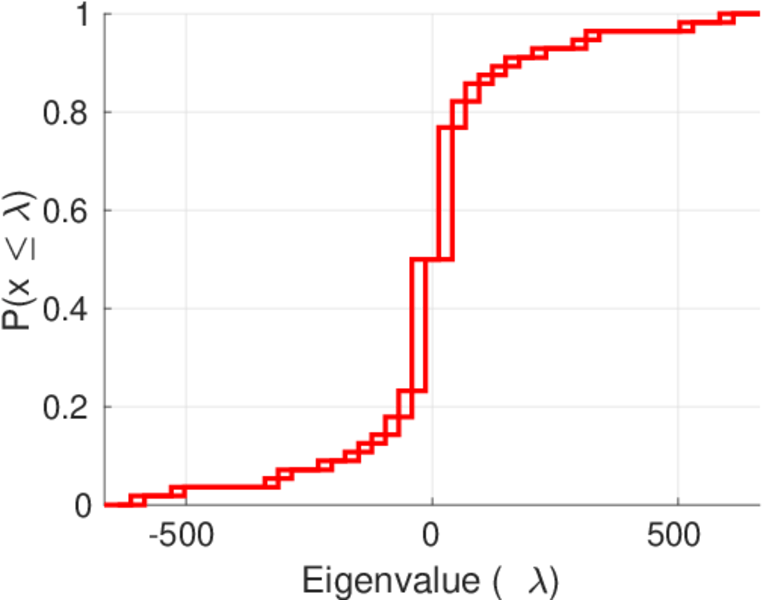
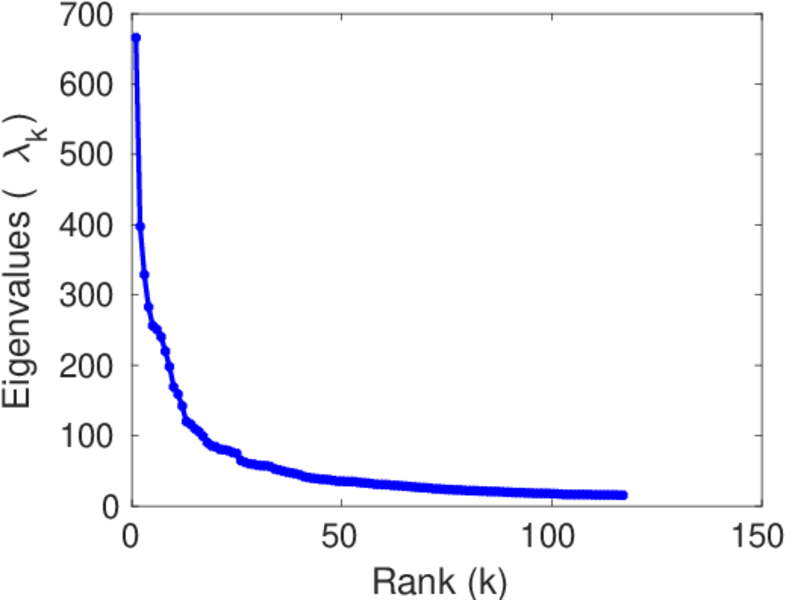
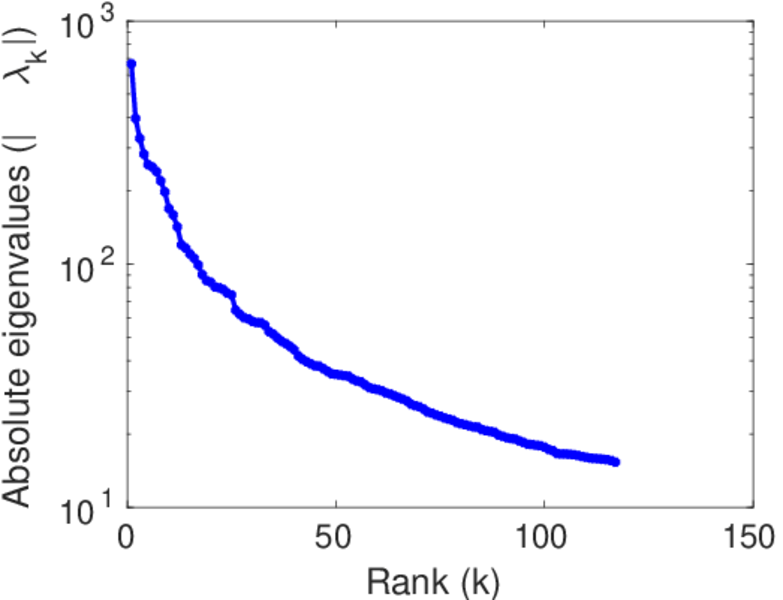
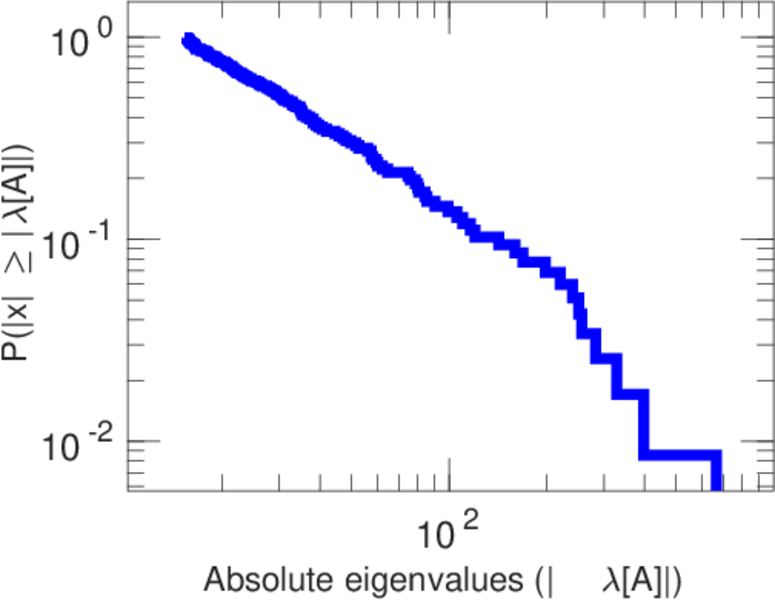
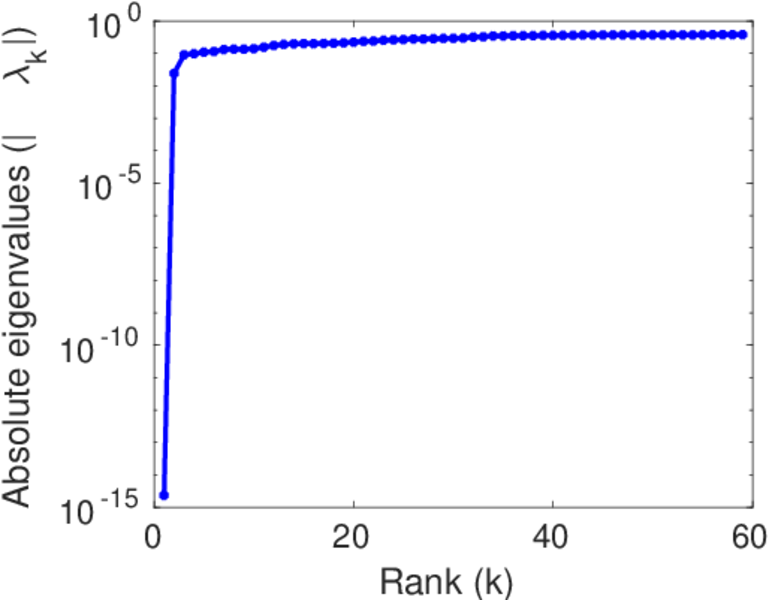
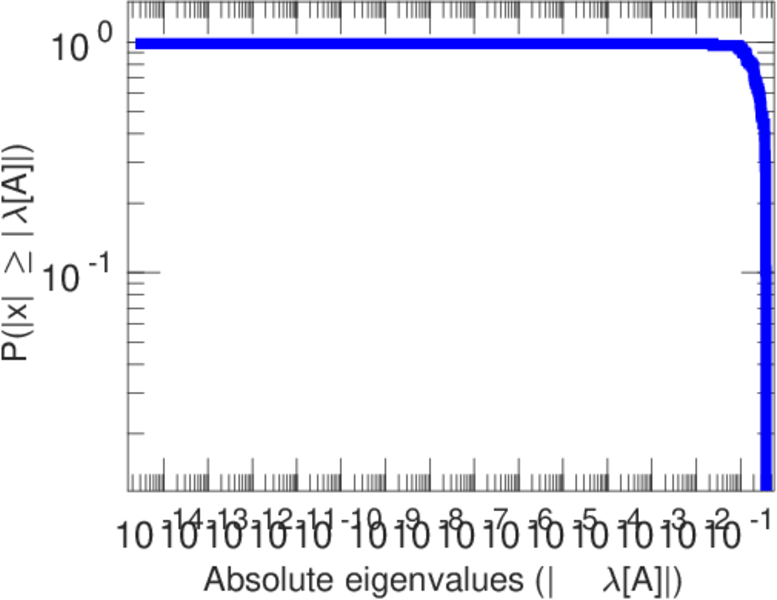
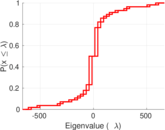
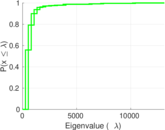
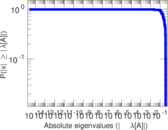
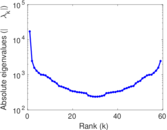
| Spectral norm | α = | 665.951
|
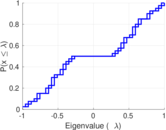
| Algebraic connectivity | a = | 0.024 015 0
|
| Spectral separation | |λ1[A] / λ2[A]| = | 1.675 55
|
| Controllability | C = | 14,388
|
| Relative controllability | Cr = | 0.838 510
|
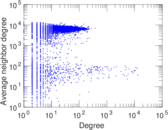
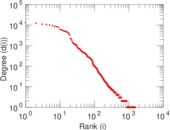
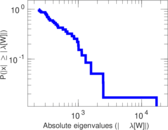
Plots


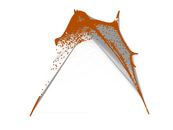


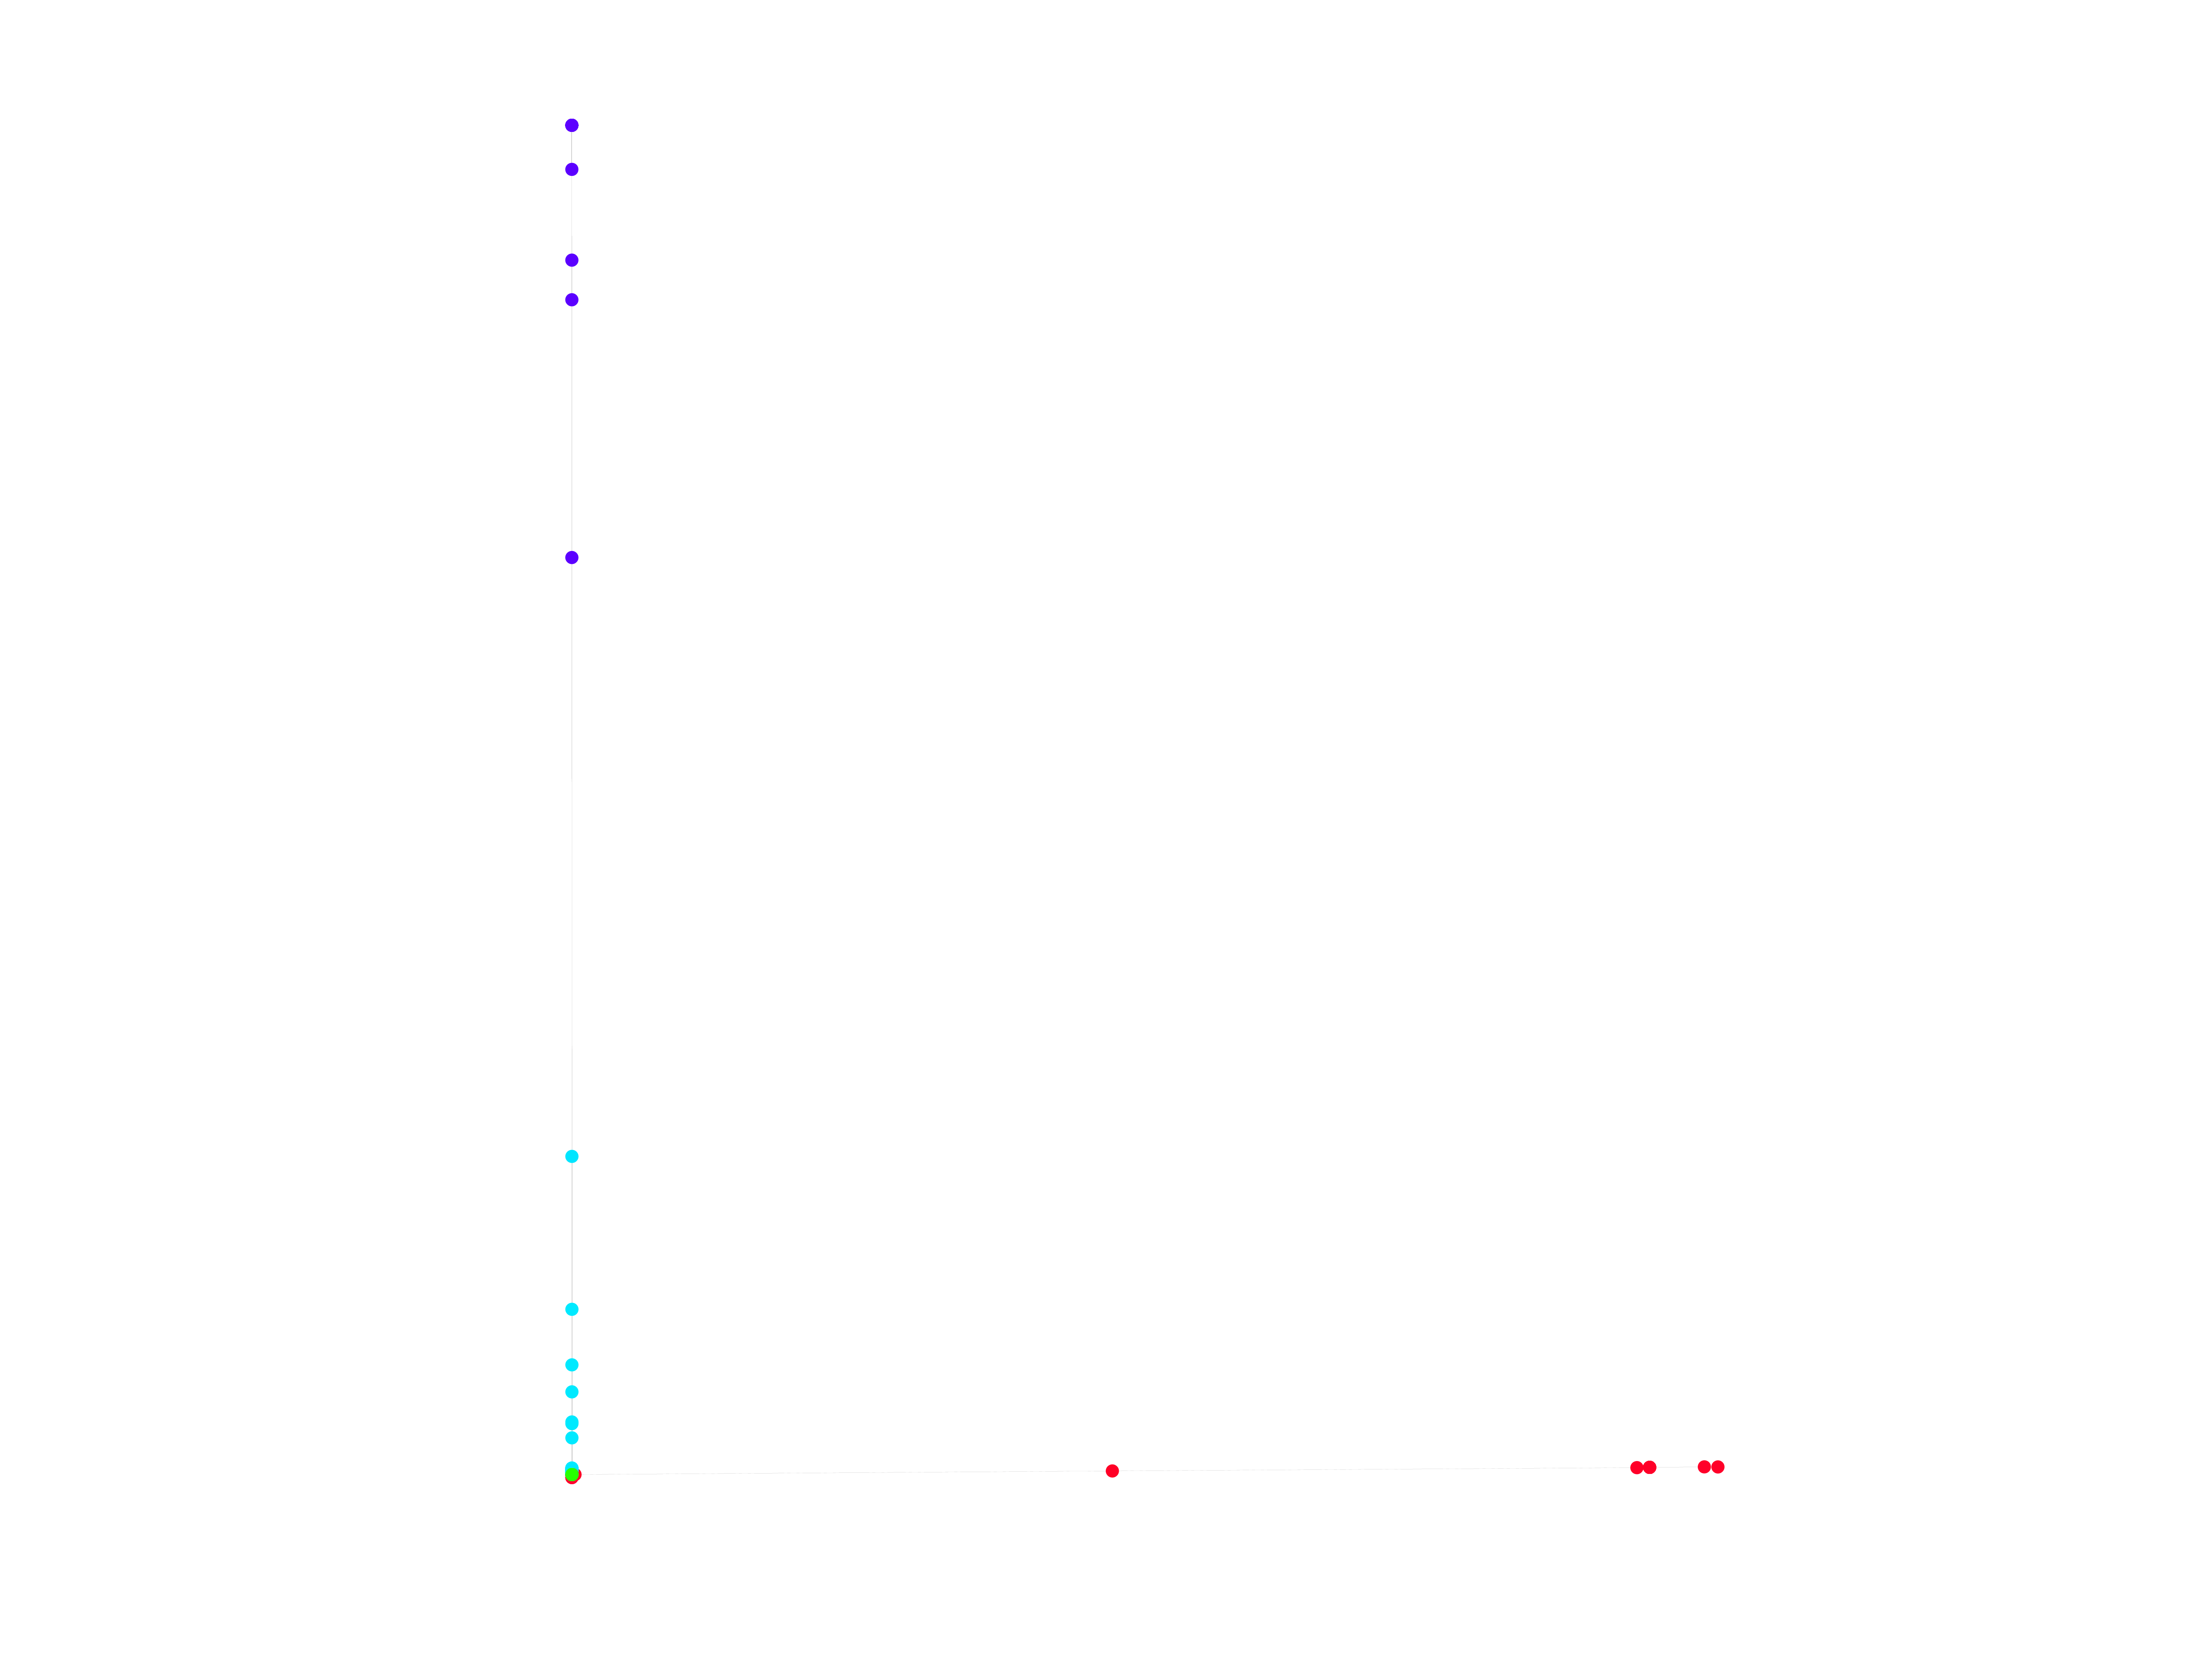
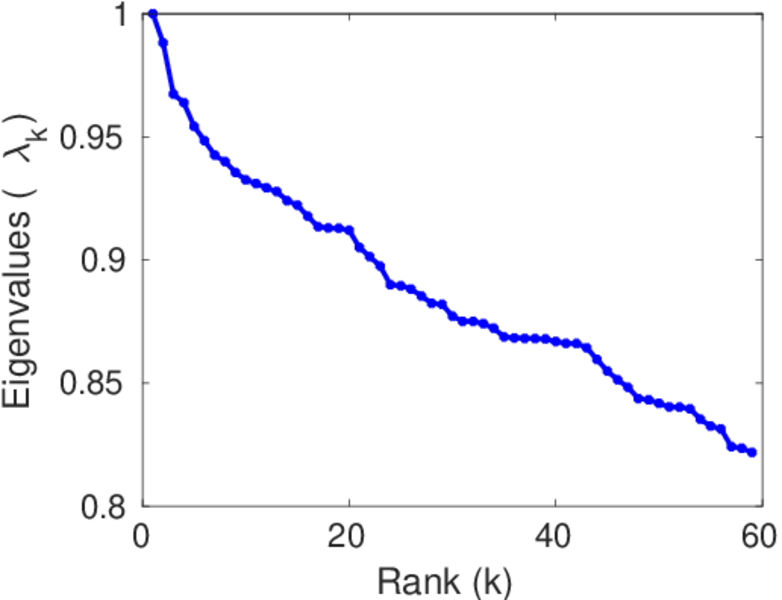
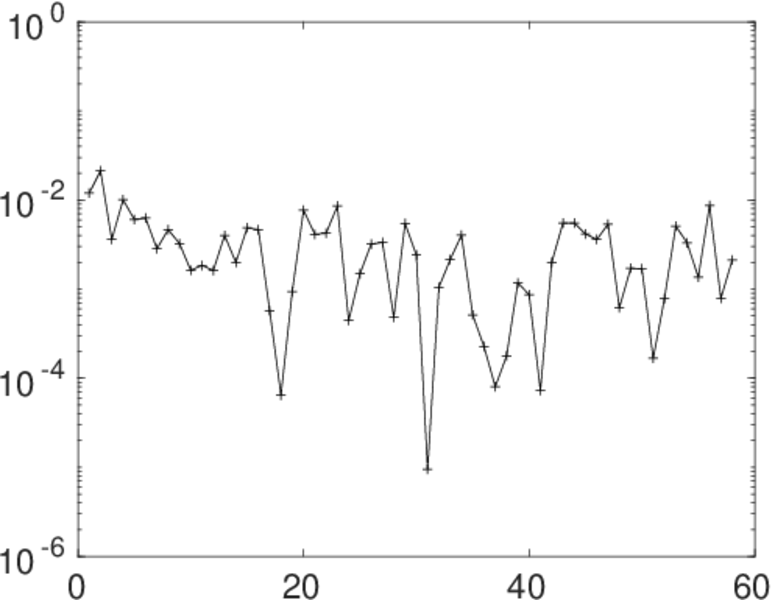
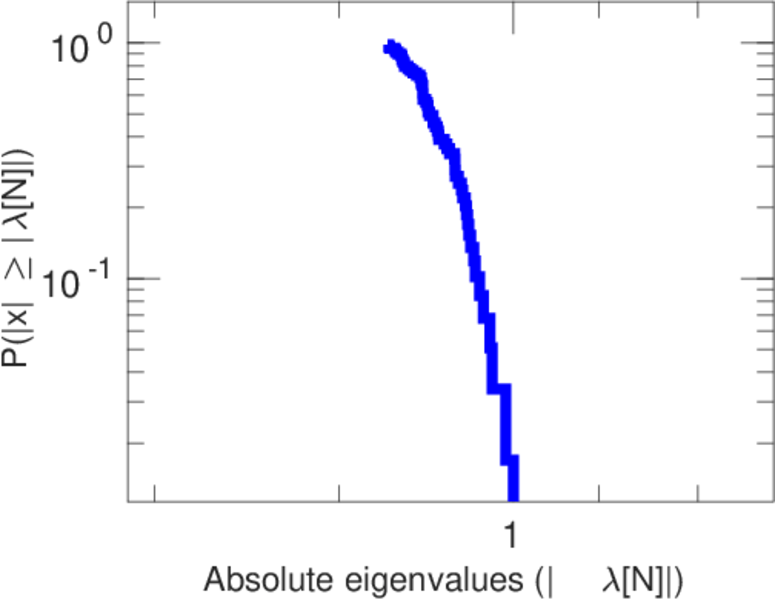
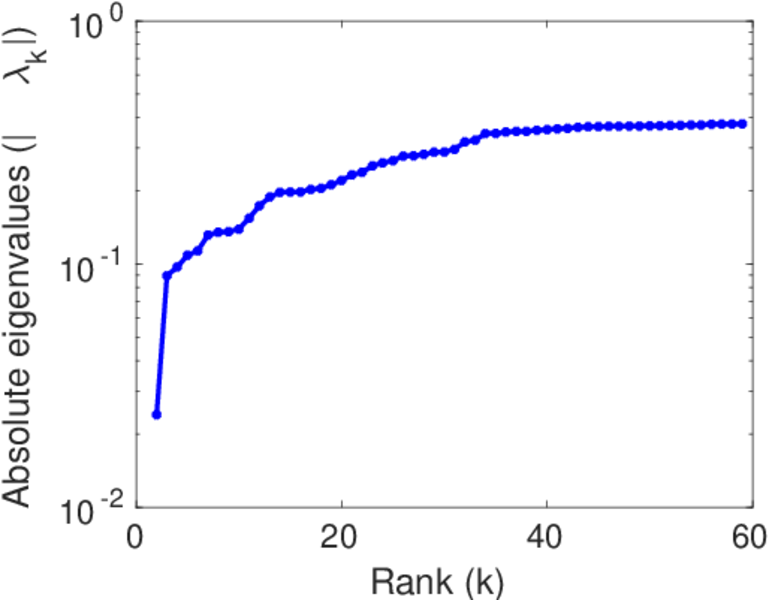
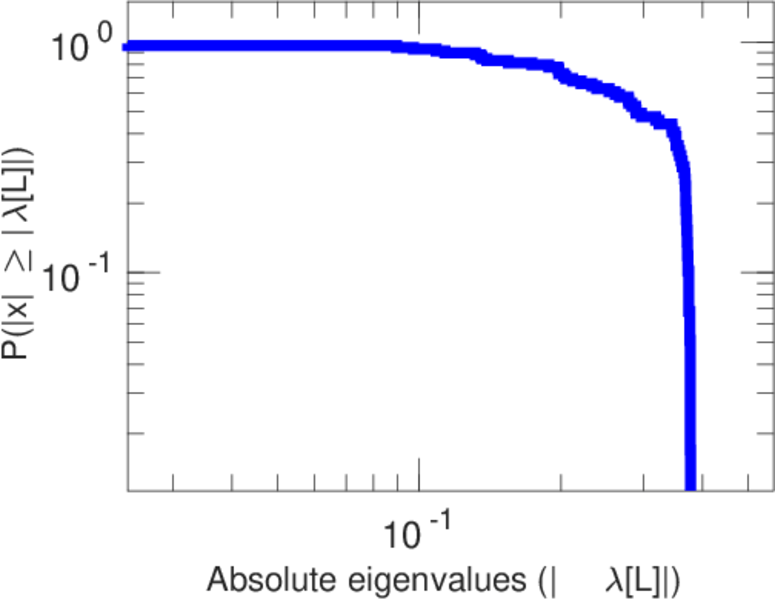
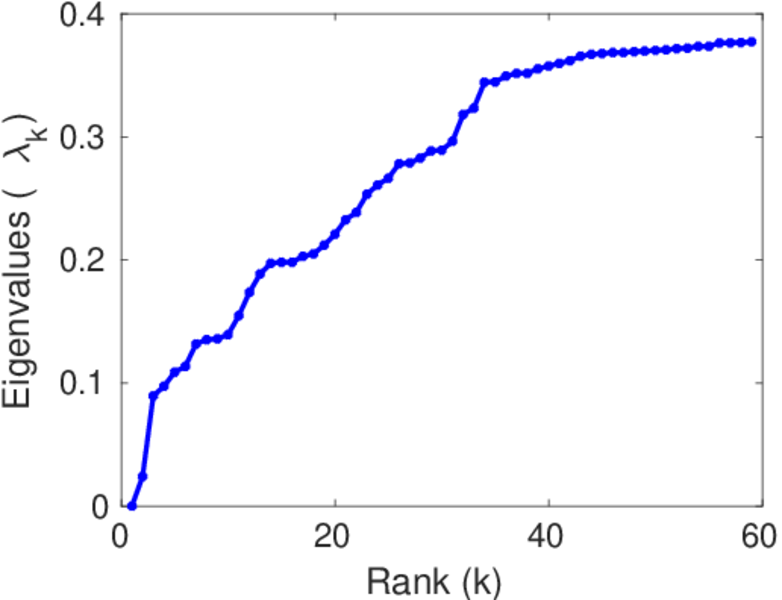
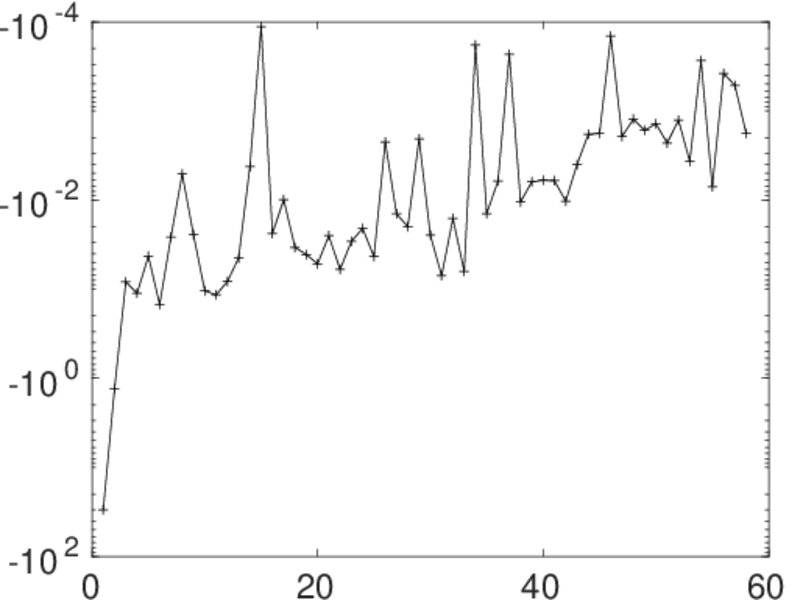
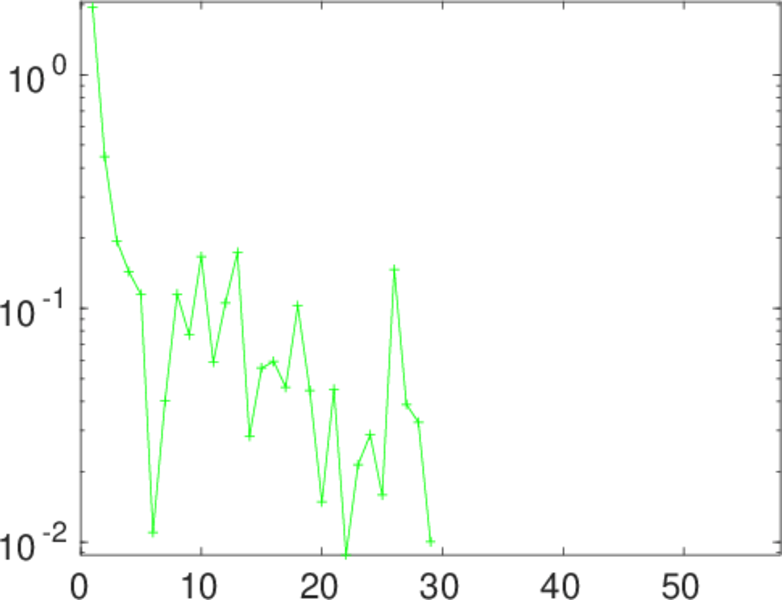
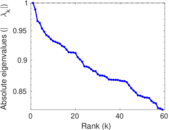
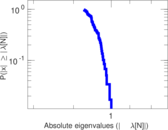
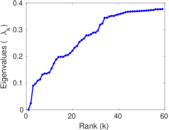
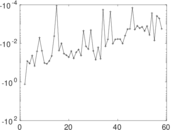
Matrix decompositions plots


Downloads
References
|
[1]
|
Jérôme Kunegis.
KONECT – The Koblenz Network Collection.
In Proc. Int. Conf. on World Wide Web Companion, pages
1343–1350, 2013.
[ http ]
|
|
[2]
|
Wikimedia Foundation.
Wikimedia downloads.
http://dumps.wikimedia.org/, January 2010.
|
 KONECT ‣ Networks ‣
Buy Me a Coffee
KONECT ‣ Networks ‣
Buy Me a Coffee