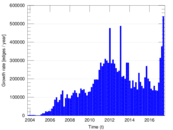
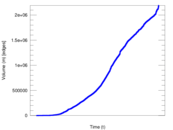
Wikipedia edits (ta)
This is the bipartite edit network of the Tamil Wikipedia. It contains users
and pages from the Tamil Wikipedia, connected by edit events. Each edge
represents an edit. The dataset includes the timestamp of each edit.
Metadata
Statistics
| Size | n = | 330,121
|
| Left size | n1 = | 15,251
|
| Right size | n2 = | 314,870
|
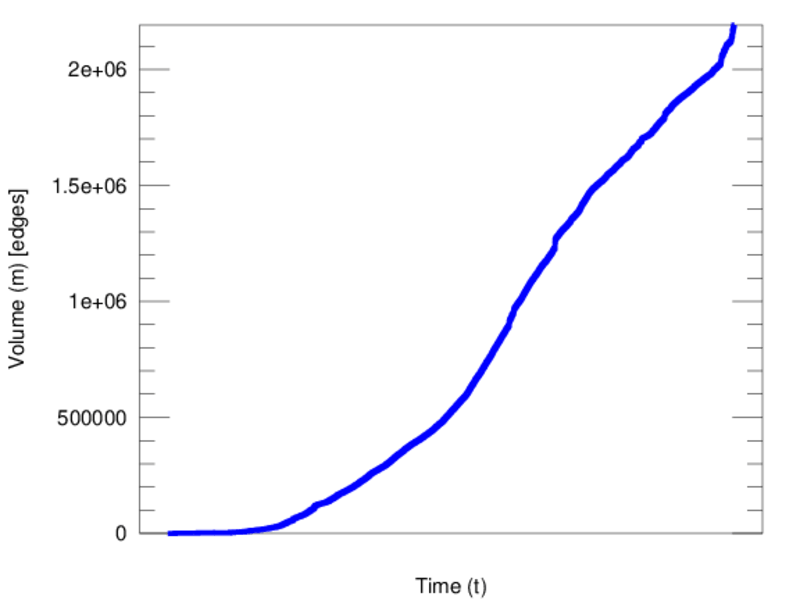
| Volume | m = | 2,191,339
|
| Unique edge count | m̿ = | 983,701
|
| Wedge count | s = | 6,518,965,827
|
| Claw count | z = | 59,751,350,759,788
|
| Cross count | x = | 532,878,433,465,853,184
|
| Square count | q = | 4,722,879,363
|
| 4-Tour count | T4 = | 63,861,503,858
|
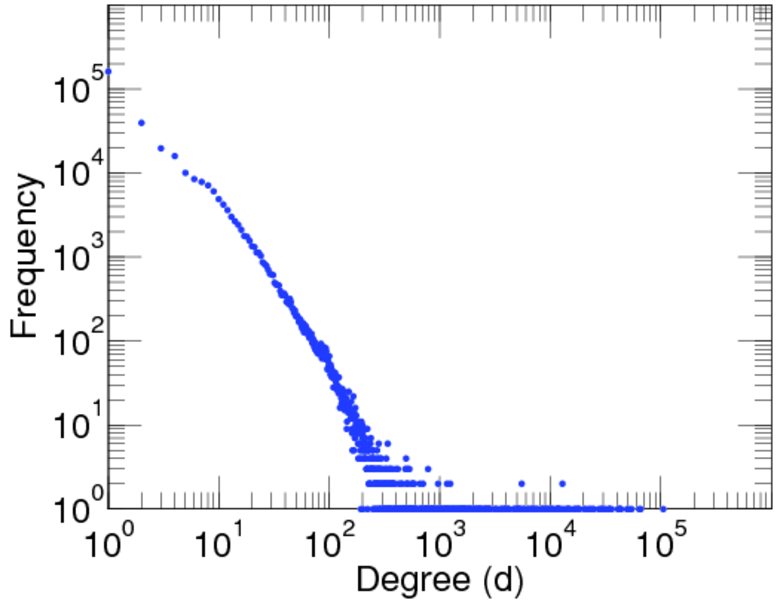
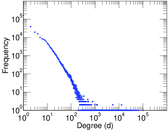
| Maximum degree | dmax = | 105,430
|
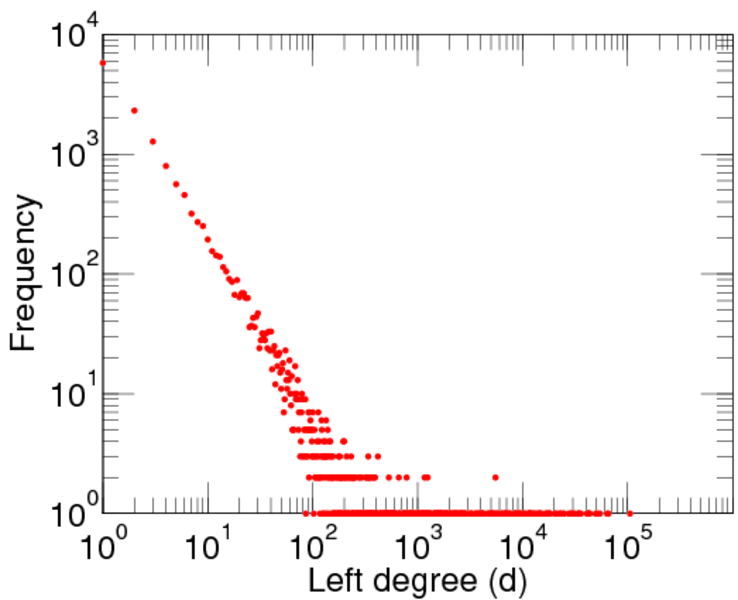
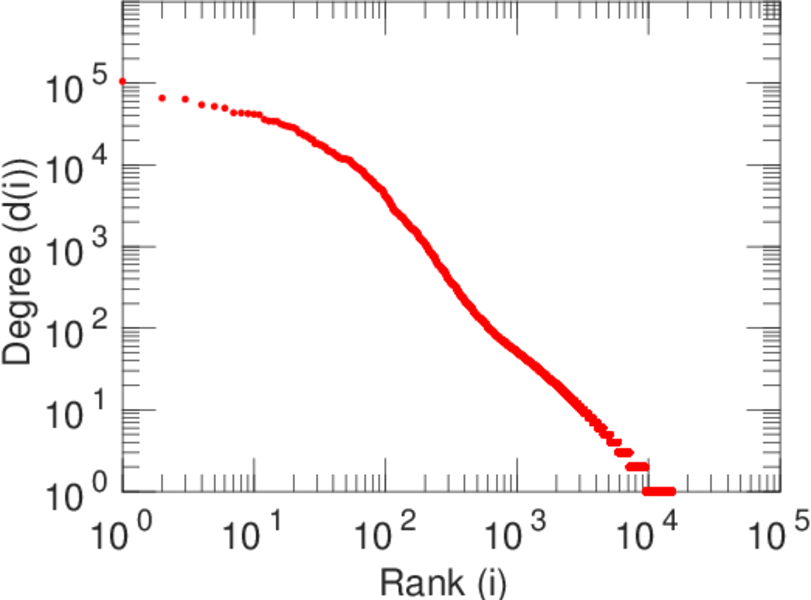
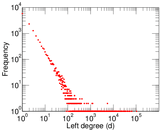
| Maximum left degree | d1max = | 105,430
|
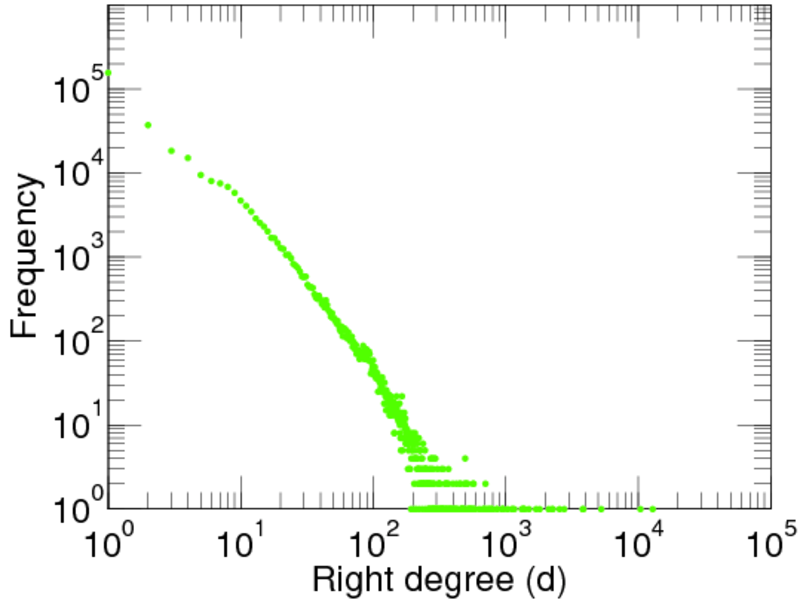
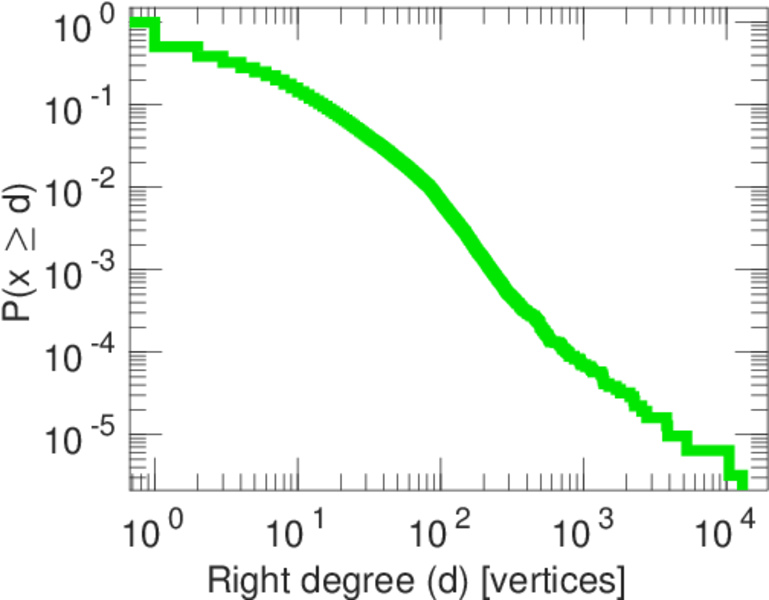
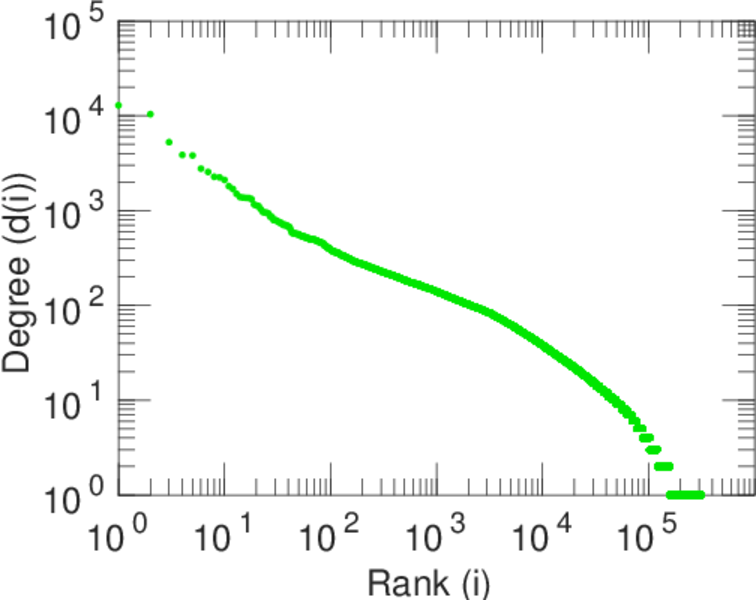
| Maximum right degree | d2max = | 12,881
|
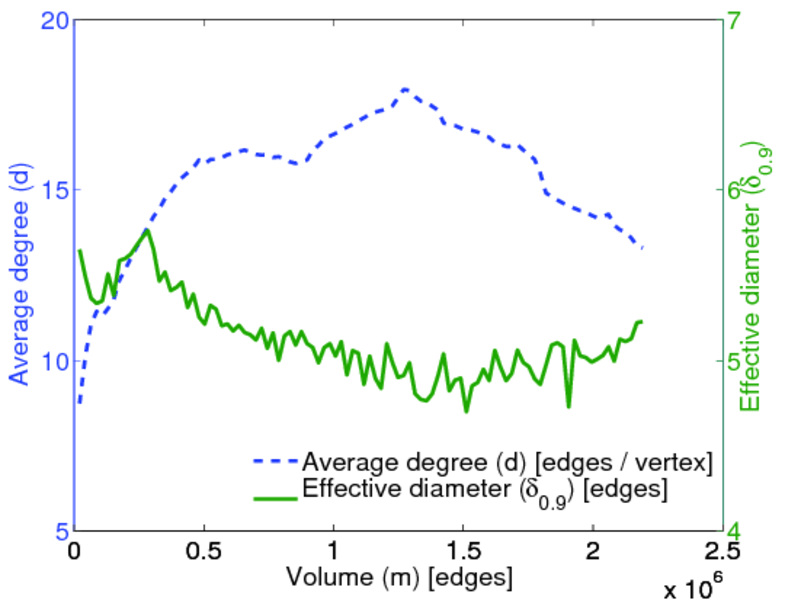
| Average degree | d = | 13.276 0
|
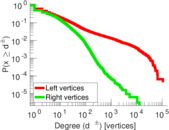
| Average left degree | d1 = | 143.685
|
| Average right degree | d2 = | 6.959 50
|
| Fill | p = | 0.000 204 849
|
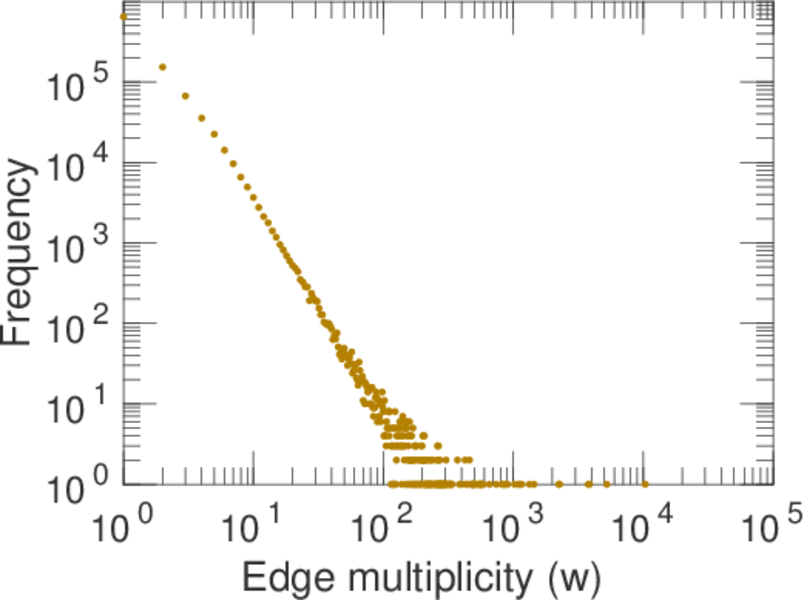
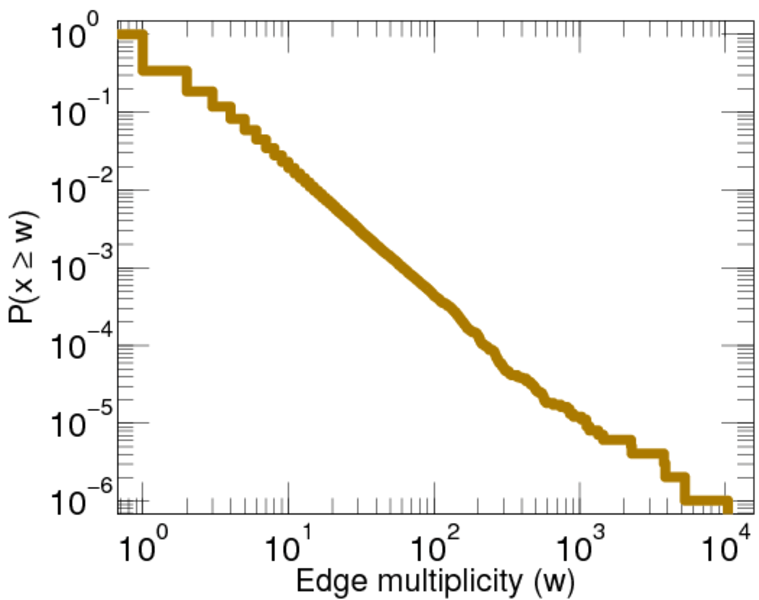
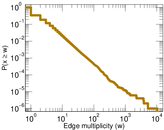
| Average edge multiplicity | m̃ = | 2.227 65
|
| Size of LCC | N = | 323,447
|
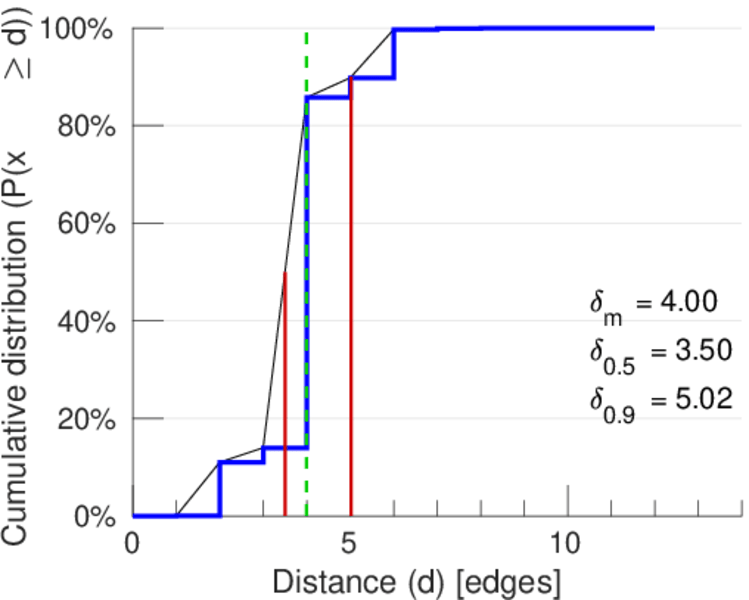
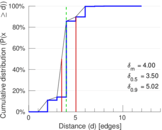
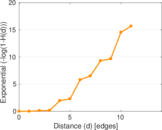
| Diameter | δ = | 14
|
| 50-Percentile effective diameter | δ0.5 = | 3.501 84
|
| 90-Percentile effective diameter | δ0.9 = | 5.022 05
|
| Median distance | δM = | 4
|
| Mean distance | δm = | 3.999 42
|
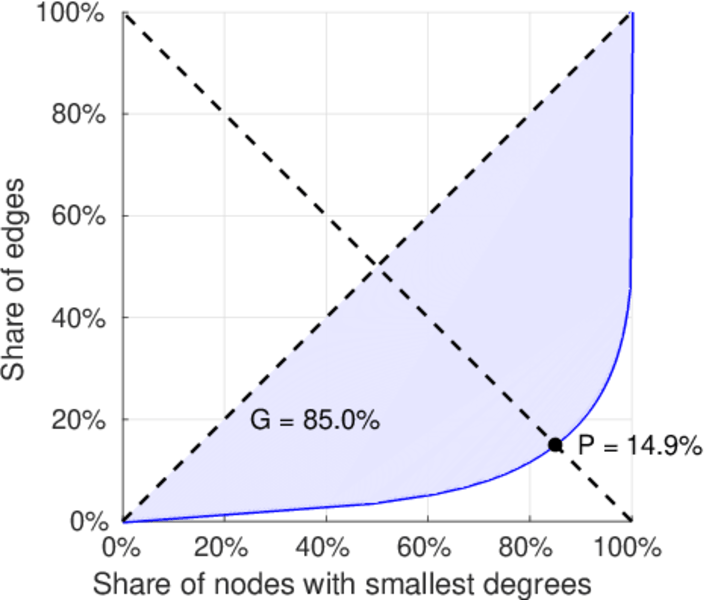
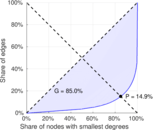
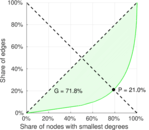
| Gini coefficient | G = | 0.853 277
|
| Balanced inequality ratio | P = | 0.149 418
|
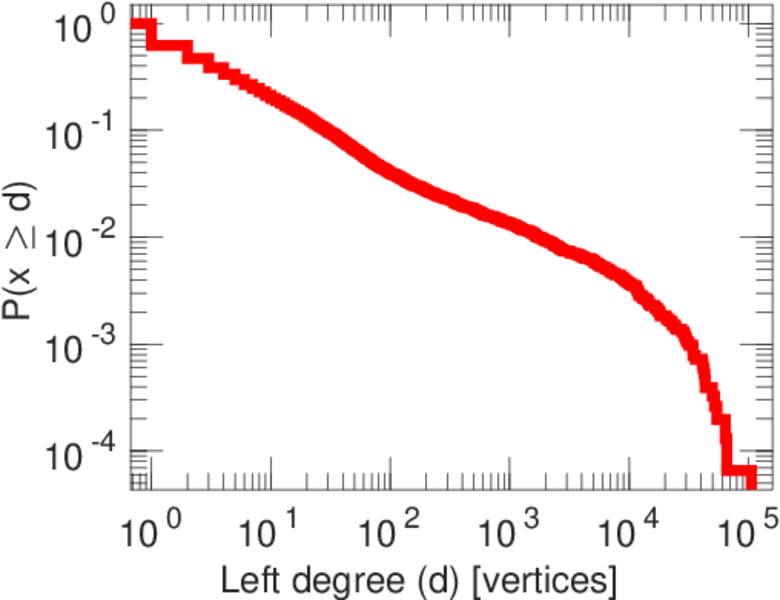
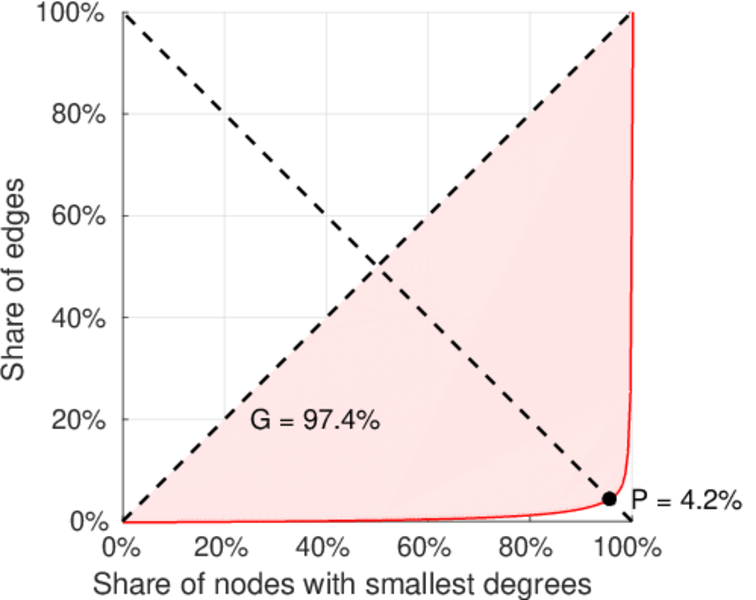
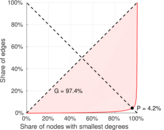
| Left balanced inequality ratio | P1 = | 0.042 493 2
|
| Right balanced inequality ratio | P2 = | 0.209 518
|
| Relative edge distribution entropy | Her = | 0.732 009
|
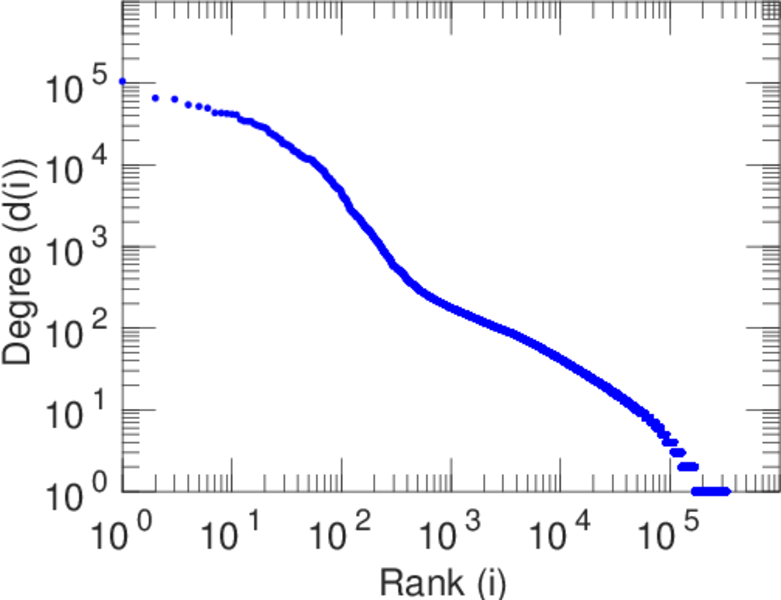
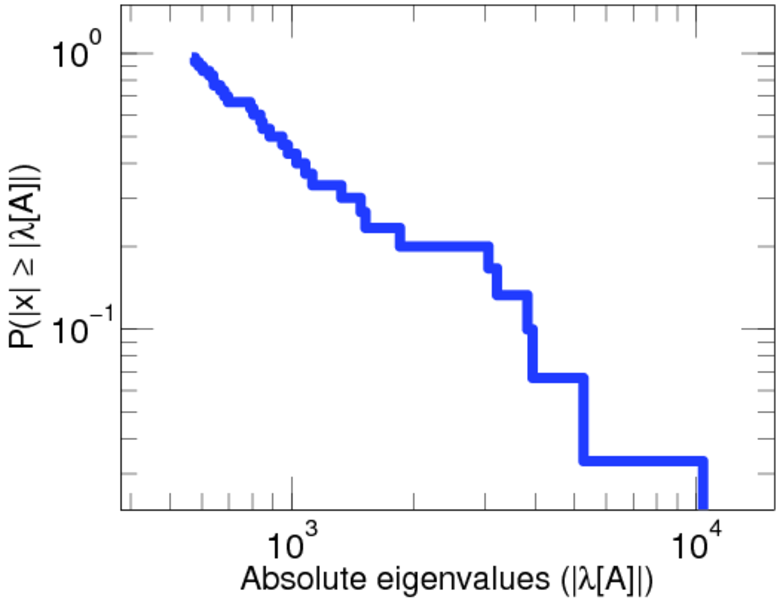
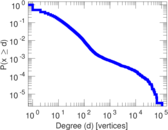
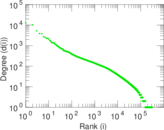
| Tail power law exponent | γt = | 1.961 00
|
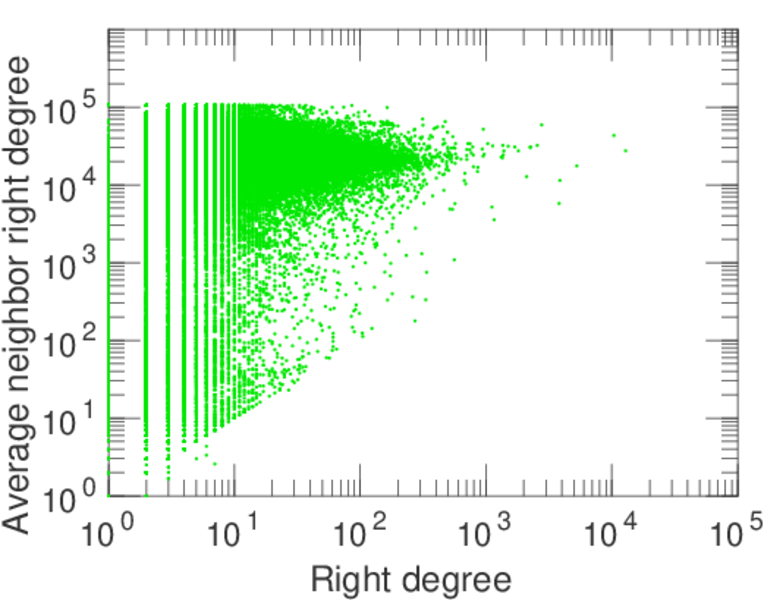
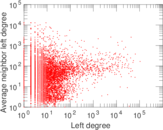
| Degree assortativity | ρ = | −0.201 063
|
| Degree assortativity p-value | pρ = | 0.000 00
|
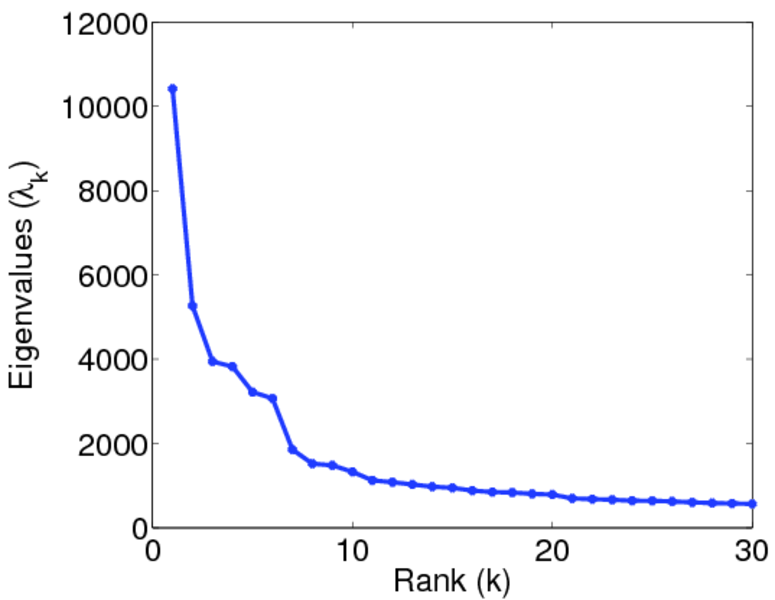
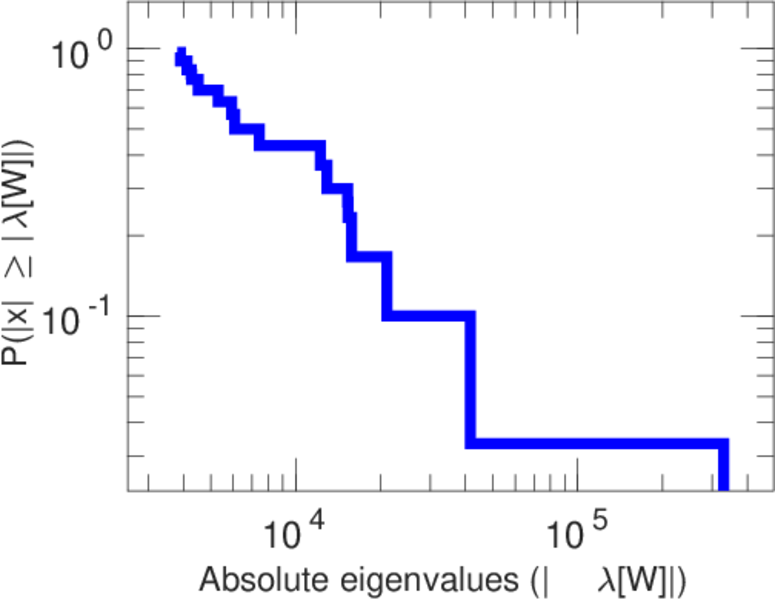
| Spectral norm | α = | 10,417.2
|
| Spectral separation | |λ1[A] / λ2[A]| = | 1.977 83
|
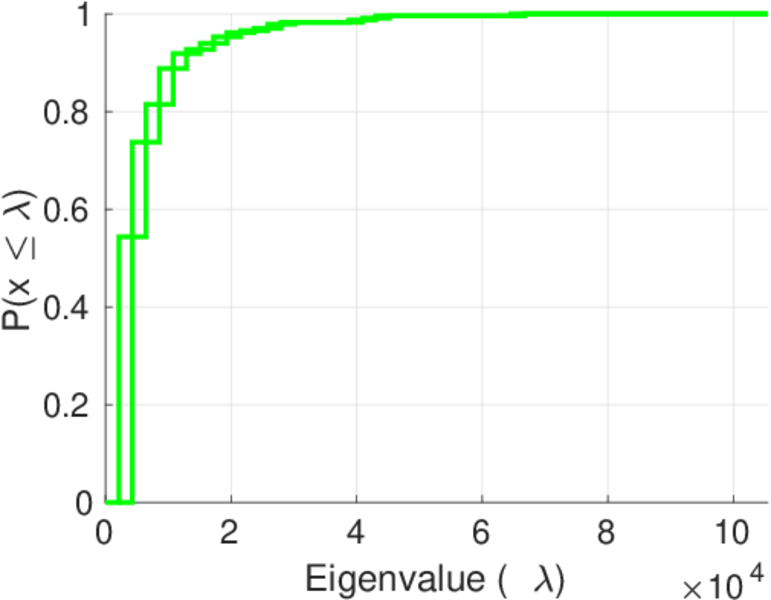
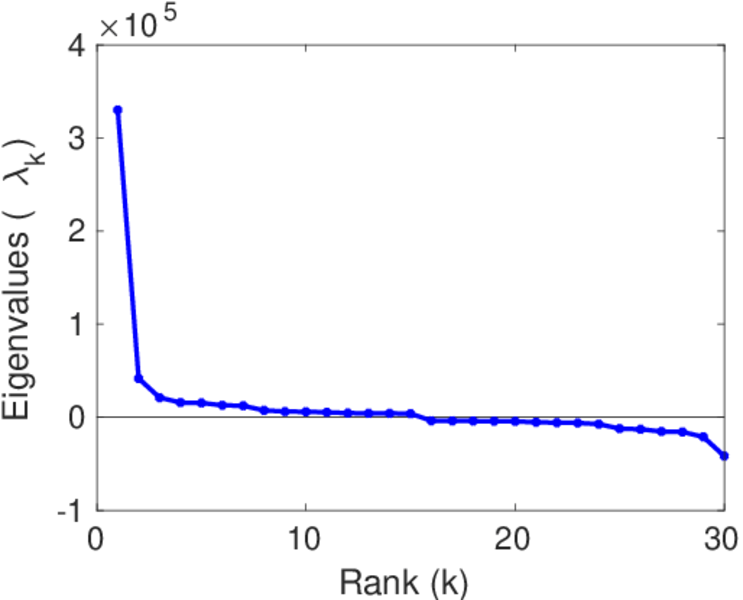
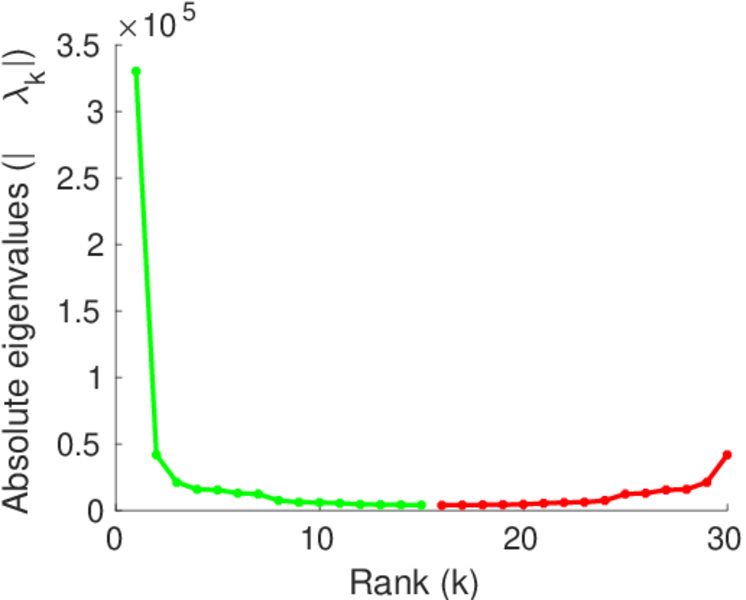
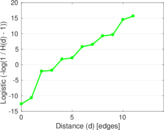
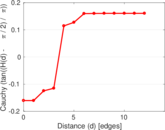
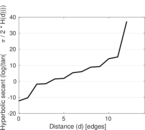
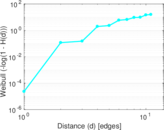
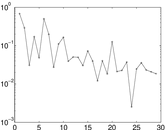
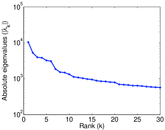
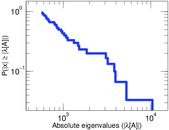
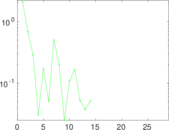
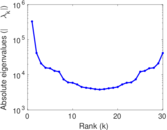
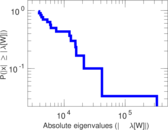
Plots


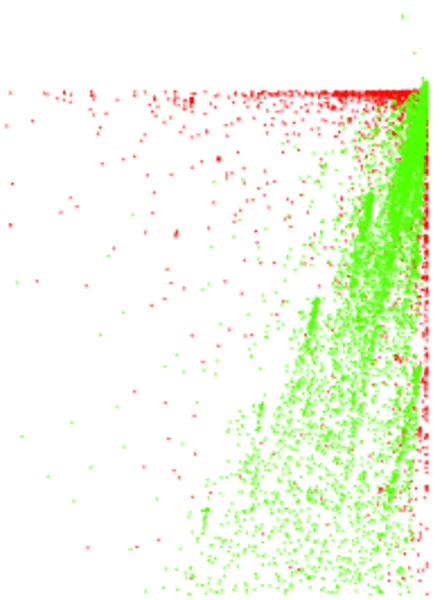
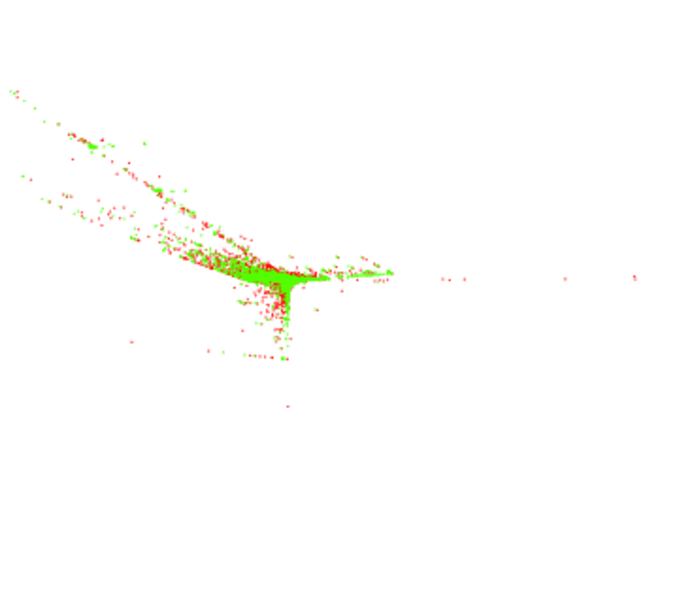
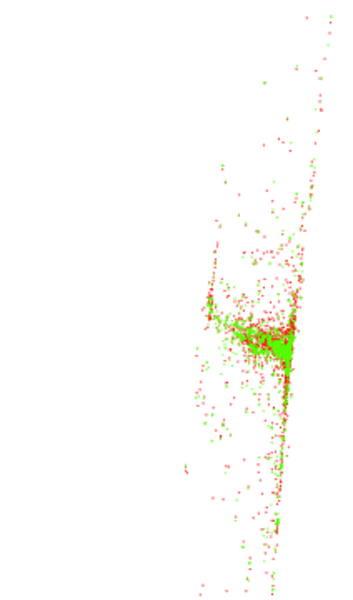
Matrix decompositions plots


Downloads
References
|
[1]
|
Jérôme Kunegis.
KONECT – The Koblenz Network Collection.
In Proc. Int. Conf. on World Wide Web Companion, pages
1343–1350, 2013.
[ http ]
|
|
[2]
|
Wikimedia Foundation.
Wikimedia downloads.
http://dumps.wikimedia.org/, January 2010.
|
 KONECT ‣ Networks ‣
Buy Me a Coffee
KONECT ‣ Networks ‣
Buy Me a Coffee