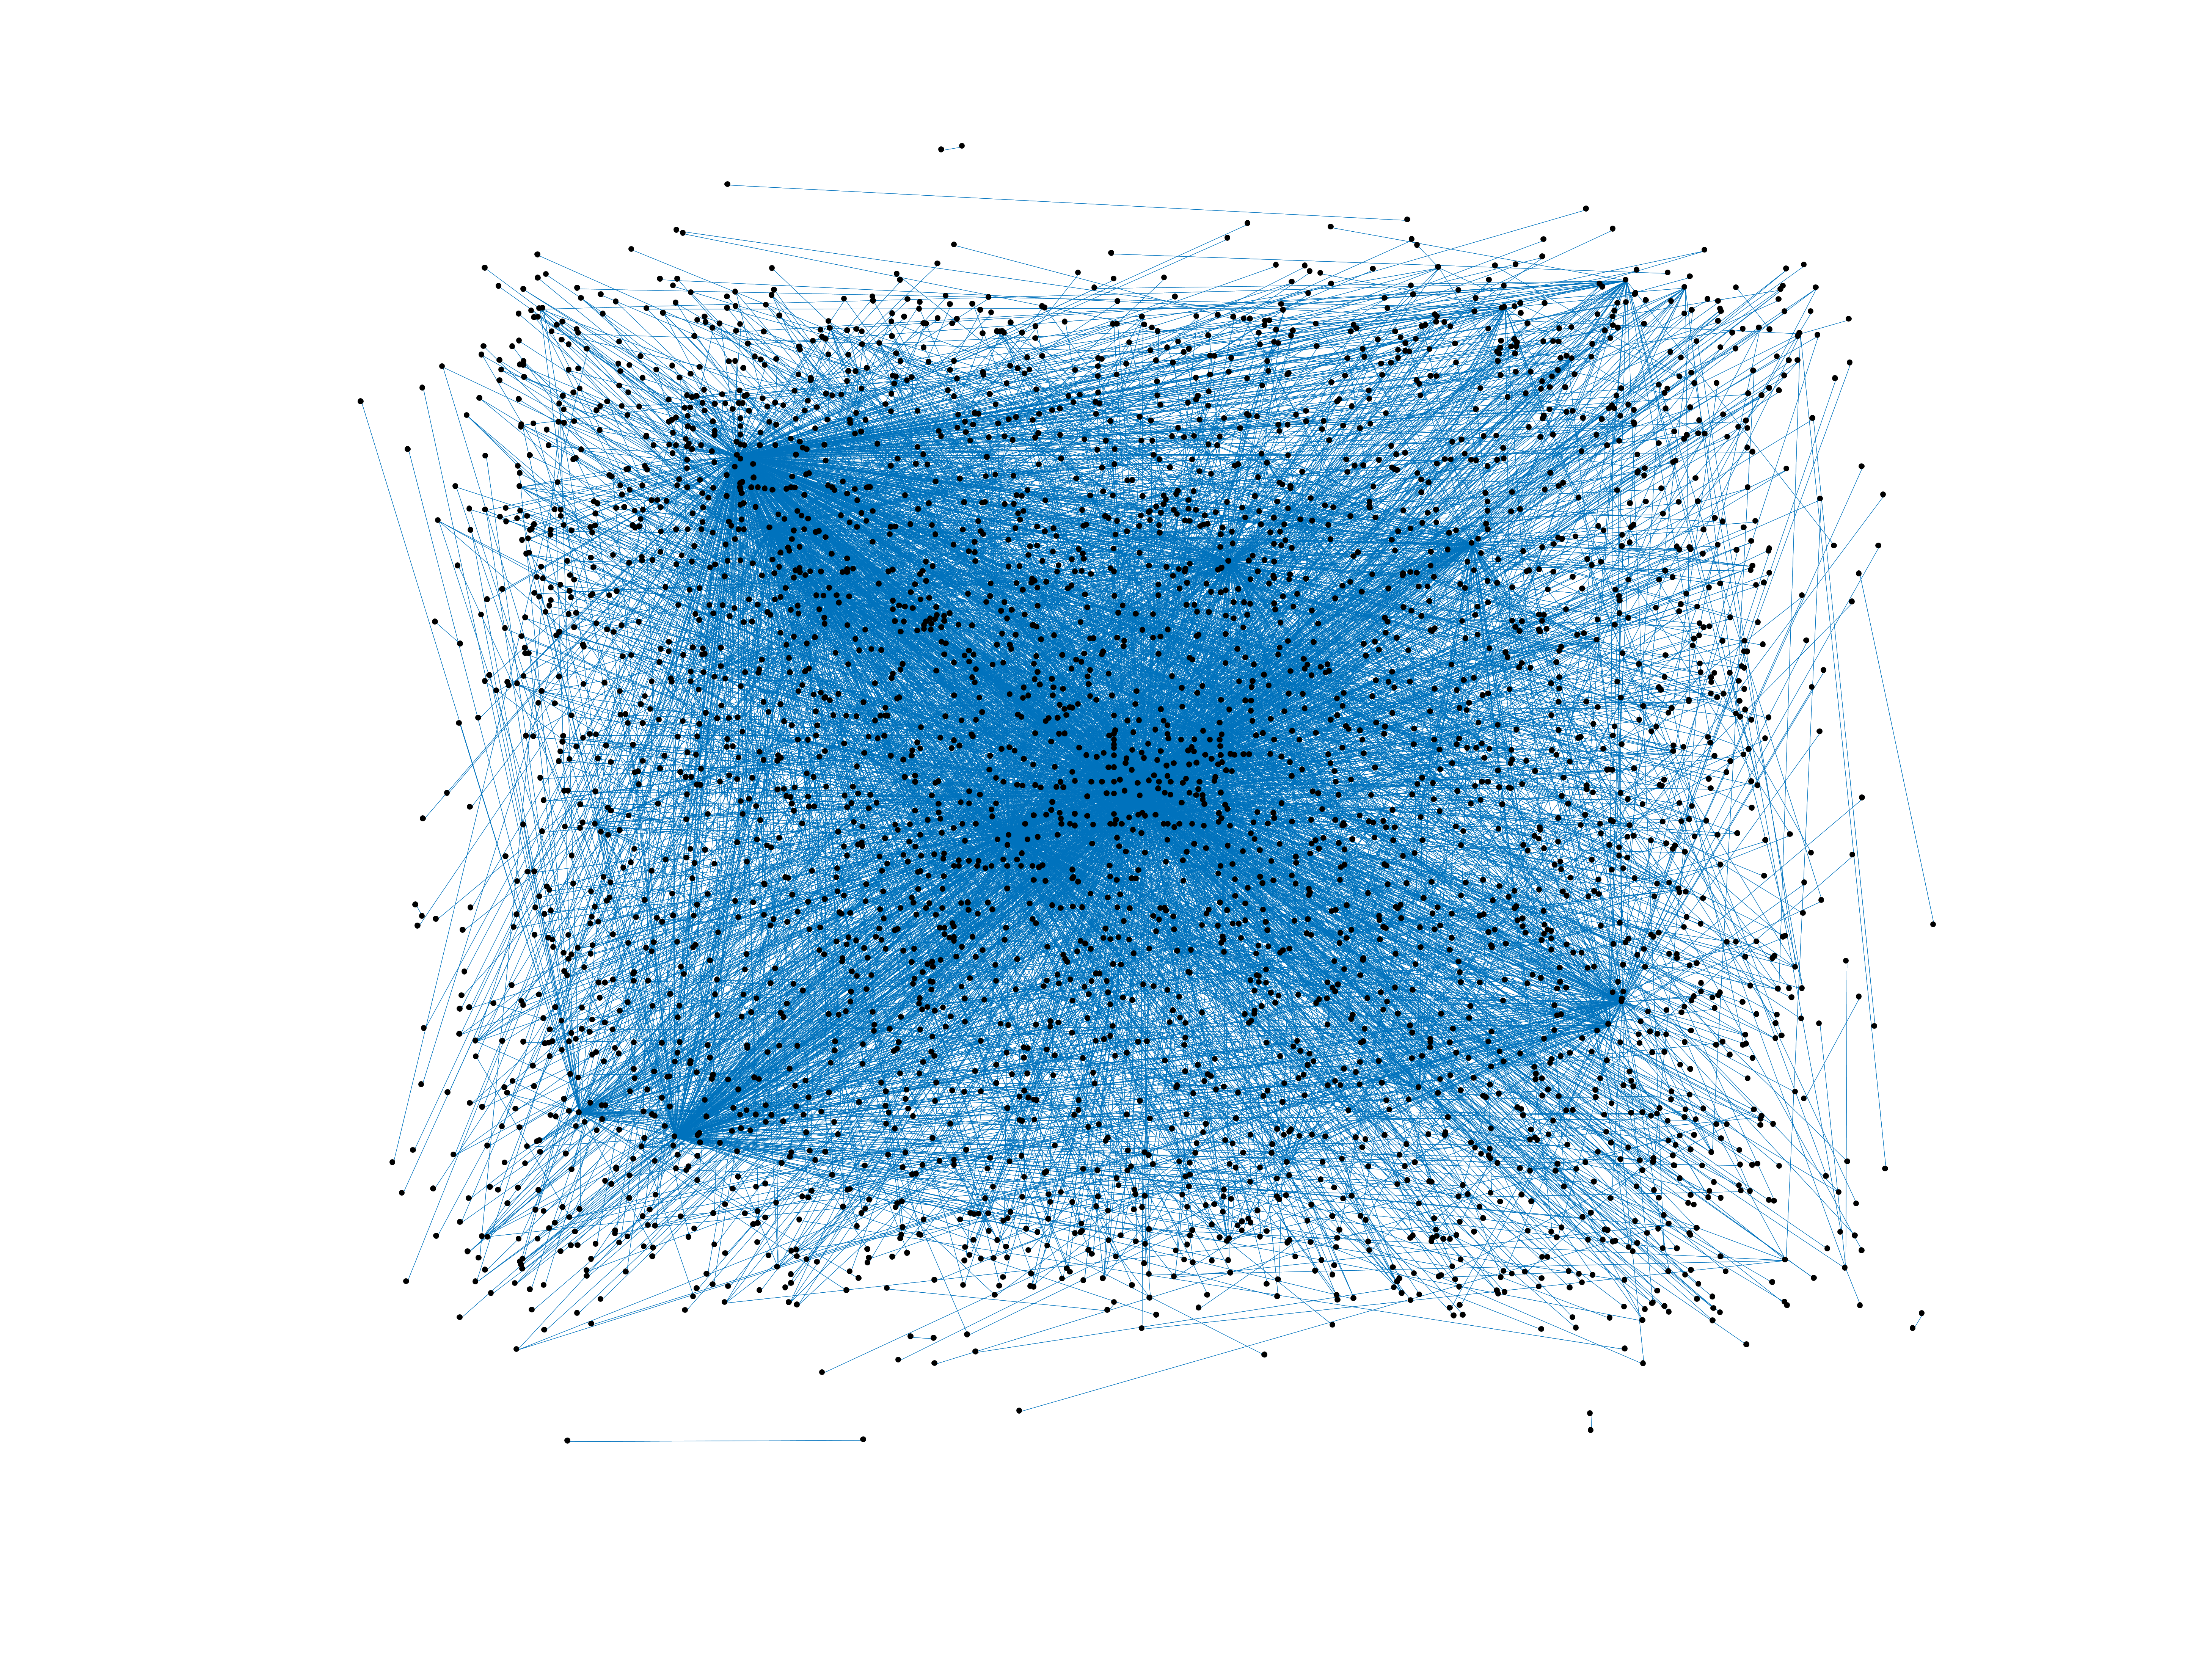
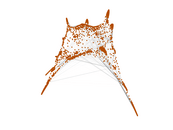
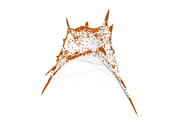
Wikibooks edits (ta)
This is the bipartite edit network of the Tamil Wikibooks. It contains users
and pages from the Tamil Wikibooks, connected by edit events. Each edge
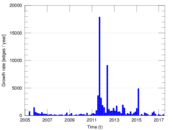
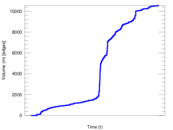
represents an edit. The dataset includes the timestamp of each edit.
Metadata
Statistics
| Size | n = | 3,873
|
| Left size | n1 = | 343
|
| Right size | n2 = | 3,530
|
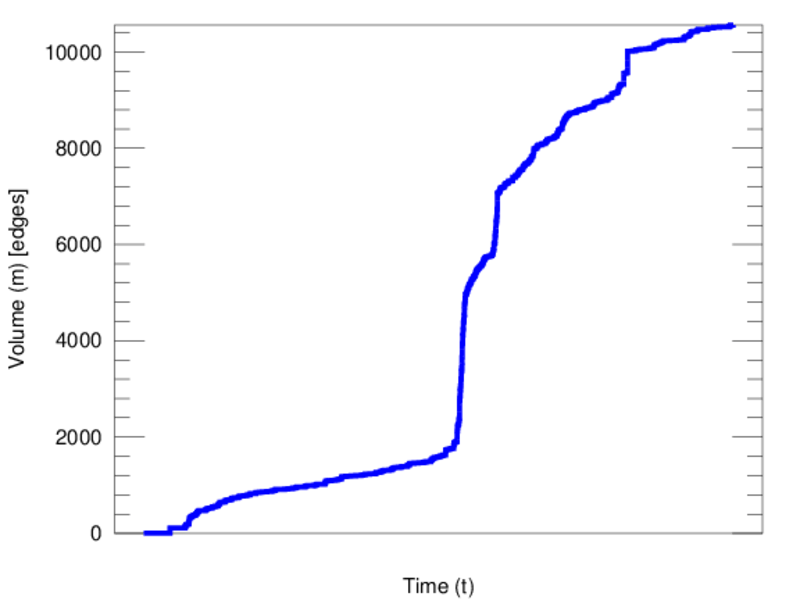
| Volume | m = | 10,561
|
| Unique edge count | m̿ = | 4,953
|
| Wedge count | s = | 699,834
|
| Claw count | z = | 104,364,912
|
| Cross count | x = | 13,529,504,700
|
| Square count | q = | 44,953
|
| 4-Tour count | T4 = | 3,169,878
|
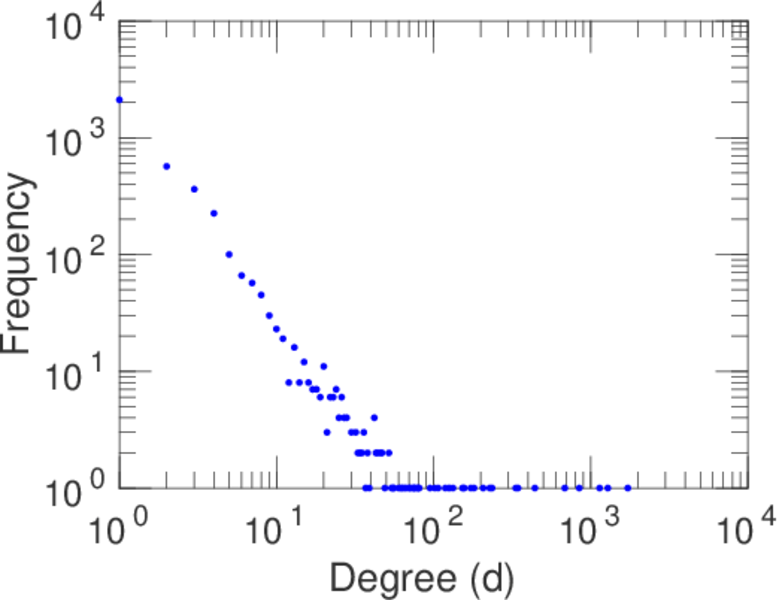
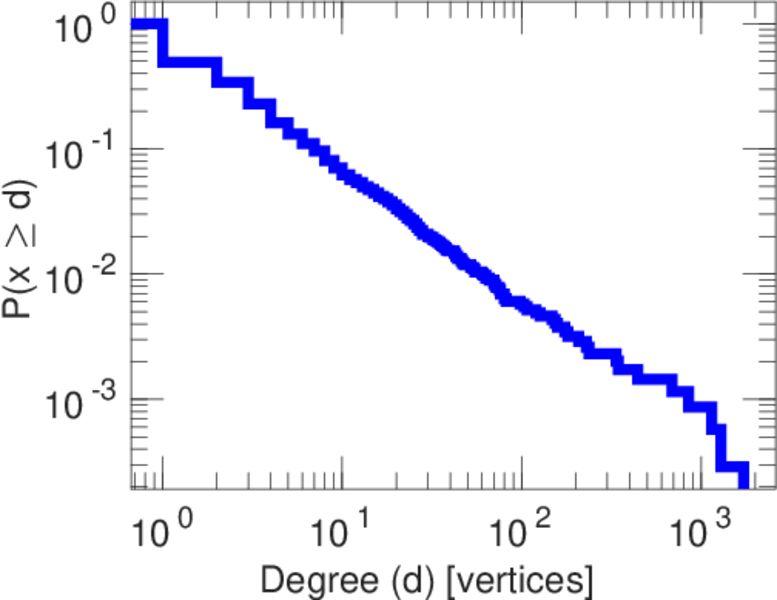
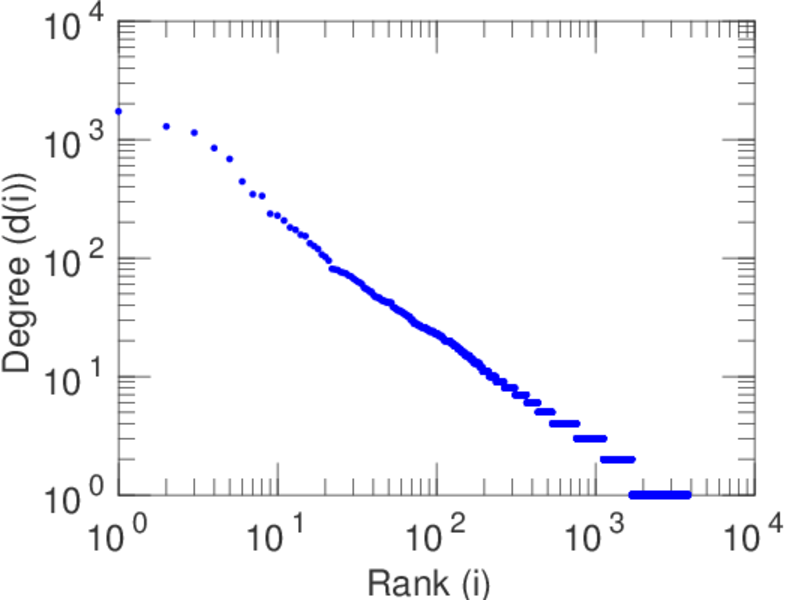
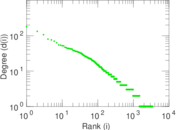
| Maximum degree | dmax = | 1,726
|
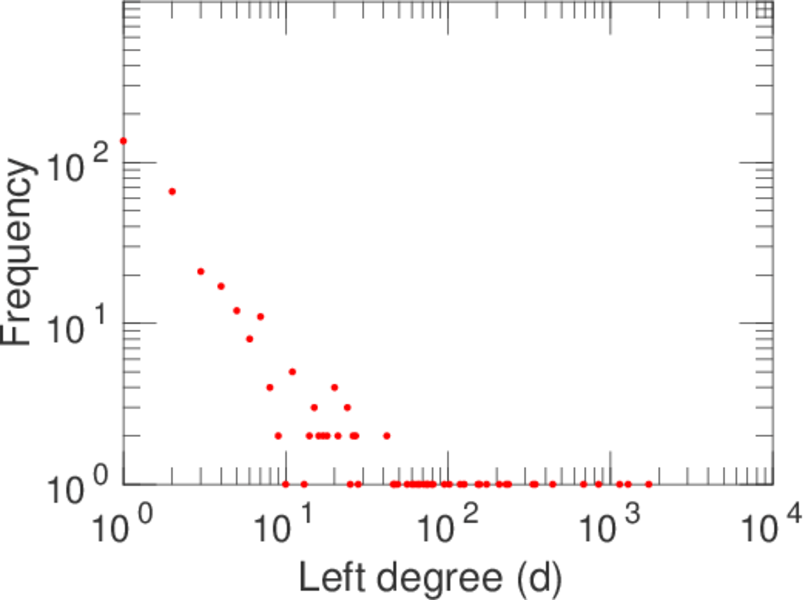
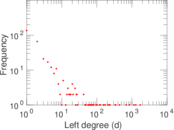
| Maximum left degree | d1max = | 1,726
|
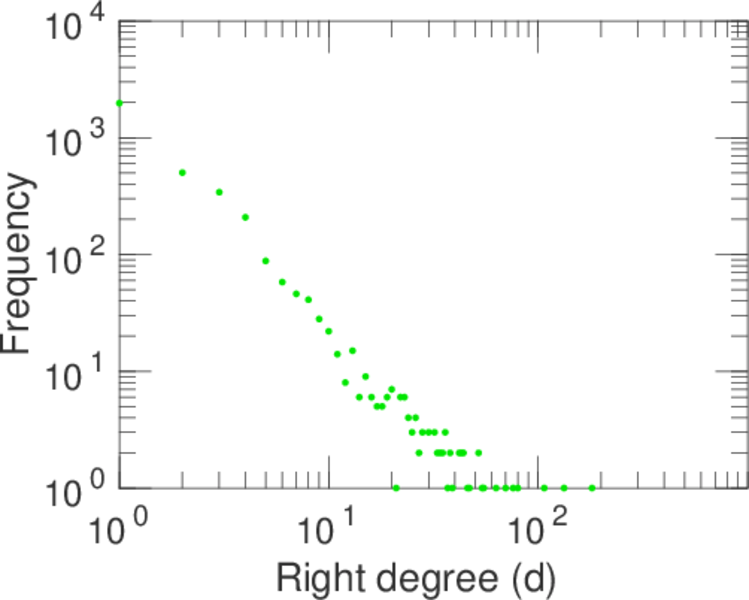
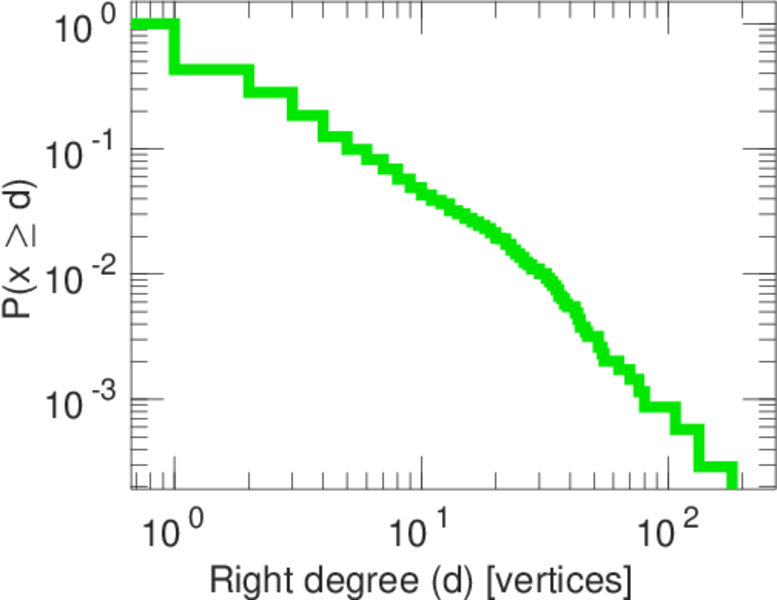
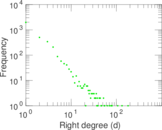
| Maximum right degree | d2max = | 181
|
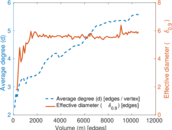
| Average degree | d = | 5.453 65
|
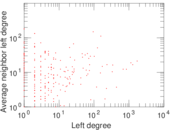
| Average left degree | d1 = | 30.790 1
|
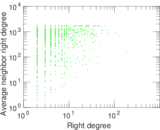
| Average right degree | d2 = | 2.991 78
|
| Fill | p = | 0.004 090 72
|
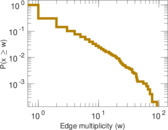
| Average edge multiplicity | m̃ = | 2.132 24
|
| Size of LCC | N = | 3,485
|
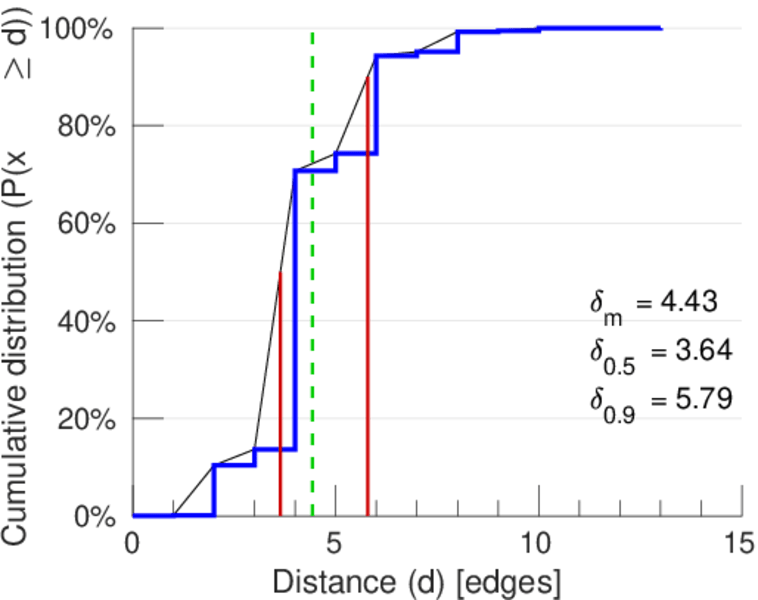
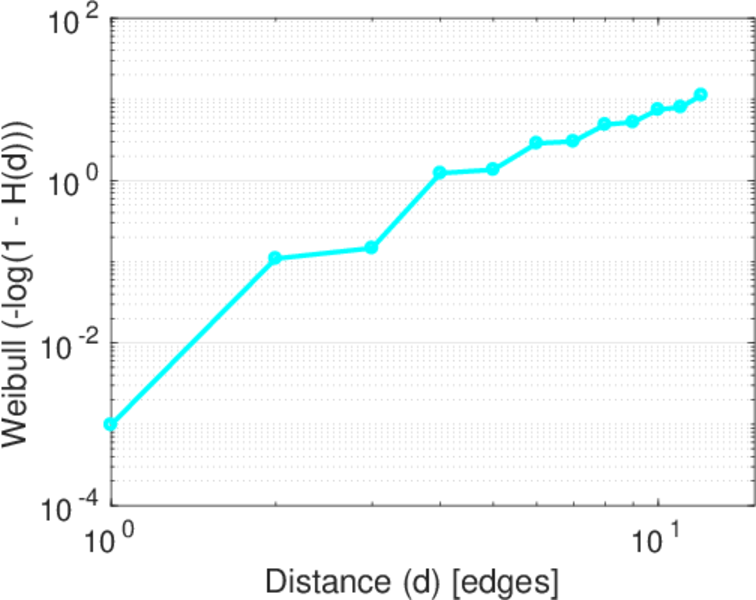
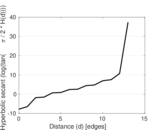
| Diameter | δ = | 14
|
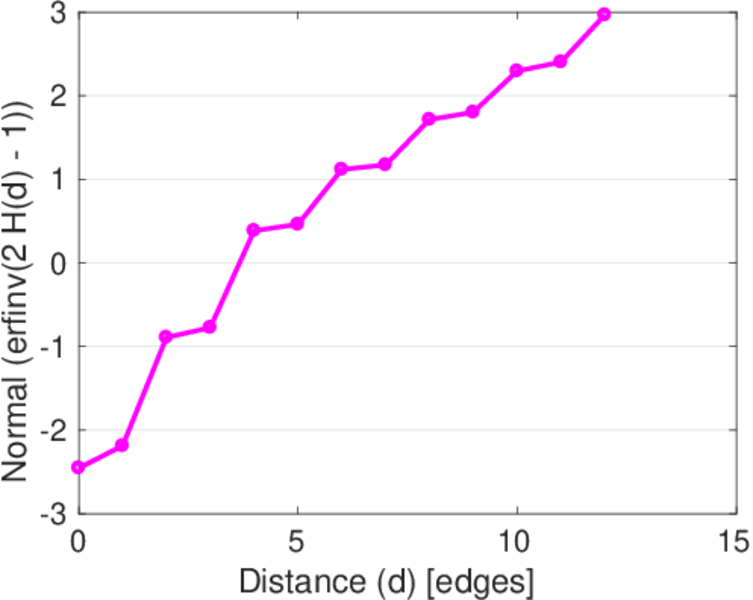
| 50-Percentile effective diameter | δ0.5 = | 3.637 01
|
| 90-Percentile effective diameter | δ0.9 = | 5.785 41
|
| Median distance | δM = | 4
|
| Mean distance | δm = | 4.428 67
|
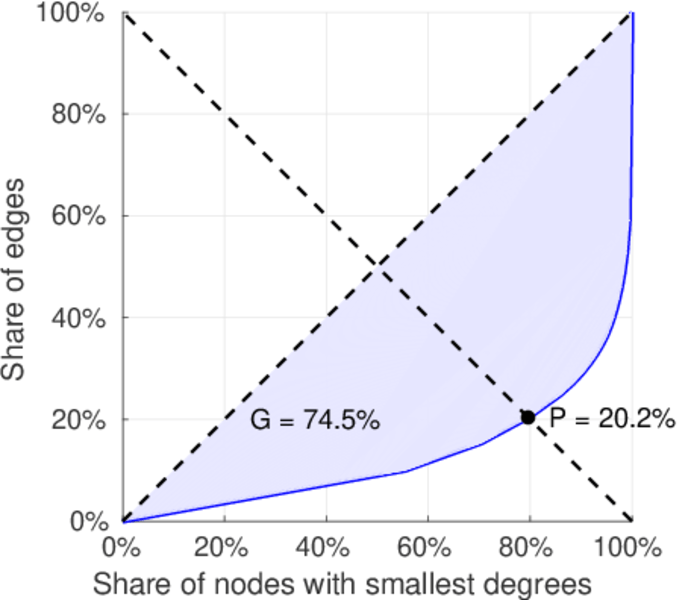
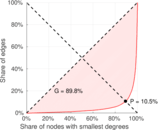
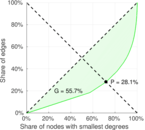
| Gini coefficient | G = | 0.749 863
|
| Balanced inequality ratio | P = | 0.202 774
|
| Left balanced inequality ratio | P1 = | 0.104 725
|
| Right balanced inequality ratio | P2 = | 0.280 939
|
| Relative edge distribution entropy | Her = | 0.789 996
|
| Power law exponent | γ = | 4.381 56
|
| Tail power law exponent | γt = | 2.481 00
|
| Tail power law exponent with p | γ3 = | 2.481 00
|
| p-value | p = | 0.000 00
|
| Left tail power law exponent with p | γ3,1 = | 1.751 00
|
| Left p-value | p1 = | 0.009 000 00
|
| Right tail power law exponent with p | γ3,2 = | 3.751 00
|
| Right p-value | p2 = | 0.470 000
|
| Degree assortativity | ρ = | −0.124 453
|
| Degree assortativity p-value | pρ = | 1.486 13 × 10−18
|
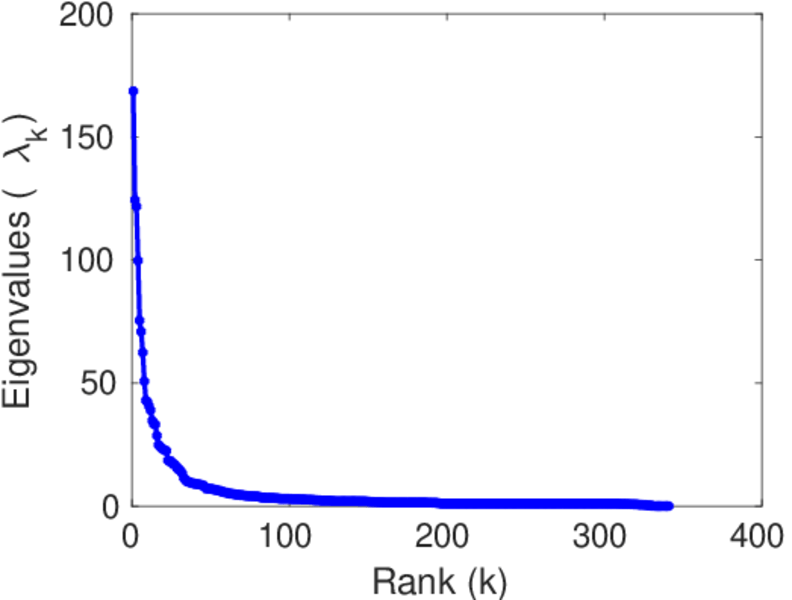
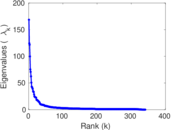
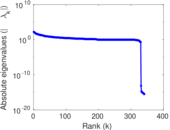
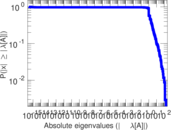
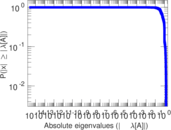
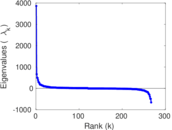
| Spectral norm | α = | 168.576
|
| Algebraic connectivity | a = | 0.018 891 4
|
| Spectral separation | |λ1[A] / λ2[A]| = | 1.355 68
|
| Controllability | C = | 3,140
|
| Relative controllability | Cr = | 0.826 316
|
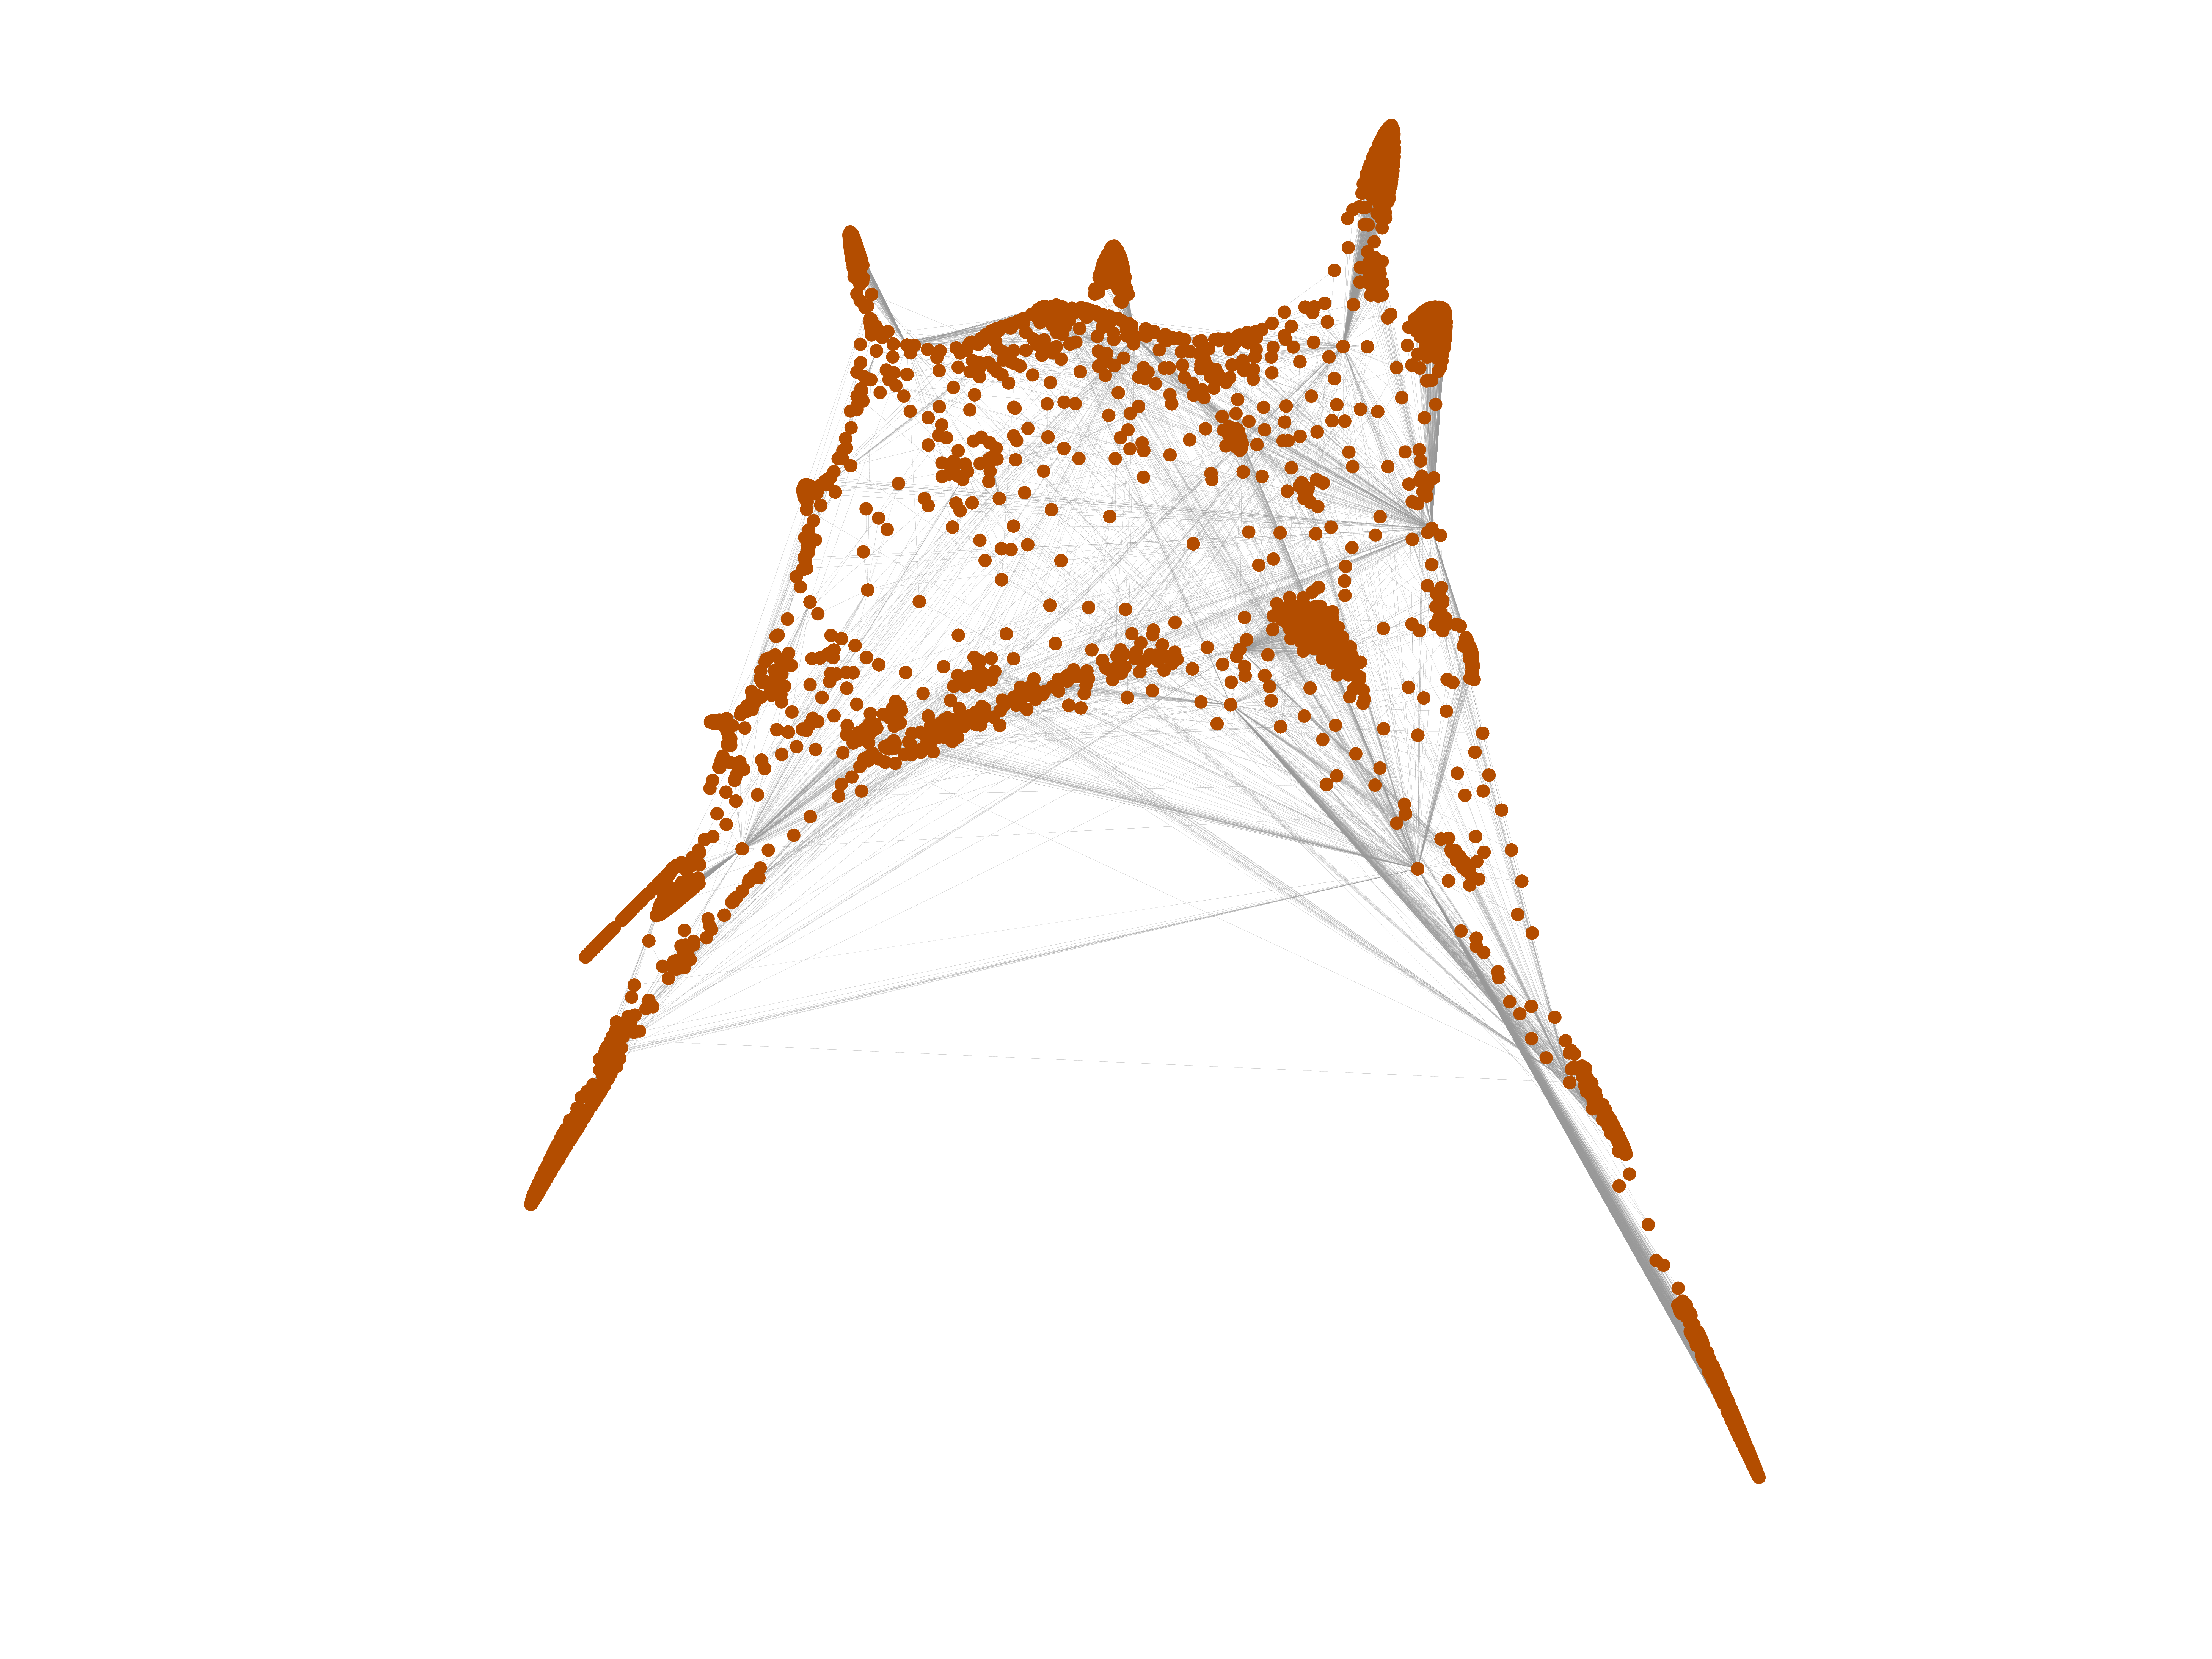
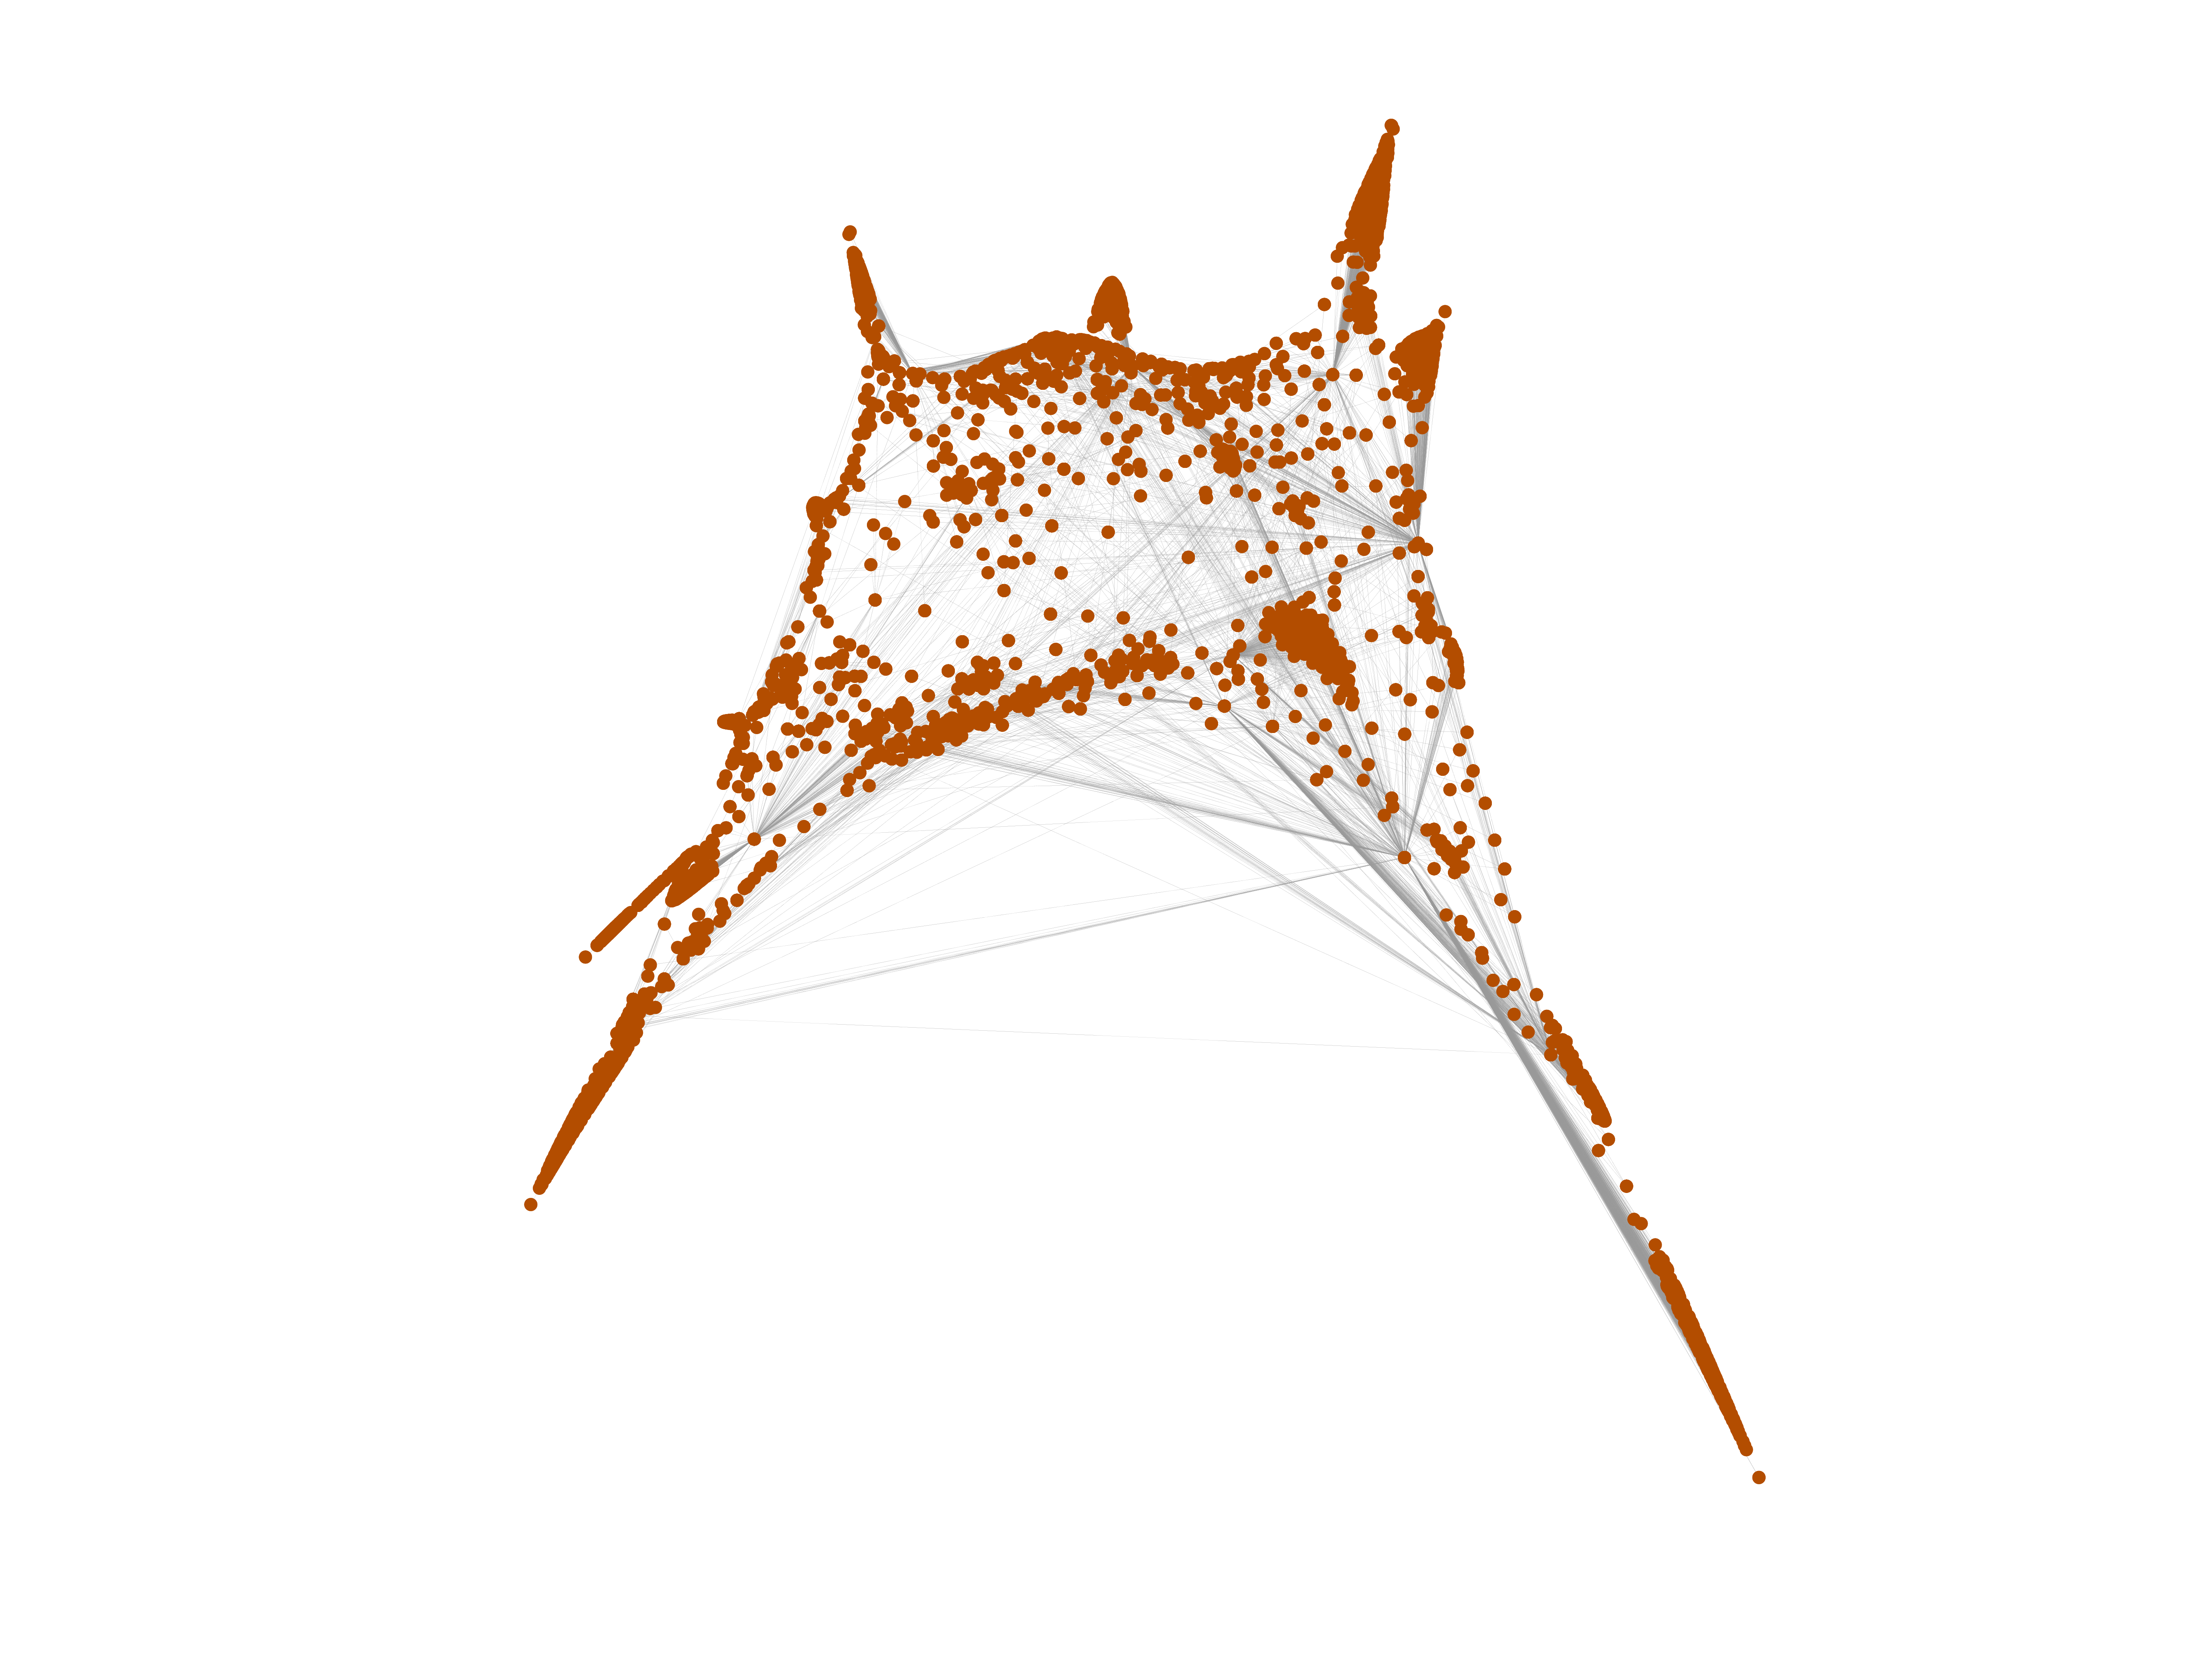
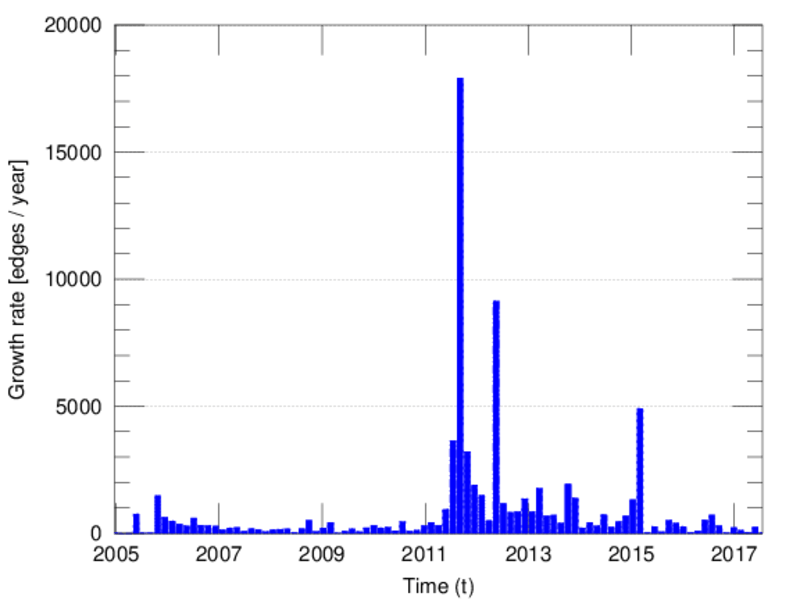
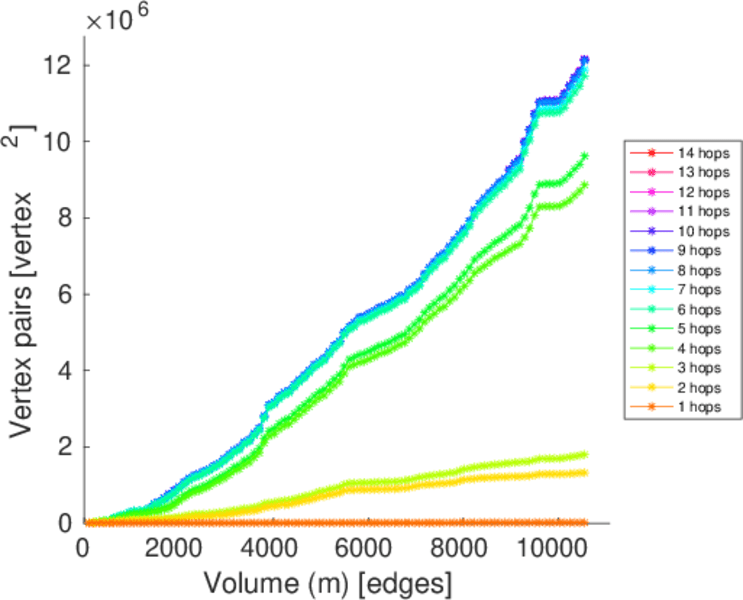
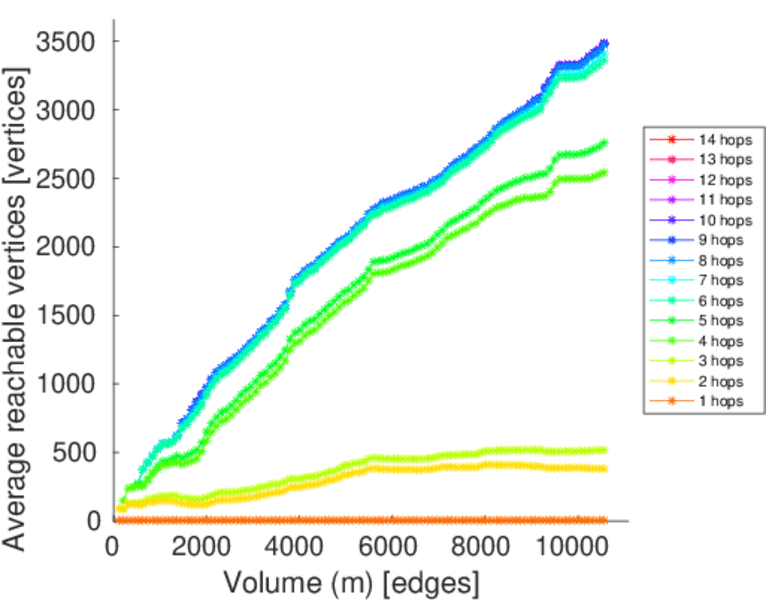
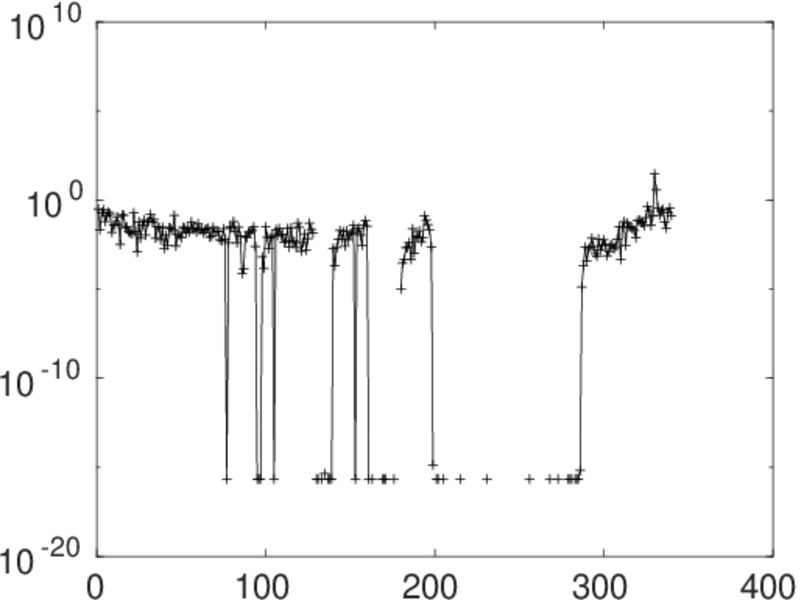
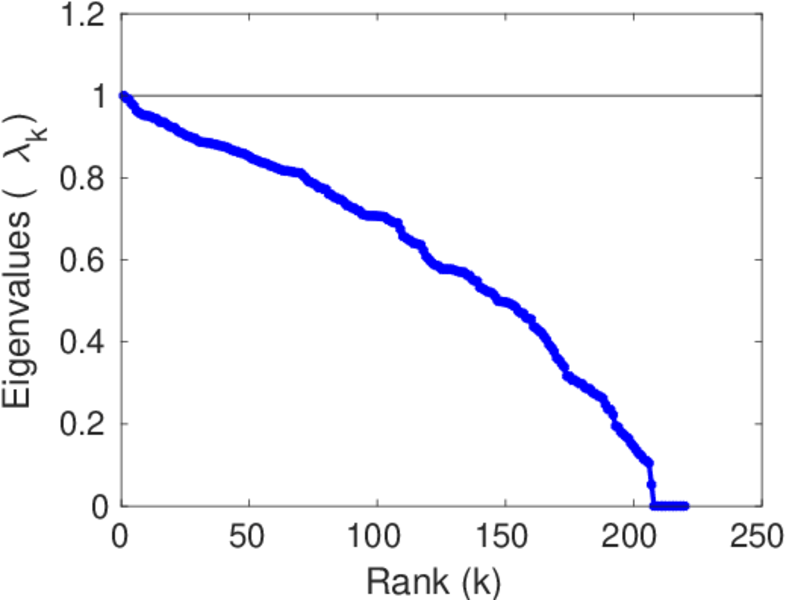
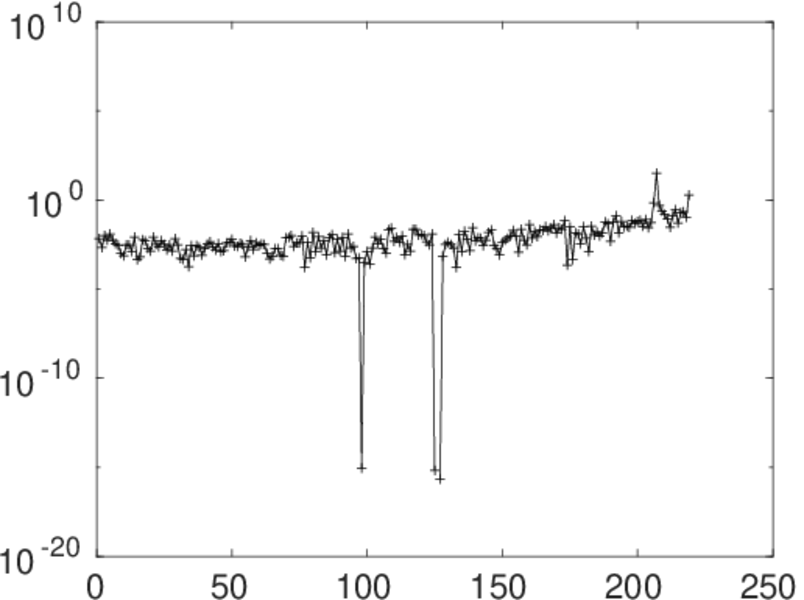
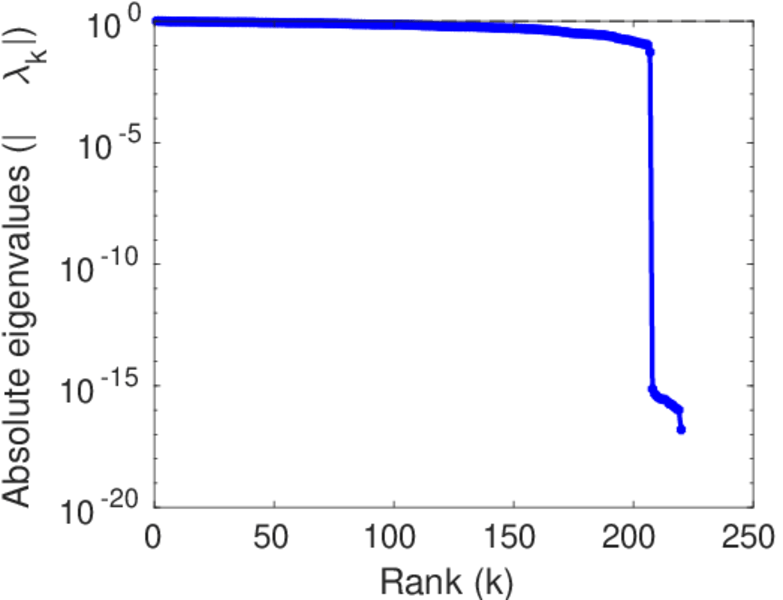
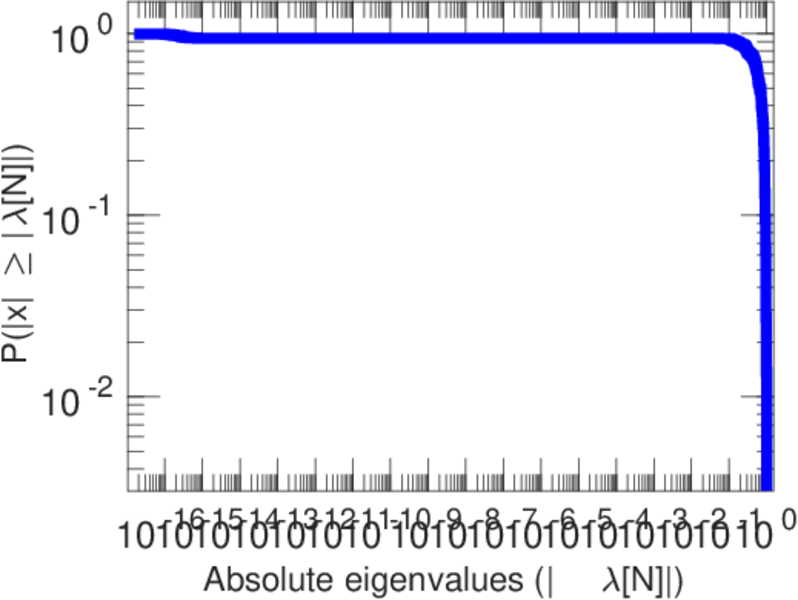
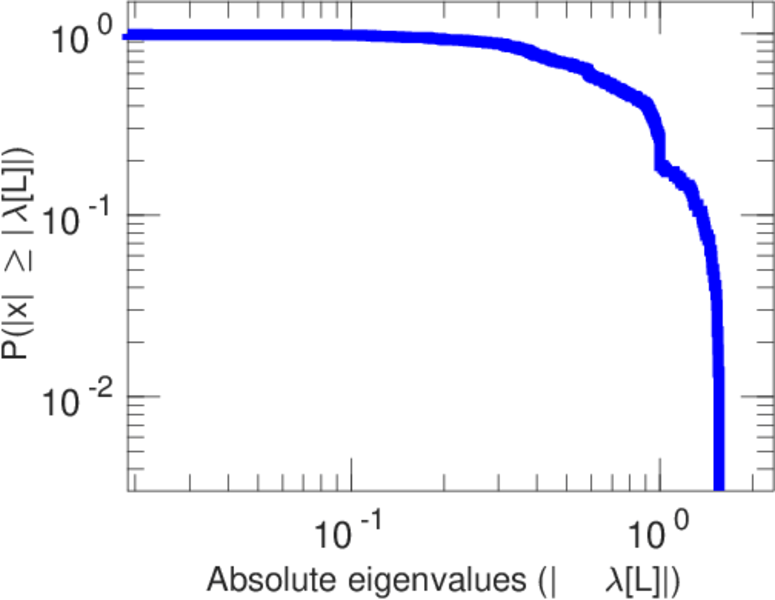
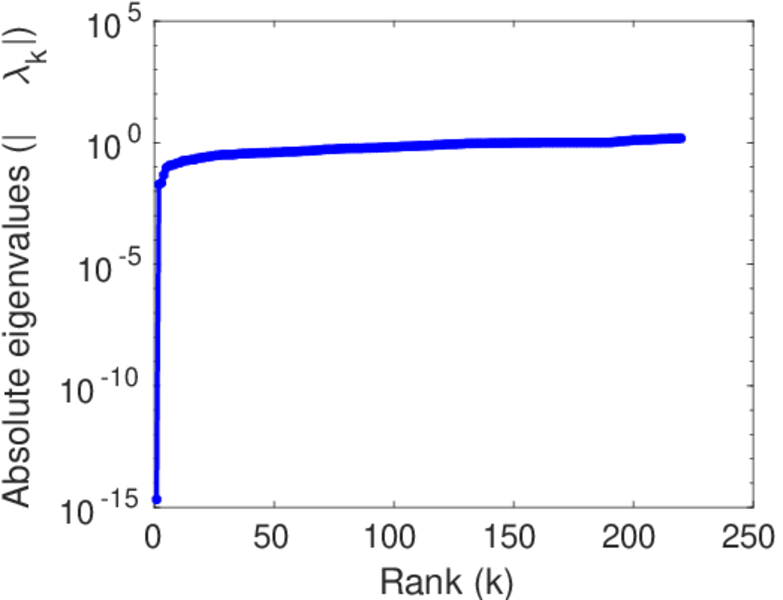
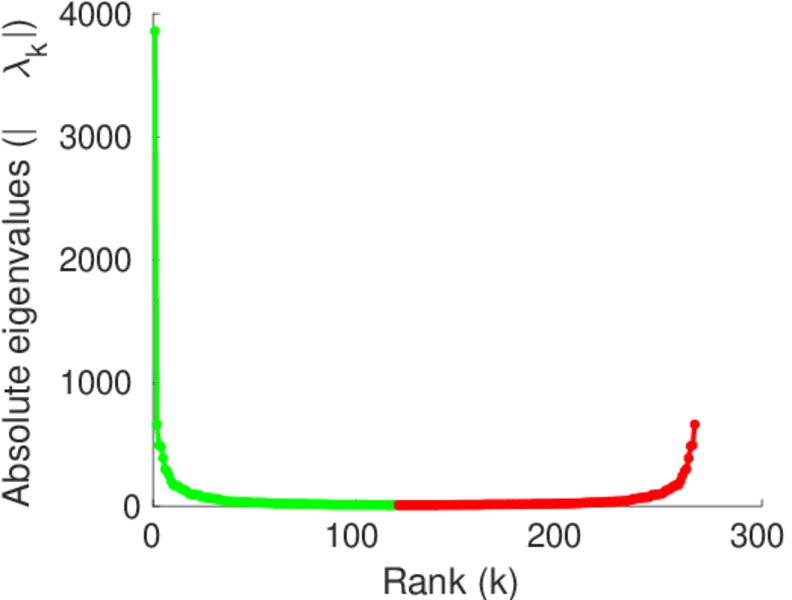
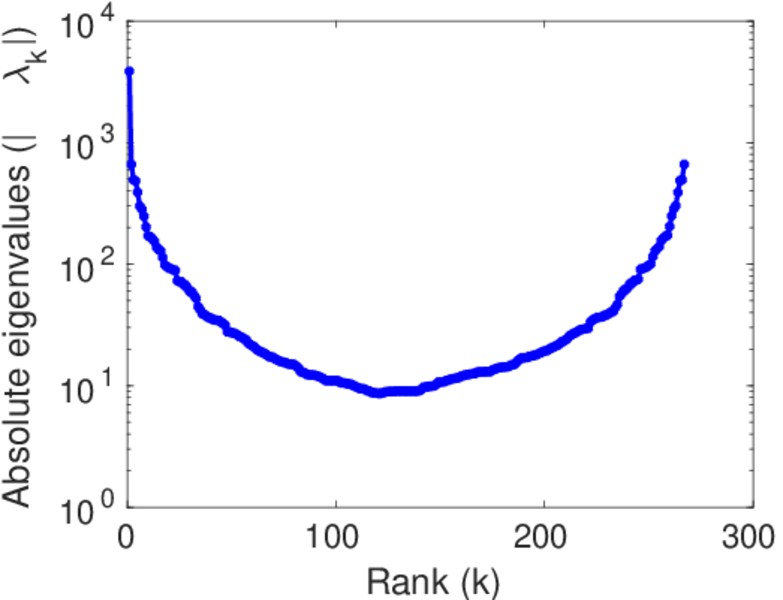
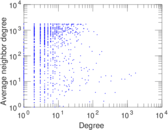
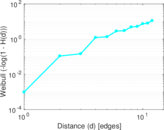
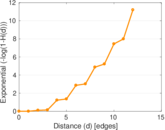
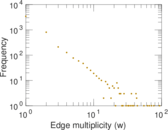
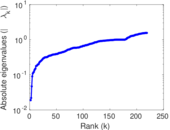
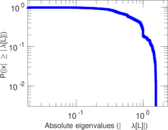
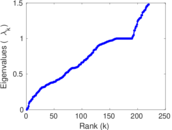
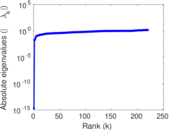
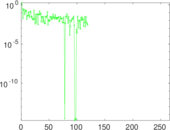
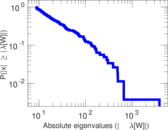
Plots


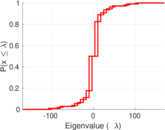
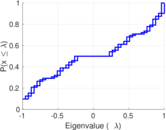
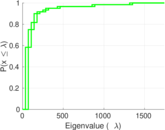


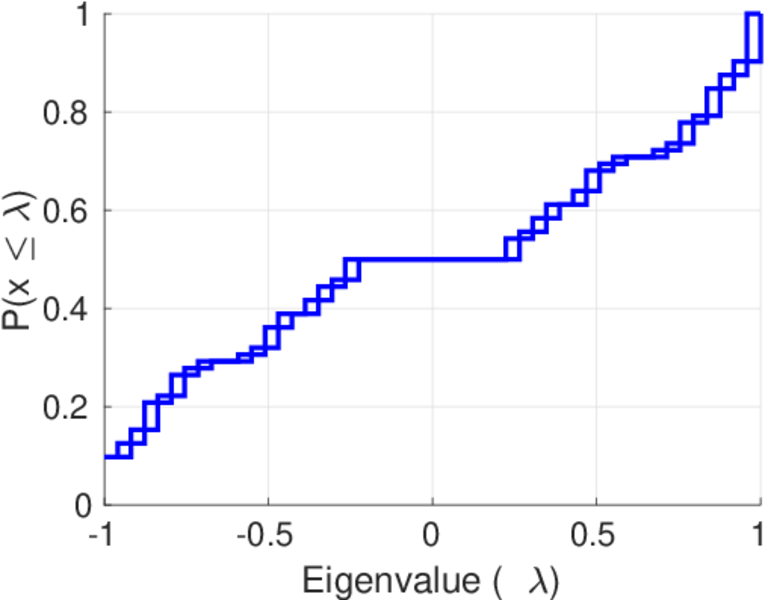
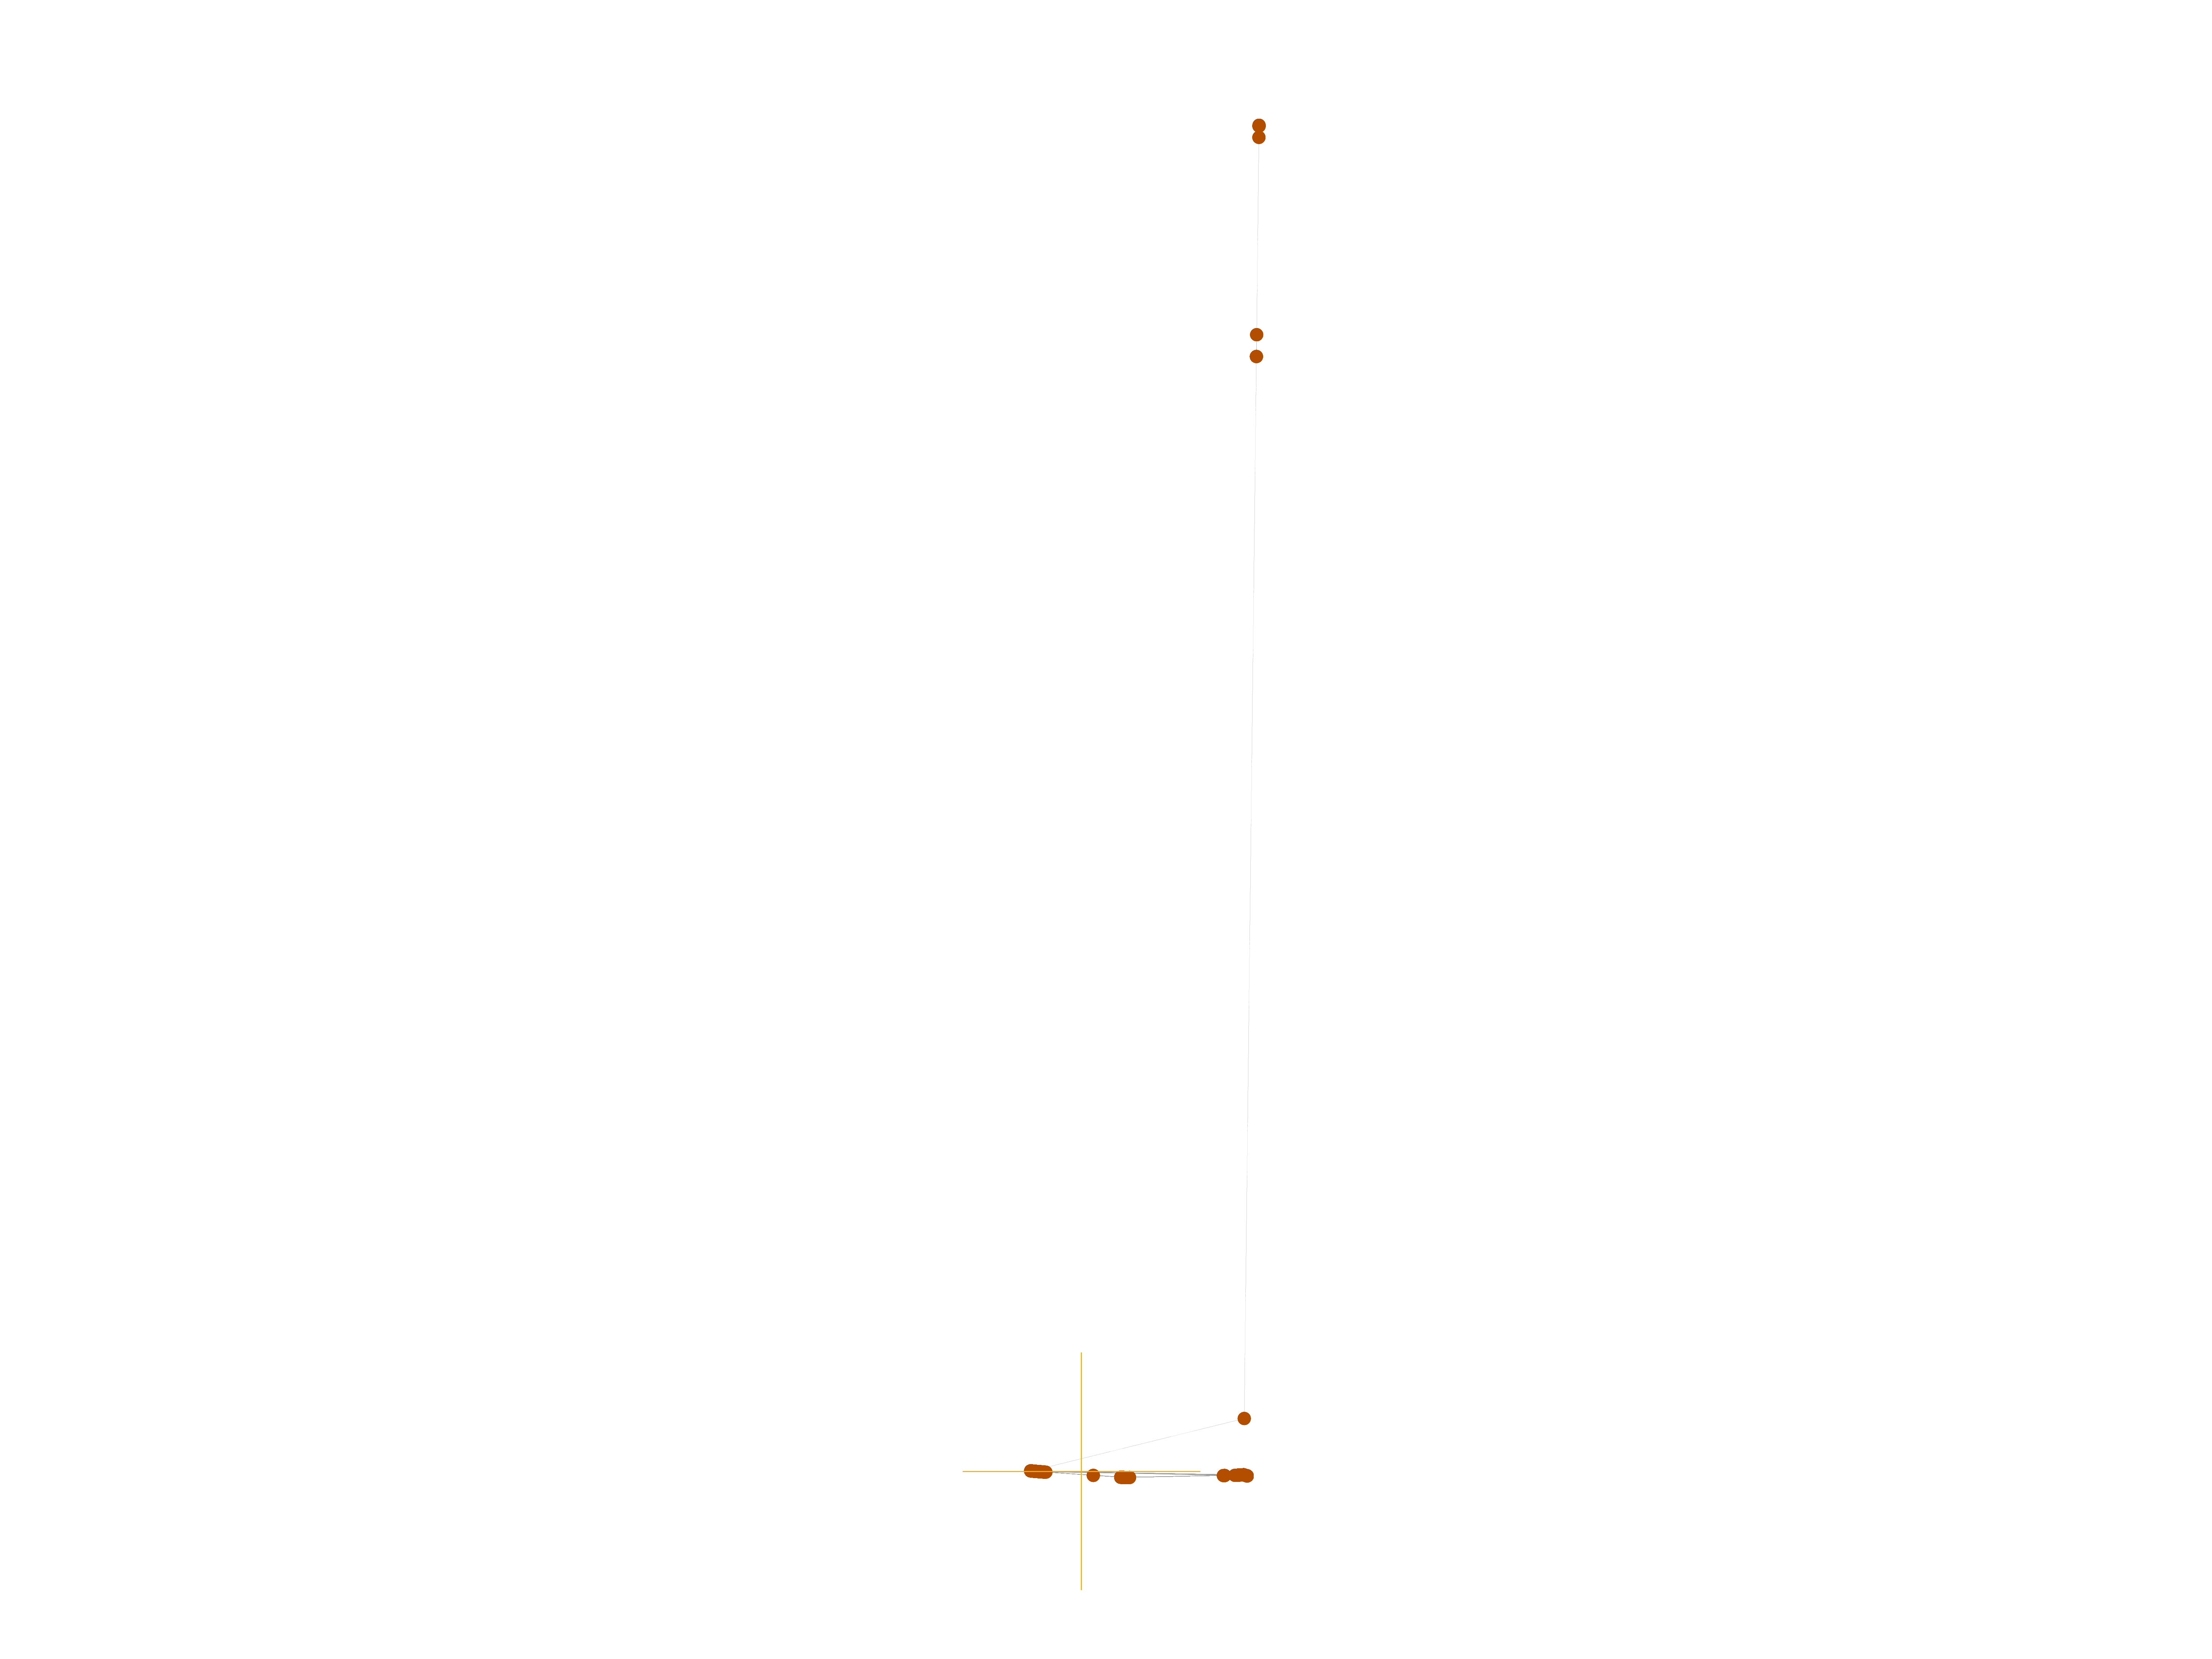
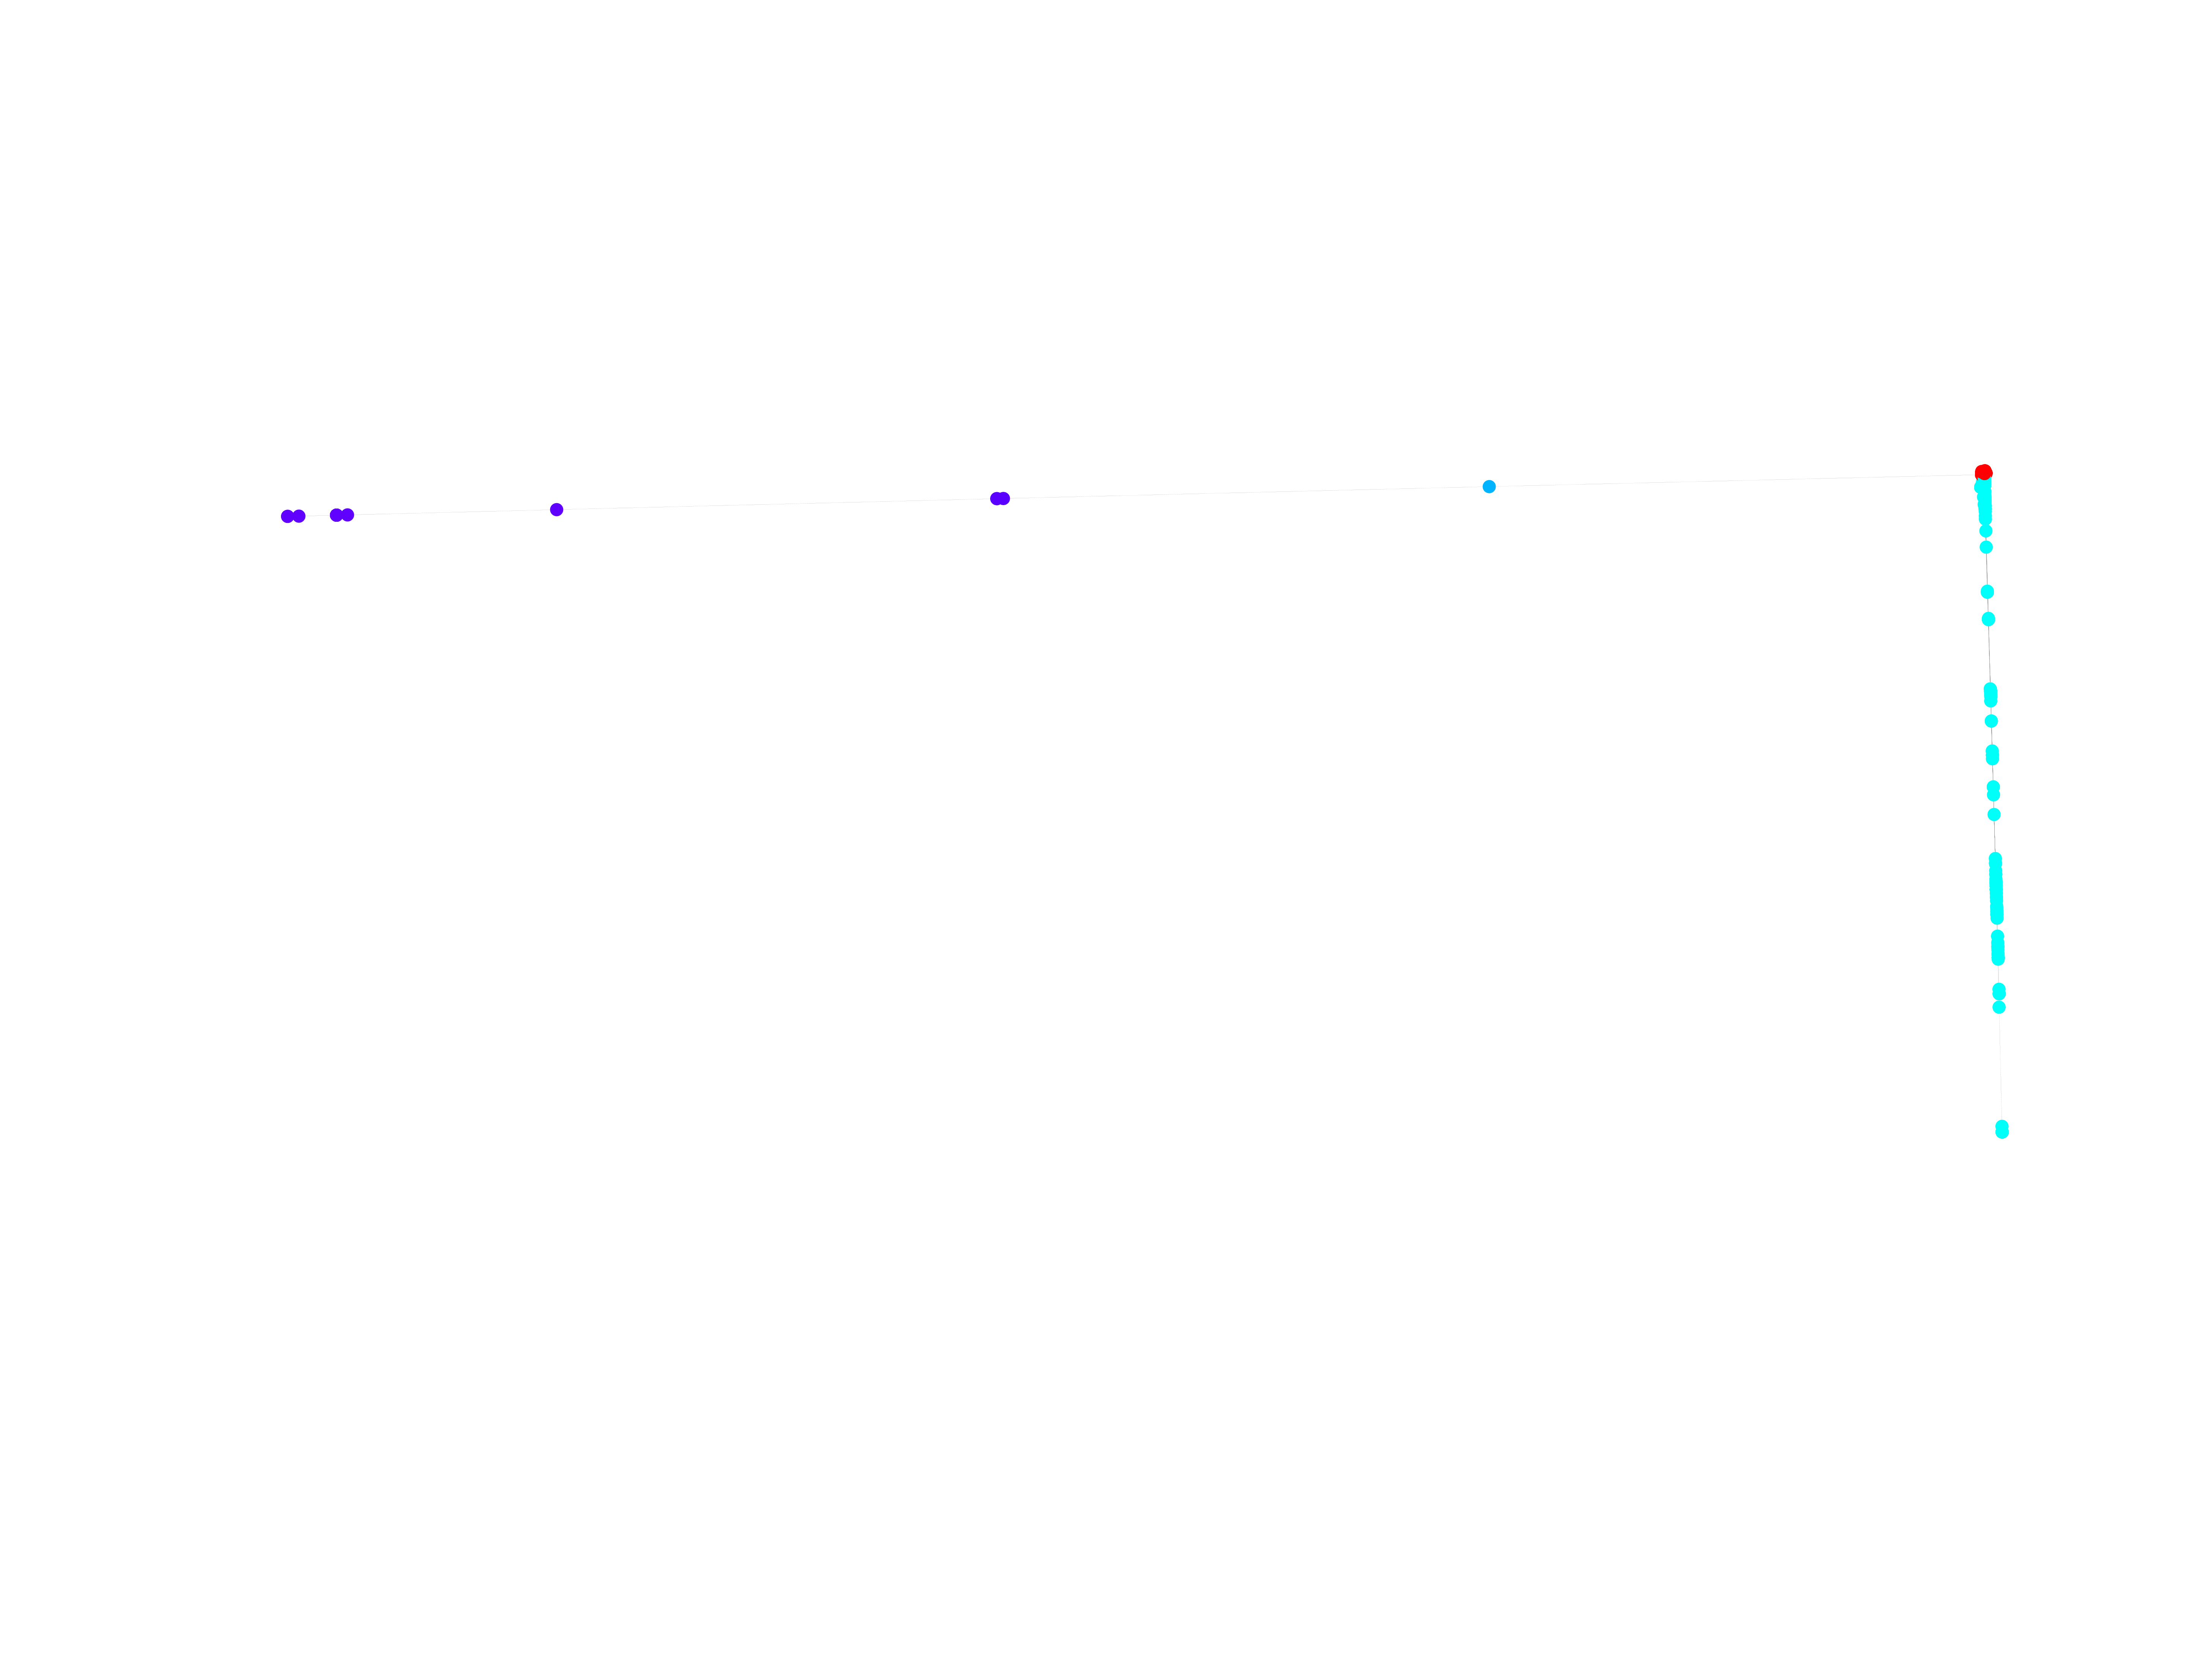
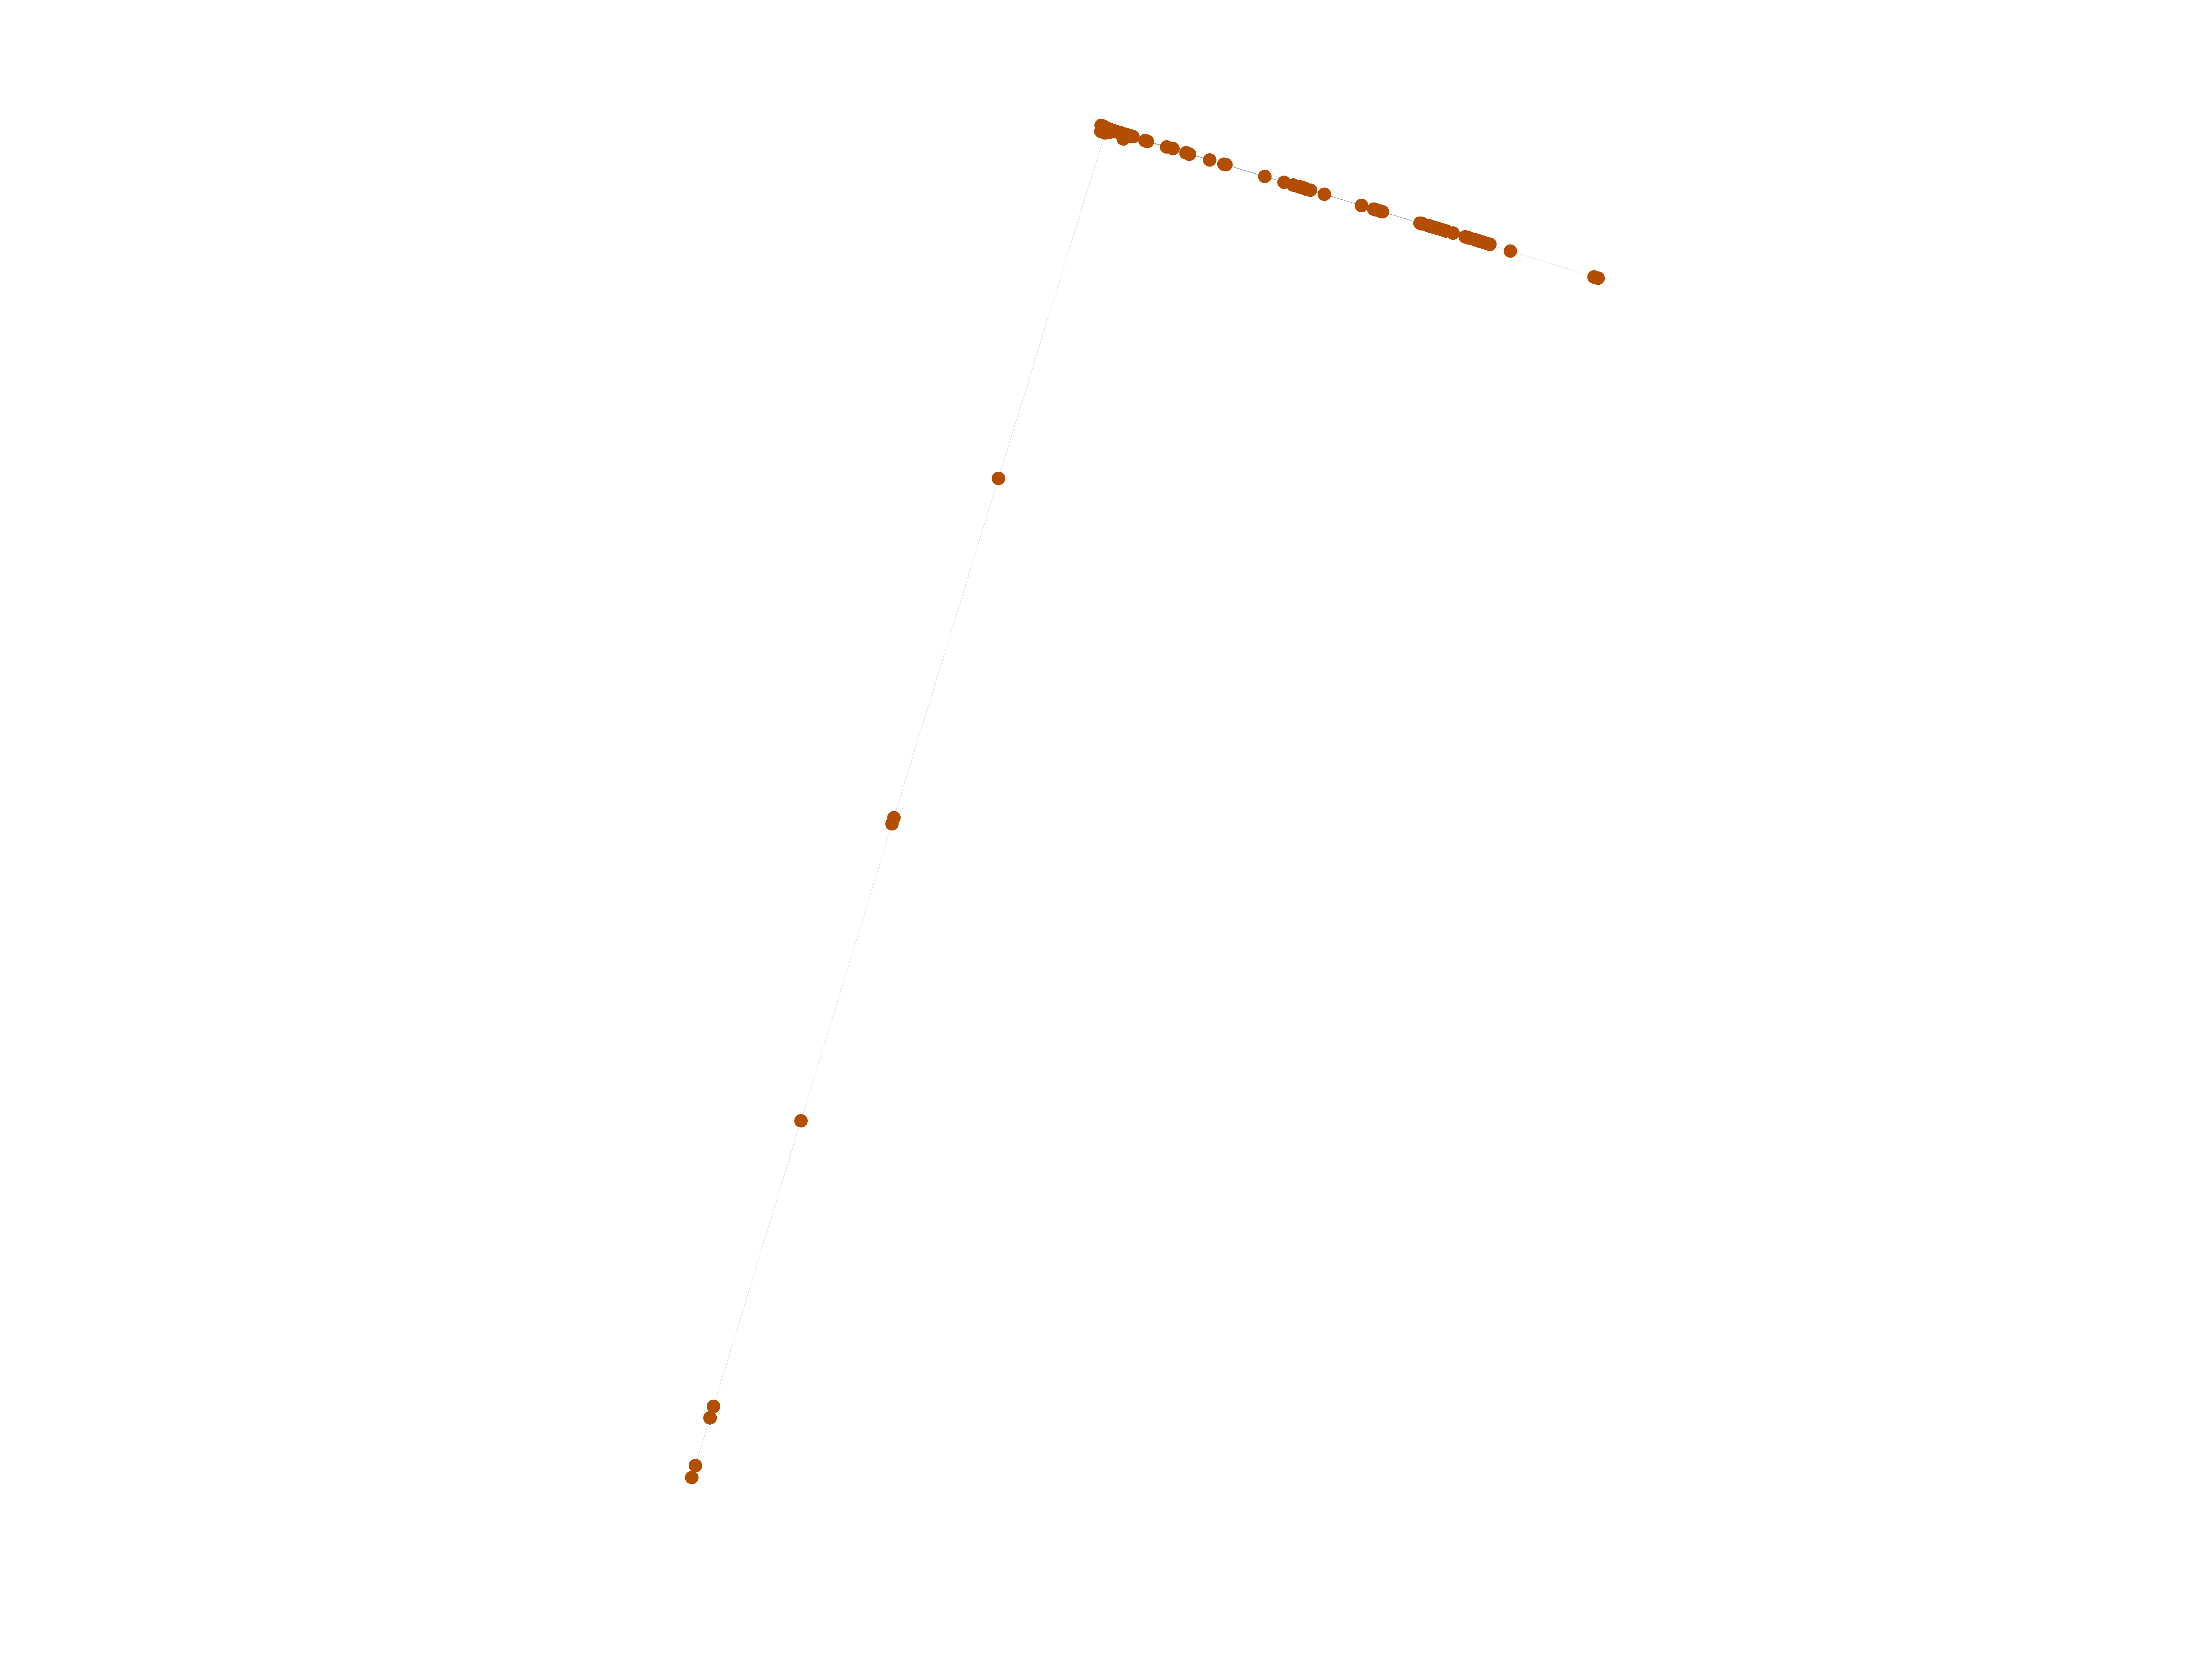
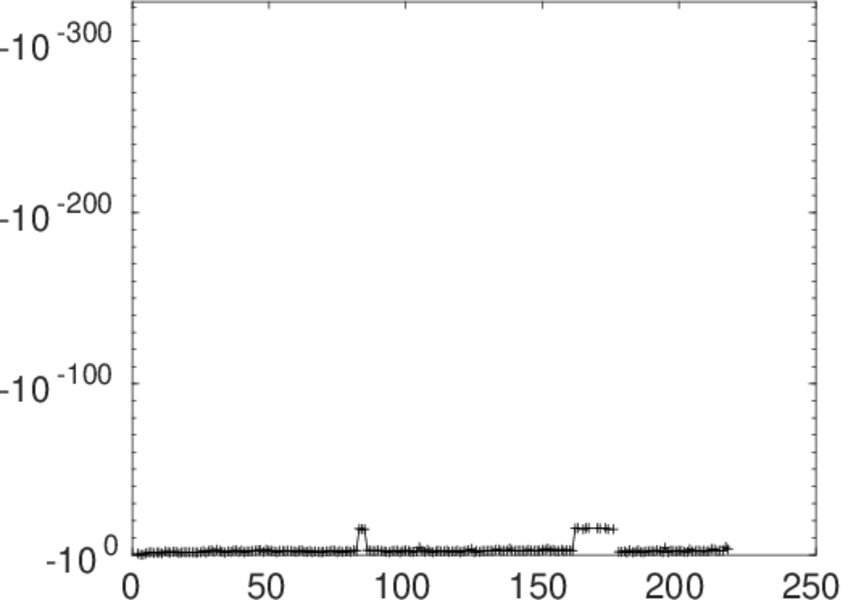
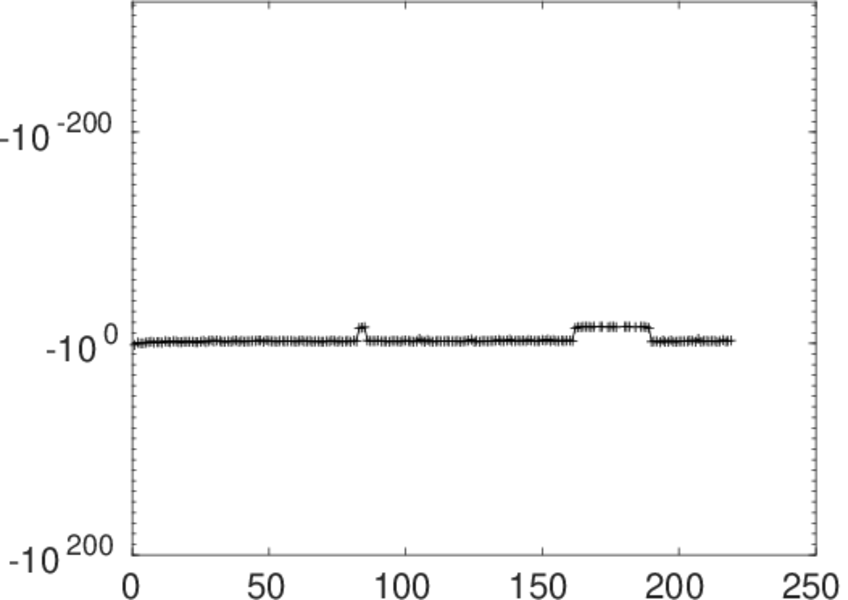
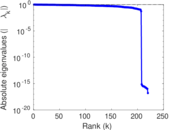
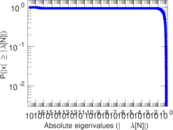
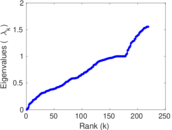
Matrix decompositions plots


Downloads
References
|
[1]
|
Jérôme Kunegis.
KONECT – The Koblenz Network Collection.
In Proc. Int. Conf. on World Wide Web Companion, pages
1343–1350, 2013.
[ http ]
|
|
[2]
|
Wikimedia Foundation.
Wikimedia downloads.
http://dumps.wikimedia.org/, January 2010.
|
 KONECT ‣ Networks ‣
Buy Me a Coffee
KONECT ‣ Networks ‣
Buy Me a Coffee