Wikinews edits (ta)
This is the bipartite edit network of the Tamil Wikinews. It contains users and
pages from the Tamil Wikinews, connected by edit events. Each edge represents
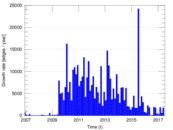
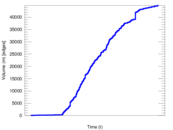
an edit. The dataset includes the timestamp of each edit.
Metadata
Statistics
| Size | n = | 14,005
|
| Left size | n1 = | 451
|
| Right size | n2 = | 13,554
|
| Volume | m = | 44,804
|
| Unique edge count | m̿ = | 23,812
|
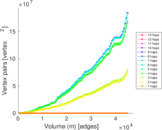
| Wedge count | s = | 42,806,883
|
| Claw count | z = | 78,580,487,753
|
| Cross count | x = | 115,335,987,205,563
|
| Square count | q = | 6,165,549
|
| 4-Tour count | T4 = | 220,600,976
|
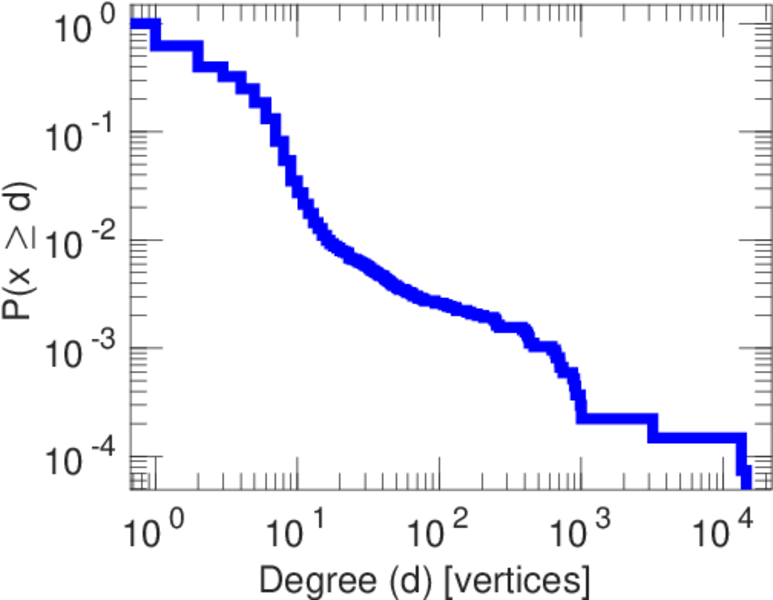
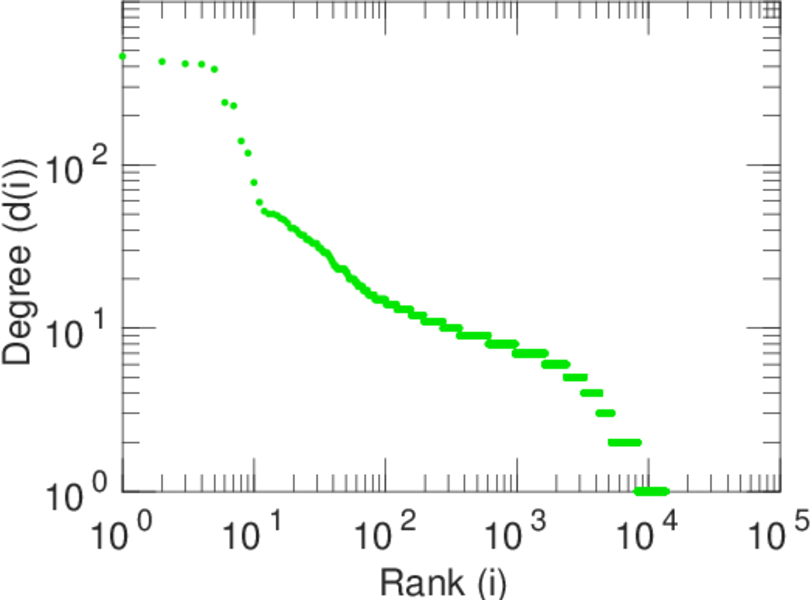
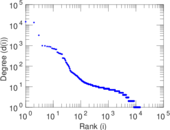
| Maximum degree | dmax = | 14,572
|
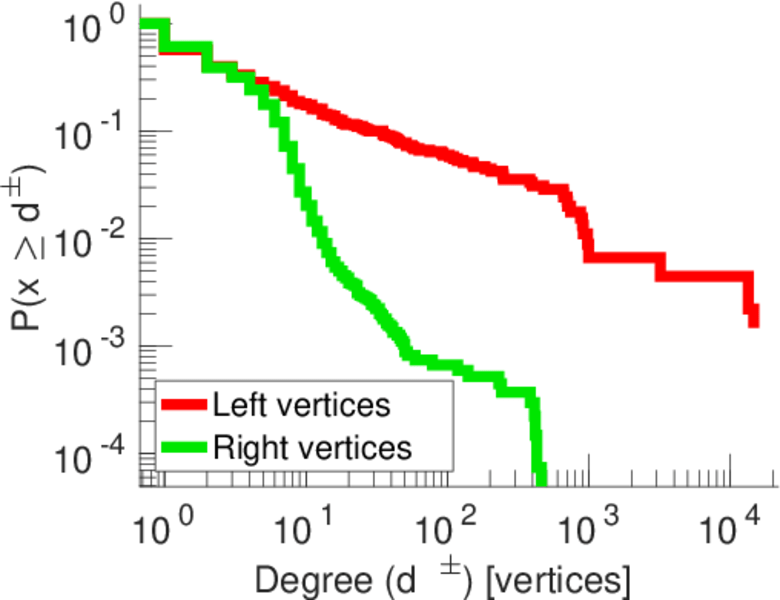
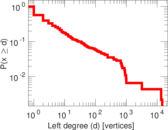
| Maximum left degree | d1max = | 14,572
|
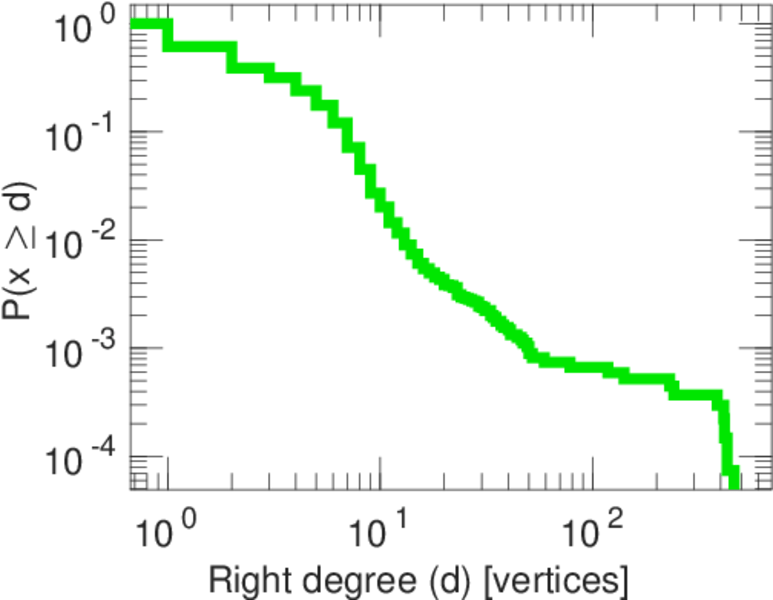
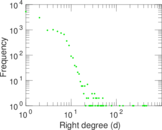
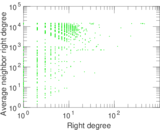
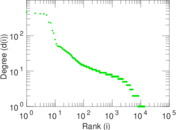
| Maximum right degree | d2max = | 462
|
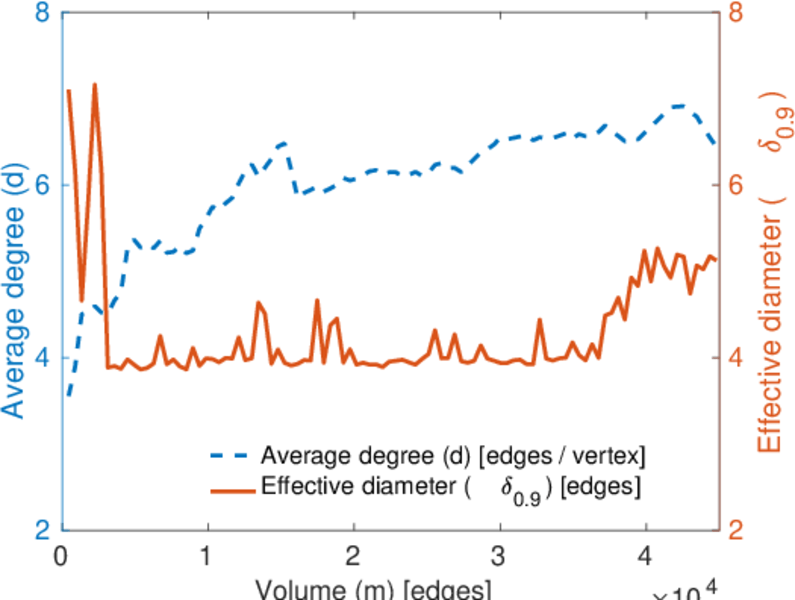
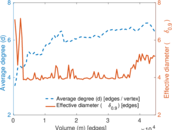
| Average degree | d = | 6.398 29
|
| Average left degree | d1 = | 99.343 7
|
| Average right degree | d2 = | 3.305 59
|
| Fill | p = | 0.003 895 40
|
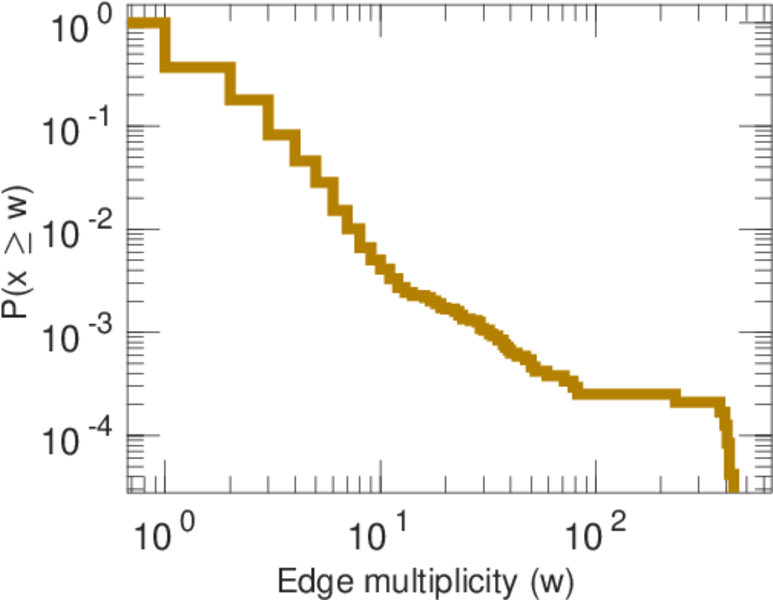
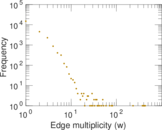
| Average edge multiplicity | m̃ = | 1.881 57
|
| Size of LCC | N = | 13,581
|
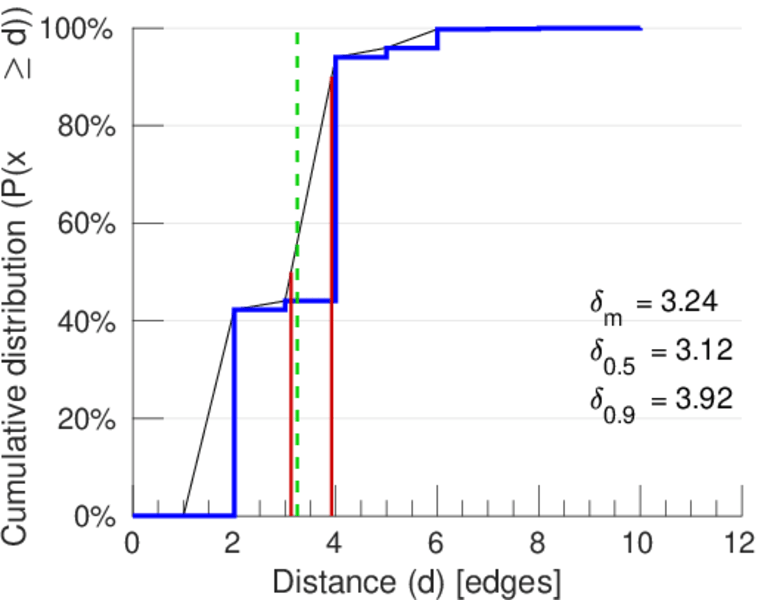
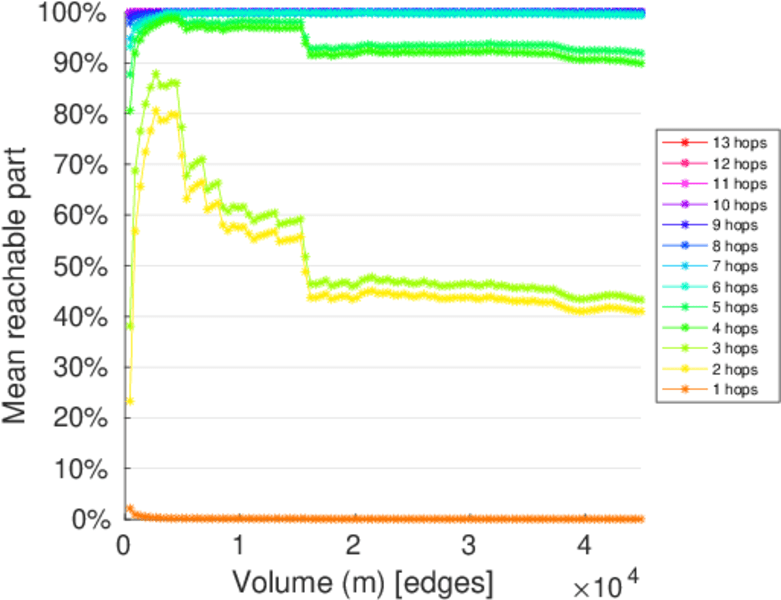
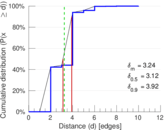
| Diameter | δ = | 13
|
| 50-Percentile effective diameter | δ0.5 = | 3.118 95
|
| 90-Percentile effective diameter | δ0.9 = | 3.920 38
|
| Median distance | δM = | 4
|
| Mean distance | δm = | 3.241 91
|
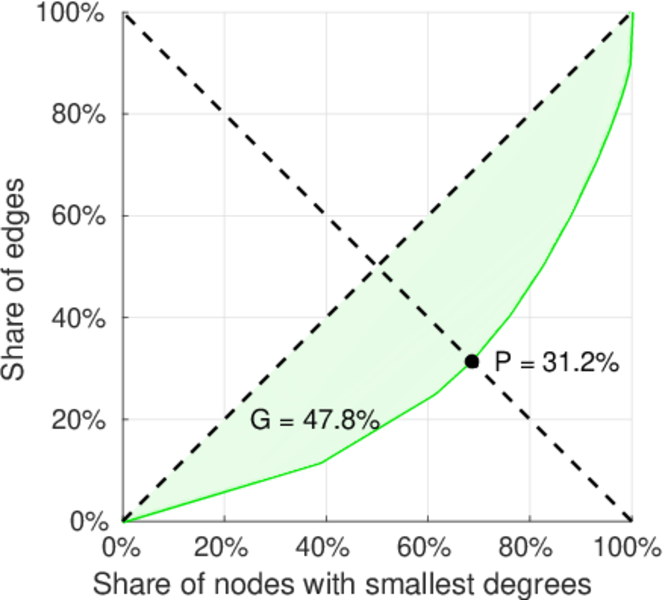
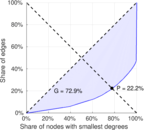
| Gini coefficient | G = | 0.732 123
|
| Balanced inequality ratio | P = | 0.220 996
|
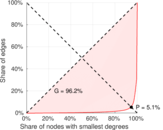
| Left balanced inequality ratio | P1 = | 0.050 553 5
|
| Right balanced inequality ratio | P2 = | 0.312 271
|
| Relative edge distribution entropy | Her = | 0.701 950
|
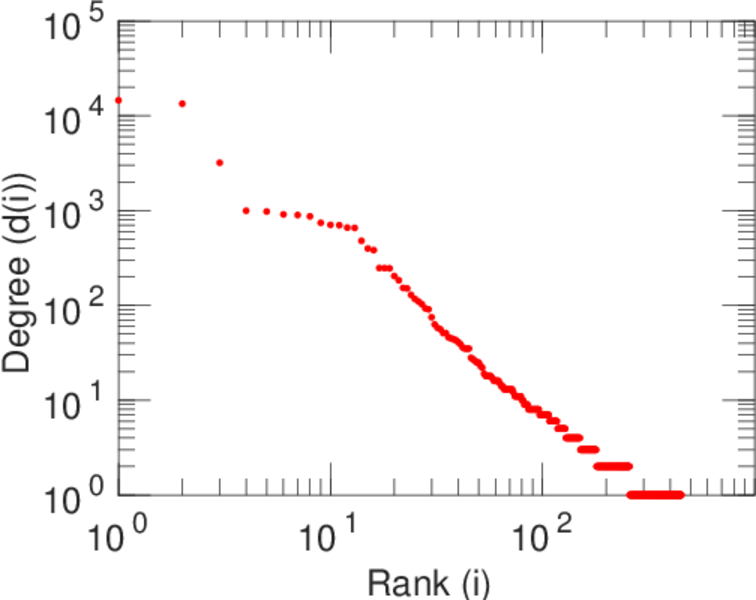
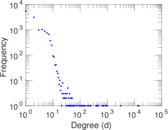
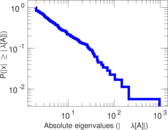
| Power law exponent | γ = | 3.420 09
|
| Tail power law exponent | γt = | 3.221 00
|
| Tail power law exponent with p | γ3 = | 3.221 00
|
| p-value | p = | 0.000 00
|
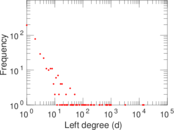
| Left tail power law exponent with p | γ3,1 = | 1.591 00
|
| Left p-value | p1 = | 0.542 000
|
| Right tail power law exponent with p | γ3,2 = | 6.511 00
|
| Right p-value | p2 = | 0.000 00
|
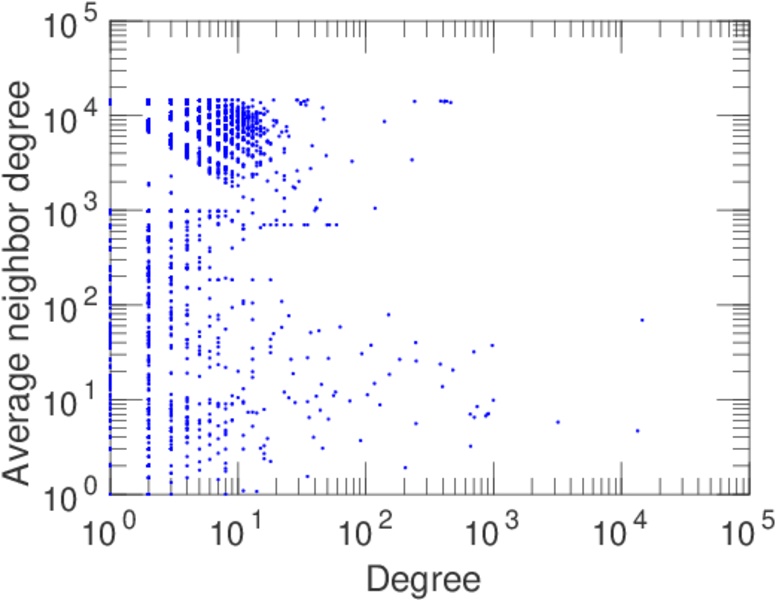
| Degree assortativity | ρ = | −0.290 441
|
| Degree assortativity p-value | pρ = | 0.000 00
|
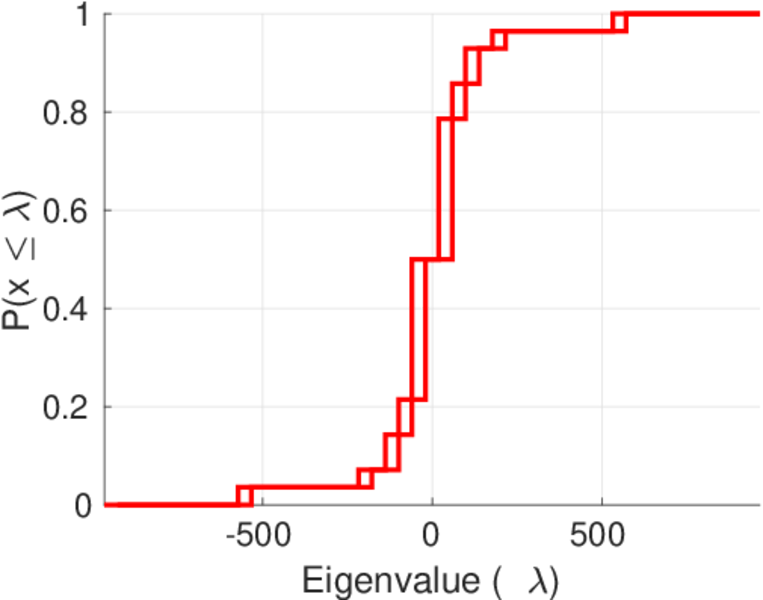
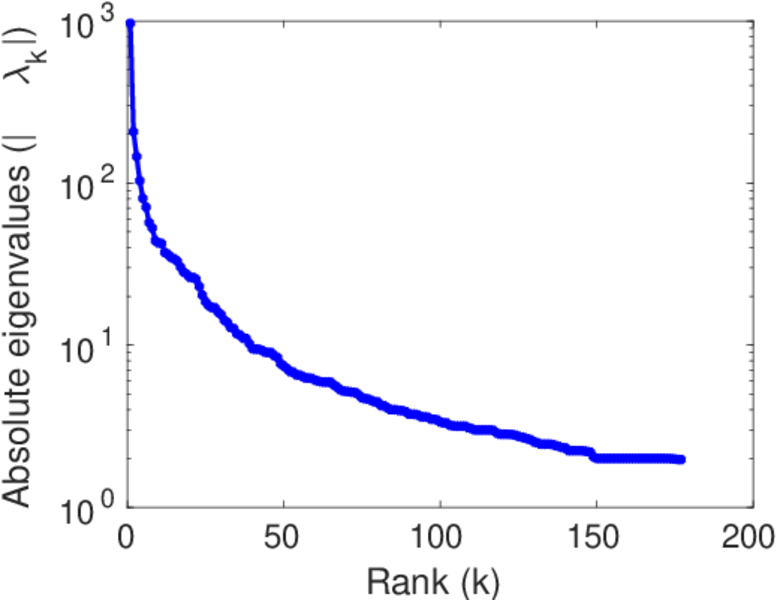
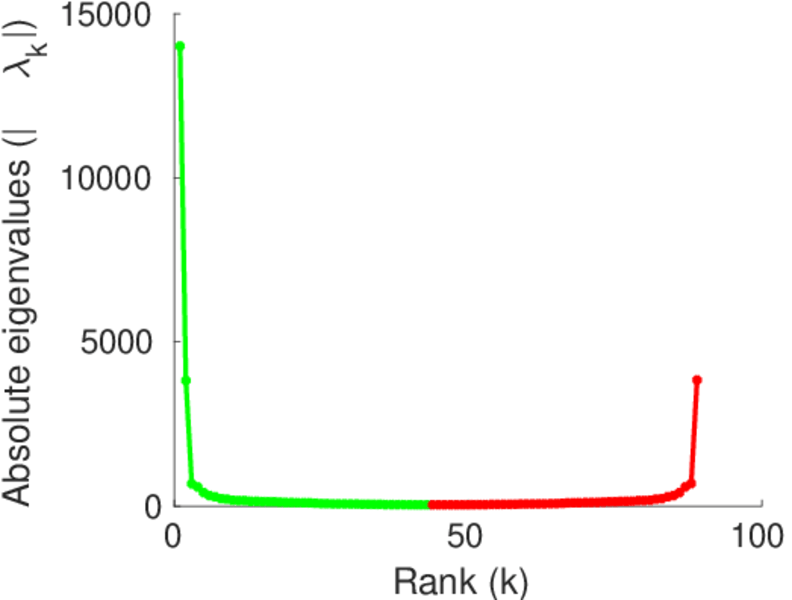
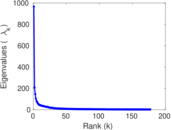
| Spectral norm | α = | 966.594
|
| Algebraic connectivity | a = | 0.023 921 0
|
| Spectral separation | |λ1[A] / λ2[A]| = | 4.664 67
|
| Controllability | C = | 13,049
|
| Relative controllability | Cr = | 0.937 496
|
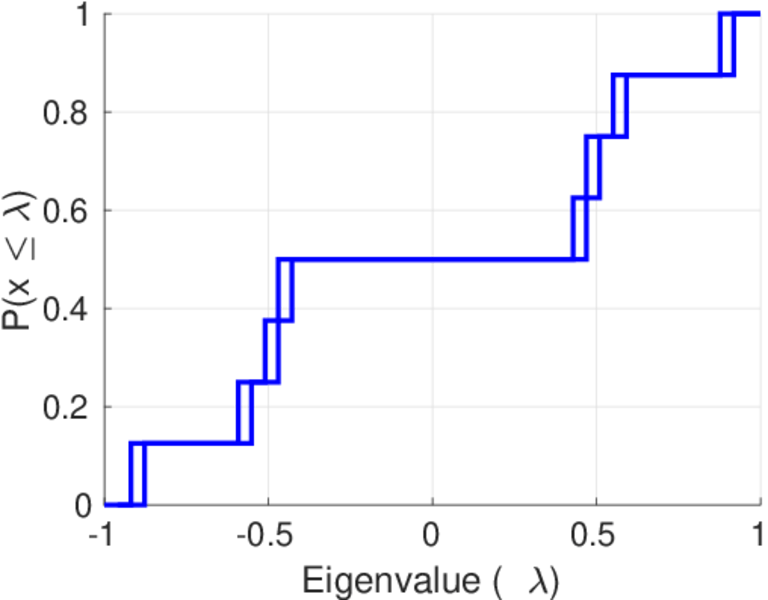
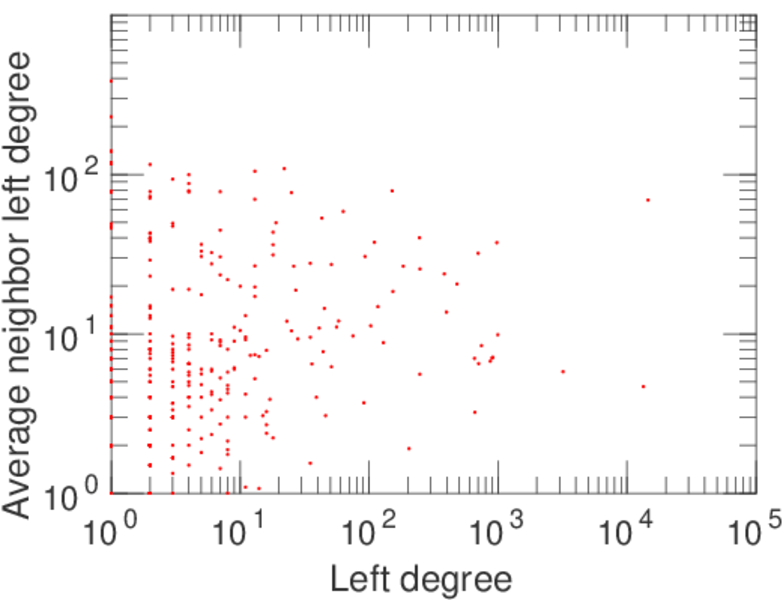
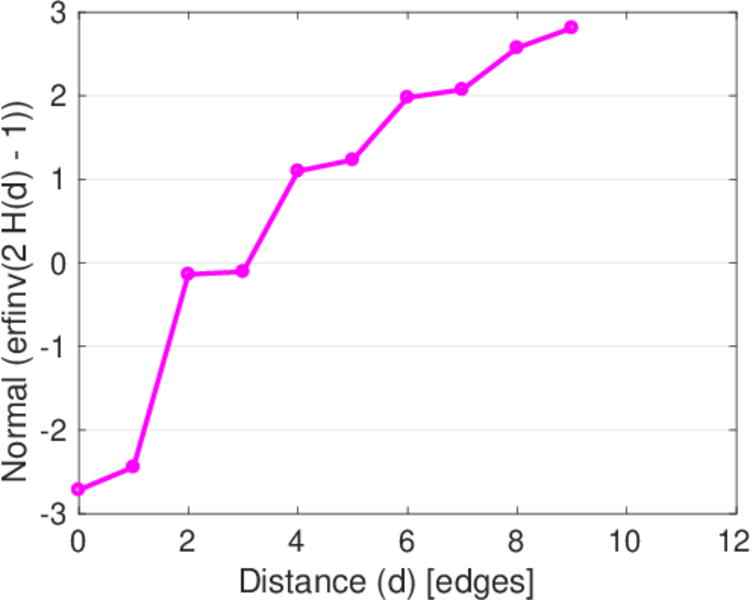
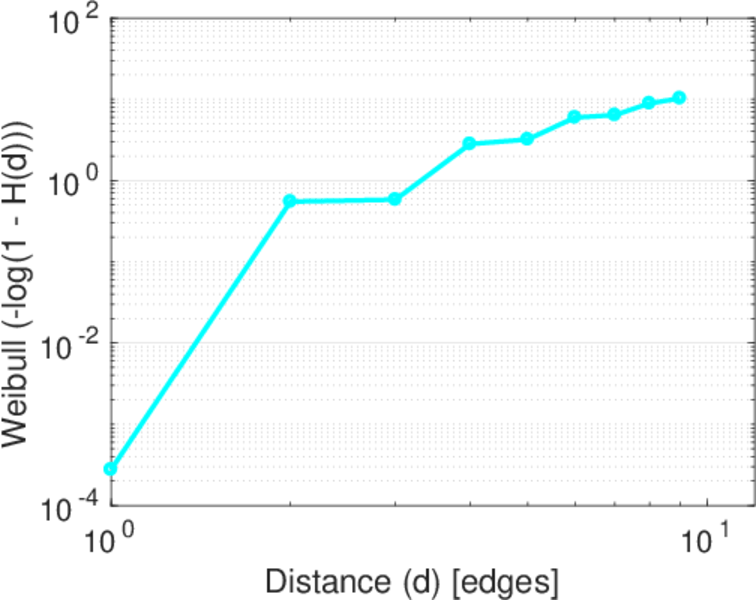
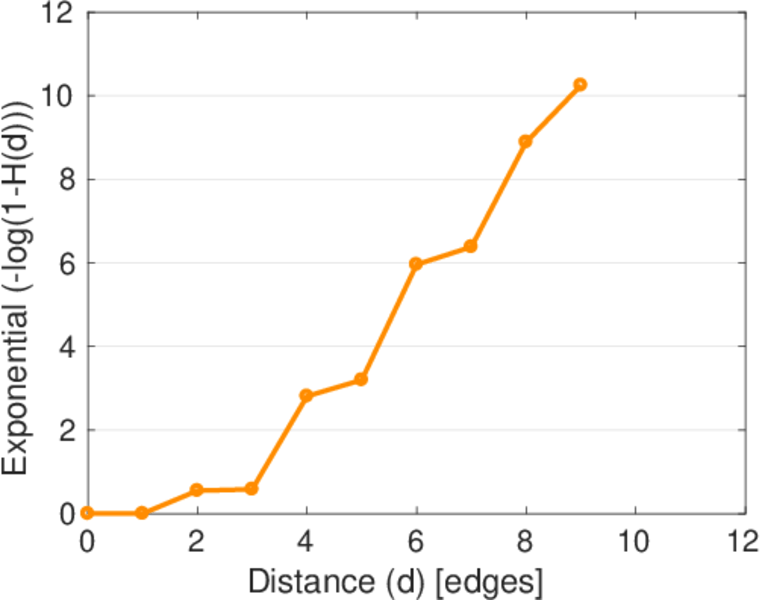
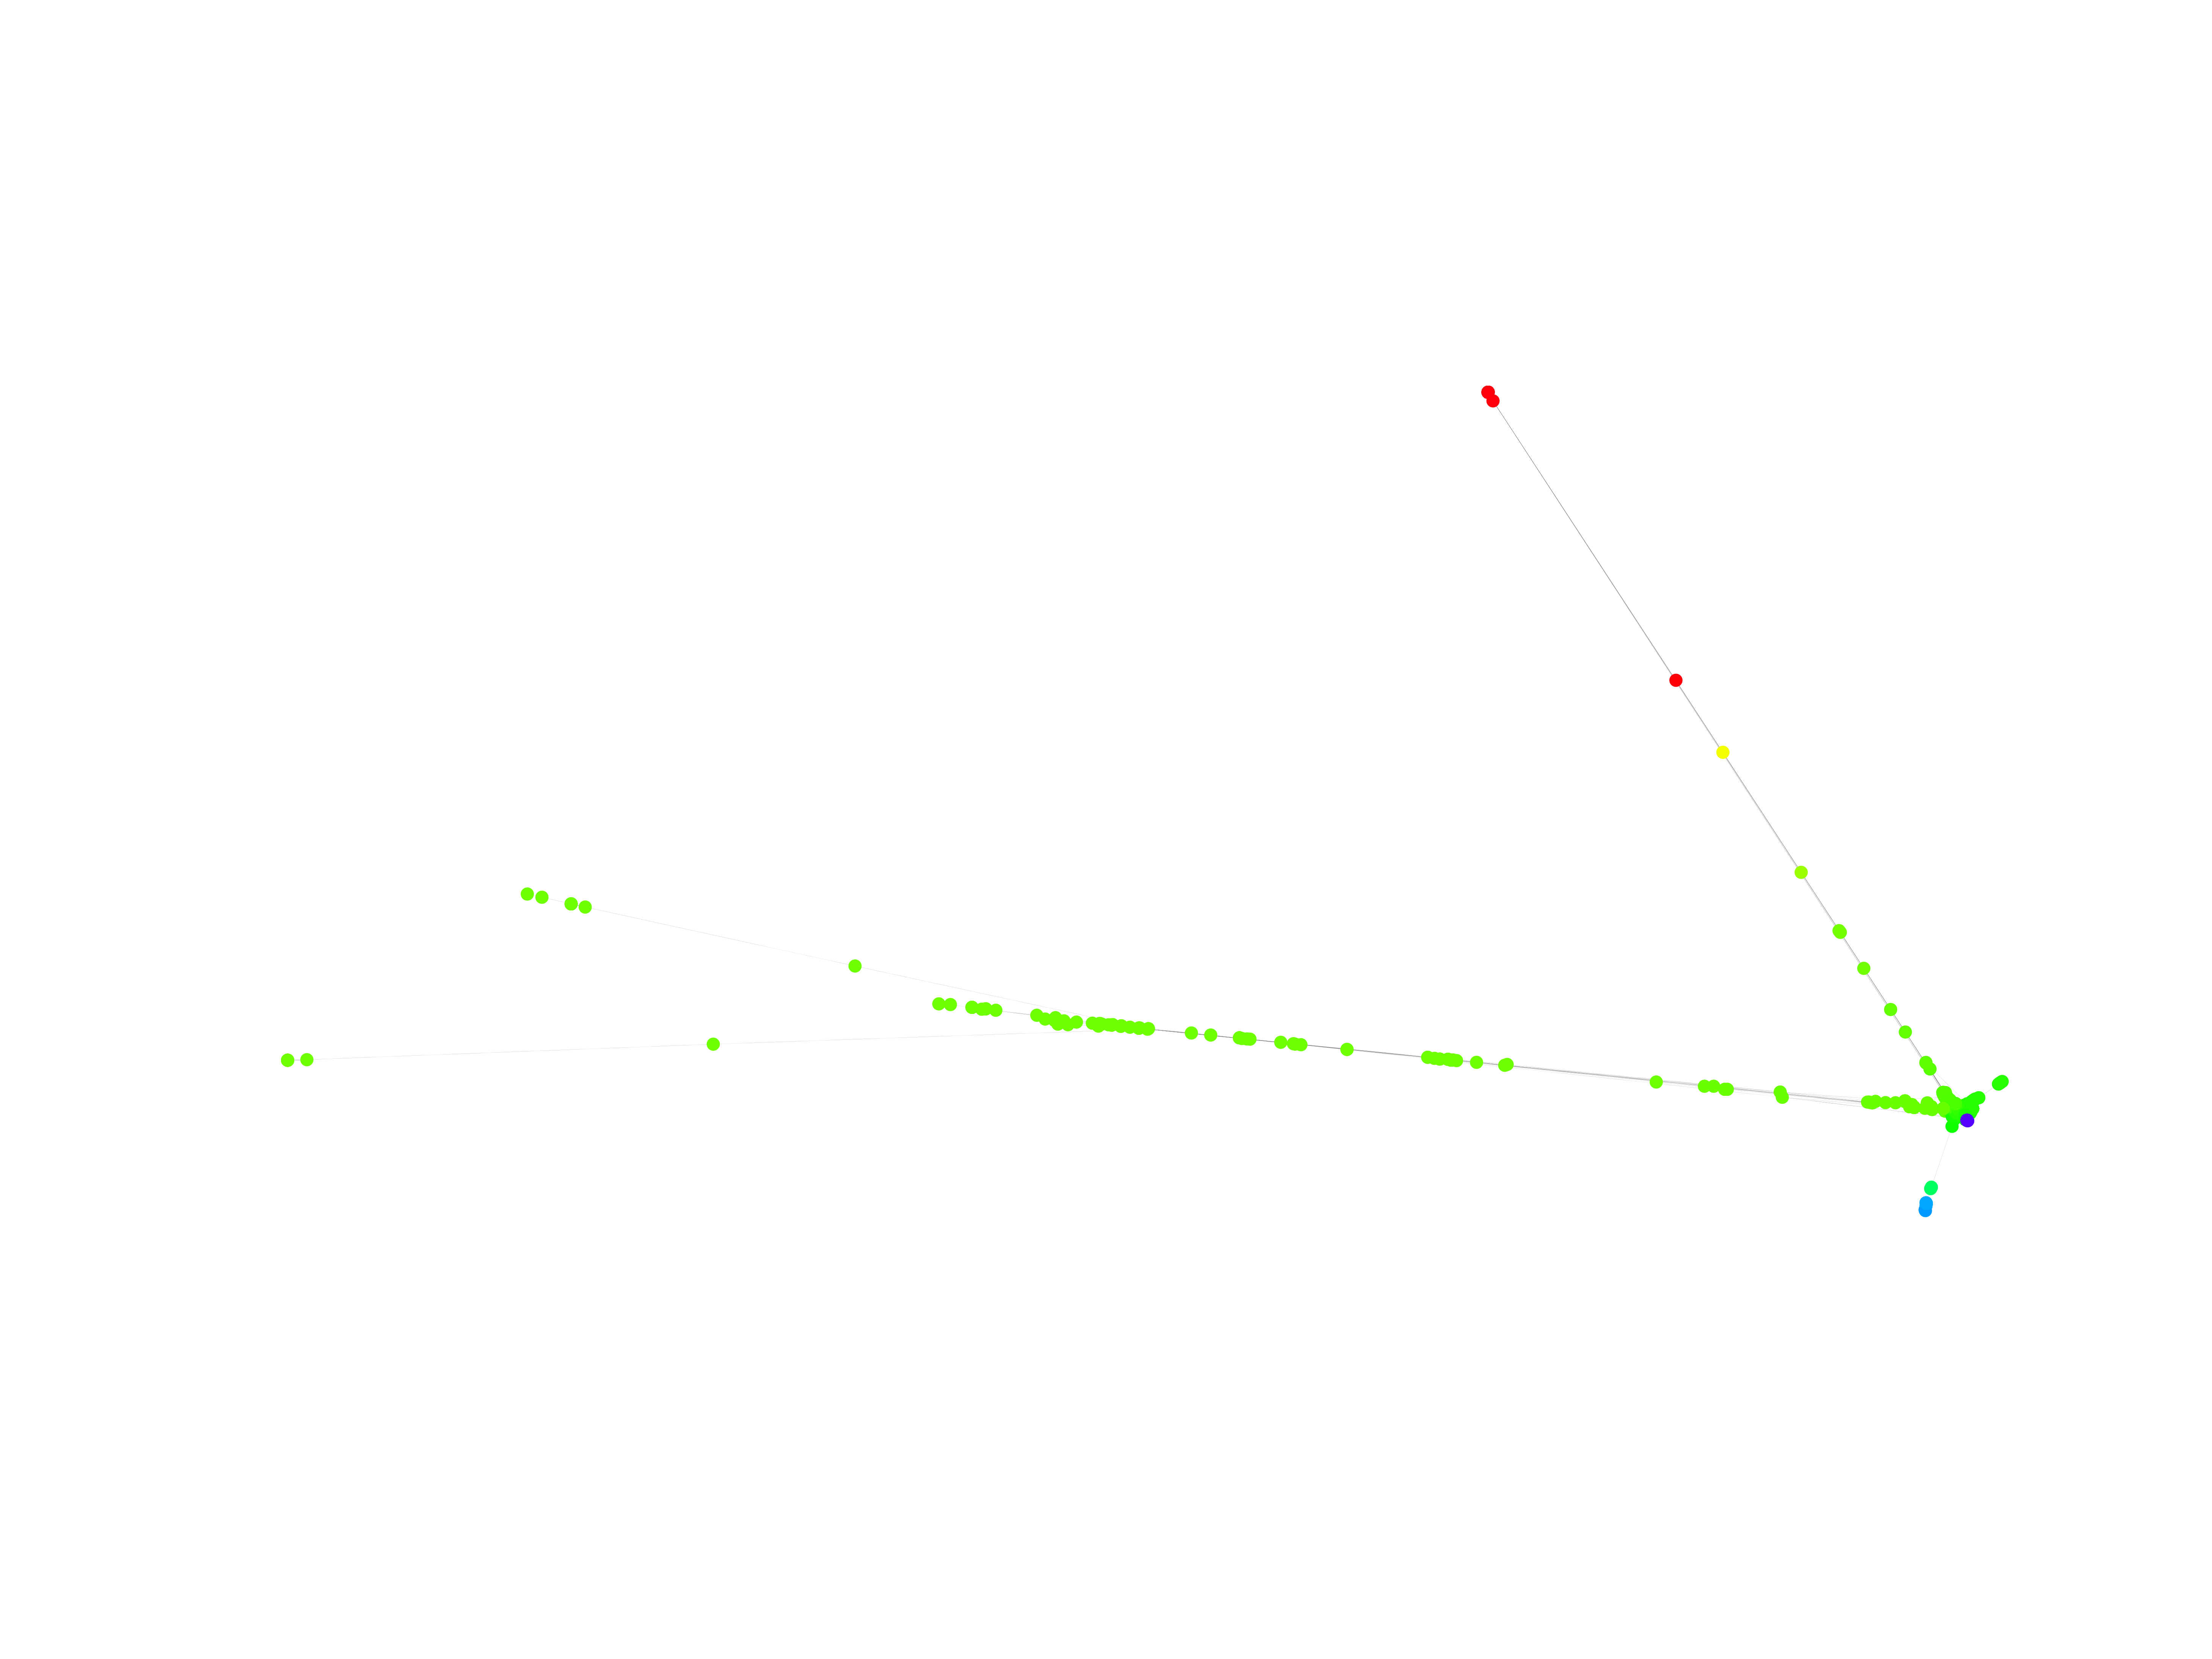
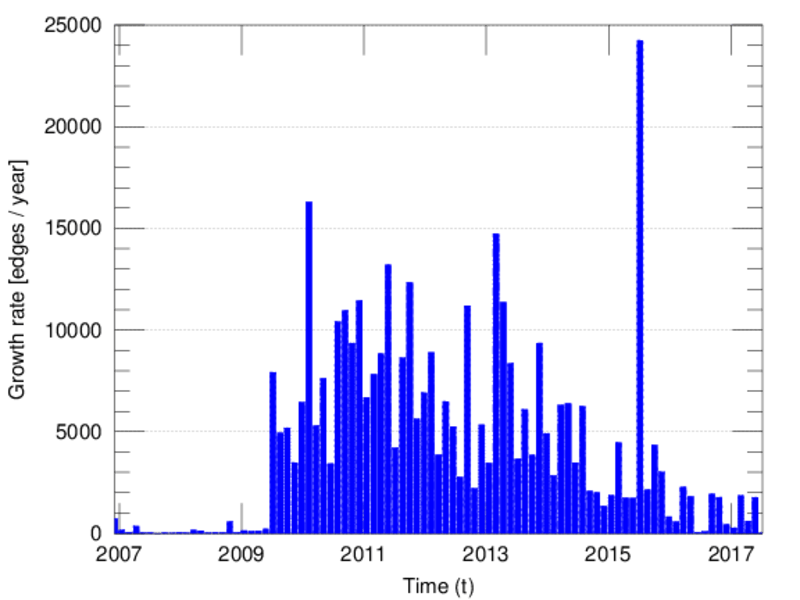
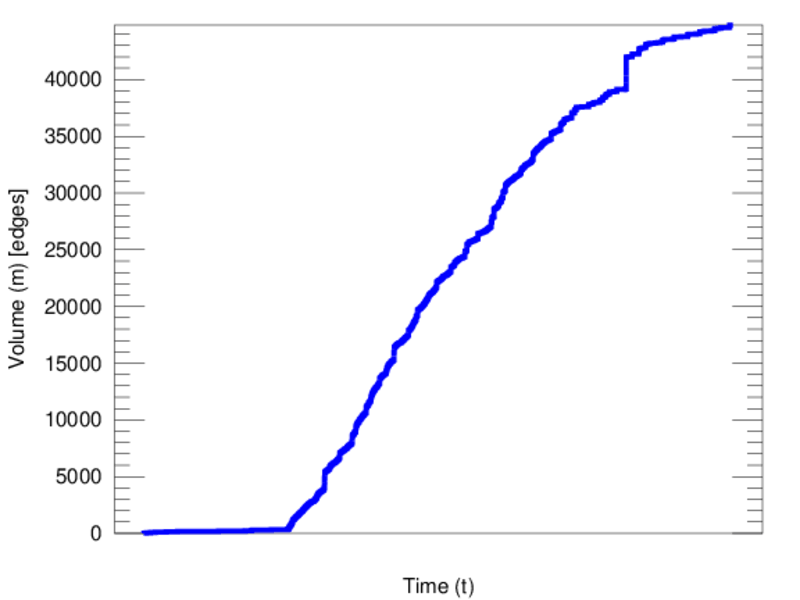
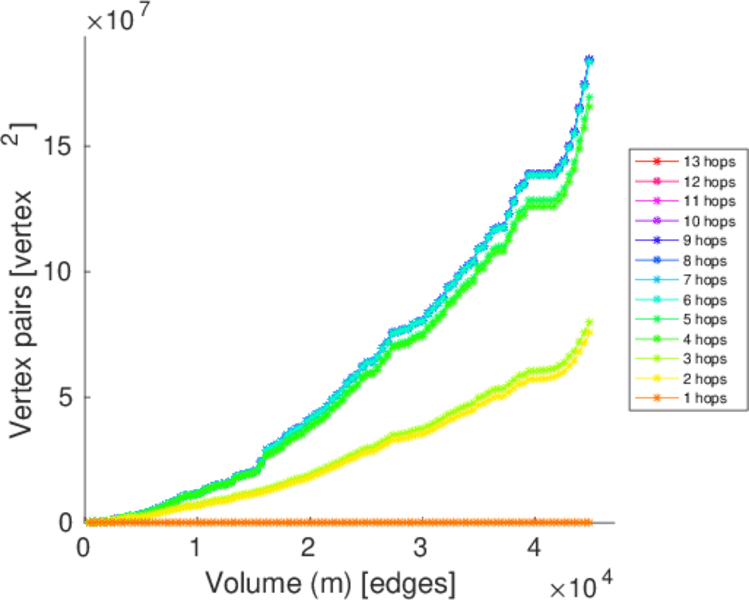
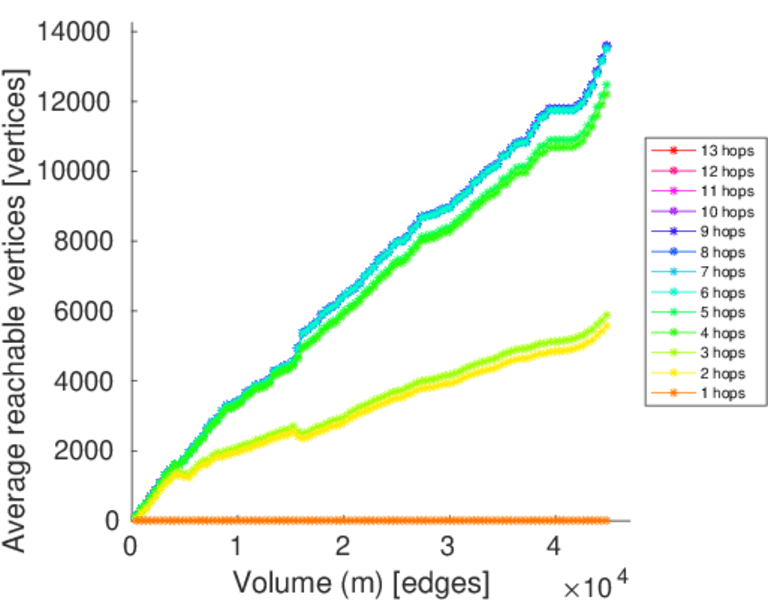
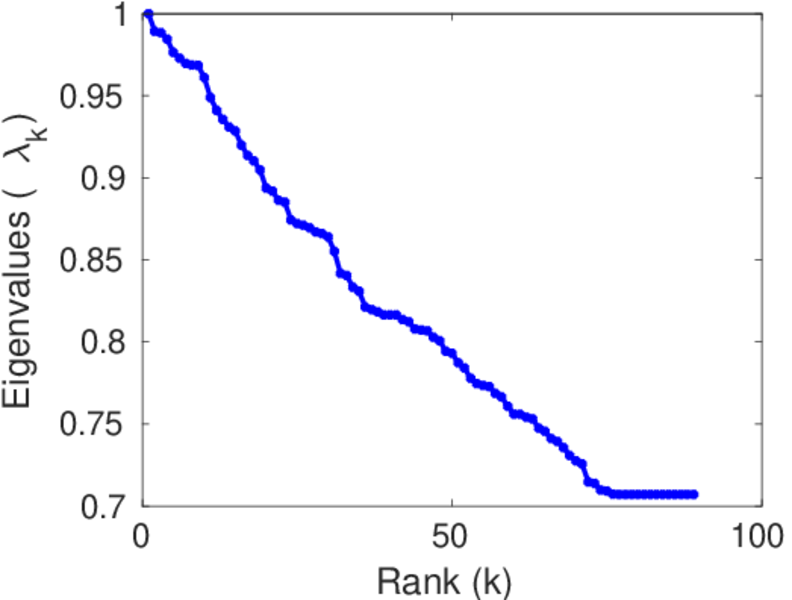
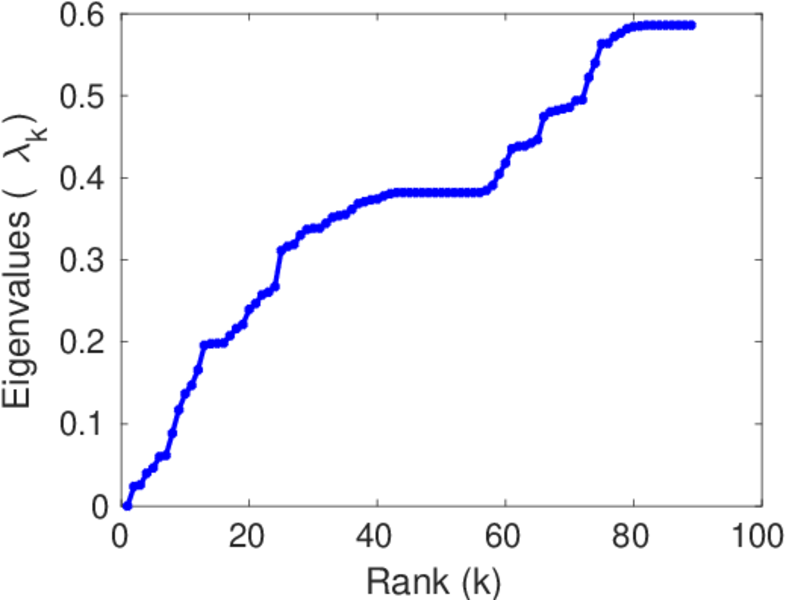
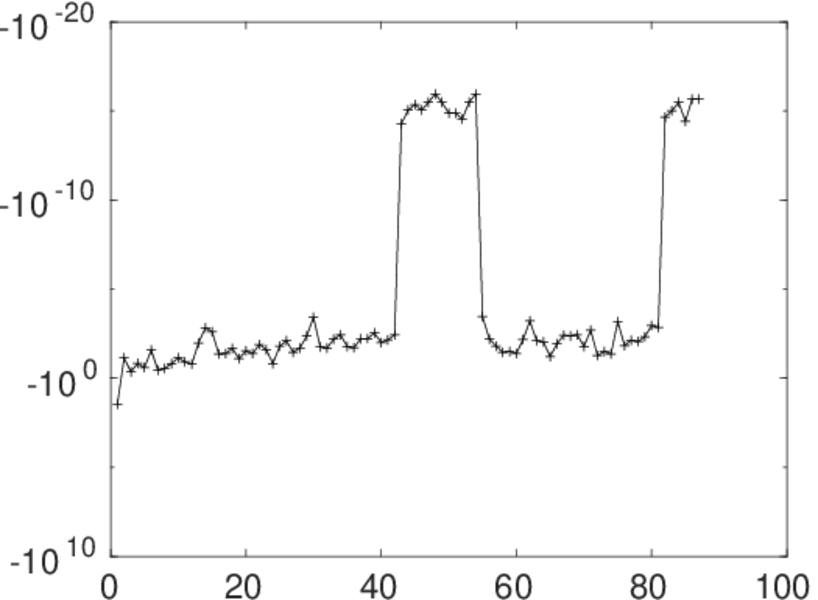
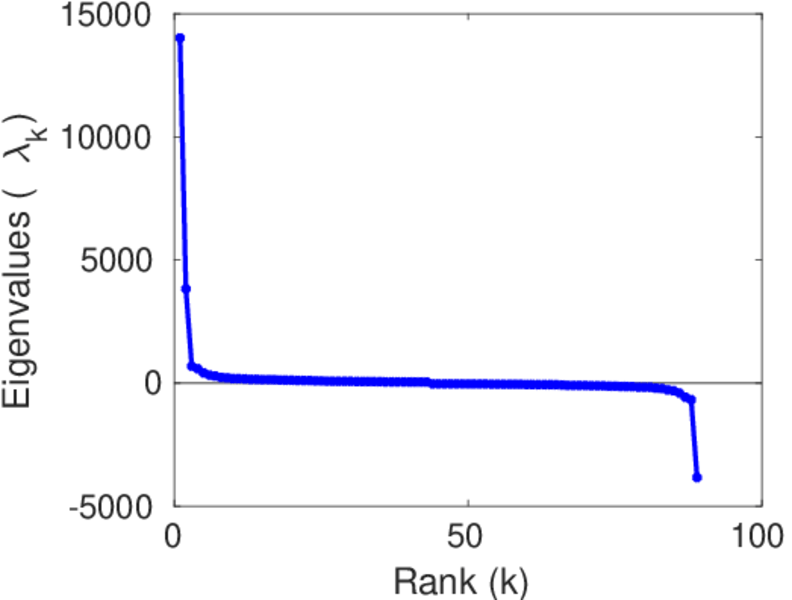
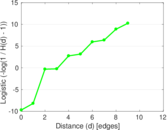
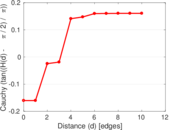
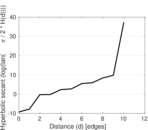
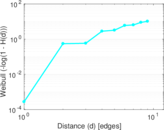
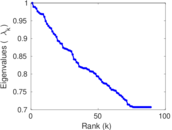
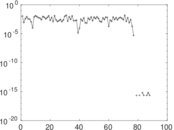
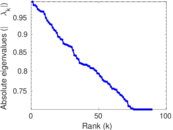
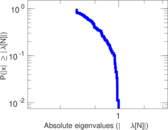
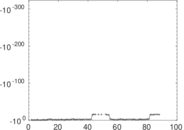
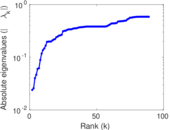
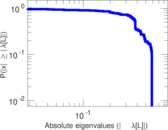
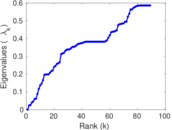
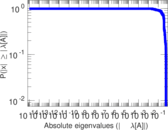
Plots
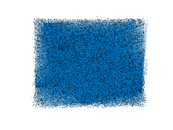


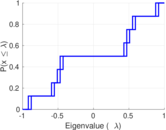
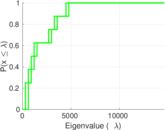


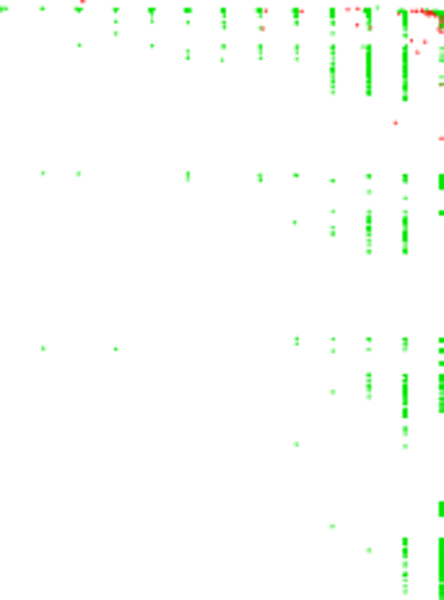
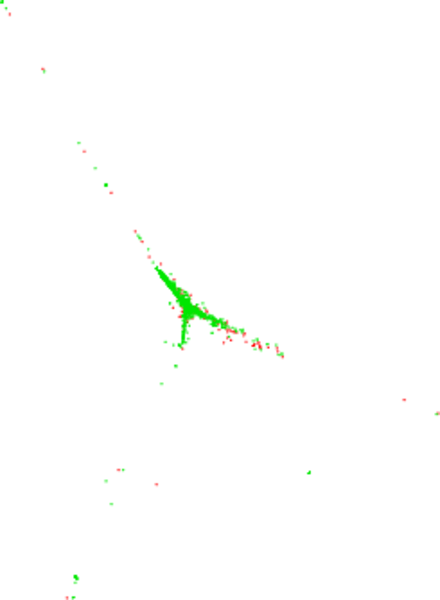
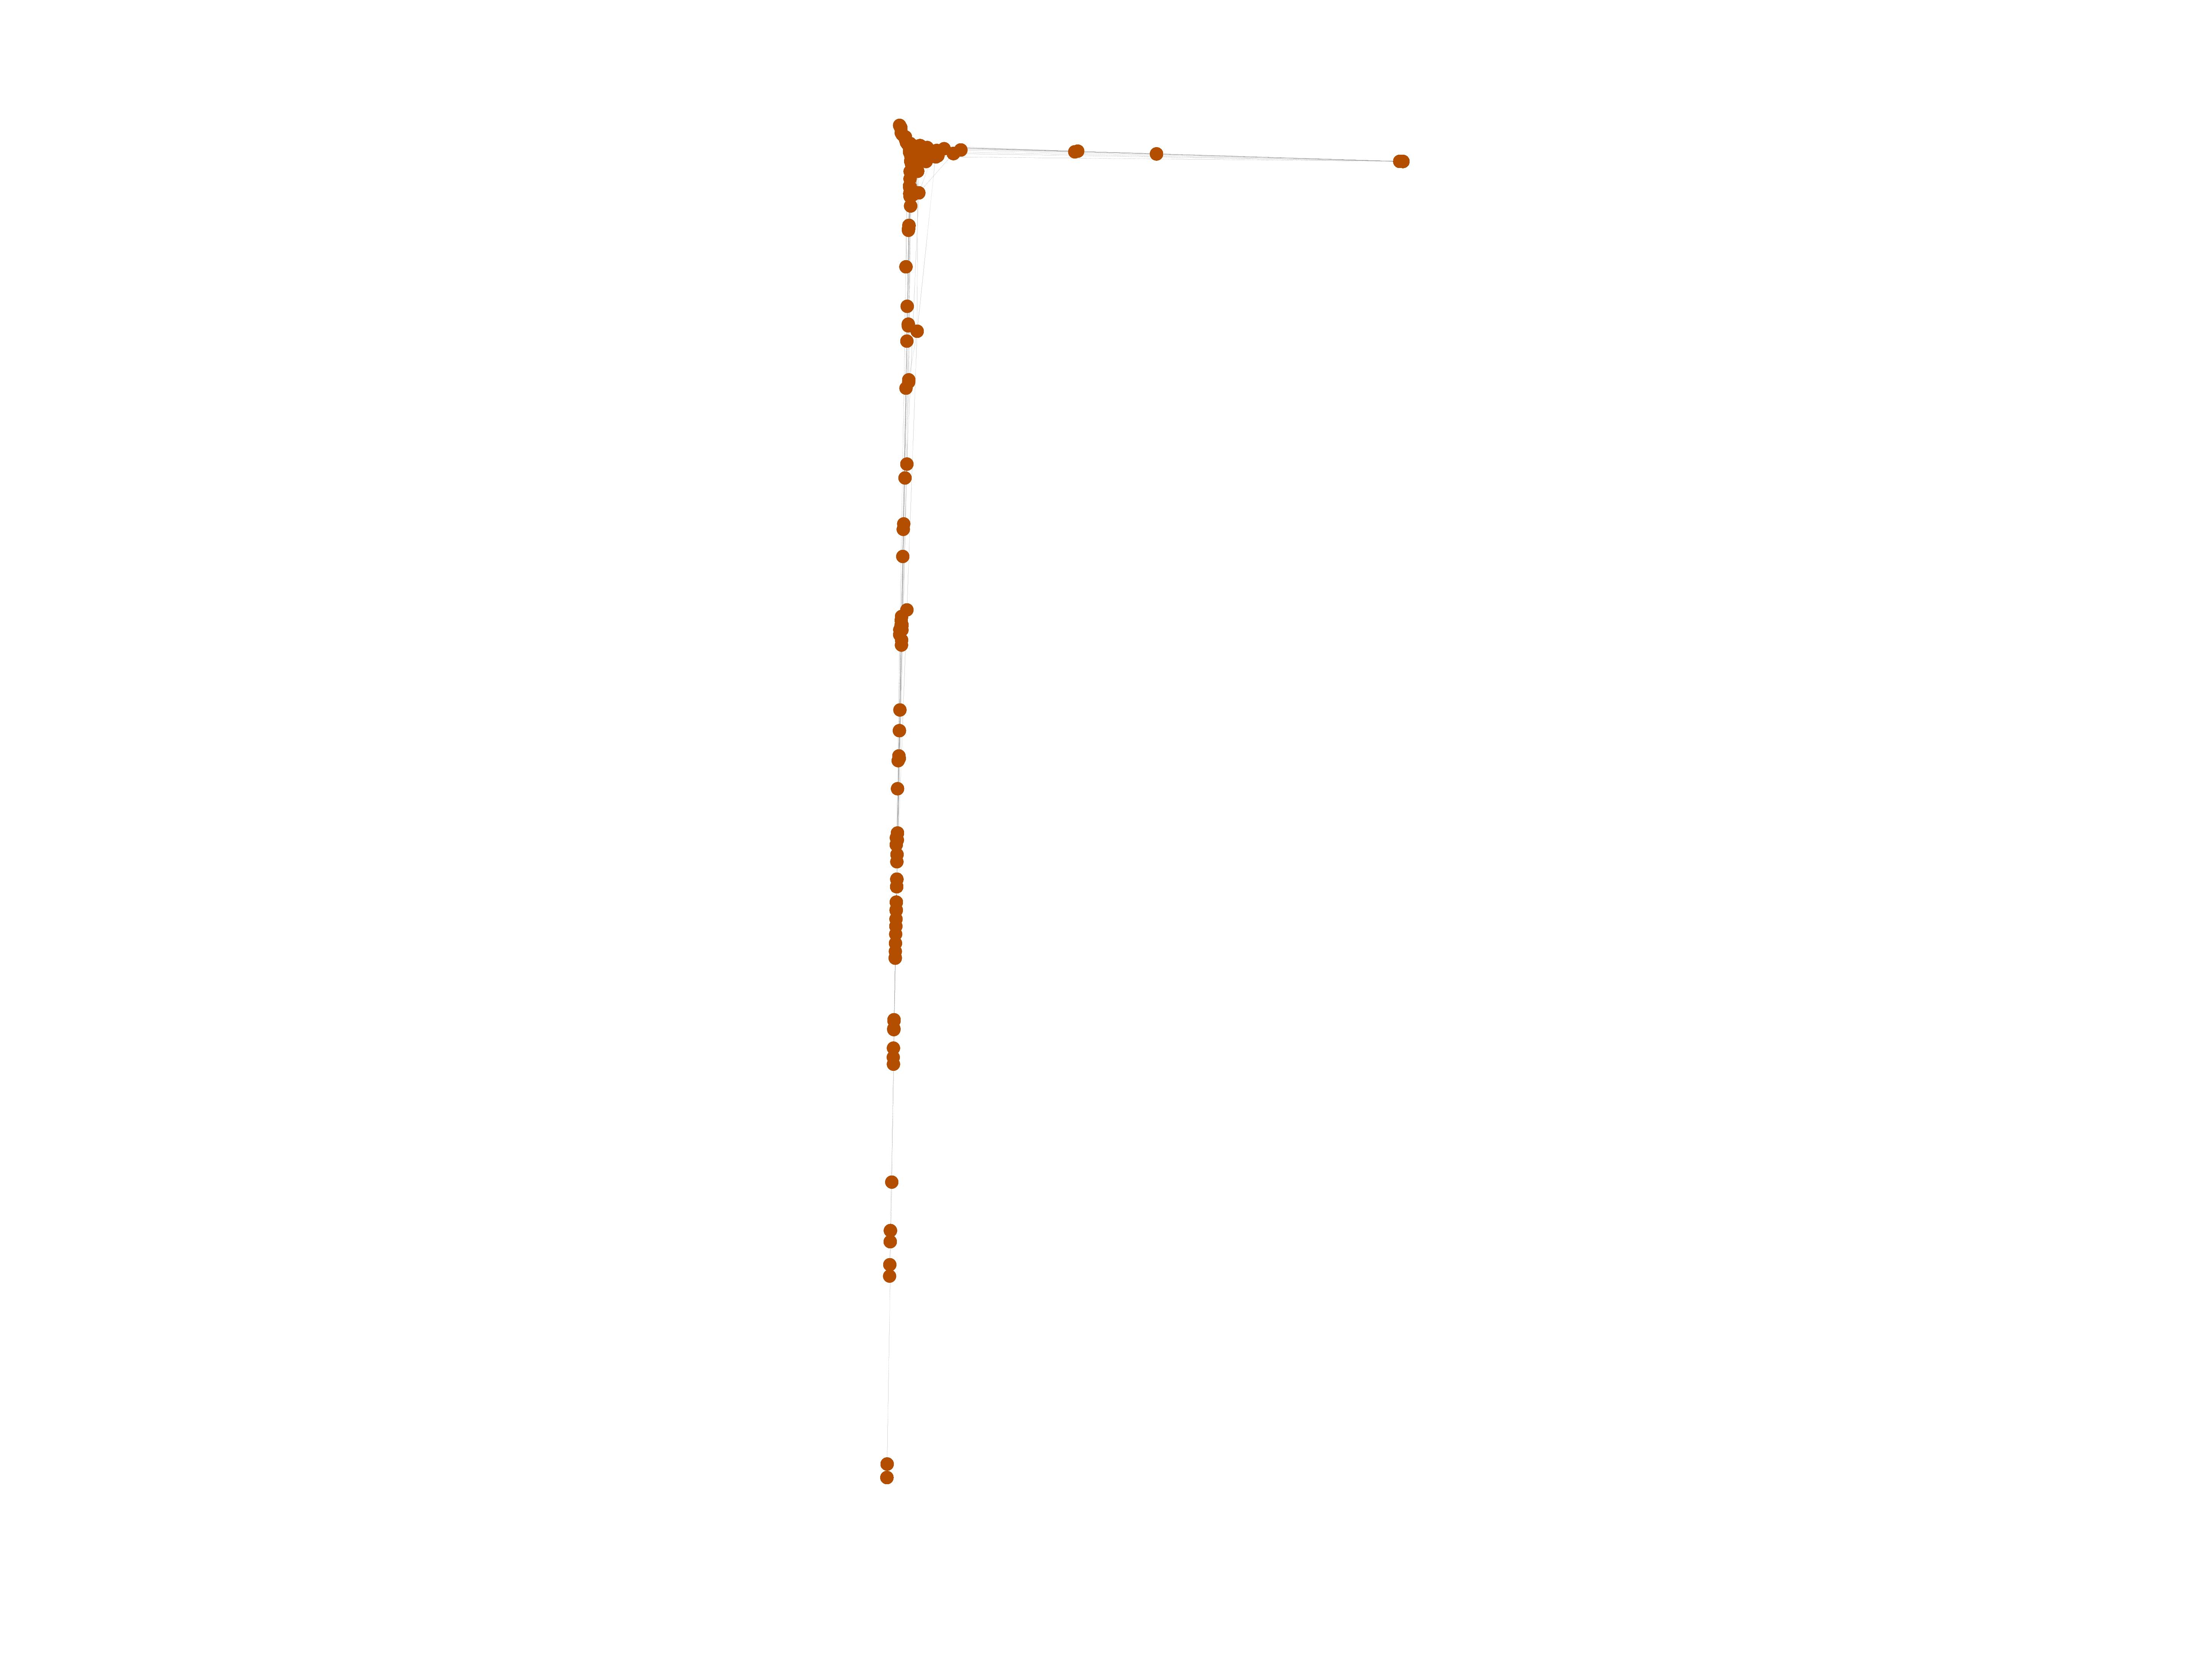
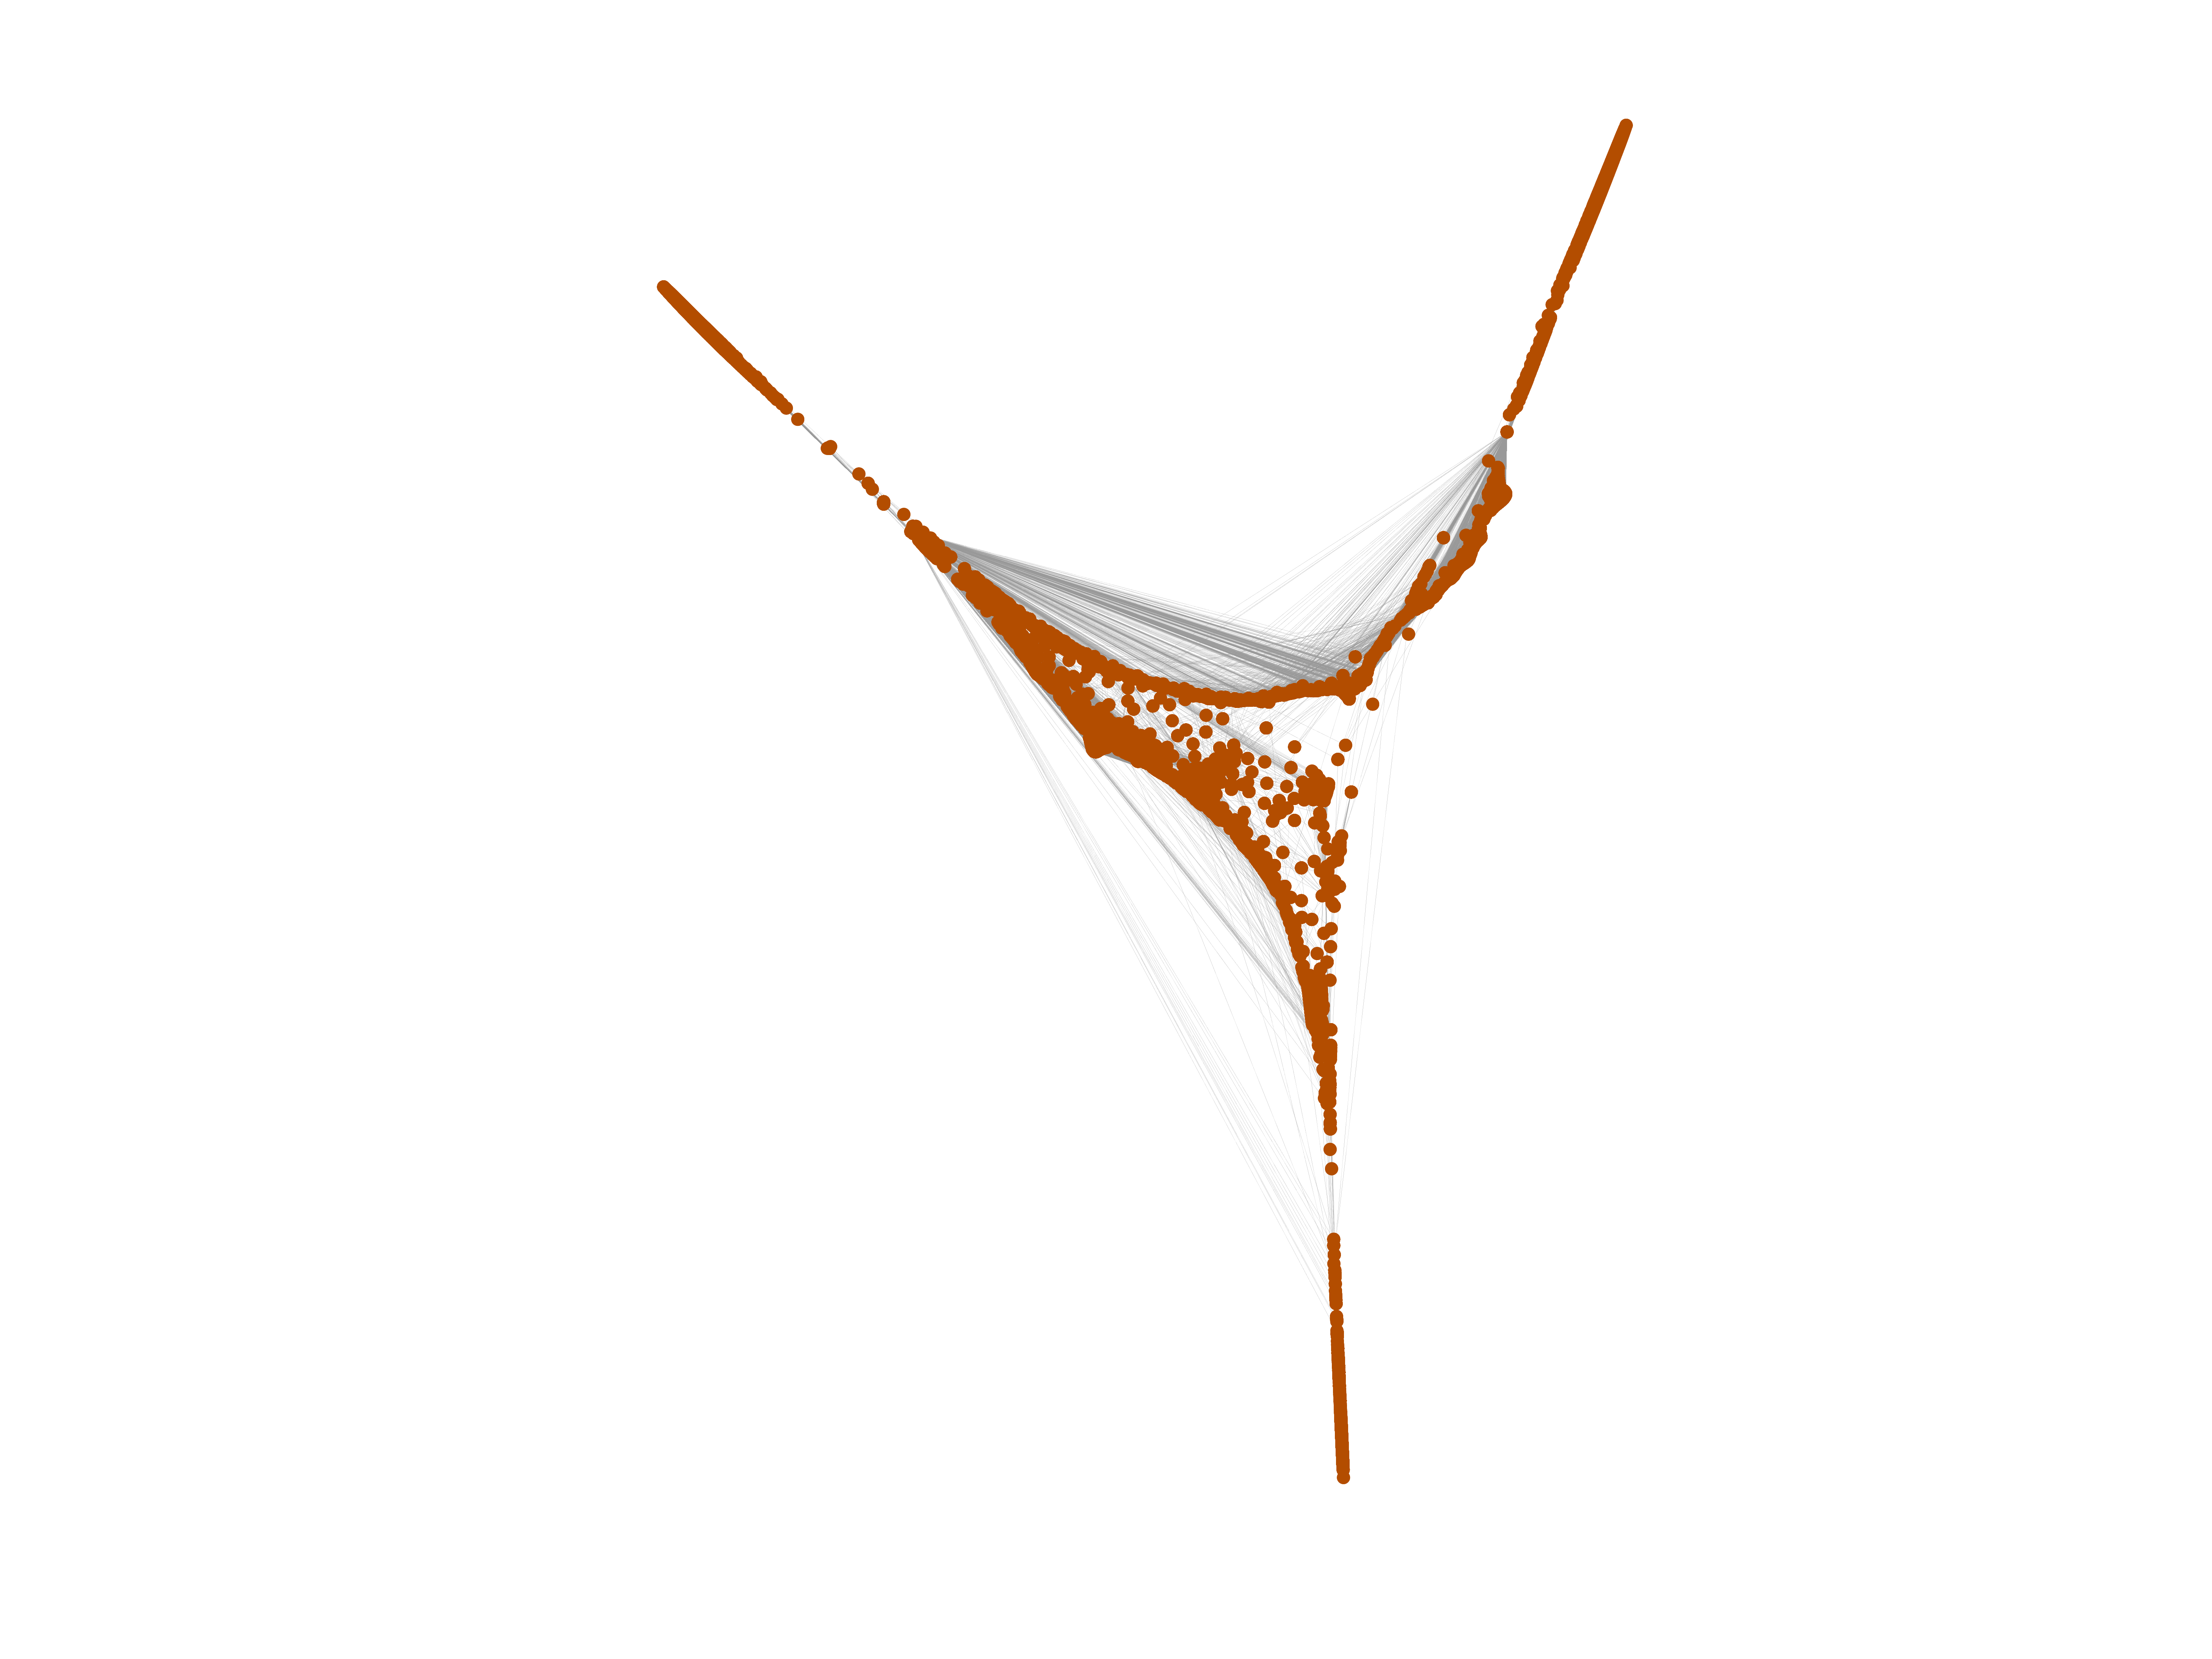
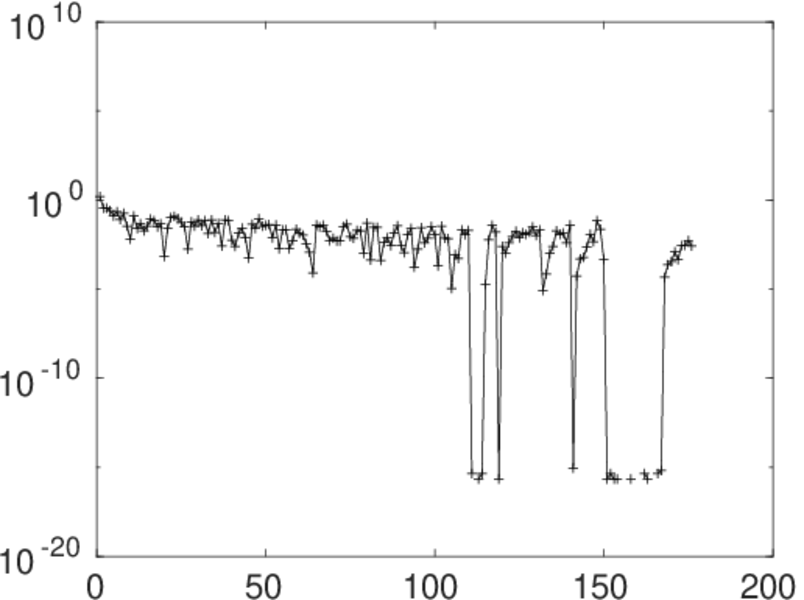
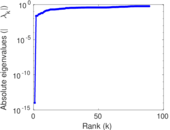
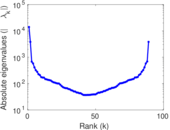
Matrix decompositions plots


Downloads
References
|
[1]
|
Jérôme Kunegis.
KONECT – The Koblenz Network Collection.
In Proc. Int. Conf. on World Wide Web Companion, pages
1343–1350, 2013.
[ http ]
|
|
[2]
|
Wikimedia Foundation.
Wikimedia downloads.
http://dumps.wikimedia.org/, January 2010.
|
 KONECT ‣ Networks ‣
Buy Me a Coffee
KONECT ‣ Networks ‣
Buy Me a Coffee