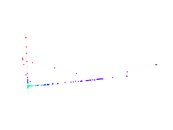
Wikiquote edits (ta)
This is the bipartite edit network of the Tamil Wikiquote. It contains users
and pages from the Tamil Wikiquote, connected by edit events. Each edge
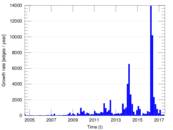
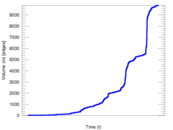
represents an edit. The dataset includes the timestamp of each edit.
Metadata
Statistics
| Size | n = | 3,097
|
| Left size | n1 = | 316
|
| Right size | n2 = | 2,781
|
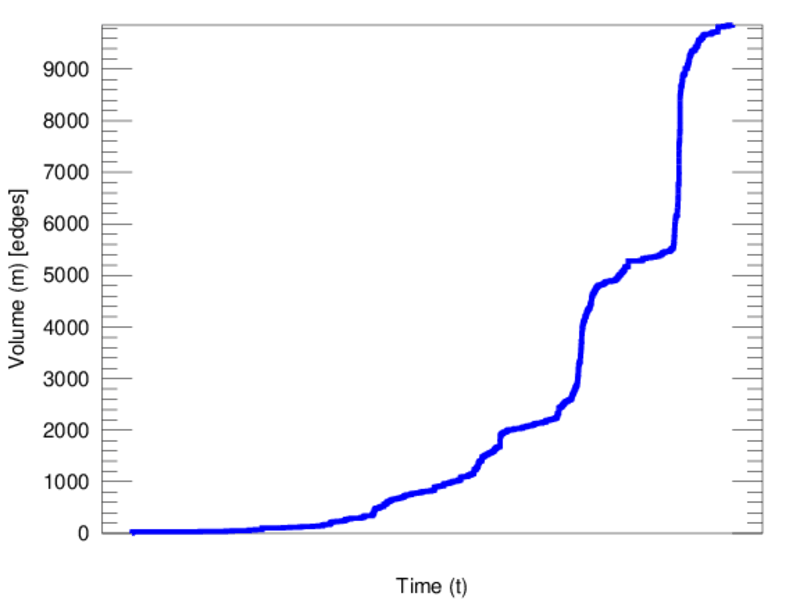
| Volume | m = | 9,857
|
| Unique edge count | m̿ = | 4,305
|
| Wedge count | s = | 703,865
|
| Claw count | z = | 132,751,728
|
| Cross count | x = | 21,065,027,363
|
| Square count | q = | 46,649
|
| 4-Tour count | T4 = | 3,197,486
|
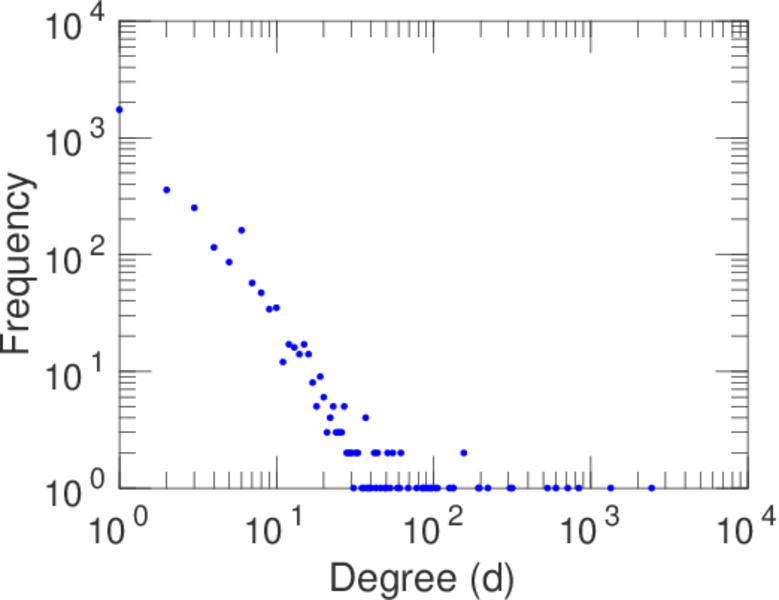
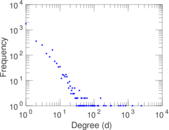
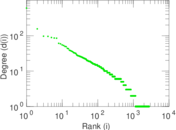
| Maximum degree | dmax = | 2,448
|
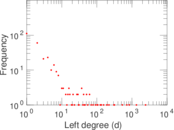
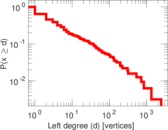
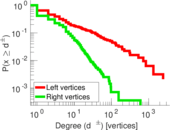
| Maximum left degree | d1max = | 2,448
|
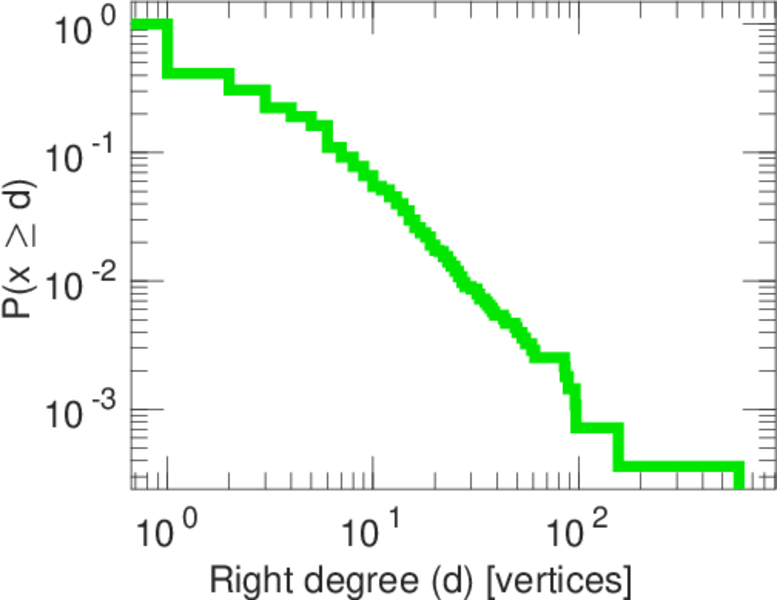
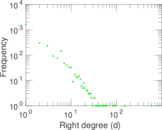
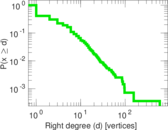
| Maximum right degree | d2max = | 602
|
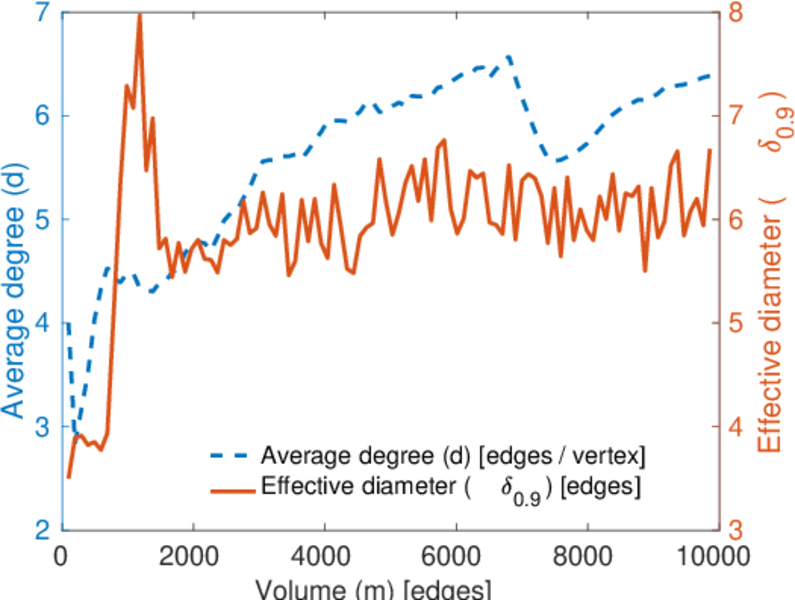
| Average degree | d = | 6.365 52
|
| Average left degree | d1 = | 31.193 0
|
| Average right degree | d2 = | 3.544 41
|
| Fill | p = | 0.004 898 75
|
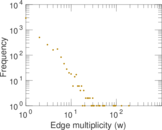
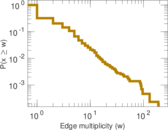
| Average edge multiplicity | m̃ = | 2.289 66
|
| Size of LCC | N = | 2,844
|
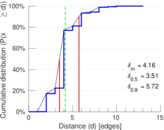
| Diameter | δ = | 13
|
| 50-Percentile effective diameter | δ0.5 = | 3.505 17
|
| 90-Percentile effective diameter | δ0.9 = | 5.724 00
|
| Median distance | δM = | 4
|
| Mean distance | δm = | 4.160 11
|
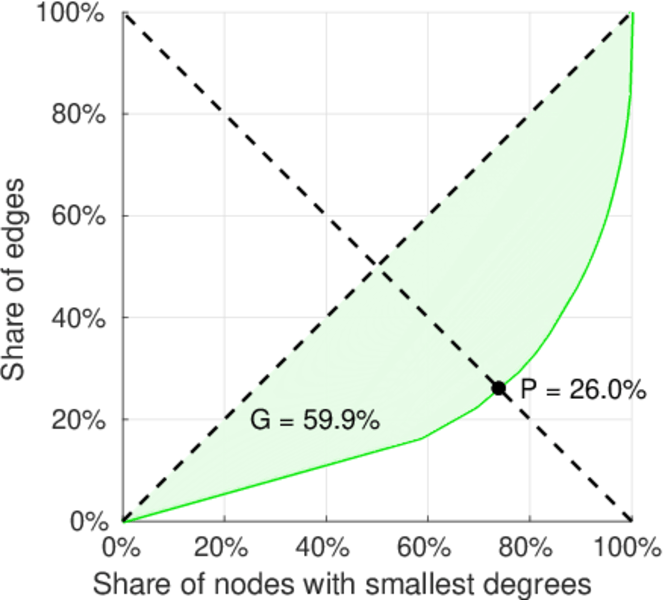
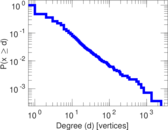
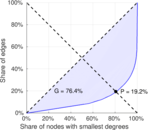
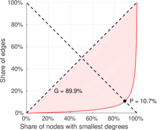
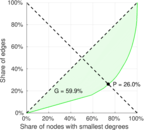
| Gini coefficient | G = | 0.770 955
|
| Balanced inequality ratio | P = | 0.191 184
|
| Left balanced inequality ratio | P1 = | 0.106 625
|
| Right balanced inequality ratio | P2 = | 0.259 815
|
| Relative edge distribution entropy | Her = | 0.783 274
|
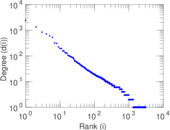
| Power law exponent | γ = | 4.120 95
|
| Tail power law exponent | γt = | 2.411 00
|
| Tail power law exponent with p | γ3 = | 2.411 00
|
| p-value | p = | 0.000 00
|
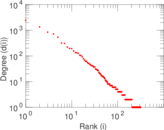
| Left tail power law exponent with p | γ3,1 = | 1.781 00
|
| Left p-value | p1 = | 0.648 000
|
| Right tail power law exponent with p | γ3,2 = | 2.621 00
|
| Right p-value | p2 = | 0.000 00
|
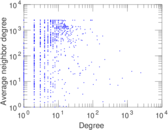
| Degree assortativity | ρ = | −0.292 921
|
| Degree assortativity p-value | pρ = | 6.235 84 × 10−86
|
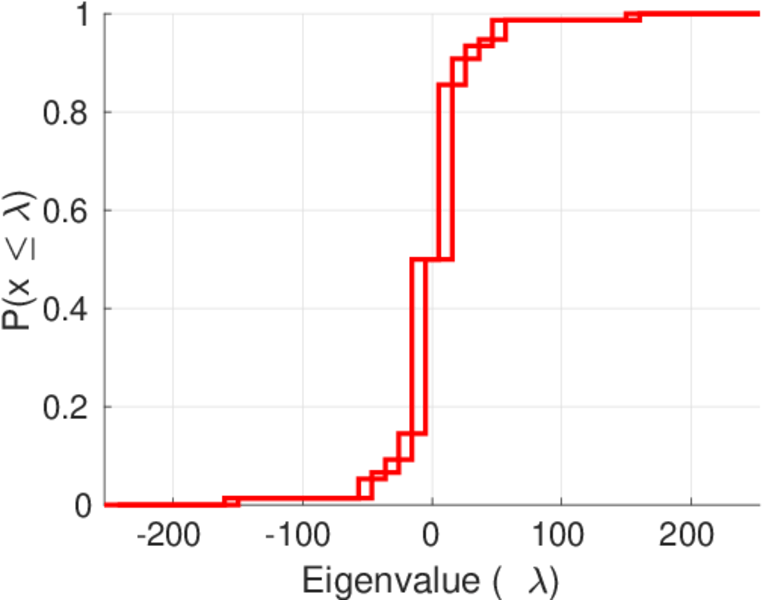
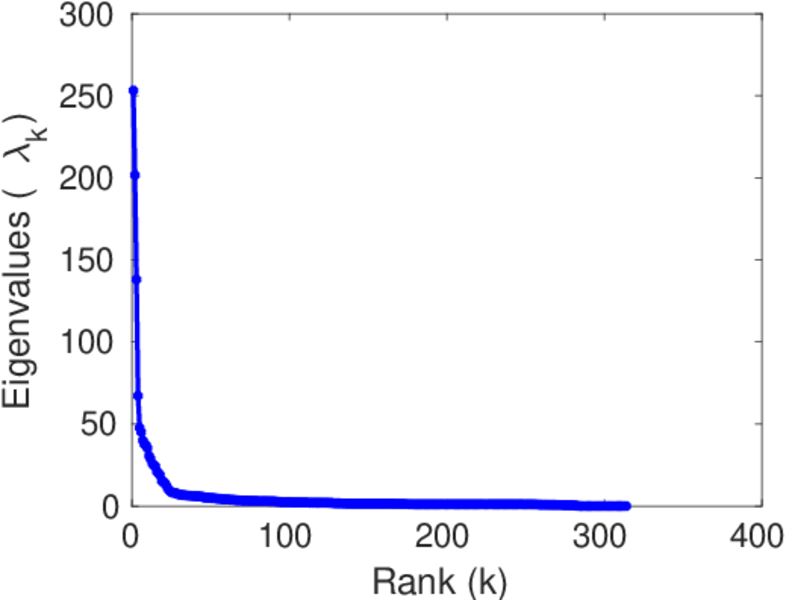
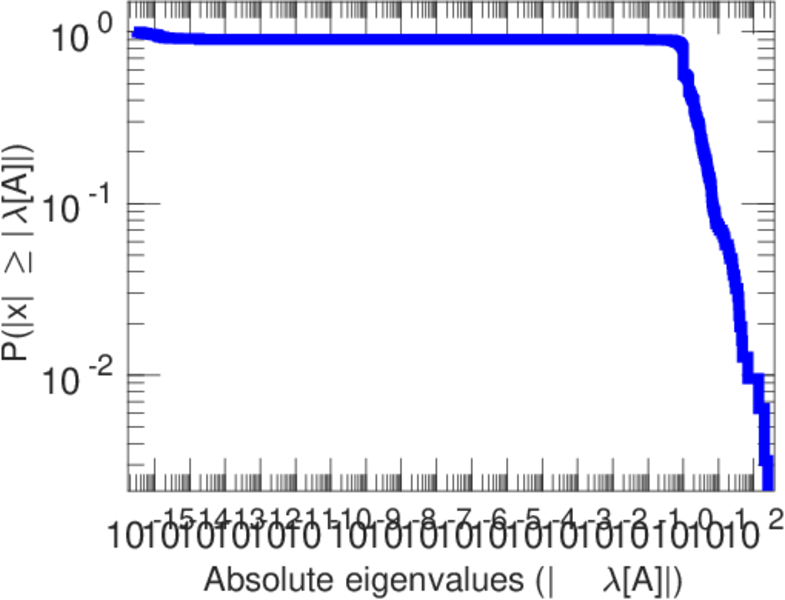
| Spectral norm | α = | 253.156
|
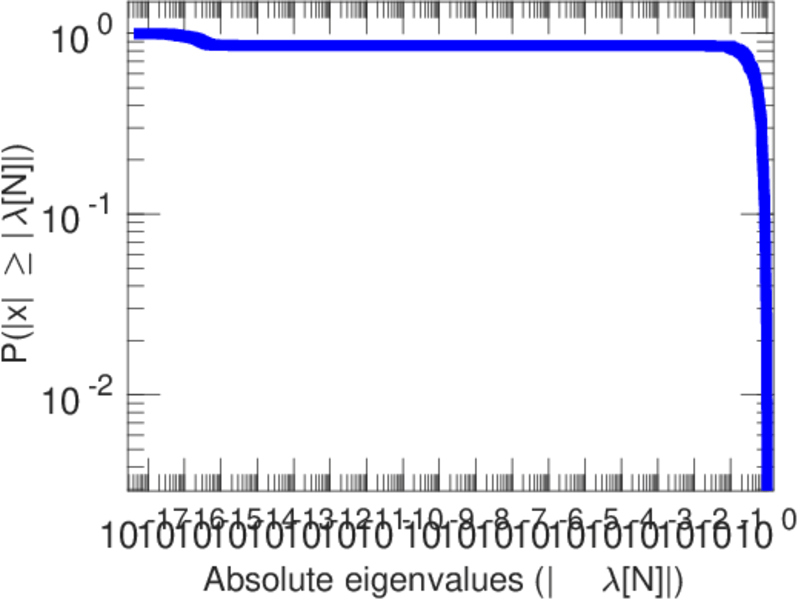
| Algebraic connectivity | a = | 0.016 205 9
|
| Spectral separation | |λ1[A] / λ2[A]| = | 1.255 27
|
| Controllability | C = | 2,521
|
| Relative controllability | Cr = | 0.816 650
|
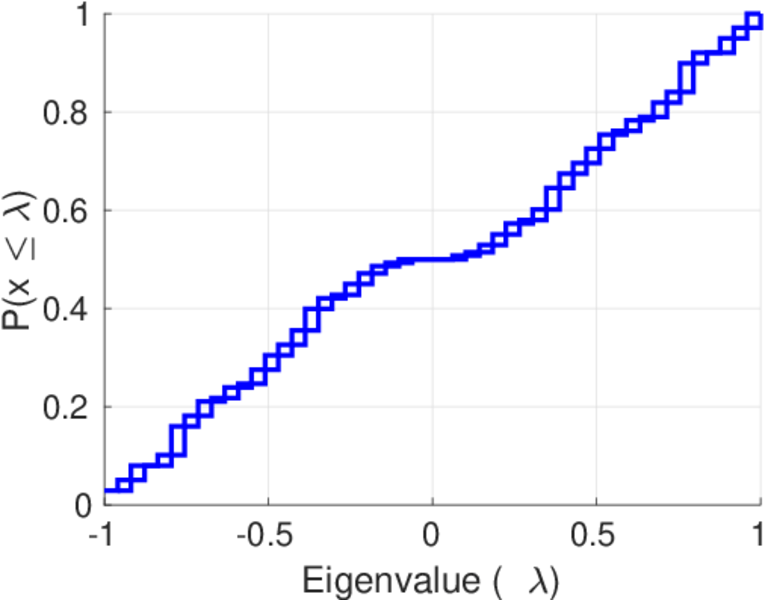
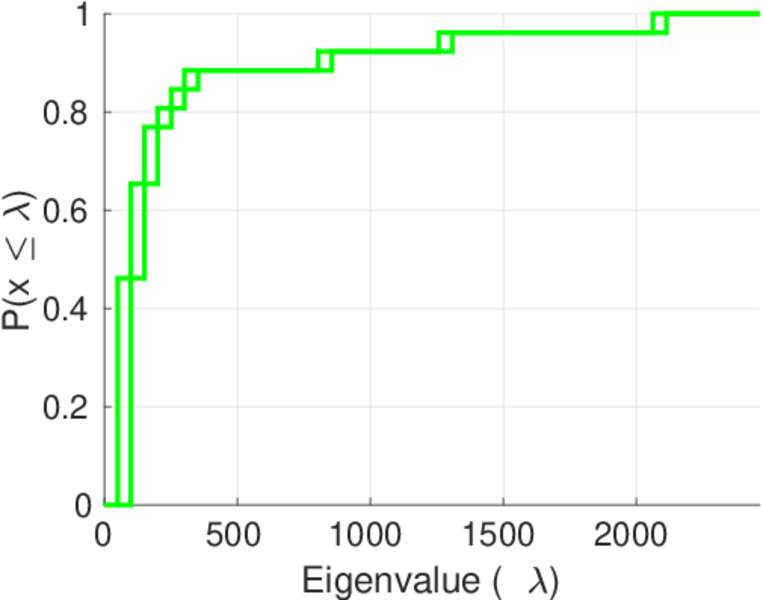
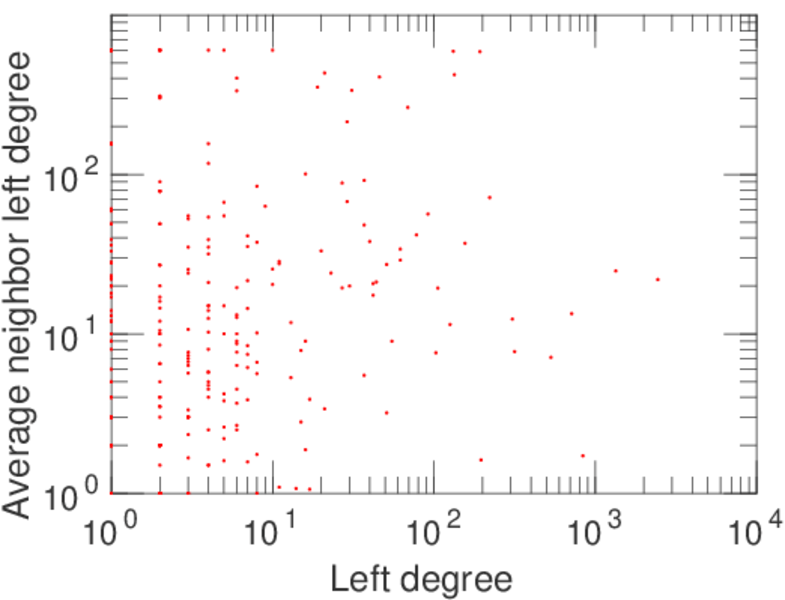
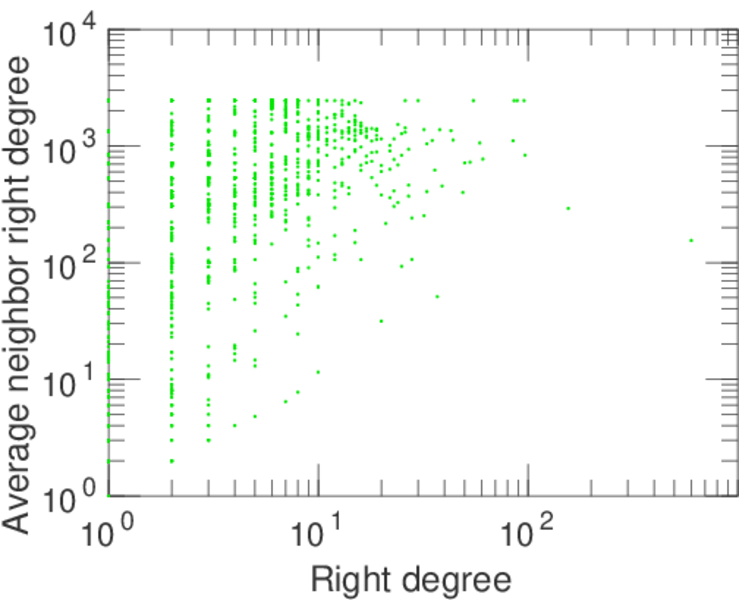
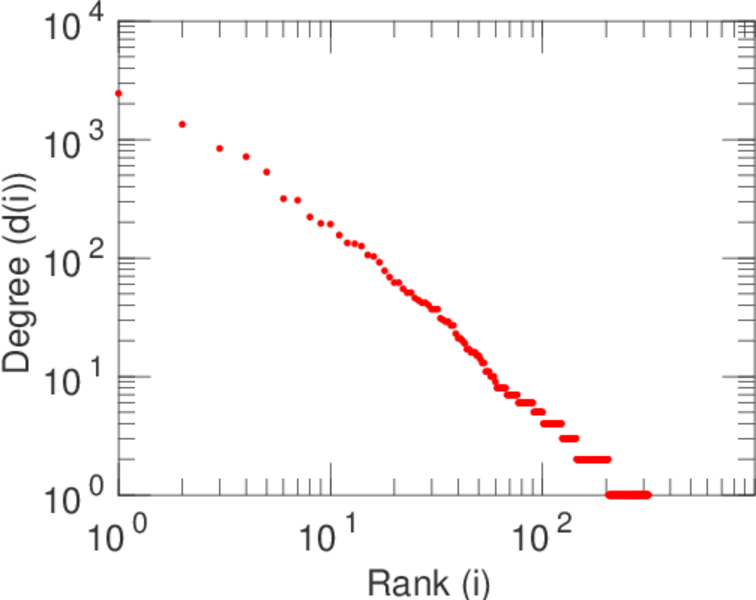
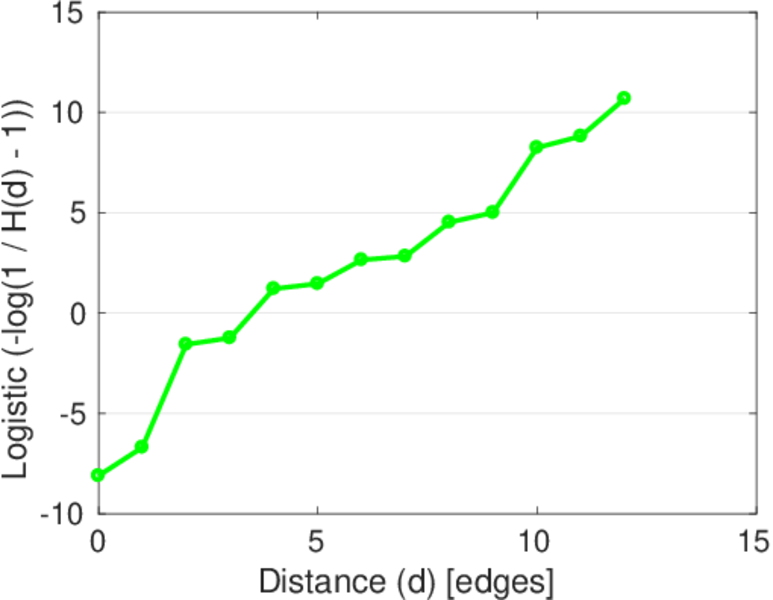
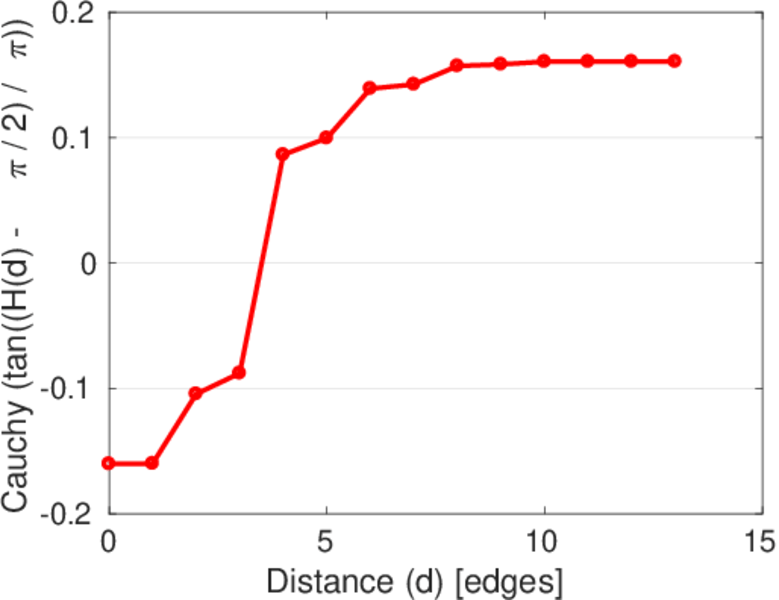
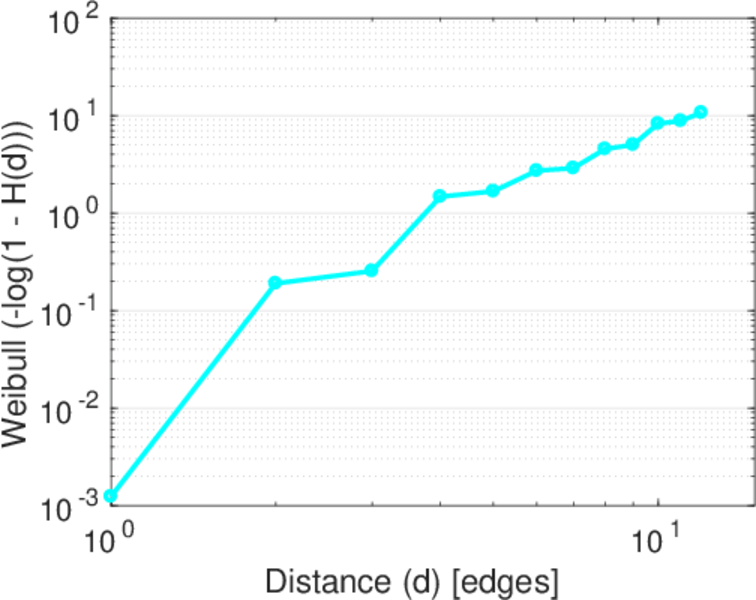
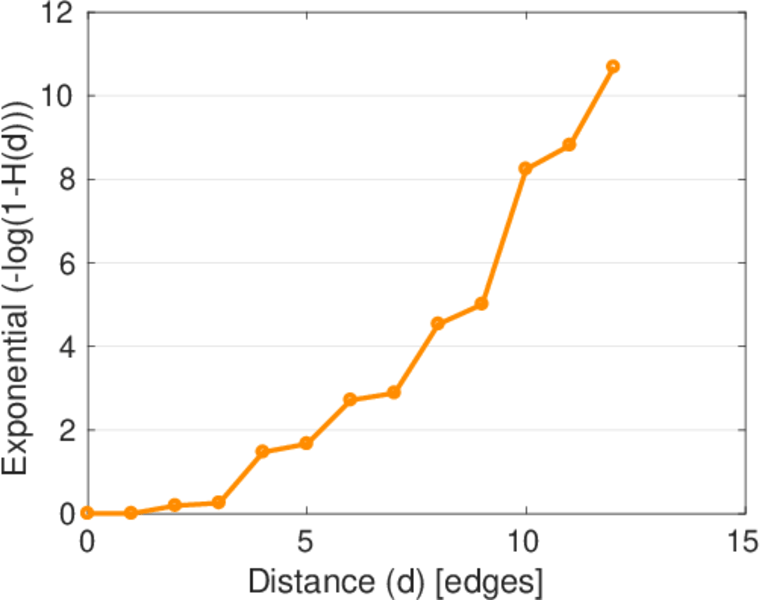
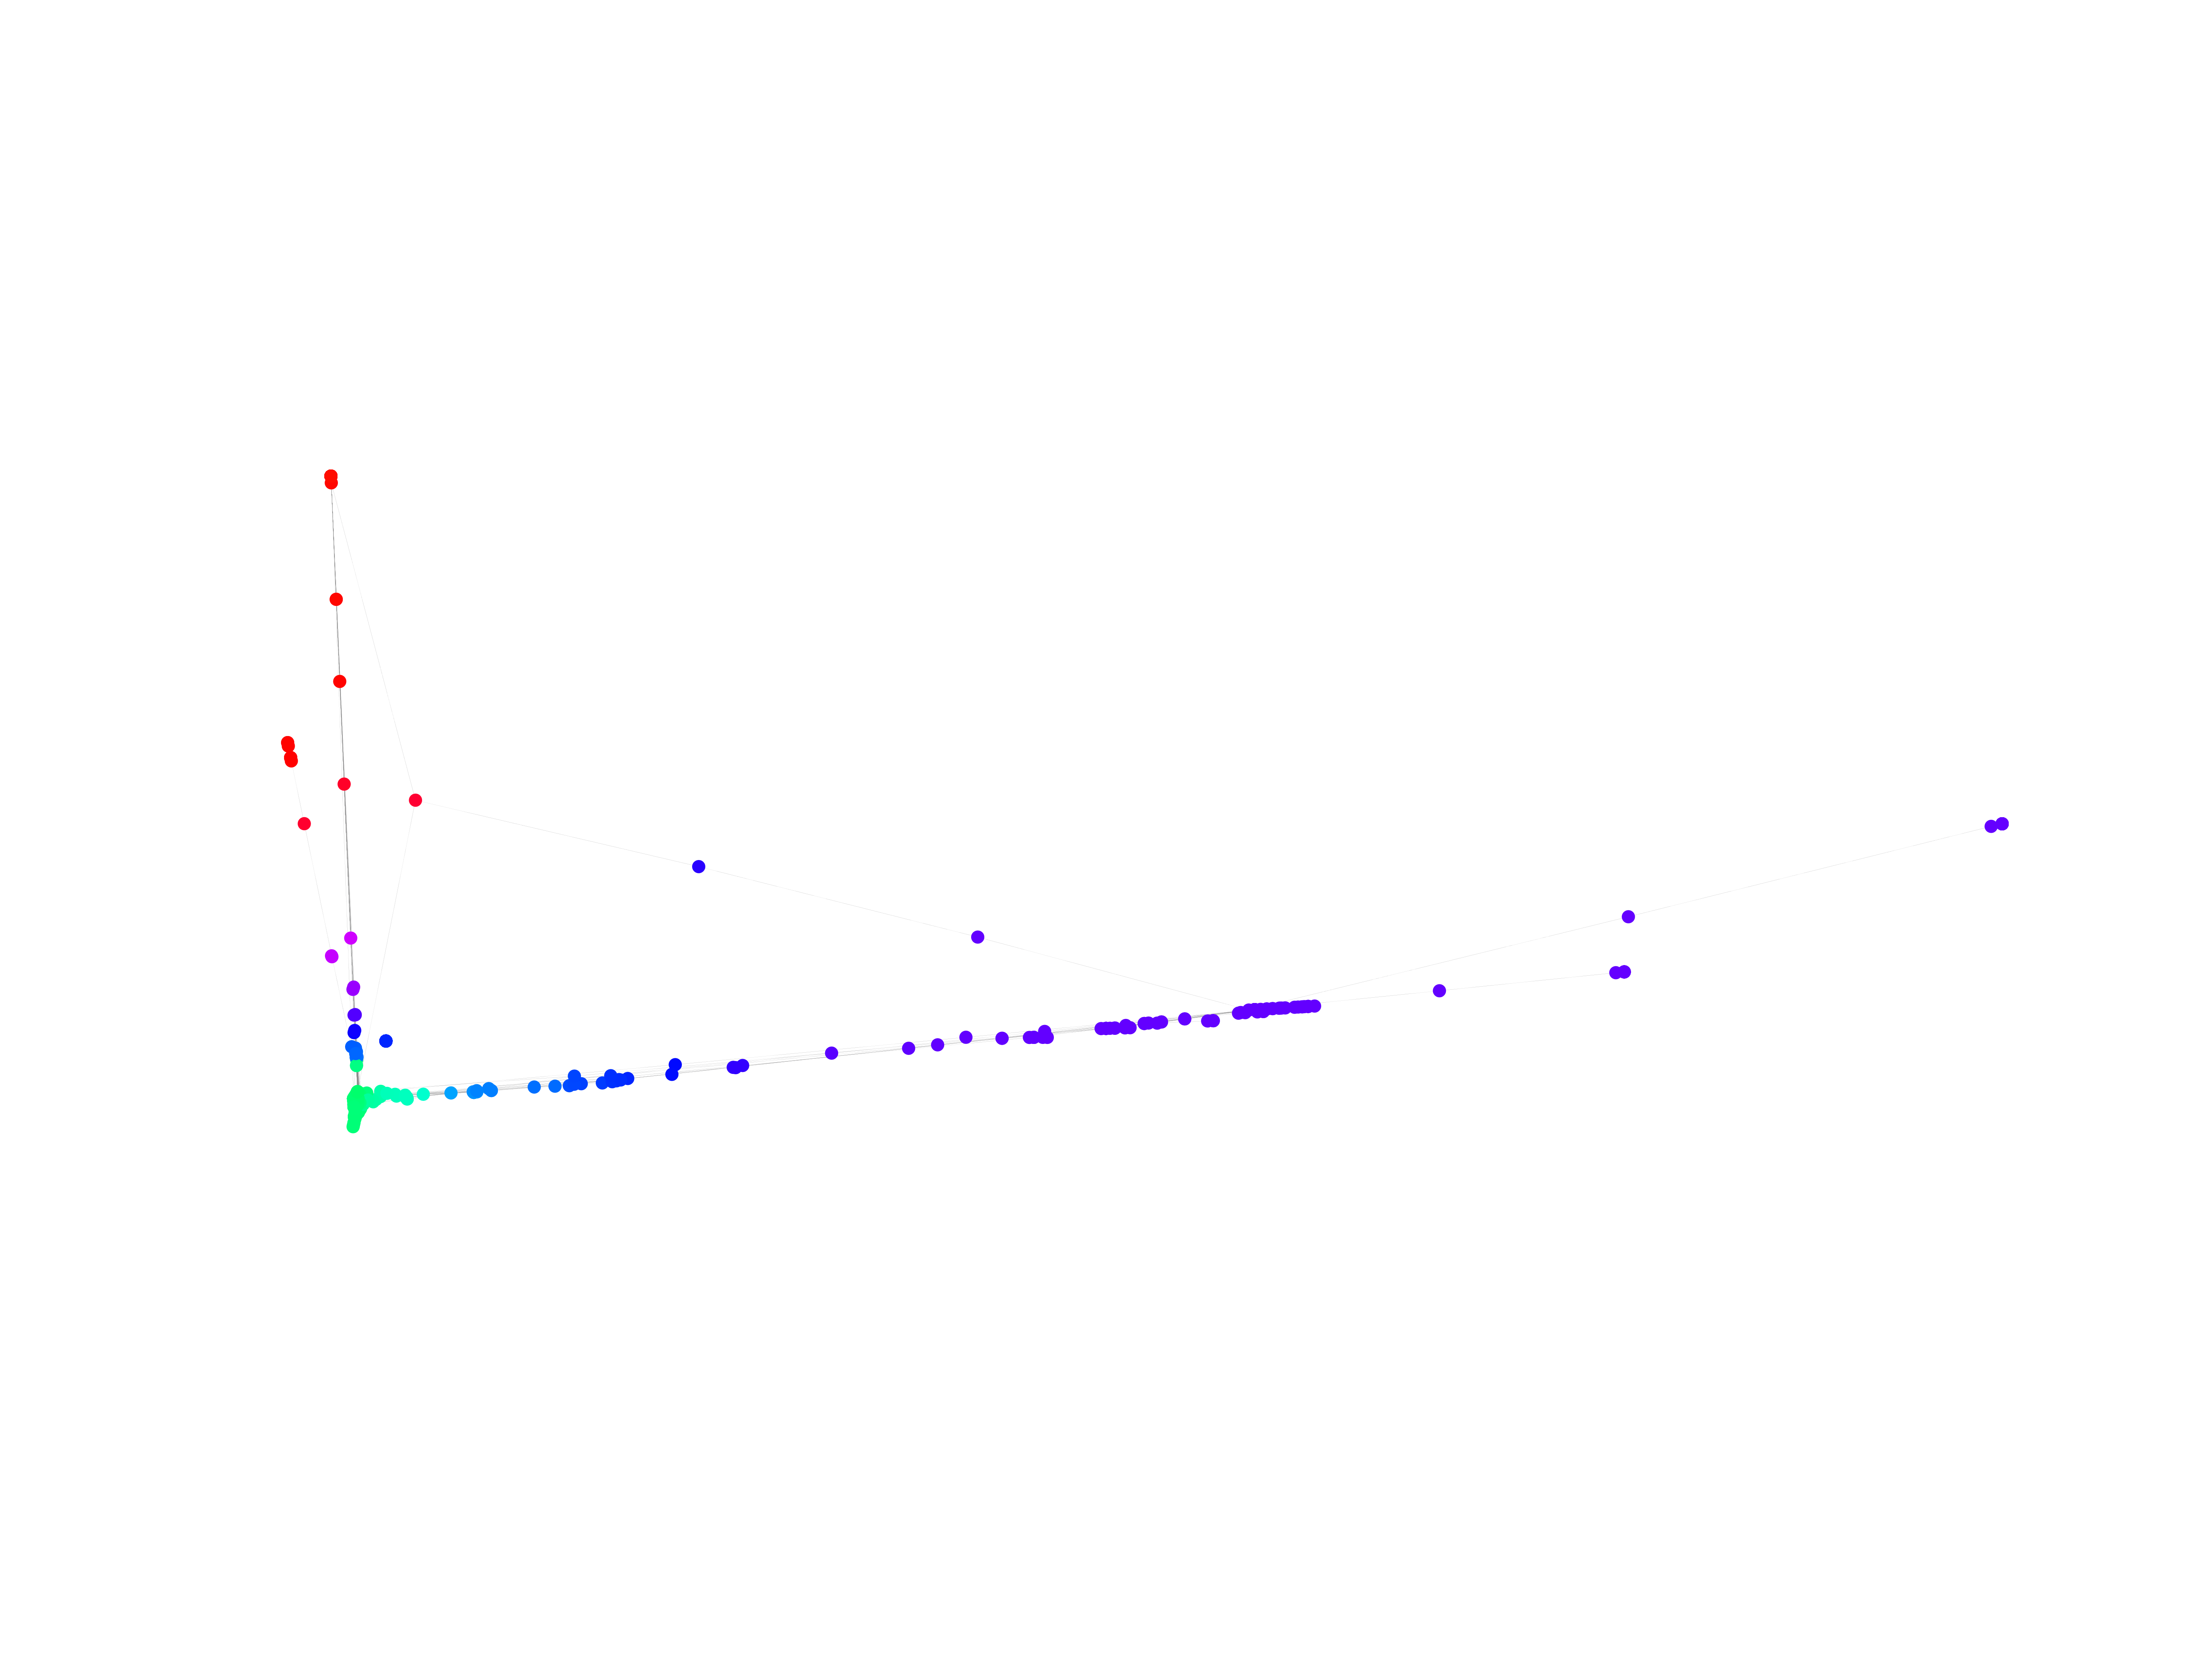
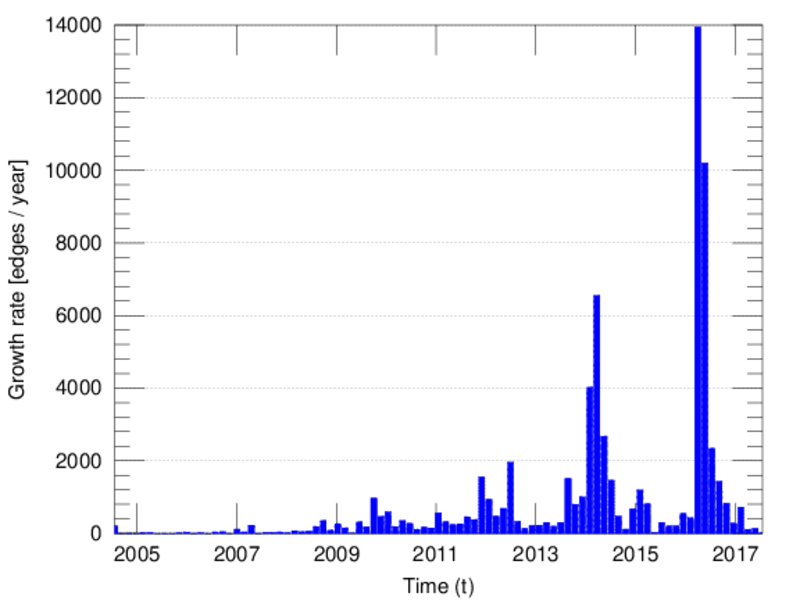
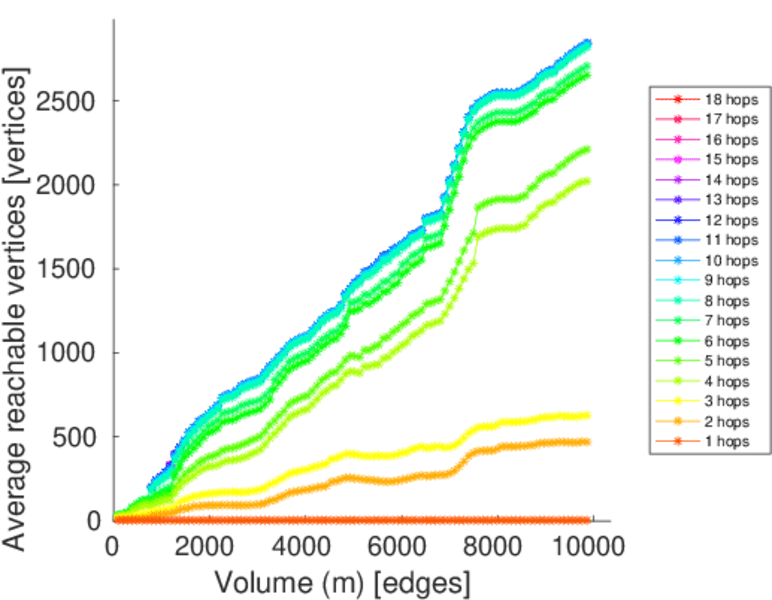
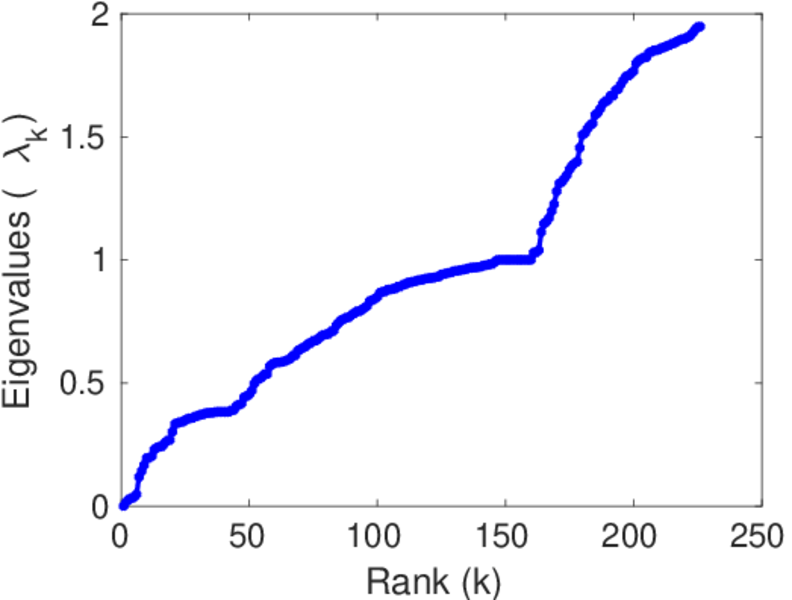
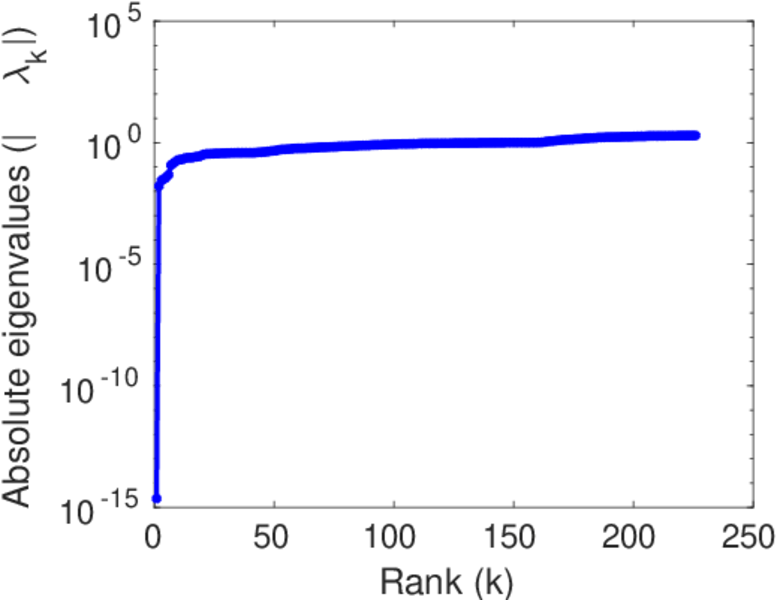
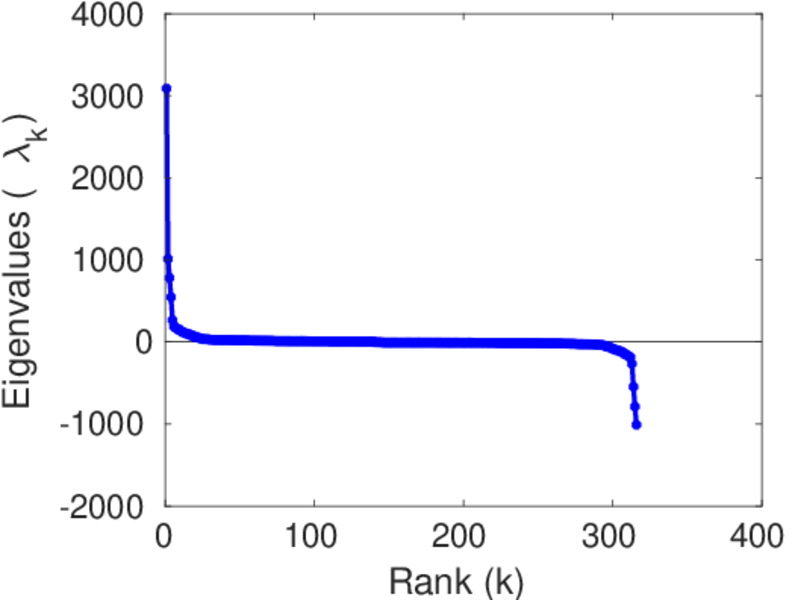
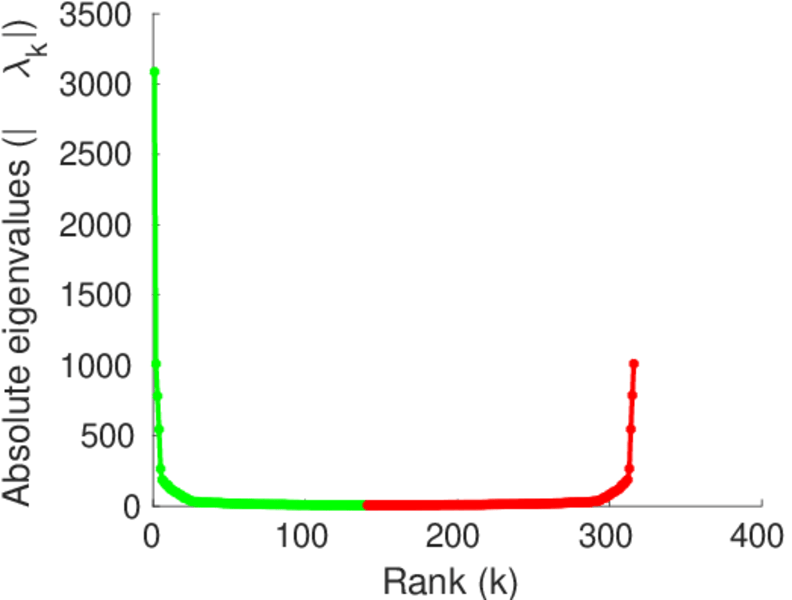
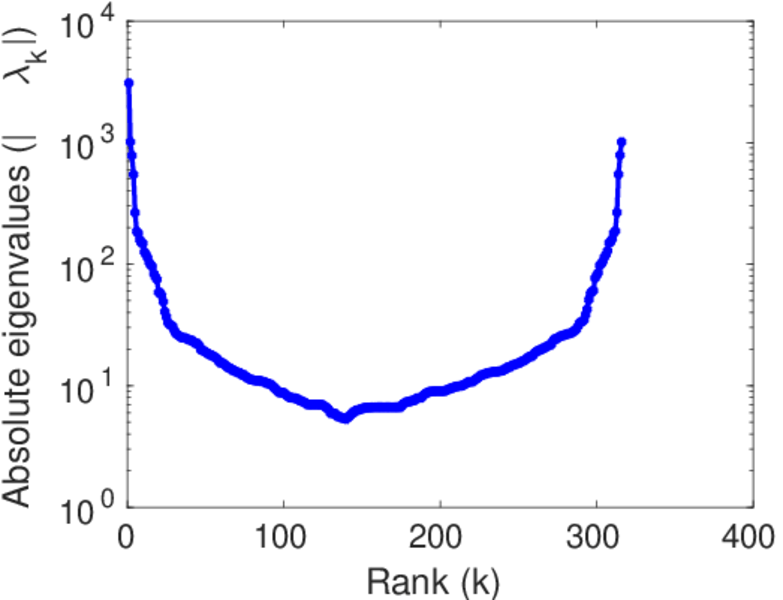
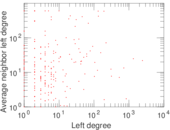
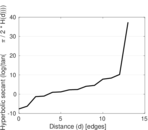
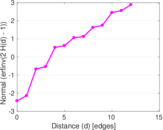
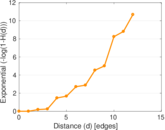
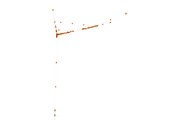
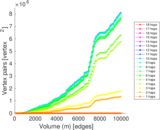
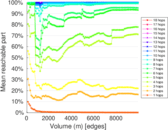
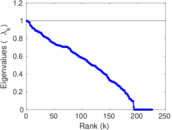
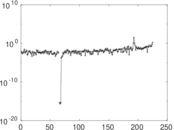
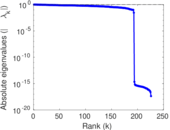
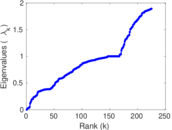
Plots


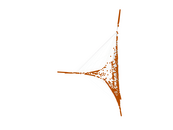
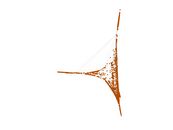


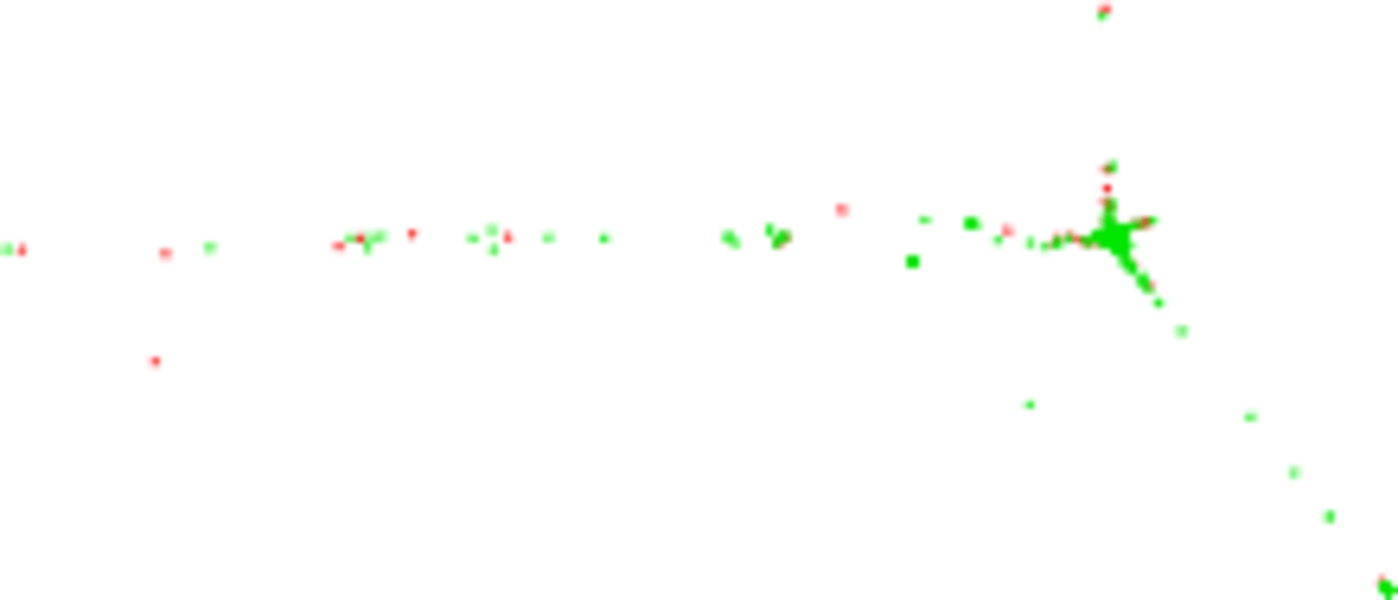
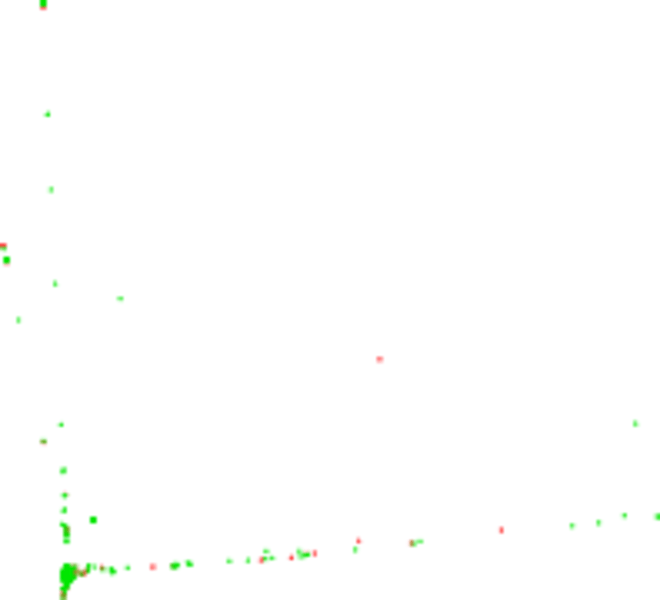
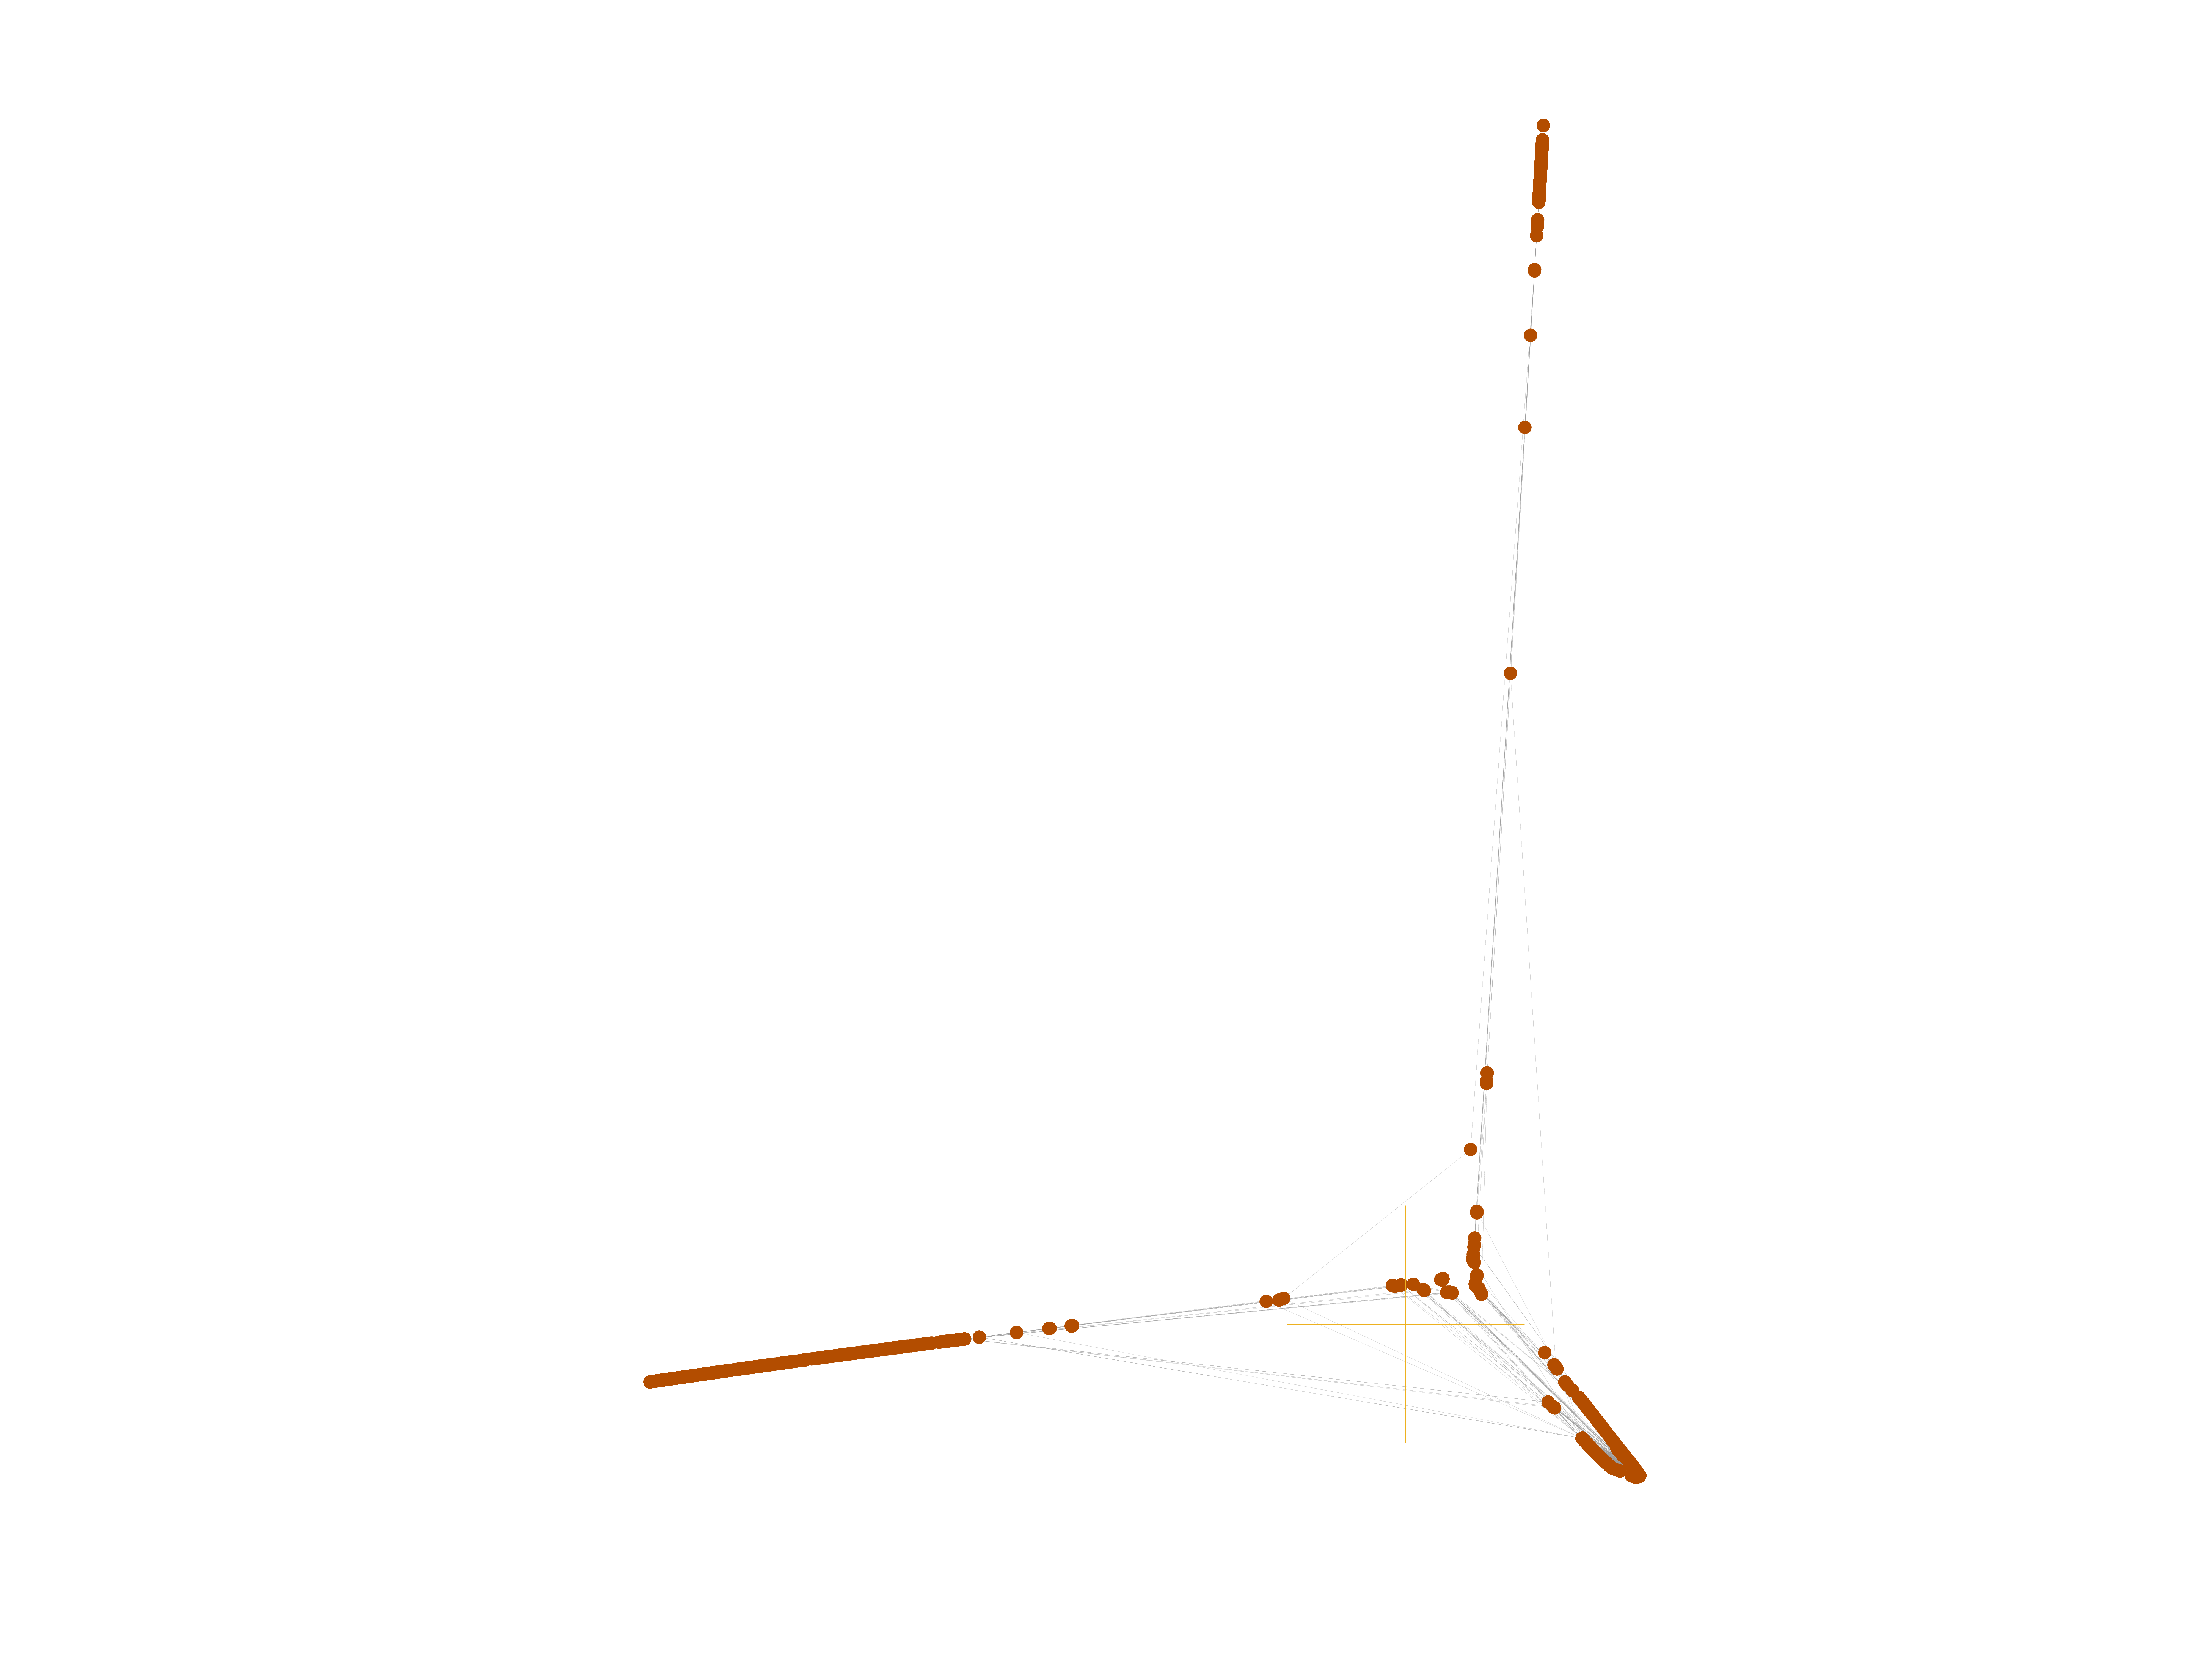
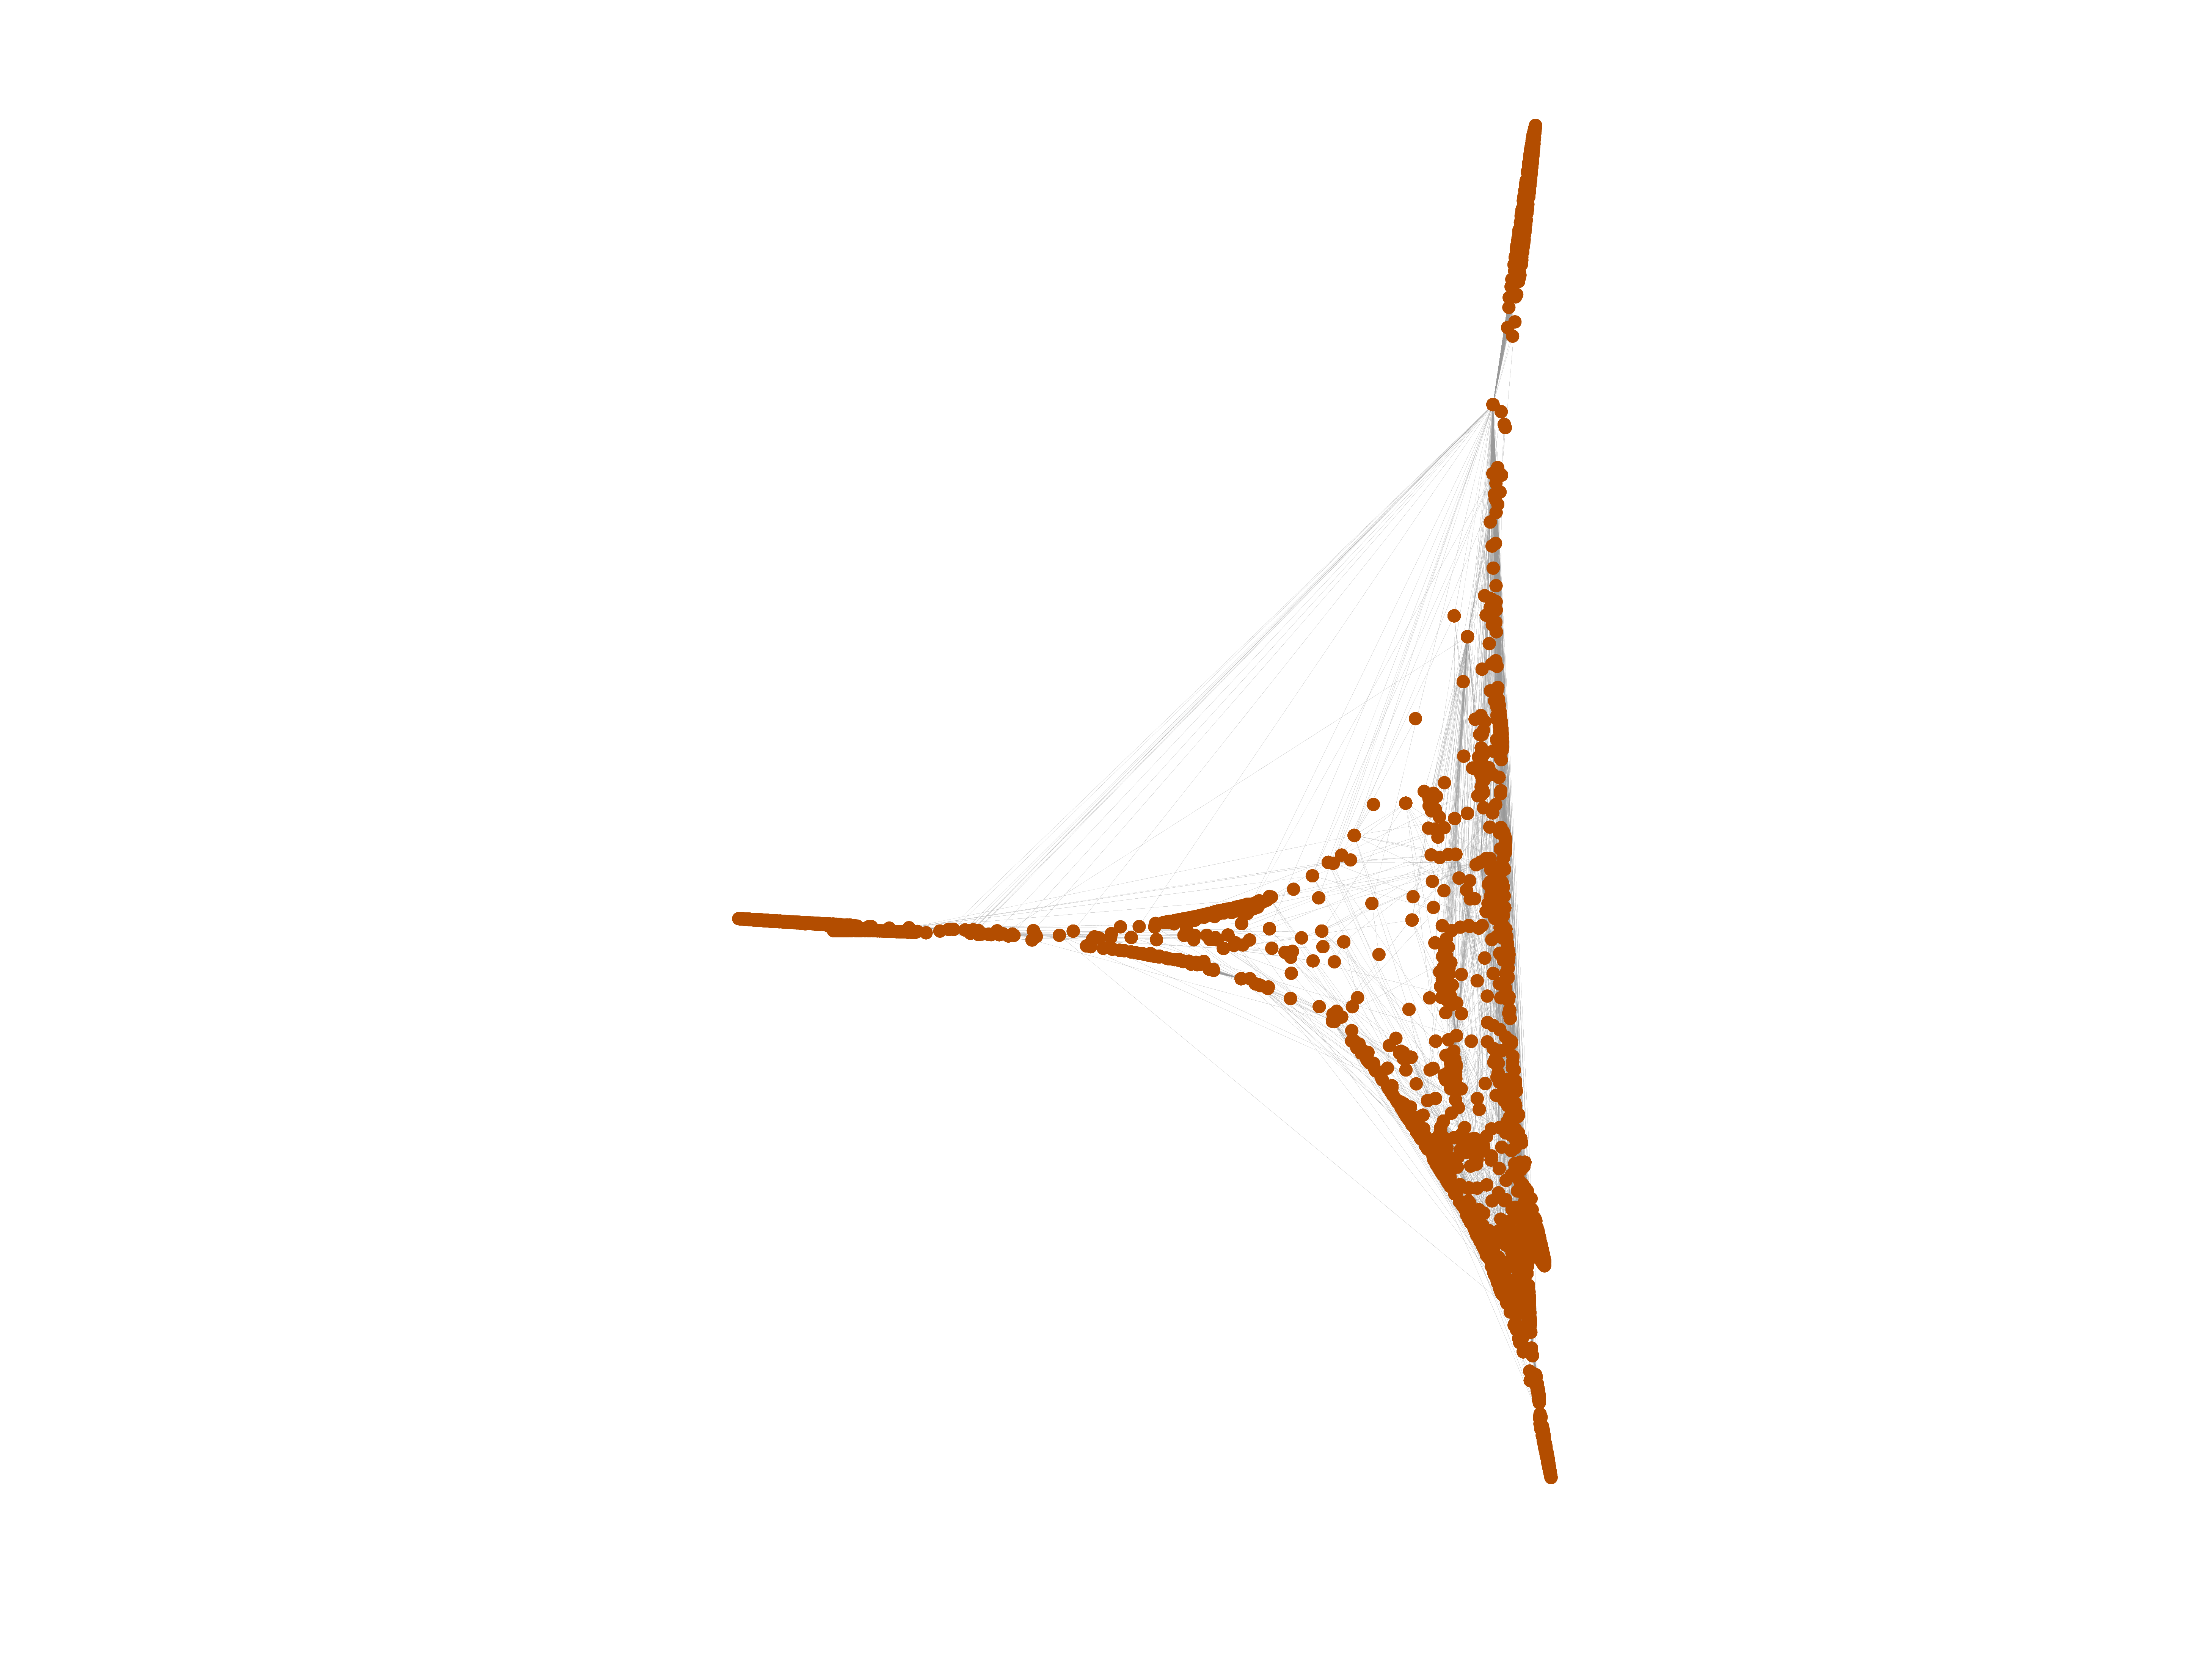
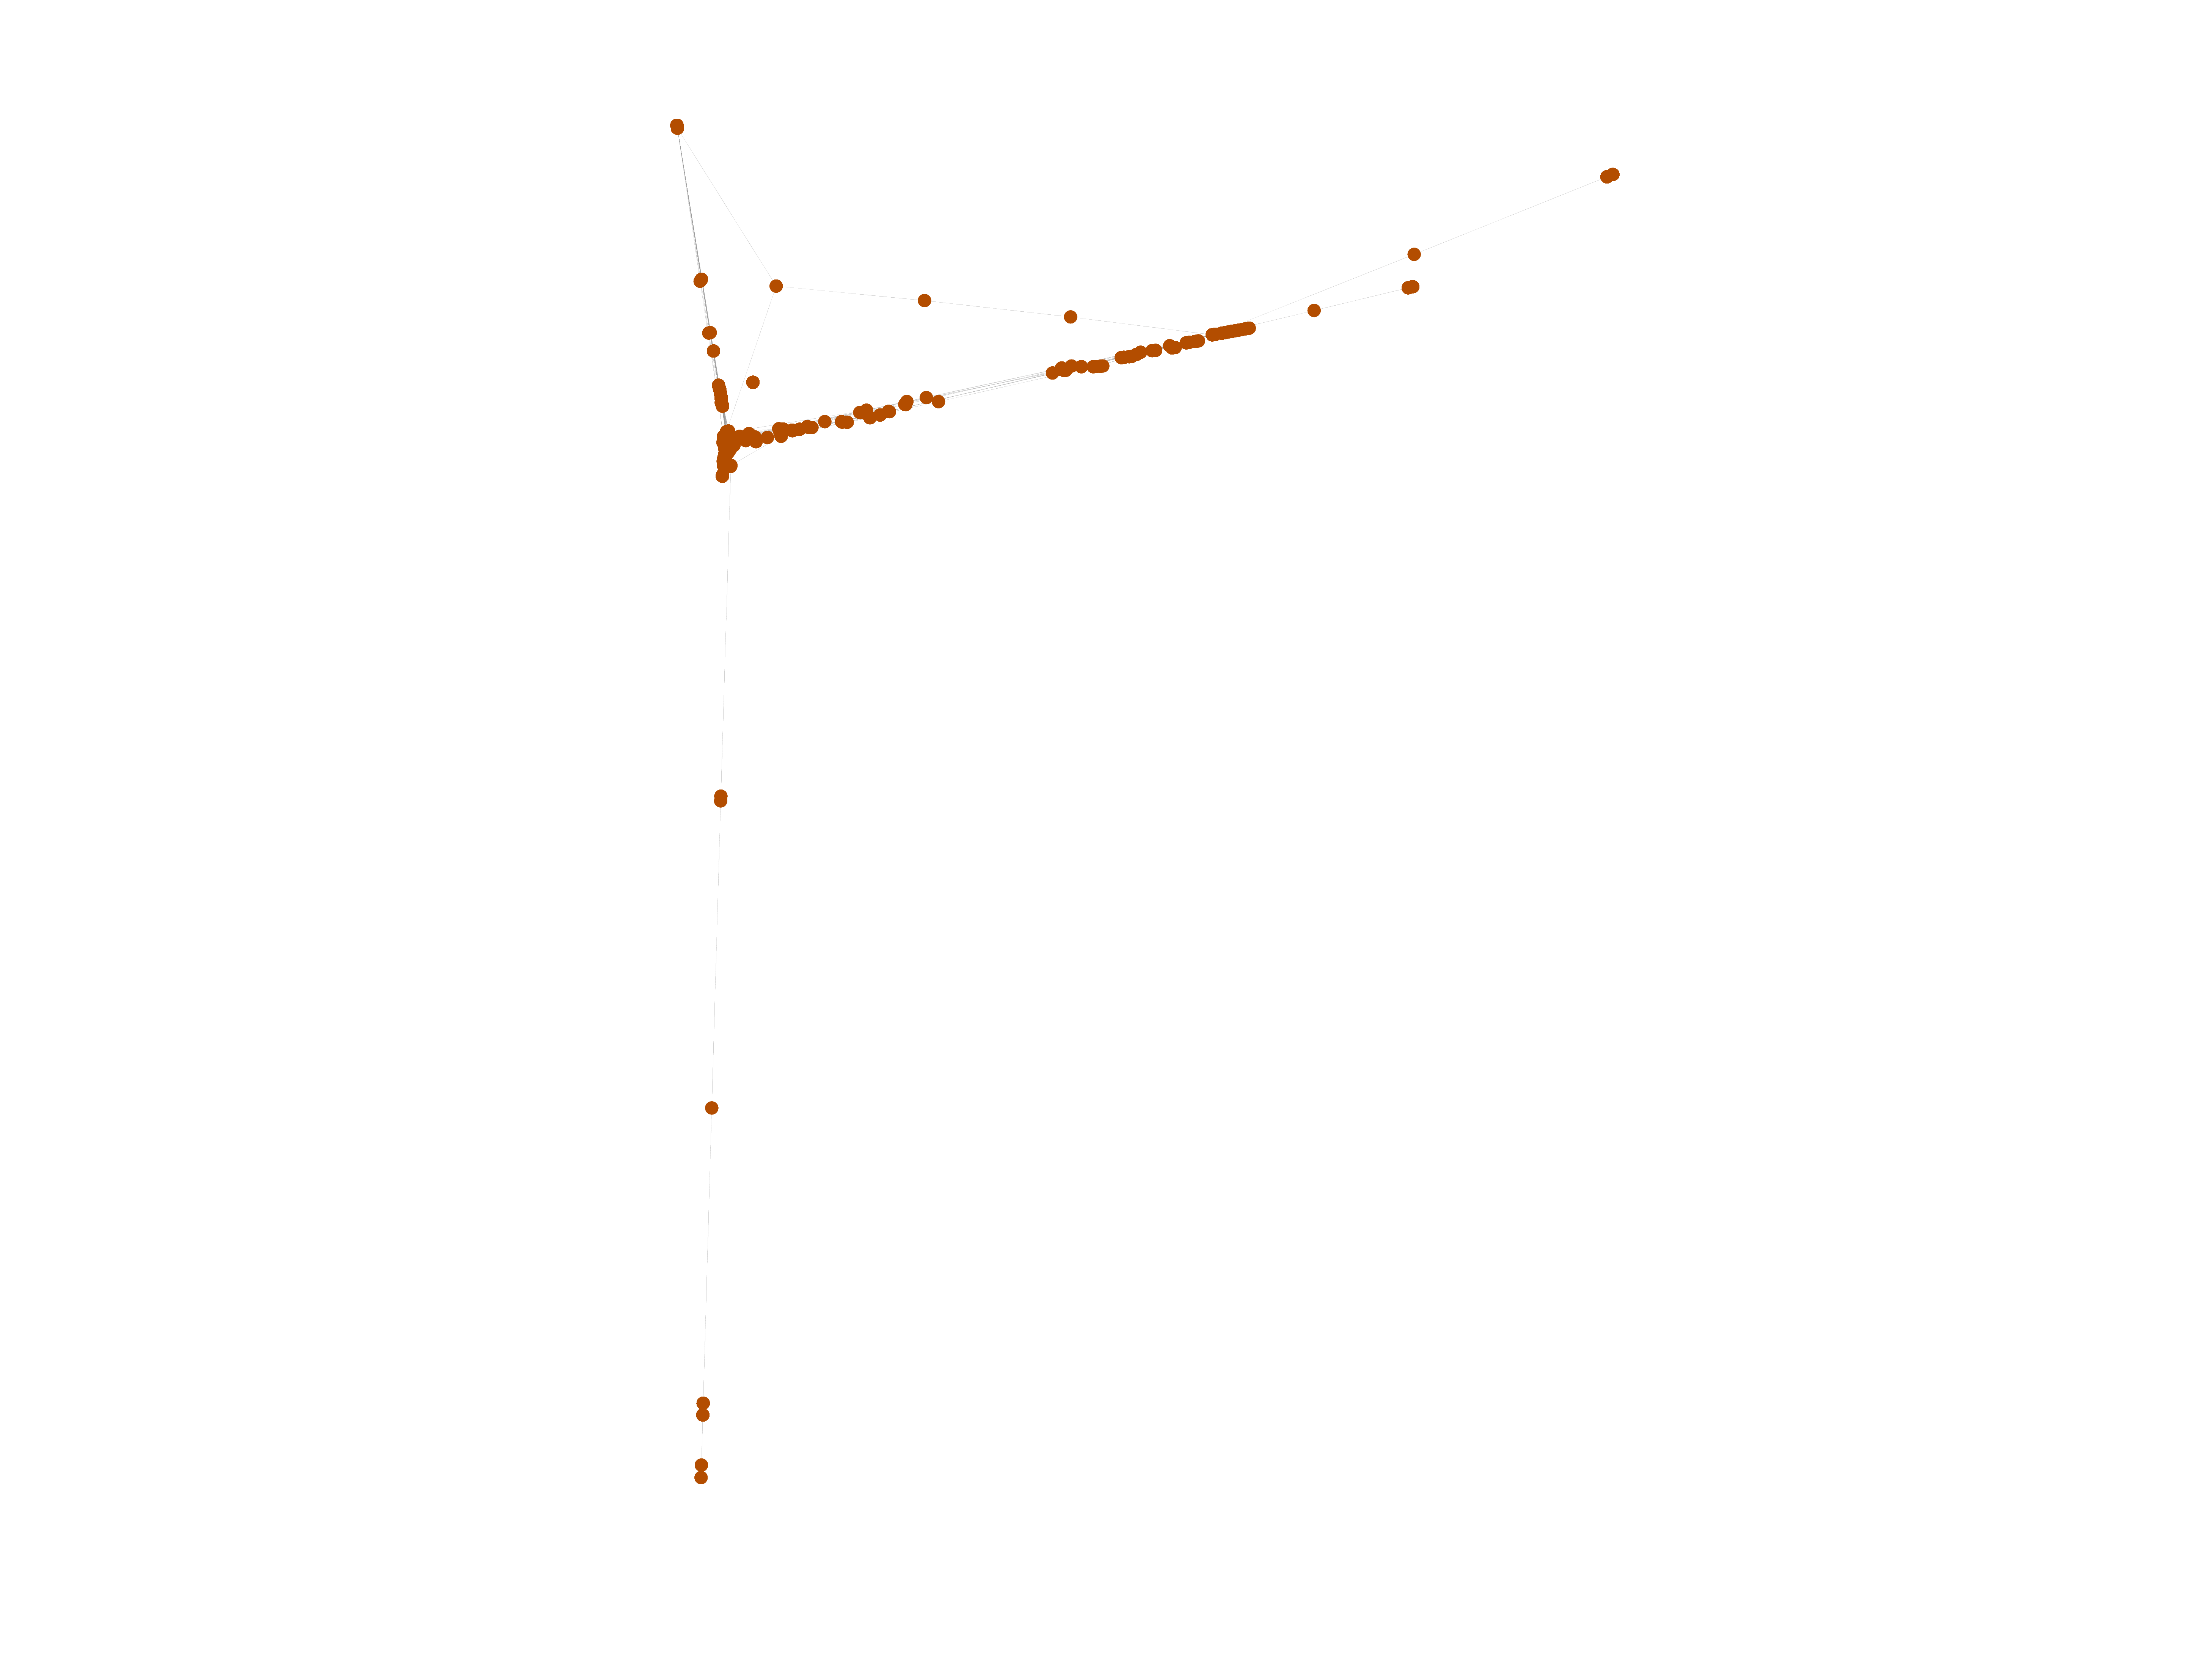
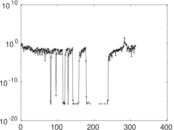
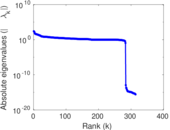
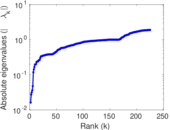
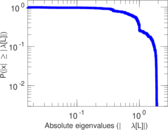
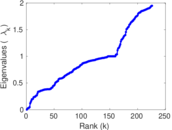
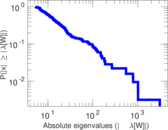
Matrix decompositions plots


Downloads
References
|
[1]
|
Jérôme Kunegis.
KONECT – The Koblenz Network Collection.
In Proc. Int. Conf. on World Wide Web Companion, pages
1343–1350, 2013.
[ http ]
|
|
[2]
|
Wikimedia Foundation.
Wikimedia downloads.
http://dumps.wikimedia.org/, January 2010.
|
 KONECT ‣ Networks ‣
Buy Me a Coffee
KONECT ‣ Networks ‣
Buy Me a Coffee