Wikiquote edits (ta)
This is the bipartite edit network of the Tamil Wikisource. It contains users
and pages from the Tamil Wikisource, connected by edit events. Each edge
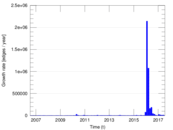
represents an edit. The dataset includes the timestamp of each edit.
Metadata
Statistics
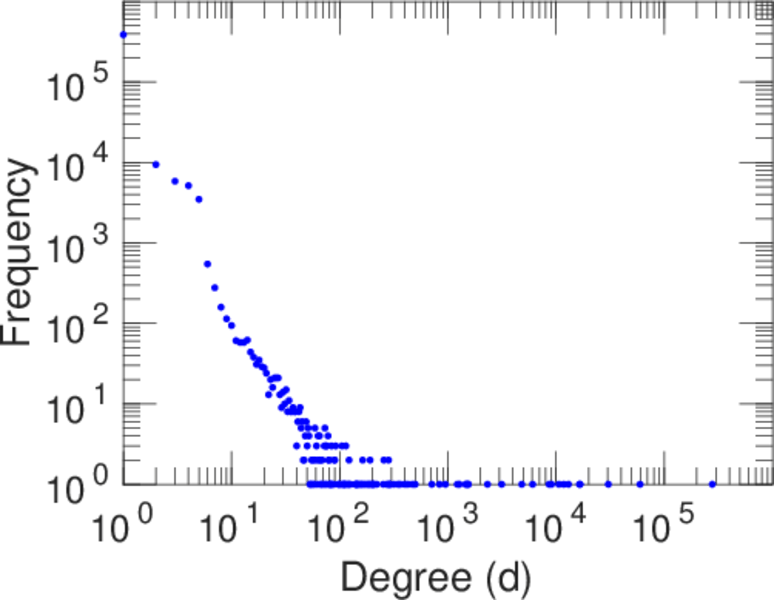
| Size | n = | 413,526
|
| Left size | n1 = | 491
|
| Right size | n2 = | 413,035
|
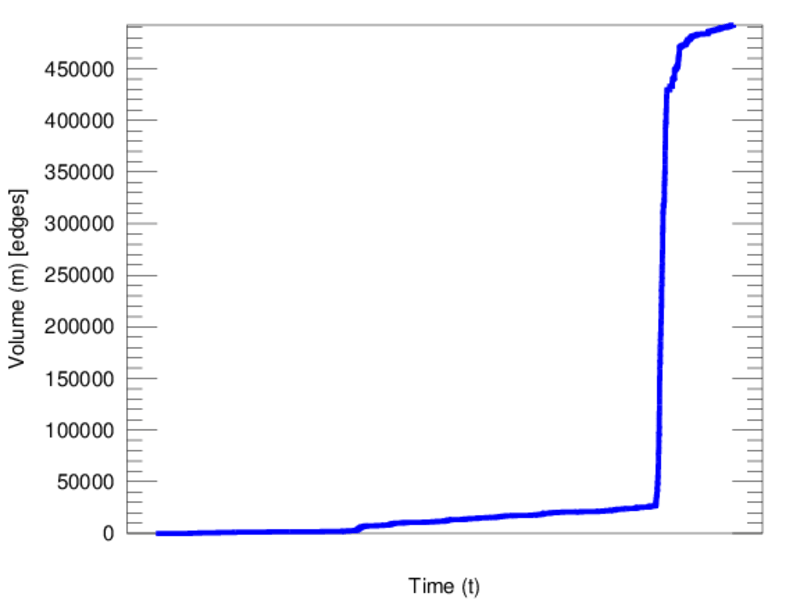
| Volume | m = | 492,375
|
| Unique edge count | m̿ = | 449,917
|
| Wedge count | s = | 40,514,450,337
|
| Cross count | x = | 2.399 3 × 10²⁰
|
| Square count | q = | 77,045,767
|
| 4-Tour count | T4 = | 162,675,069,846
|
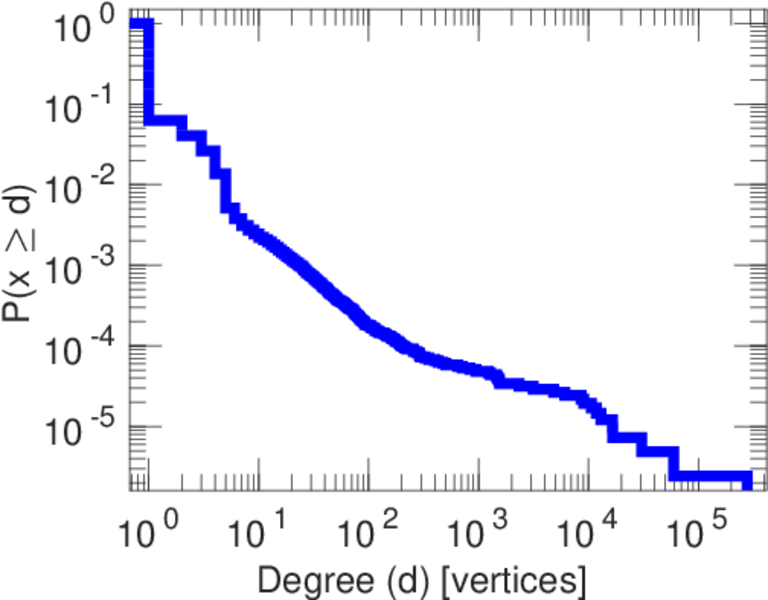
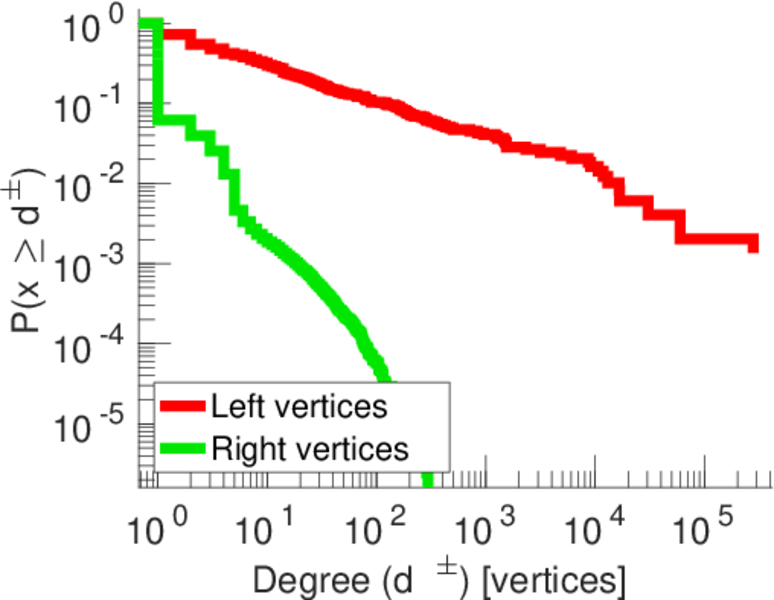
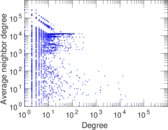
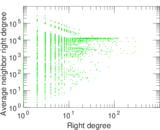
| Maximum degree | dmax = | 277,985
|
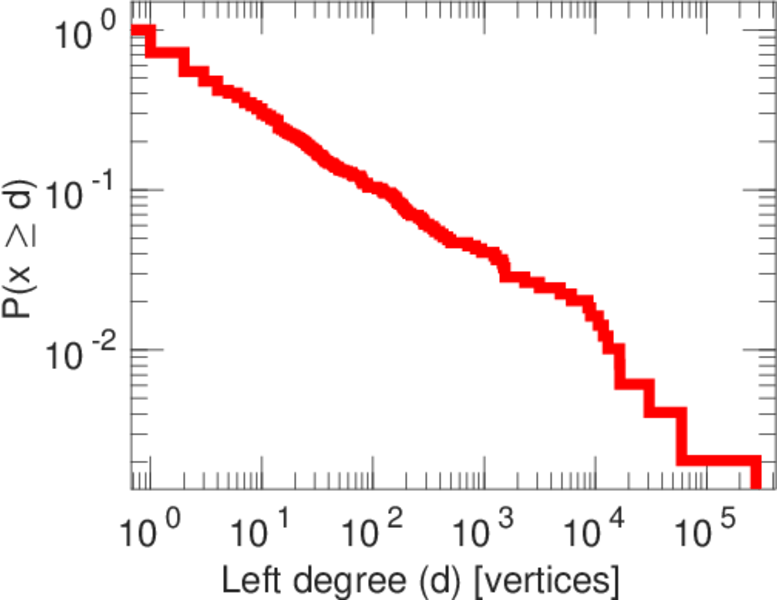
| Maximum left degree | d1max = | 277,985
|
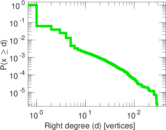
| Maximum right degree | d2max = | 295
|
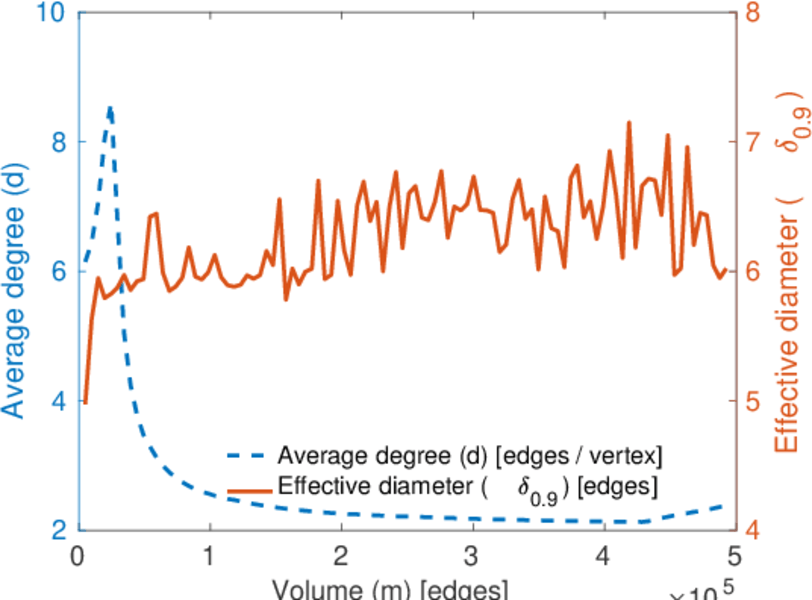
| Average degree | d = | 2.381 35
|
| Average left degree | d1 = | 1,002.80
|
| Average right degree | d2 = | 1.192 09
|
| Fill | p = | 0.002 218 52
|
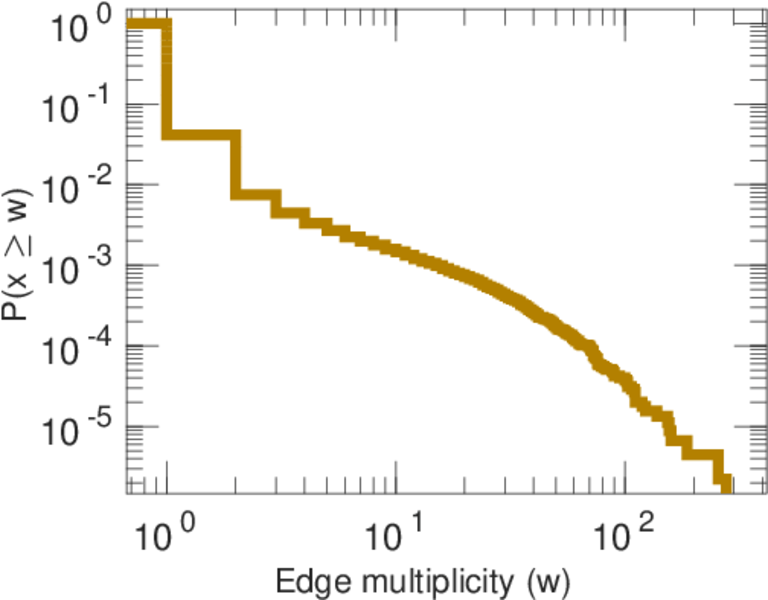
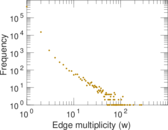
| Average edge multiplicity | m̃ = | 1.094 37
|
| Size of LCC | N = | 413,015
|
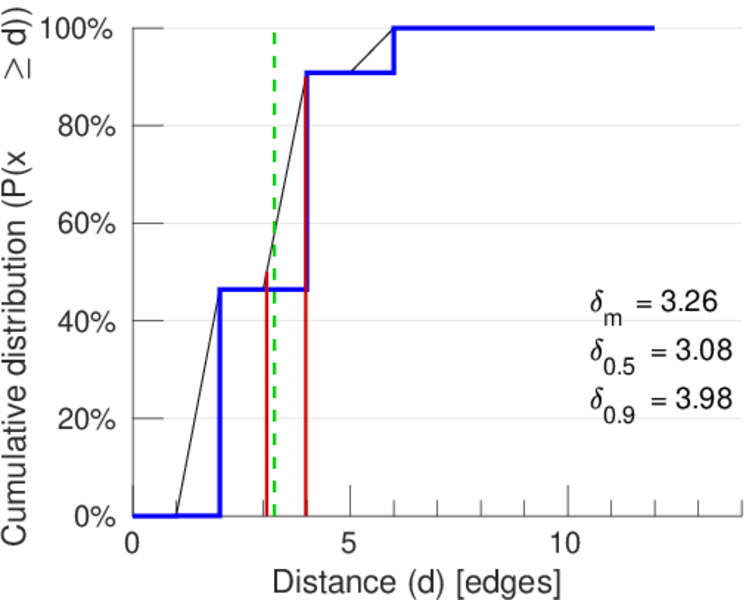
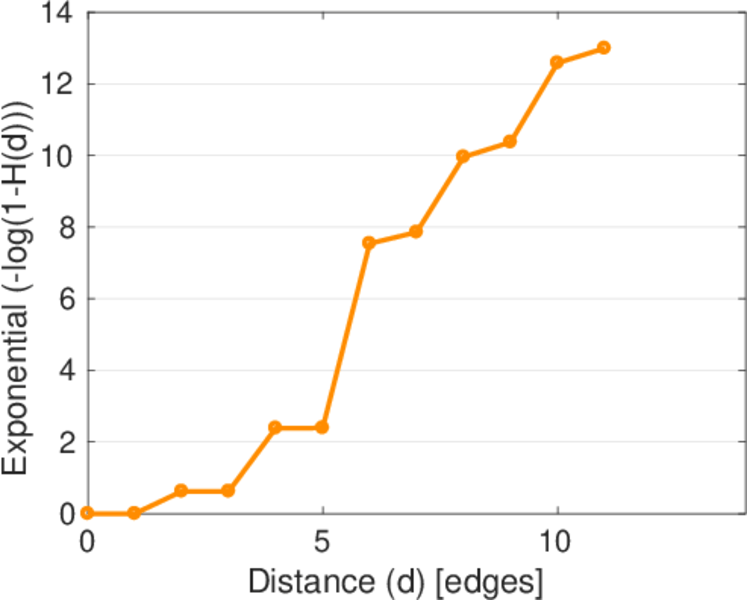
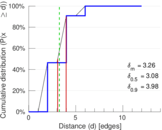
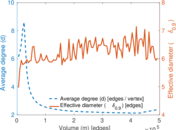
| Diameter | δ = | 16
|
| 50-Percentile effective diameter | δ0.5 = | 3.080 80
|
| 90-Percentile effective diameter | δ0.9 = | 3.982 16
|
| Median distance | δM = | 4
|
| Mean distance | δm = | 3.256 48
|
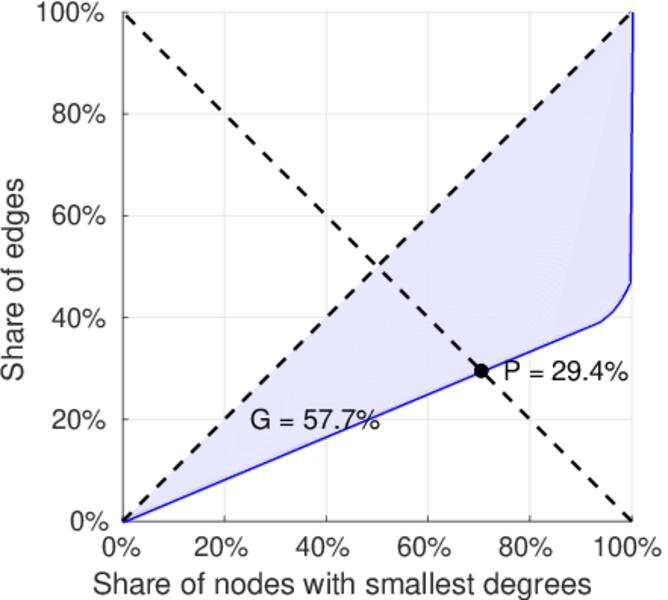
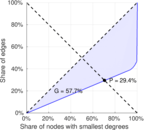
| Gini coefficient | G = | 0.577 936
|
| Balanced inequality ratio | P = | 0.293 524
|
| Left balanced inequality ratio | P1 = | 0.031 687 2
|
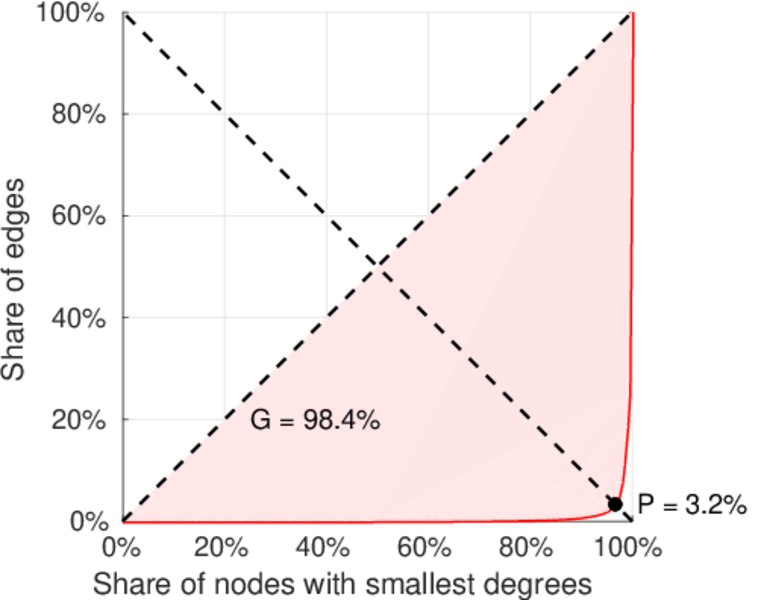
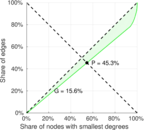
| Right balanced inequality ratio | P2 = | 0.452 848
|
| Relative edge distribution entropy | Her = | 0.613 030
|
| Power law exponent | γ = | 20.494 2
|
| Tail power law exponent | γt = | 4.251 00
|
| Tail power law exponent with p | γ3 = | 4.251 00
|
| p-value | p = | 0.000 00
|
| Left tail power law exponent with p | γ3,1 = | 1.441 00
|
| Left p-value | p1 = | 0.360 000
|
| Right tail power law exponent with p | γ3,2 = | 4.281 00
|
| Right p-value | p2 = | 0.000 00
|
| Degree assortativity | ρ = | −0.293 472
|
| Degree assortativity p-value | pρ = | 0.000 00
|
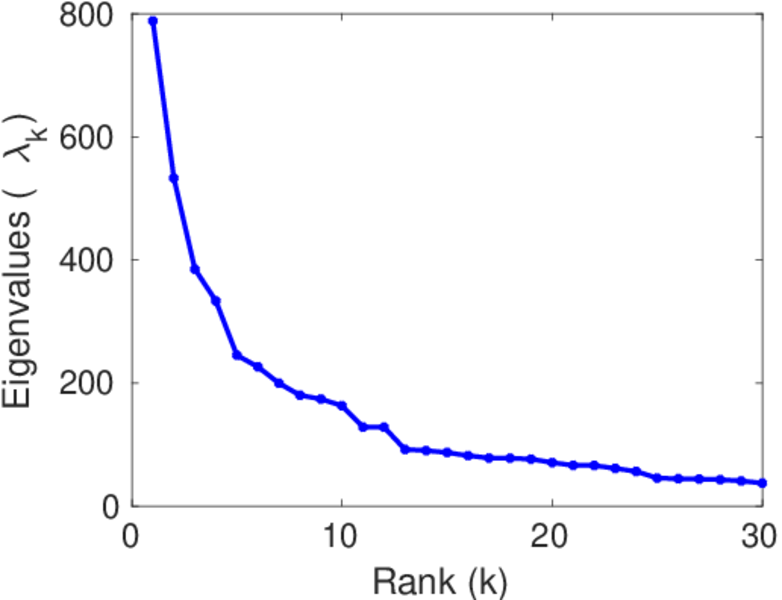
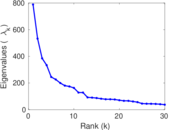
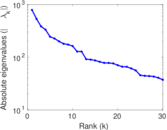
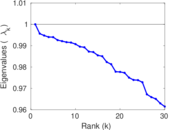
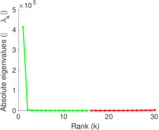
| Spectral norm | α = | 788.204
|
| Algebraic connectivity | a = | 0.008 743 60
|
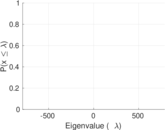
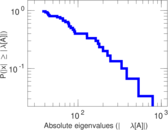
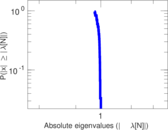
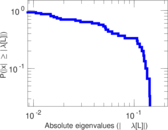
| Spectral separation | |λ1[A] / λ2[A]| = | 1.479 05
|
| Controllability | C = | 412,462
|
| Relative controllability | Cr = | 0.997 726
|
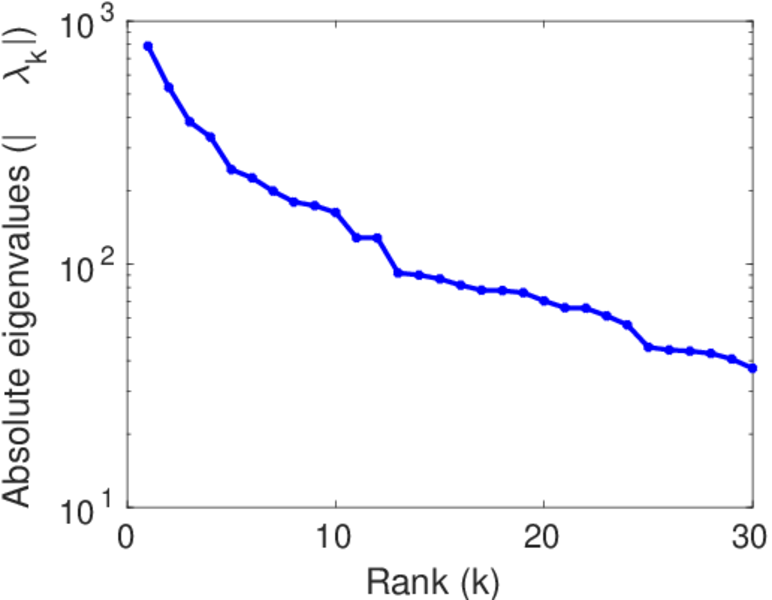
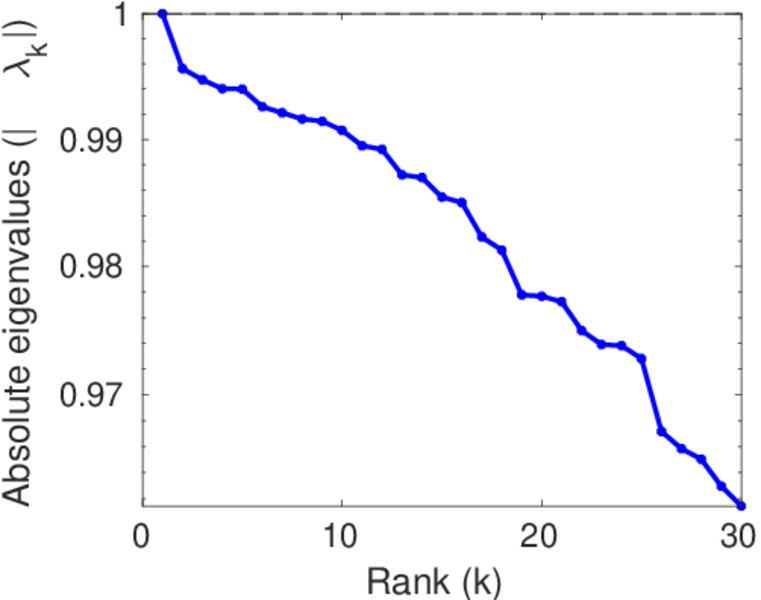
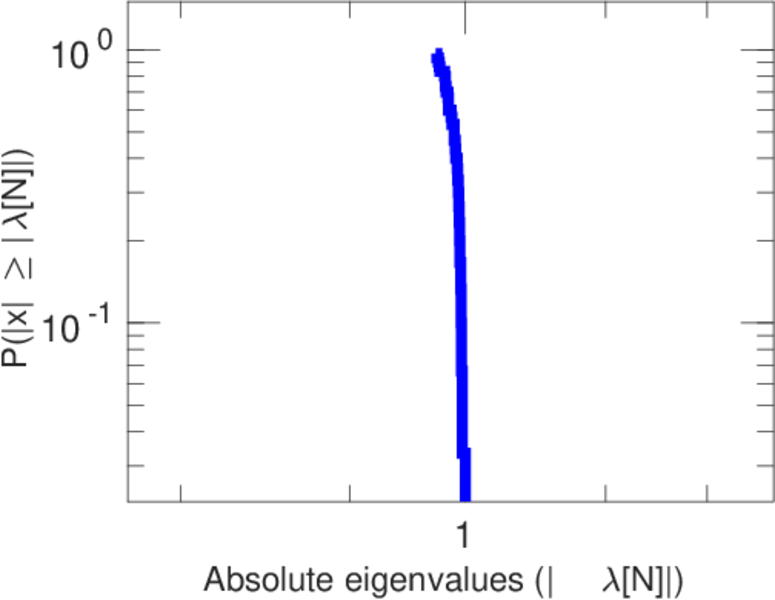
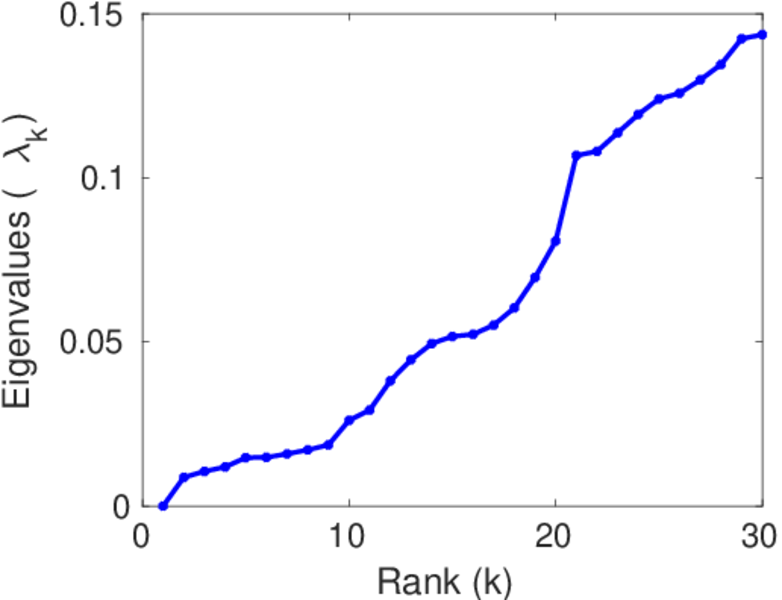
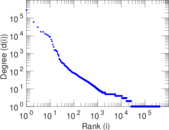
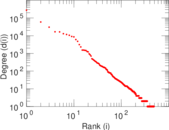
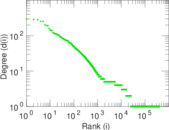
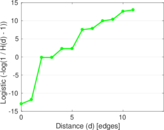
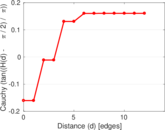
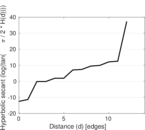
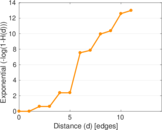
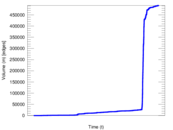
Plots


Matrix decompositions plots


Downloads
References
|
[1]
|
Jérôme Kunegis.
KONECT – The Koblenz Network Collection.
In Proc. Int. Conf. on World Wide Web Companion, pages
1343–1350, 2013.
[ http ]
|
|
[2]
|
Wikimedia Foundation.
Wikimedia downloads.
http://dumps.wikimedia.org/, January 2010.
|
 KONECT ‣ Networks ‣
Buy Me a Coffee
KONECT ‣ Networks ‣
Buy Me a Coffee