Wiktionary edits (ta)
This is the bipartite edit network of the Tamil Wiktionary. It contains users
and pages from the Tamil Wiktionary, connected by edit events. Each edge
represents an edit. The dataset includes the timestamp of each edit.
Metadata
Statistics
| Size | n = | 367,883
|
| Left size | n1 = | 1,283
|
| Right size | n2 = | 366,600
|
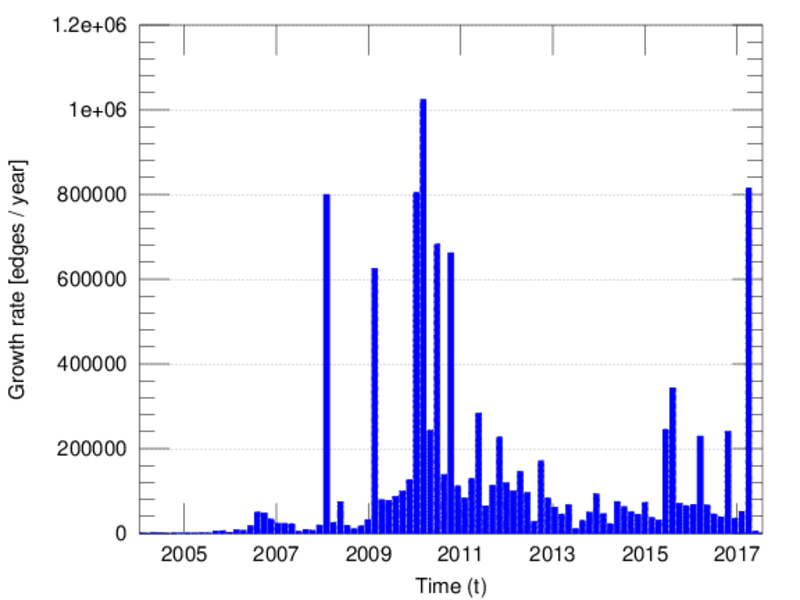
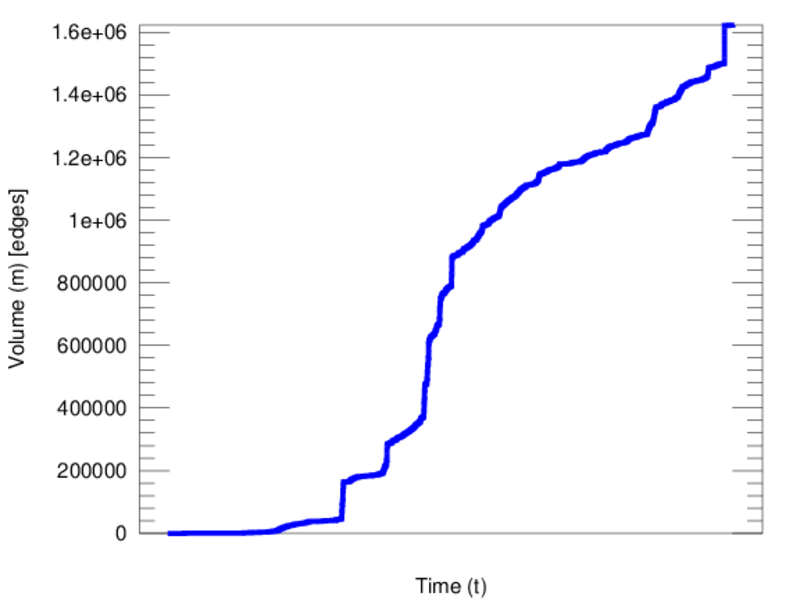
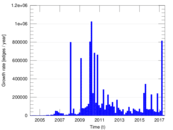
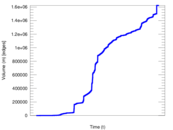
| Volume | m = | 1,623,615
|
| Unique edge count | m̿ = | 1,024,442
|
| Wedge count | s = | 54,919,206,238
|
| Claw count | z = | 2,954,084,438,315,247
|
| Cross count | x = | 1.388 01 × 1020
|
| Square count | q = | 34,383,442,465
|
| 4-Tour count | T4 = | 494,746,427,356
|
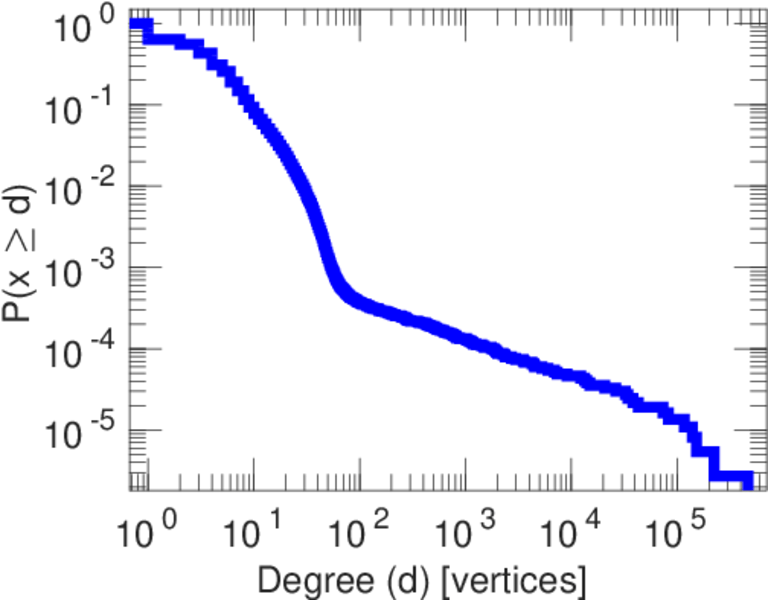
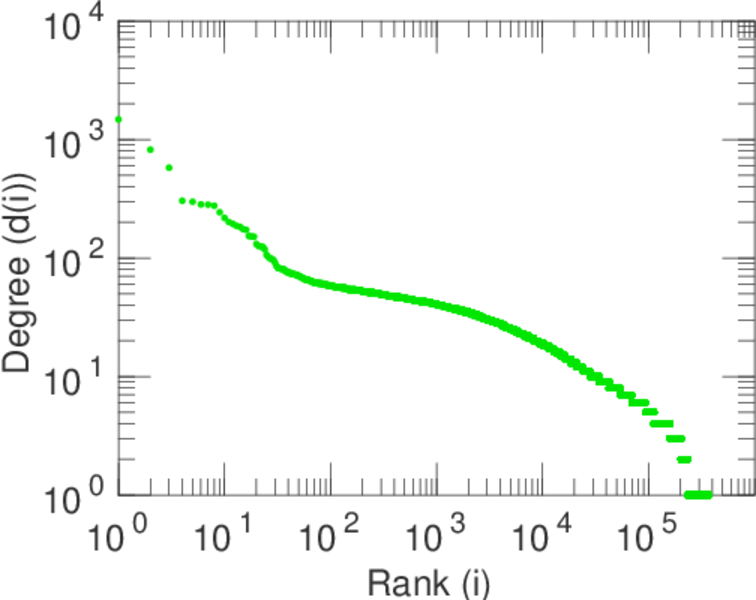
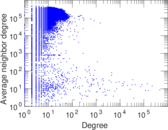
| Maximum degree | dmax = | 466,336
|
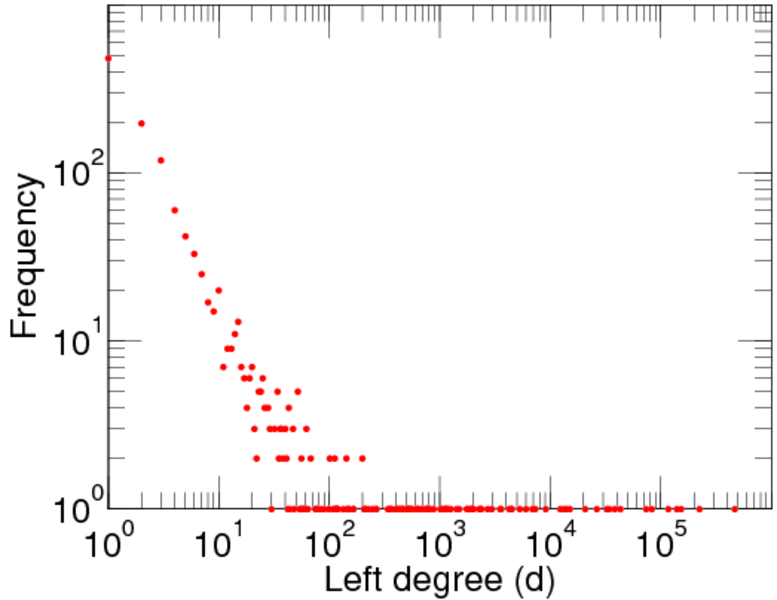
| Maximum left degree | d1max = | 466,336
|
| Maximum right degree | d2max = | 1,478
|
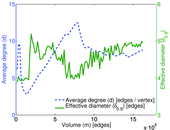
| Average degree | d = | 8.826 80
|
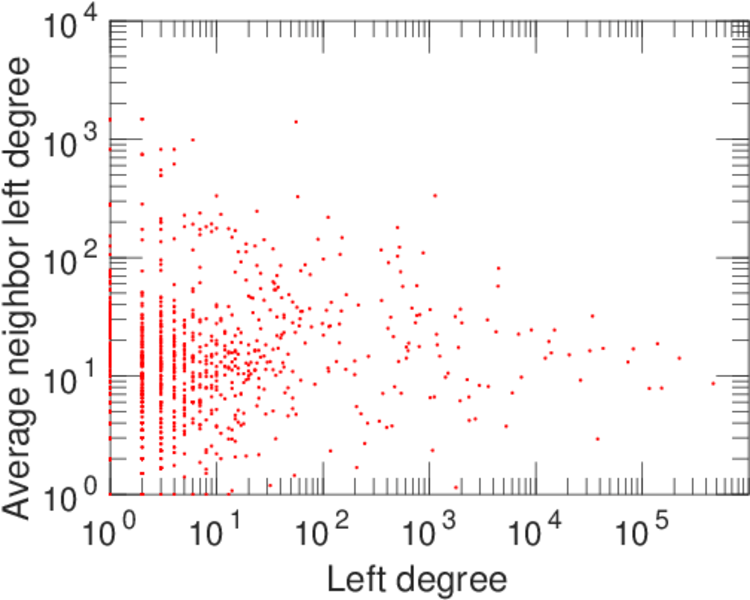
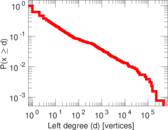
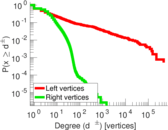
| Average left degree | d1 = | 1,265.48
|
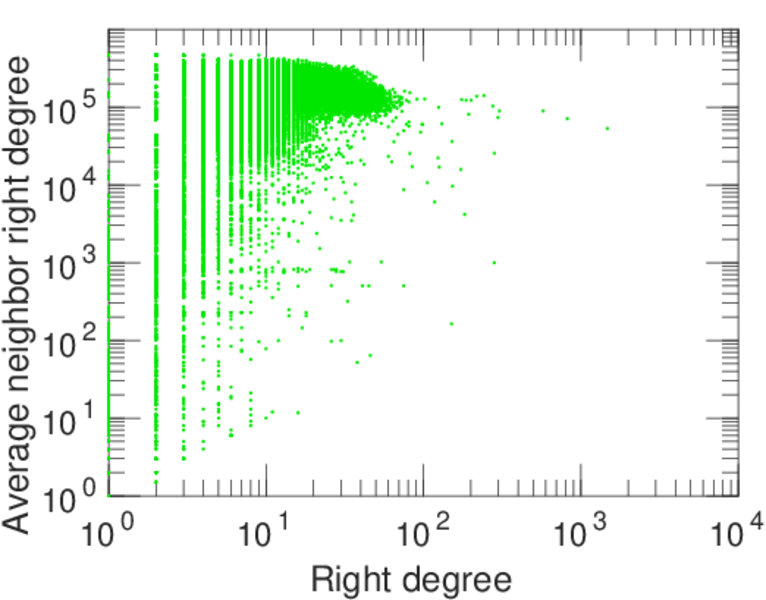
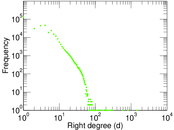
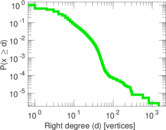
| Average right degree | d2 = | 4.428 85
|
| Fill | p = | 0.002 178 05
|
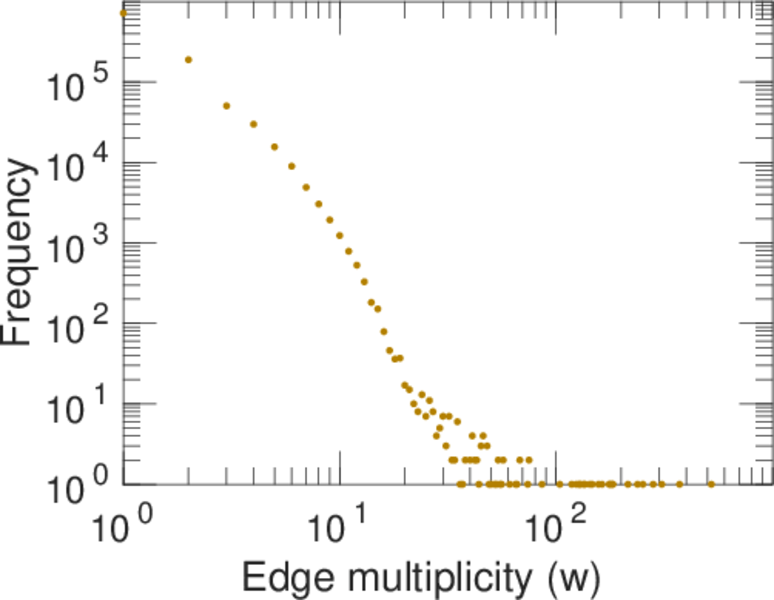
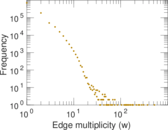
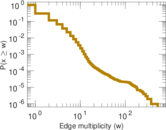
| Average edge multiplicity | m̃ = | 1.584 88
|
| Size of LCC | N = | 367,099
|
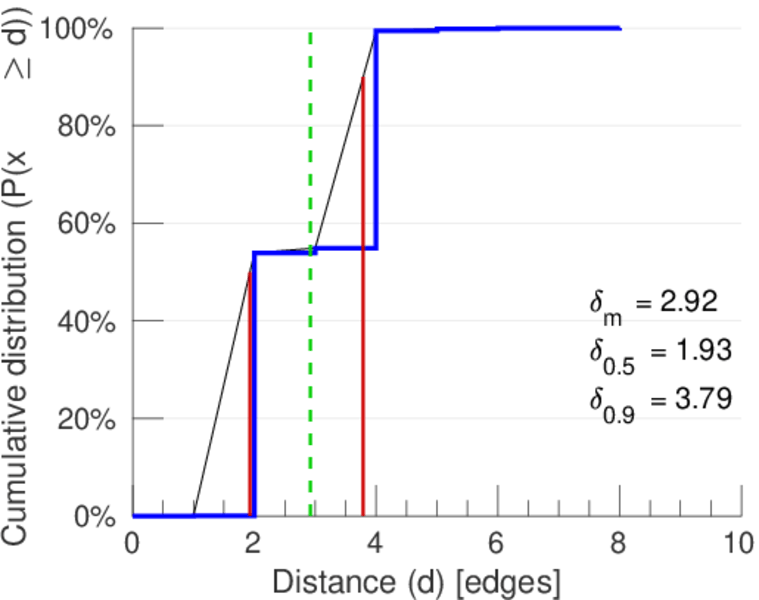
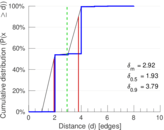
| Diameter | δ = | 10
|
| 50-Percentile effective diameter | δ0.5 = | 1.927 30
|
| 90-Percentile effective diameter | δ0.9 = | 3.788 03
|
| Median distance | δM = | 2
|
| Mean distance | δm = | 2.919 68
|
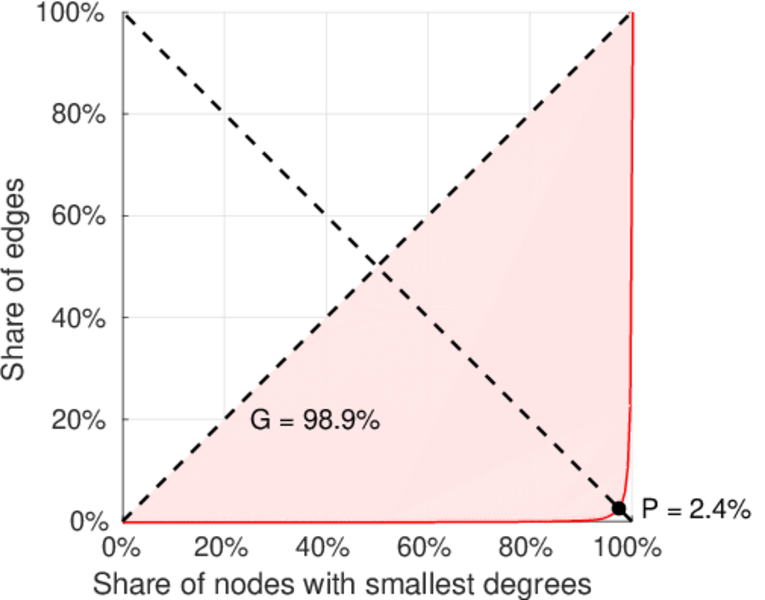
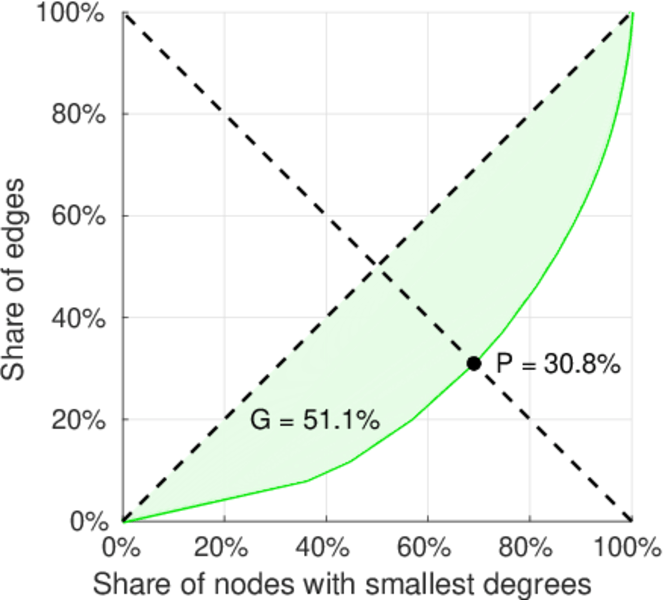
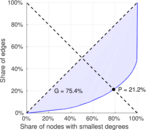
| Gini coefficient | G = | 0.754 886
|
| Balanced inequality ratio | P = | 0.214 609
|
| Left balanced inequality ratio | P1 = | 0.023 546 8
|
| Right balanced inequality ratio | P2 = | 0.308 321
|
| Relative edge distribution entropy | Her = | 0.652 651
|
| Power law exponent | γ = | 2.333 98
|
| Tail power law exponent | γt = | 3.101 00
|
| Degree assortativity | ρ = | −0.277 997
|
| Degree assortativity p-value | pρ = | 0.000 00
|
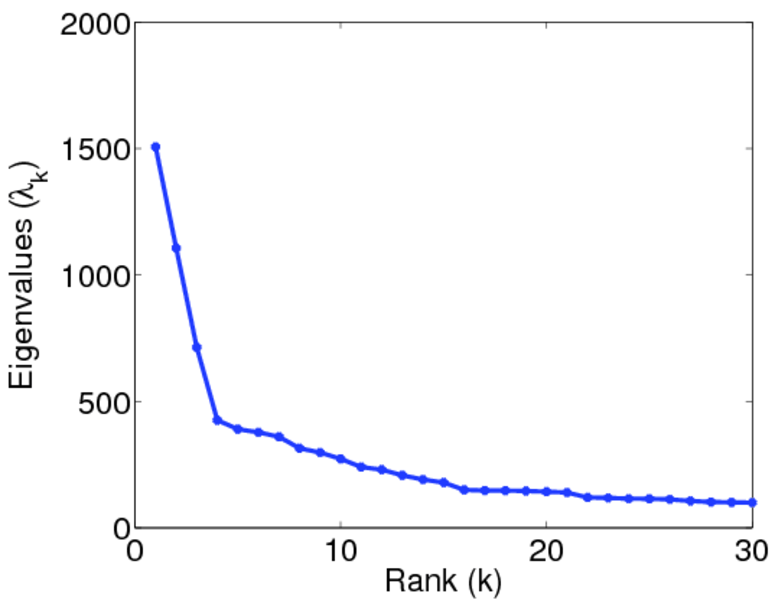
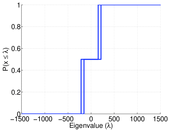
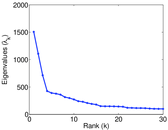
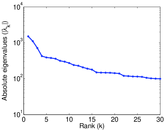
| Spectral norm | α = | 1,506.88
|
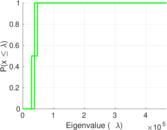
| Algebraic connectivity | a = | 0.018 428 4
|
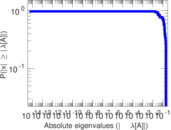
| Spectral separation | |λ1[A] / λ2[A]| = | 1.361 38
|
| Controllability | C = | 365,161
|
| Relative controllability | Cr = | 0.993 222
|
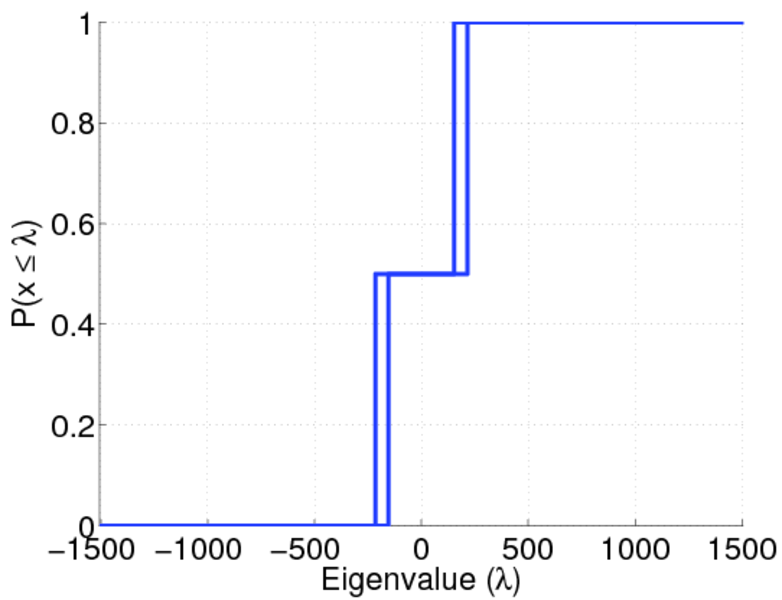
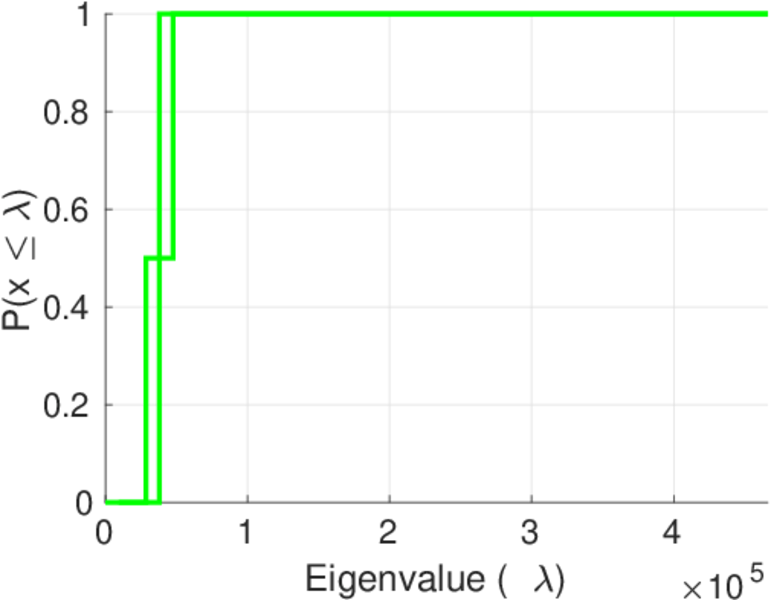
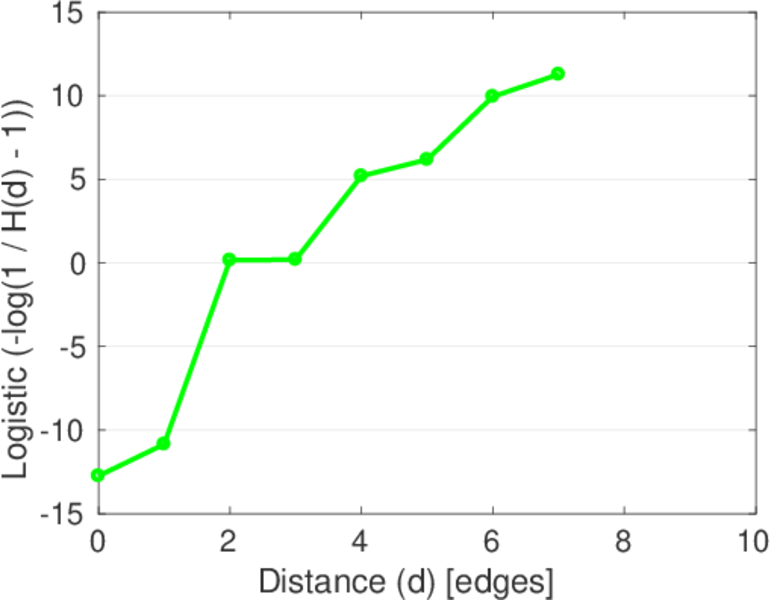
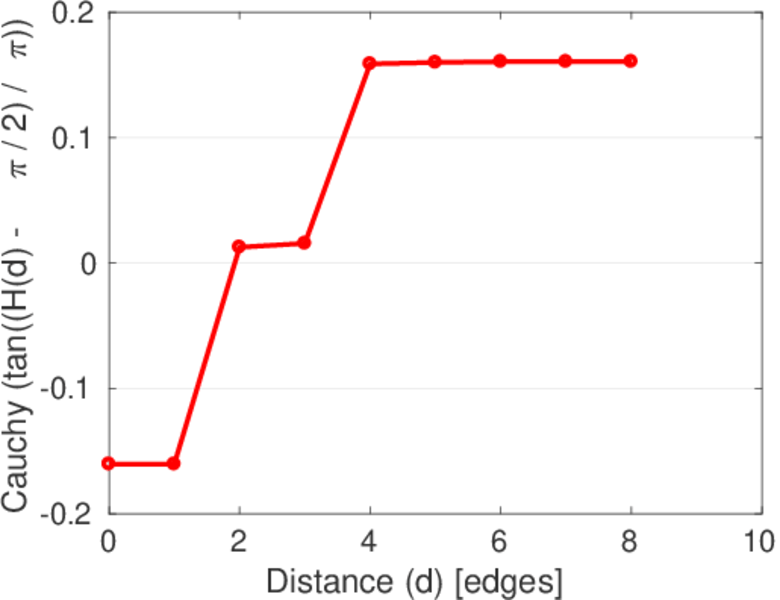
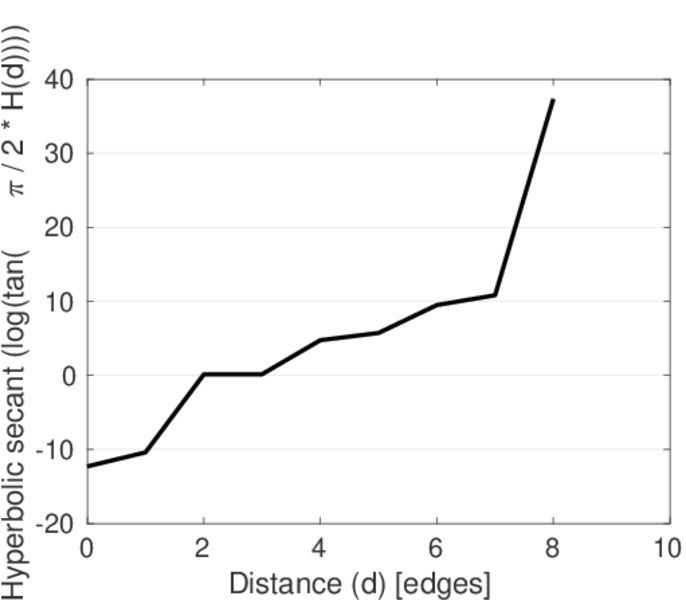
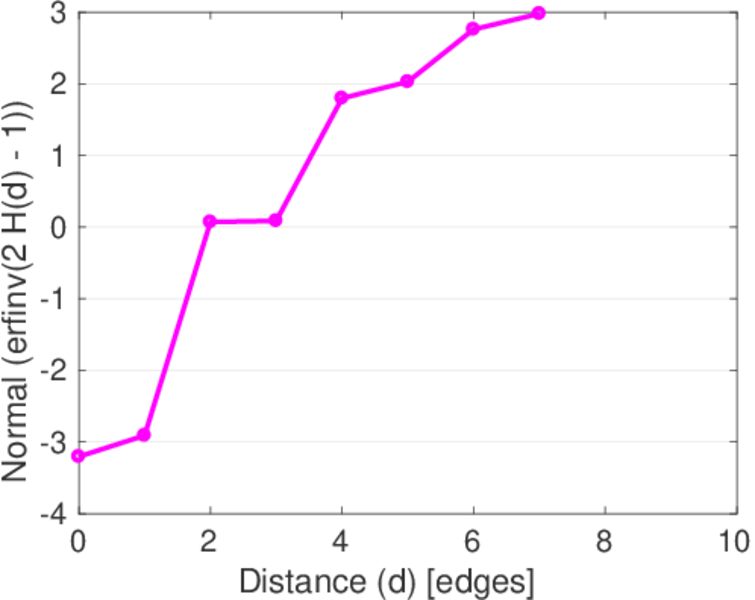
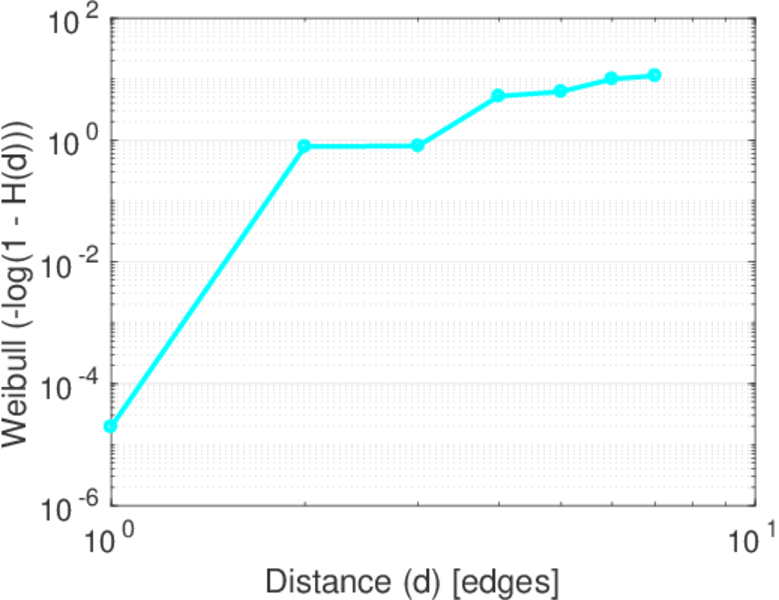
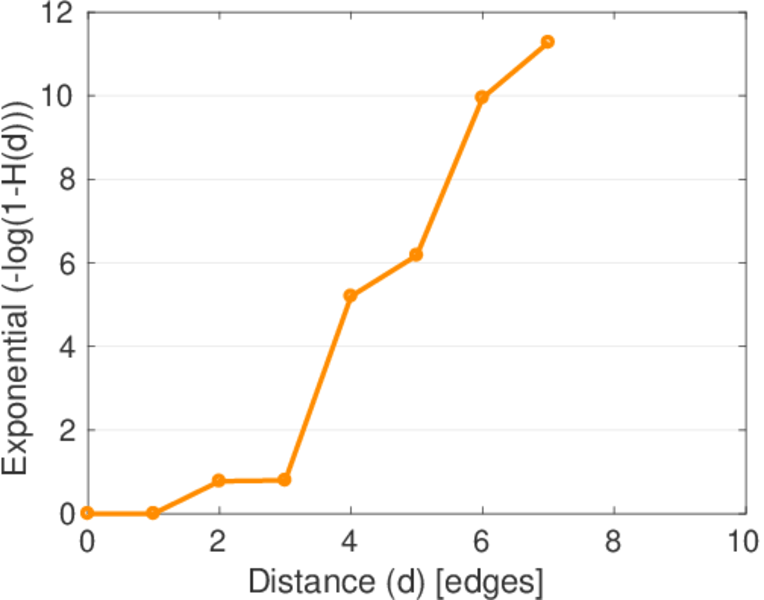
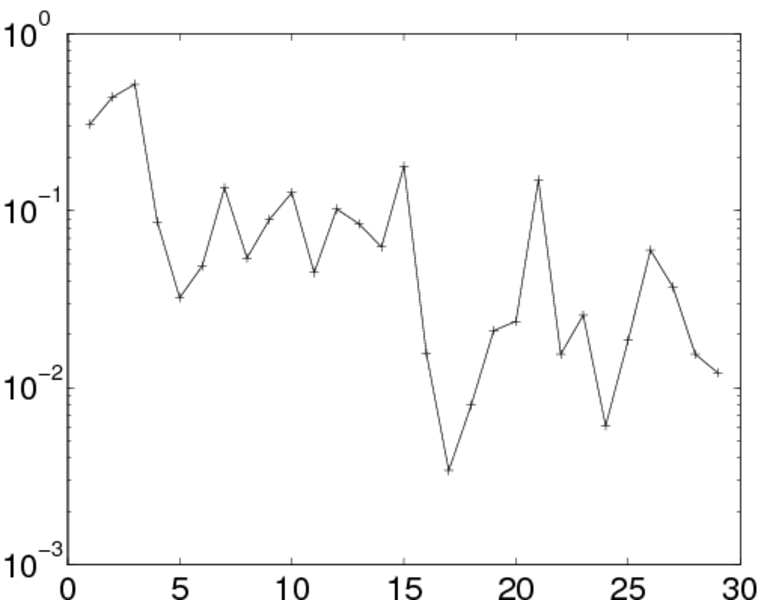
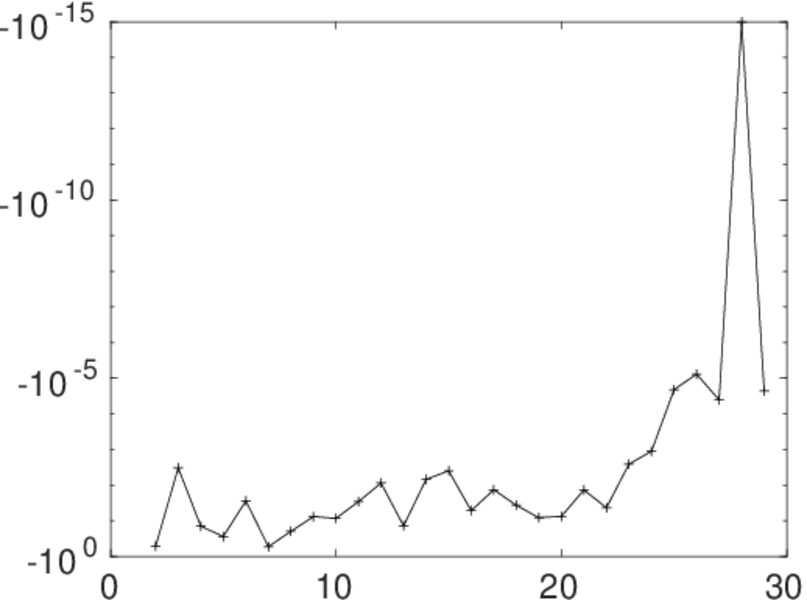
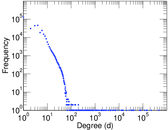
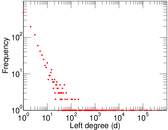
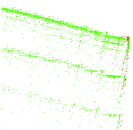
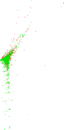
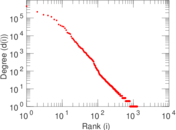
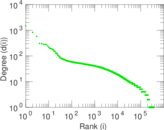
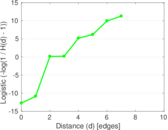
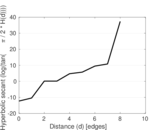
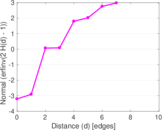
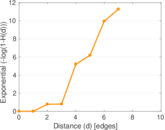
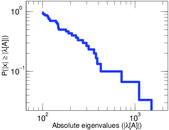
Plots


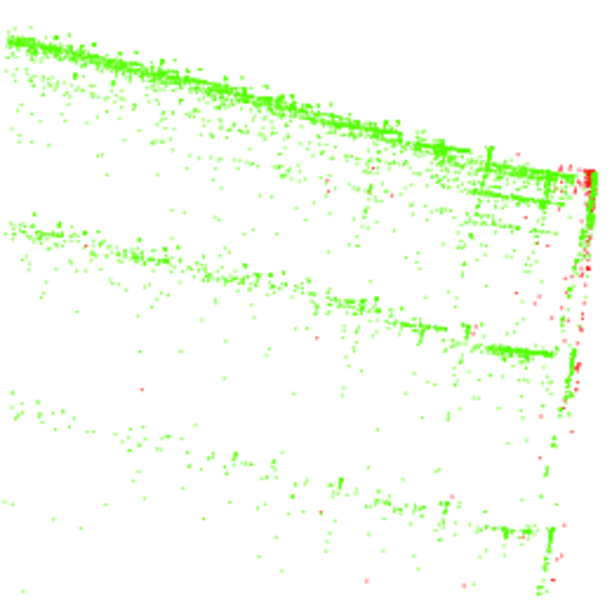
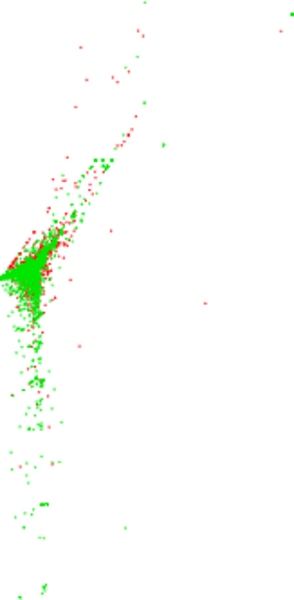
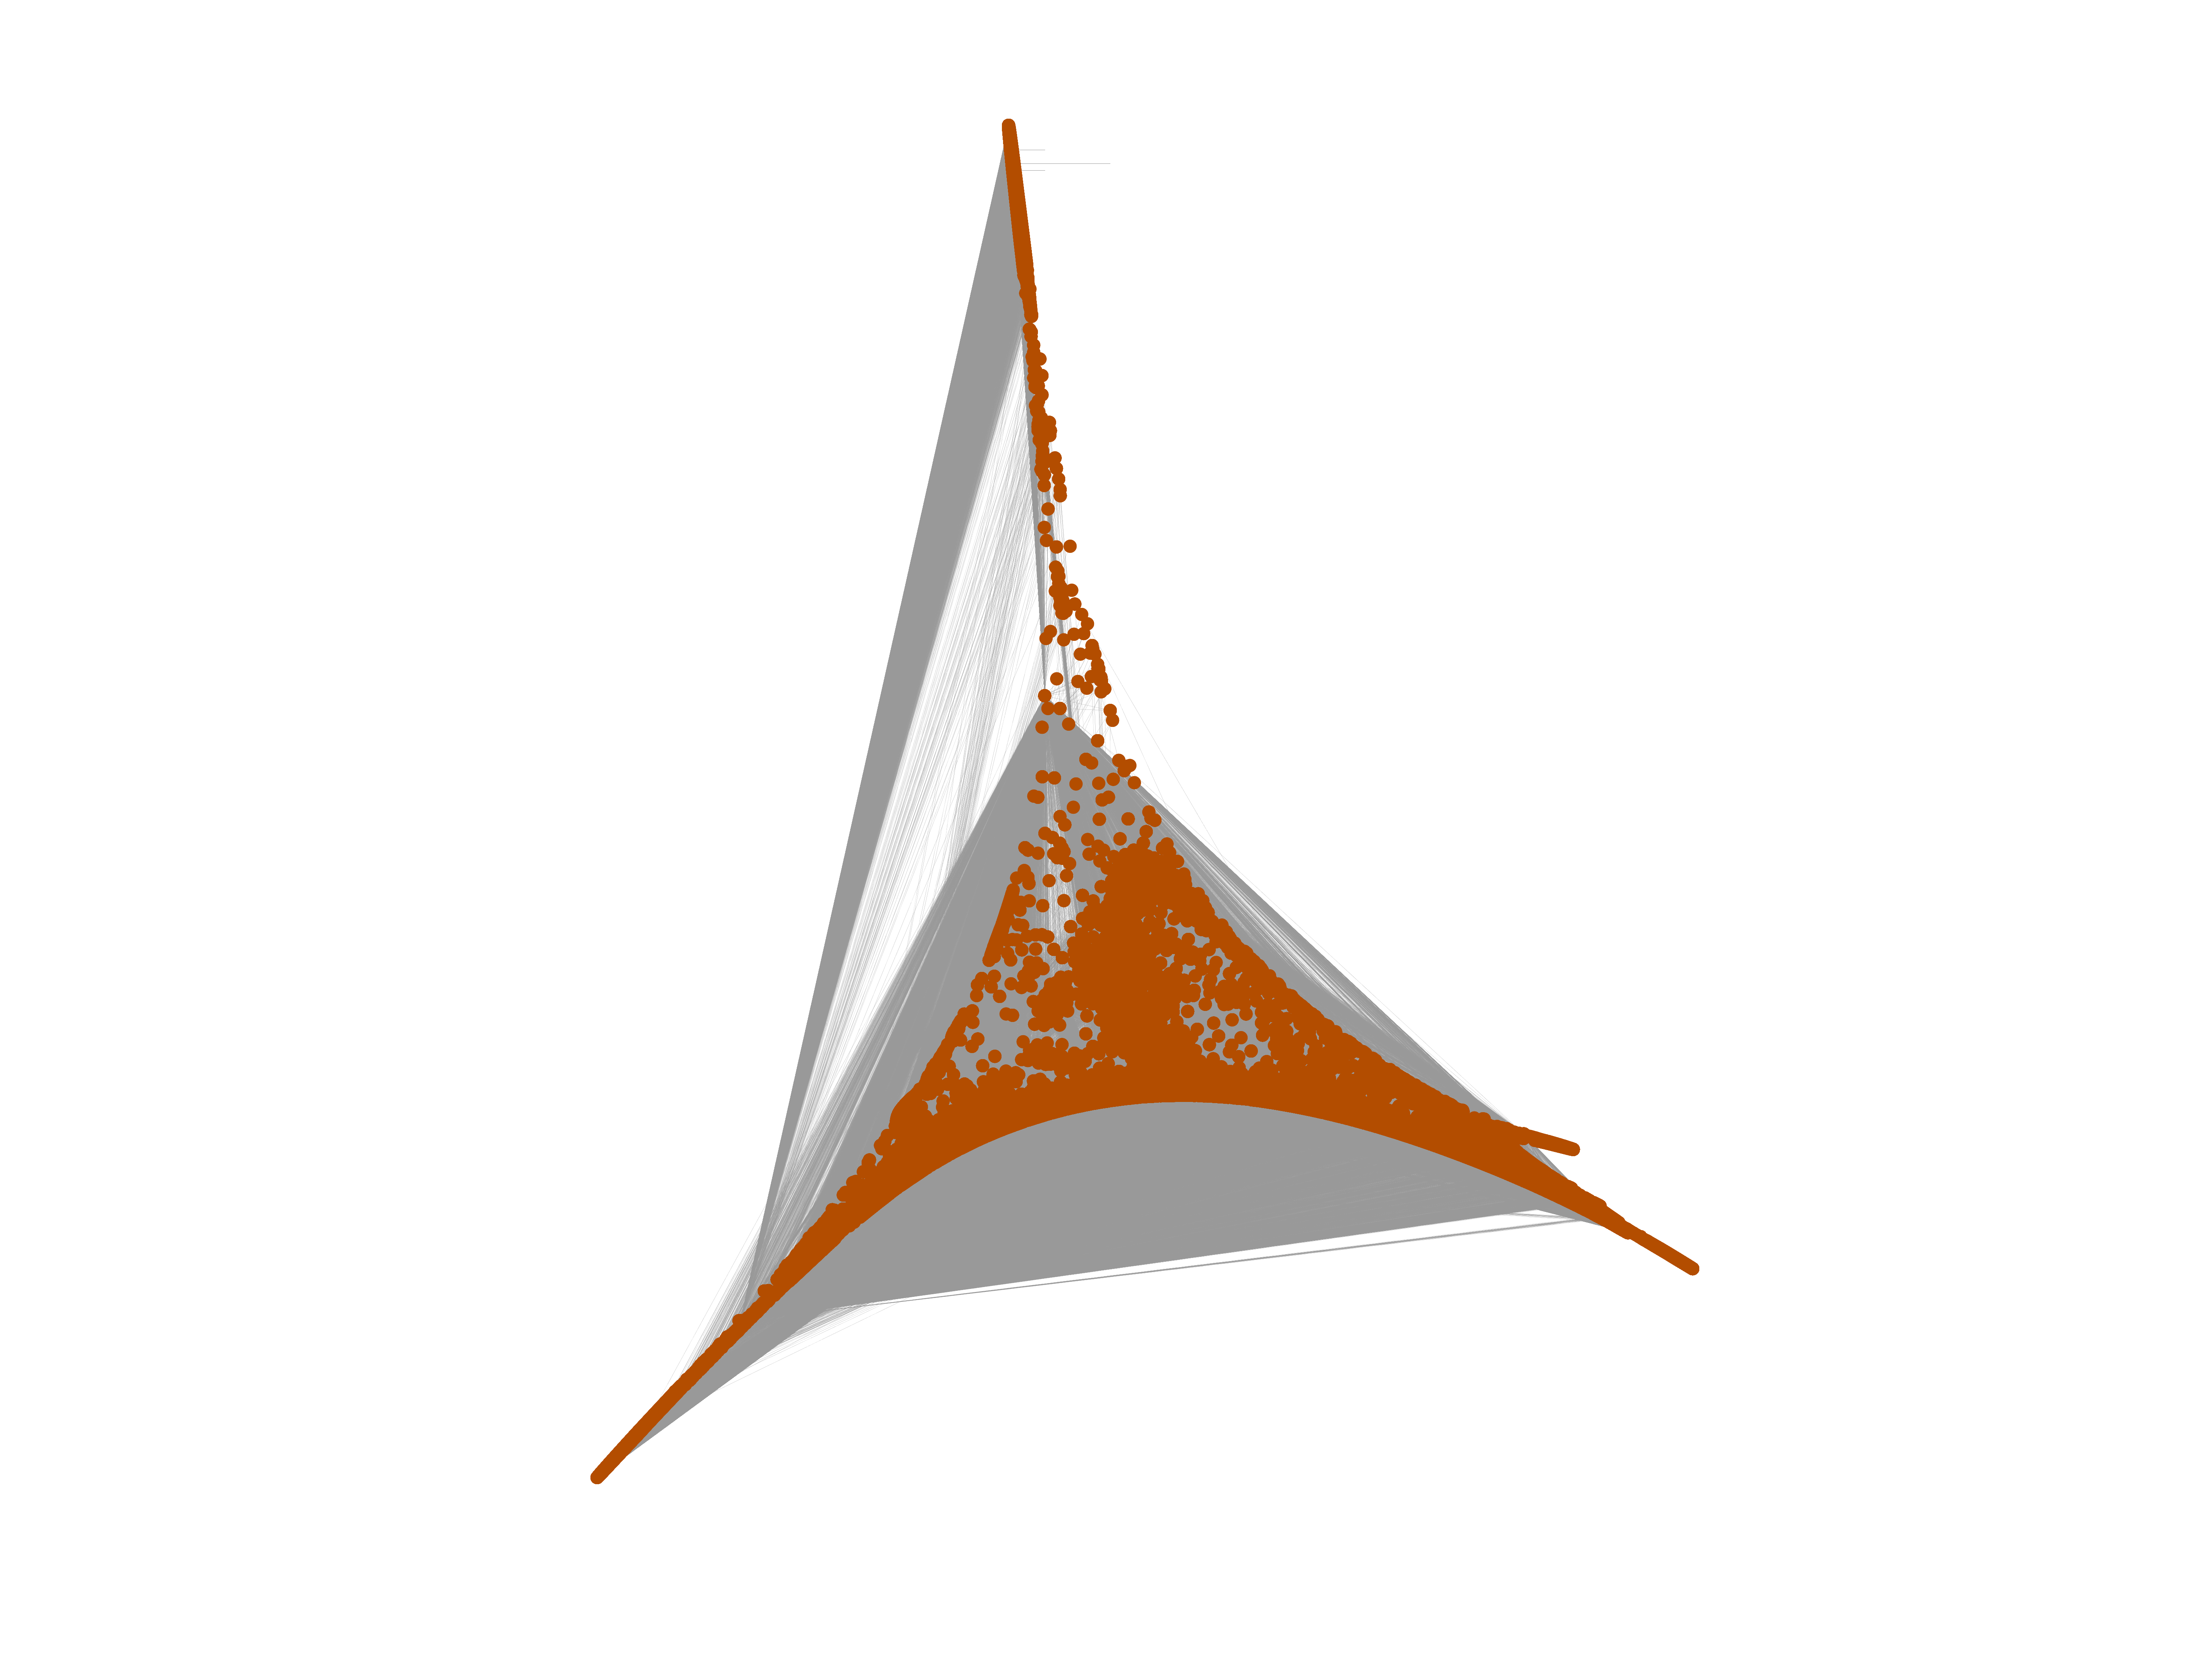
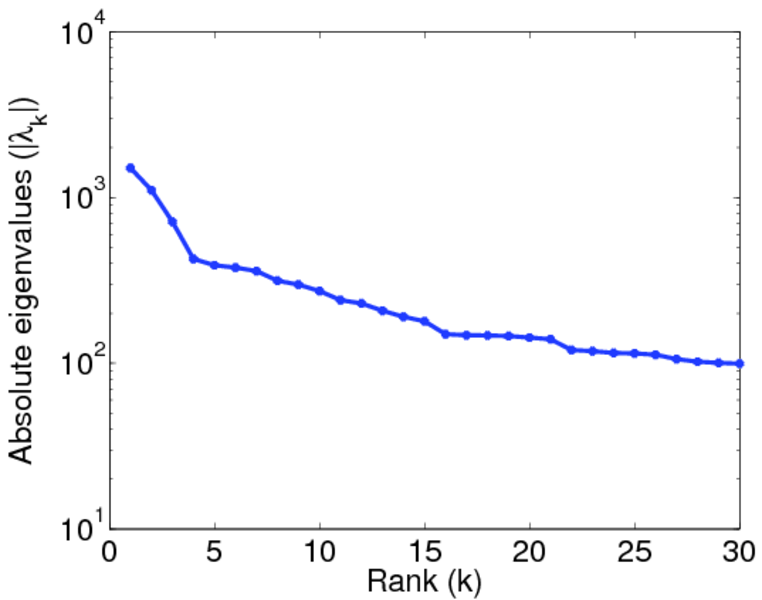
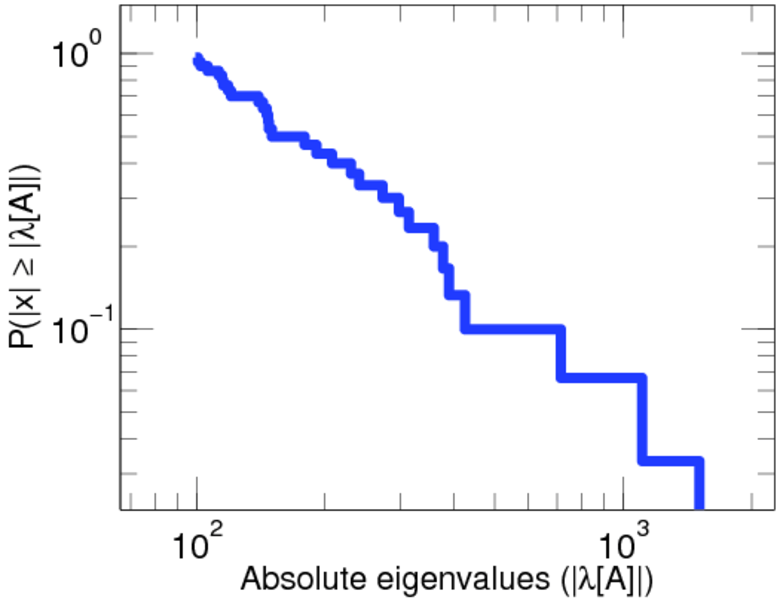
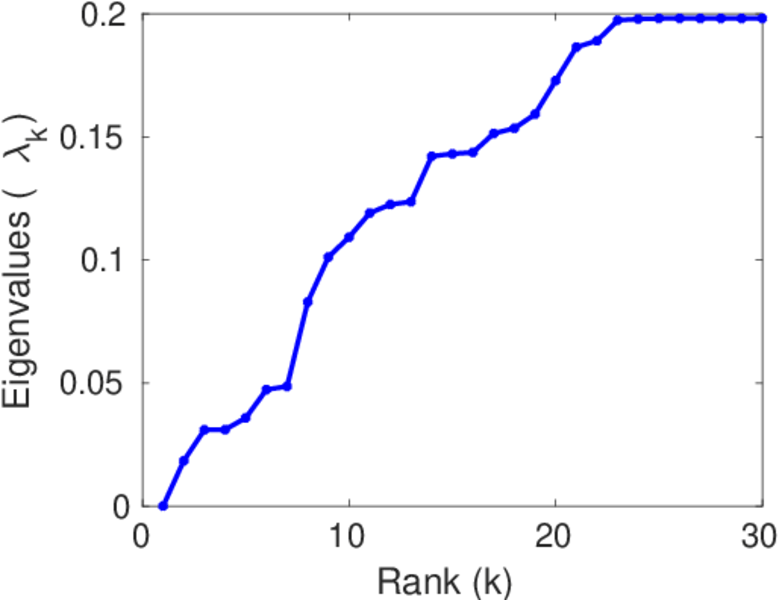
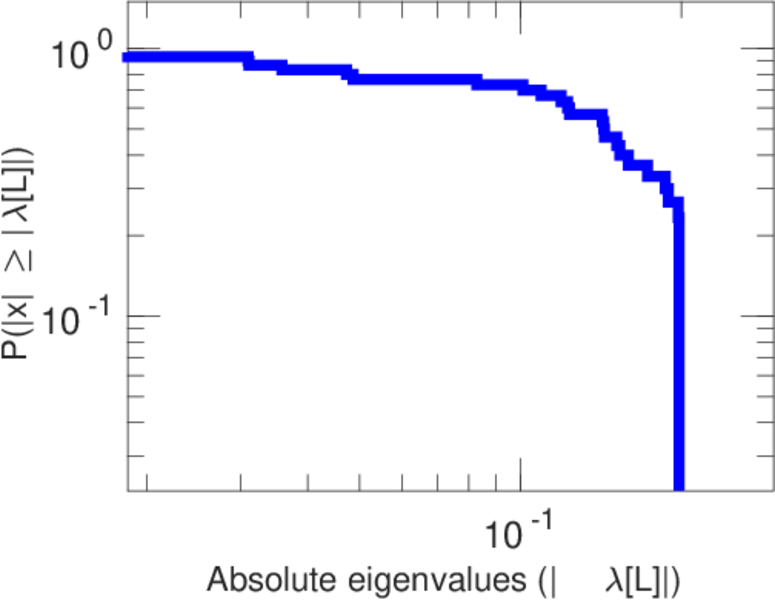
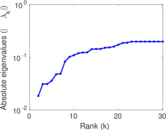
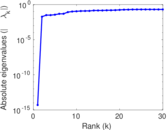
Matrix decompositions plots


Downloads
References
|
[1]
|
Jérôme Kunegis.
KONECT – The Koblenz Network Collection.
In Proc. Int. Conf. on World Wide Web Companion, pages
1343–1350, 2013.
[ http ]
|
|
[2]
|
Wikimedia Foundation.
Wikimedia downloads.
http://dumps.wikimedia.org/, January 2010.
|
 KONECT ‣ Networks ‣
Buy Me a Coffee
KONECT ‣ Networks ‣
Buy Me a Coffee