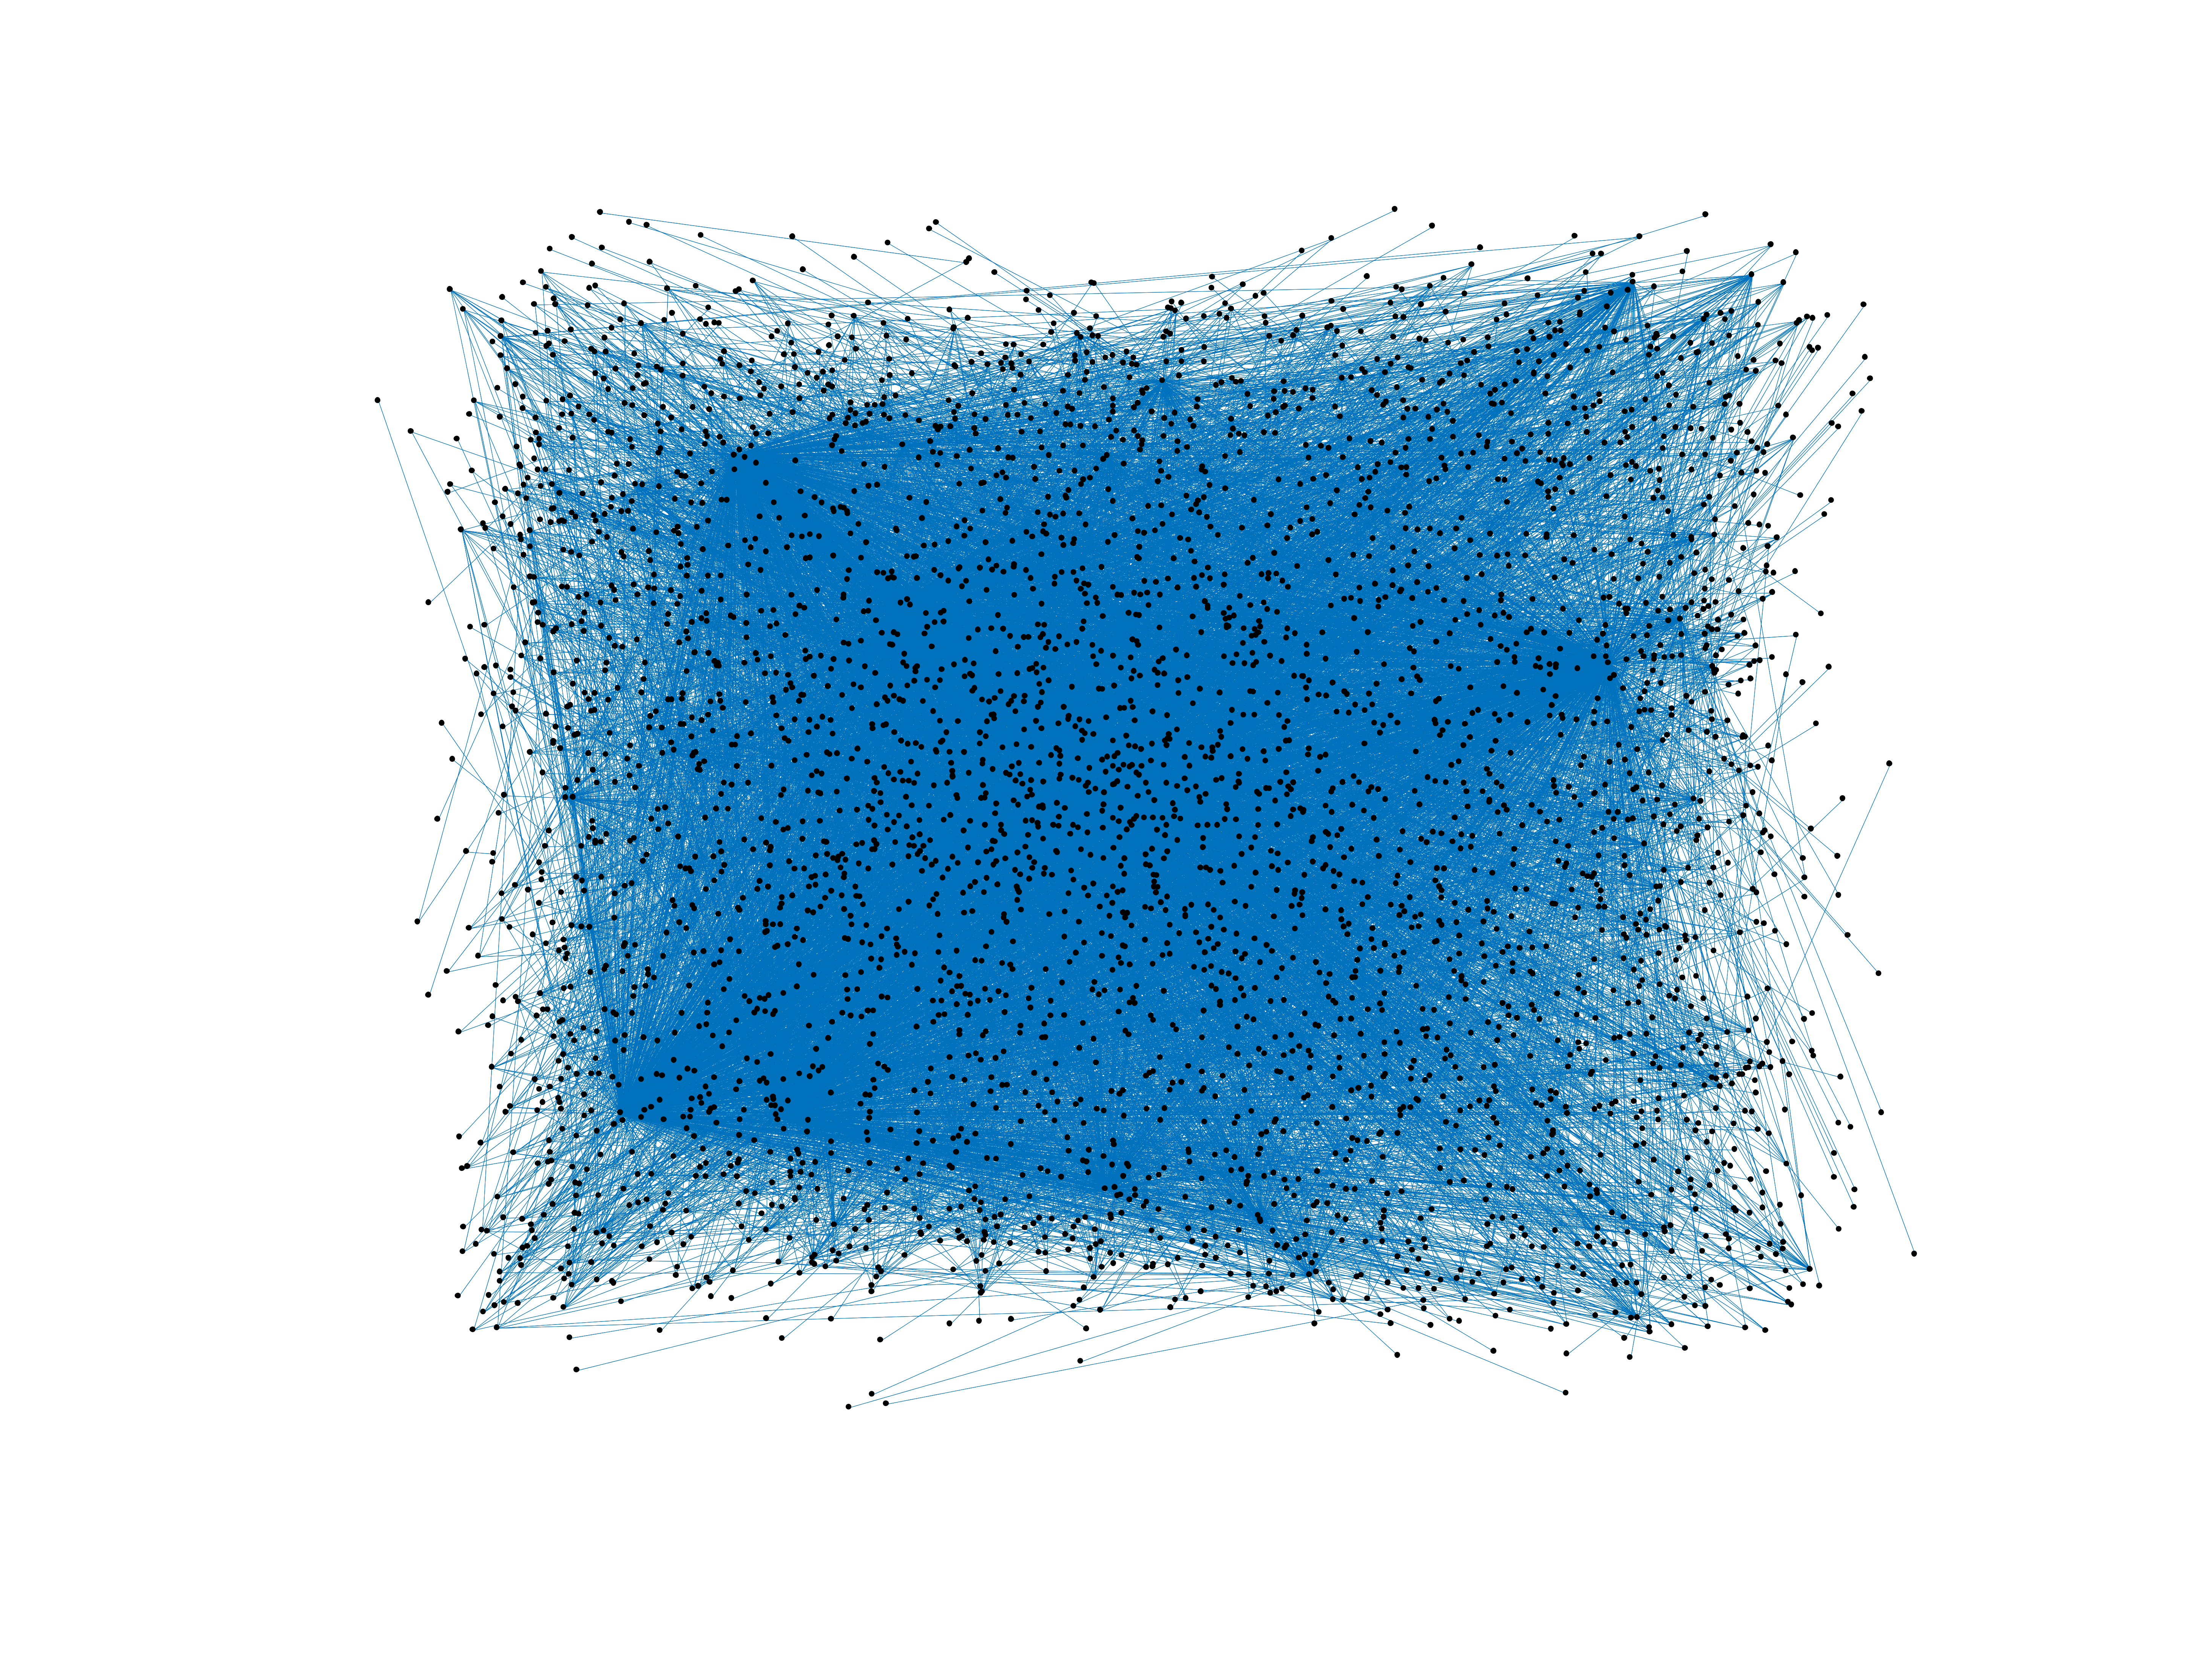
Wikipedia edits (tcy)
This is the bipartite edit network of the Tulu Wikipedia. It contains users and
pages from the Tulu Wikipedia, connected by edit events. Each edge represents
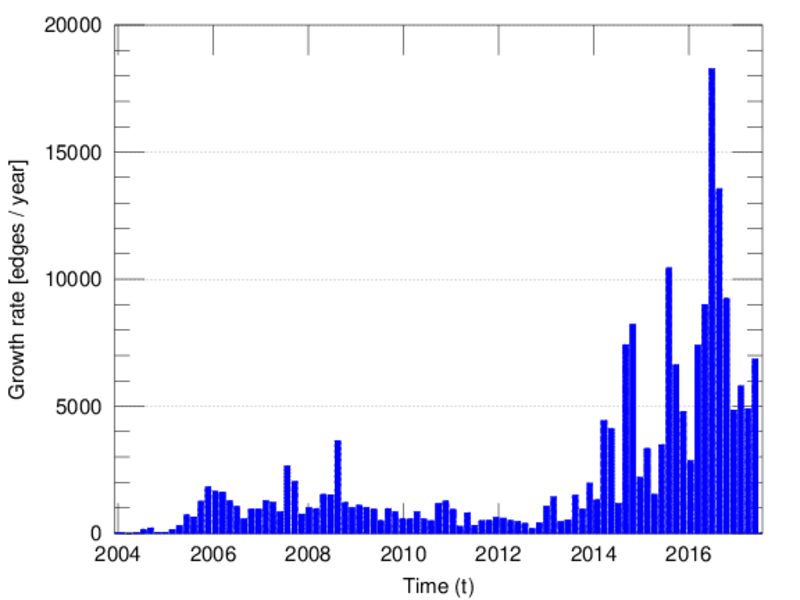
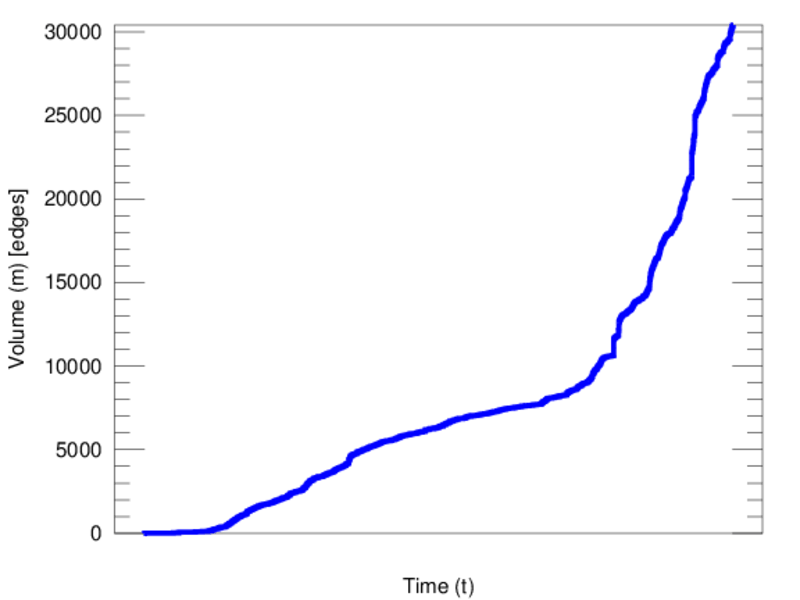
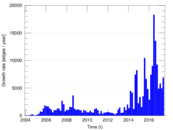
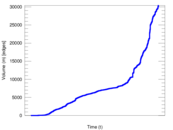
an edit. The dataset includes the timestamp of each edit.
Metadata
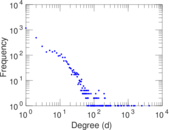
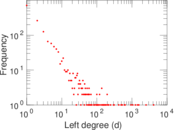
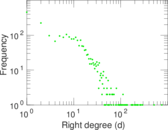
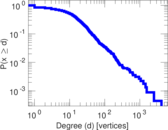
Statistics
| Size | n = | 3,884
|
| Left size | n1 = | 1,635
|
| Right size | n2 = | 2,249
|
| Volume | m = | 30,401
|
| Unique edge count | m̿ = | 11,592
|
| Wedge count | s = | 2,707,663
|
| Claw count | z = | 807,134,041
|
| Cross count | x = | 202,238,158,366
|
| Square count | q = | 2,053,754
|
| 4-Tour count | T4 = | 27,293,148
|
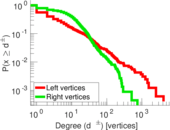
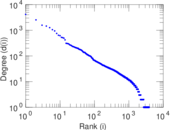
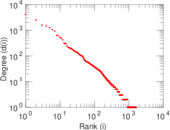
| Maximum degree | dmax = | 4,149
|
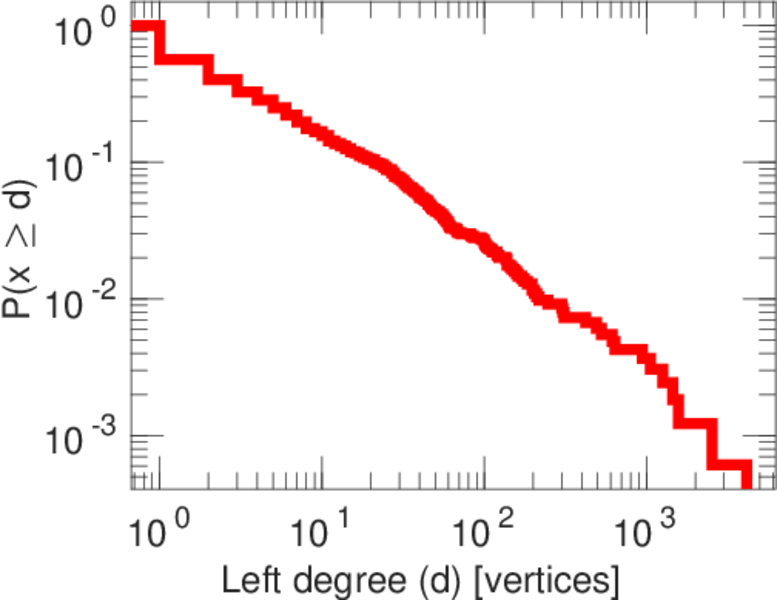
| Maximum left degree | d1max = | 4,149
|
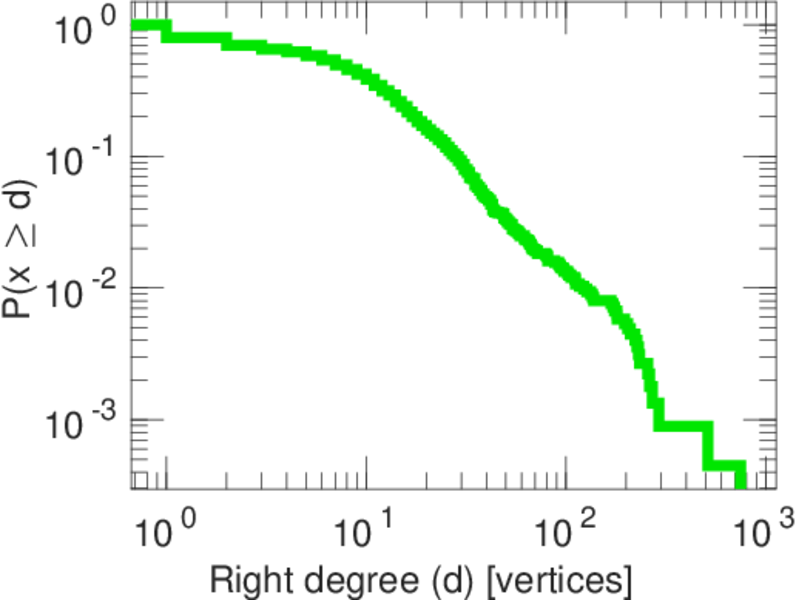
| Maximum right degree | d2max = | 750
|
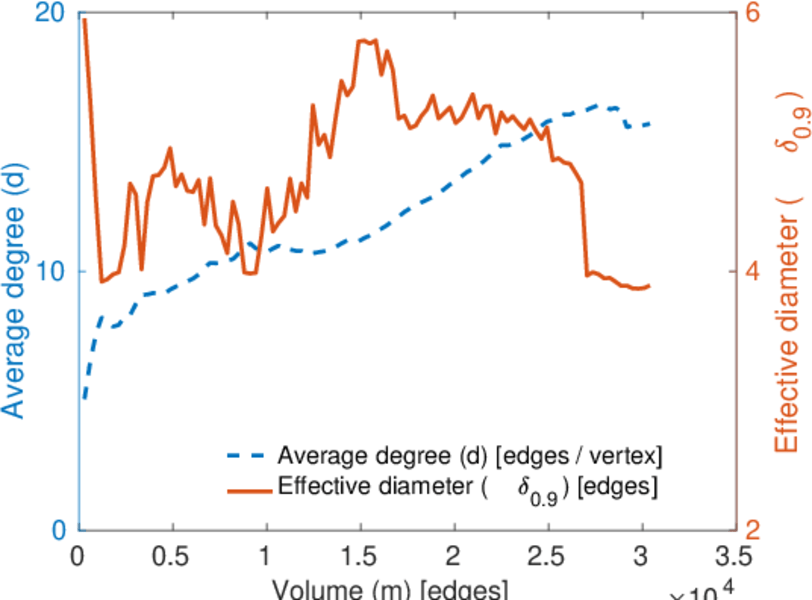
| Average degree | d = | 15.654 5
|
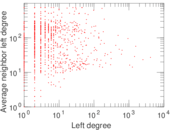
| Average left degree | d1 = | 18.593 9
|
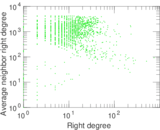
| Average right degree | d2 = | 13.517 6
|
| Fill | p = | 0.003 152 47
|
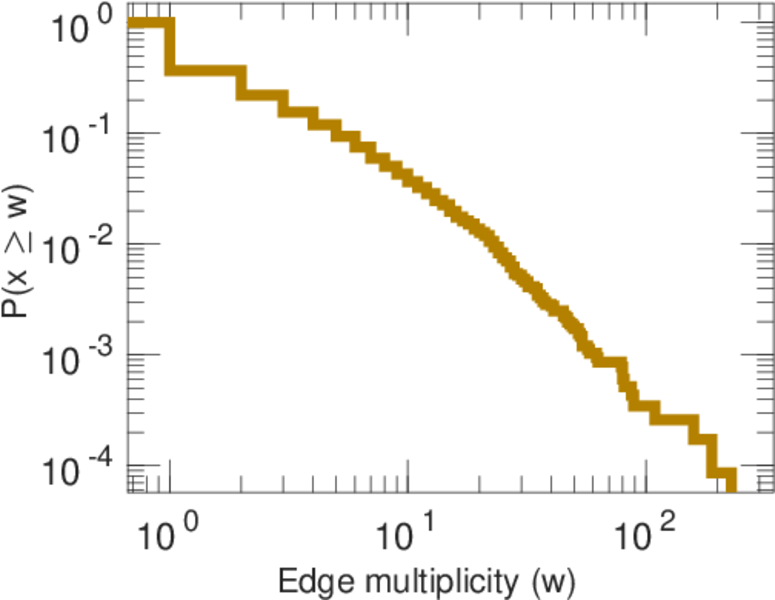
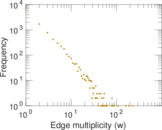
| Average edge multiplicity | m̃ = | 2.622 58
|
| Size of LCC | N = | 3,823
|
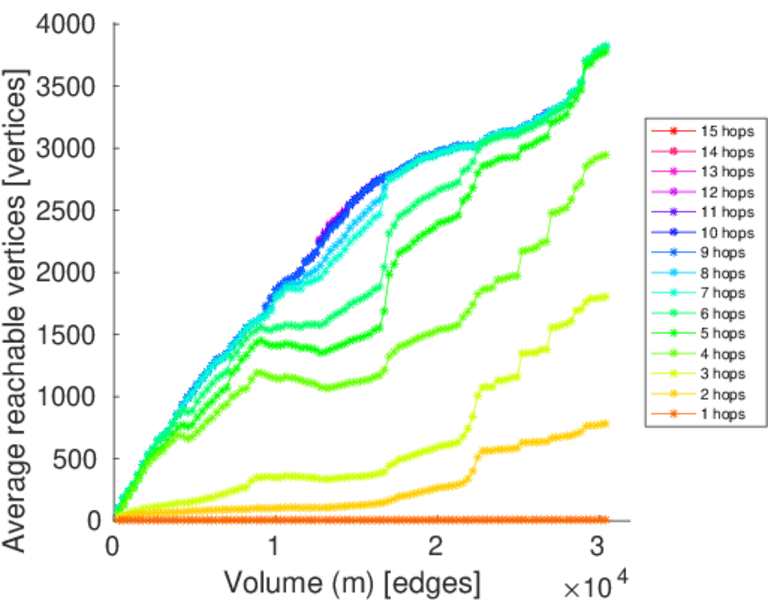
| Diameter | δ = | 8
|
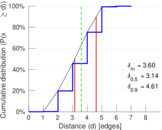
| 50-Percentile effective diameter | δ0.5 = | 3.144 91
|
| 90-Percentile effective diameter | δ0.9 = | 4.613 68
|
| Median distance | δM = | 4
|
| Mean distance | δm = | 3.599 17
|
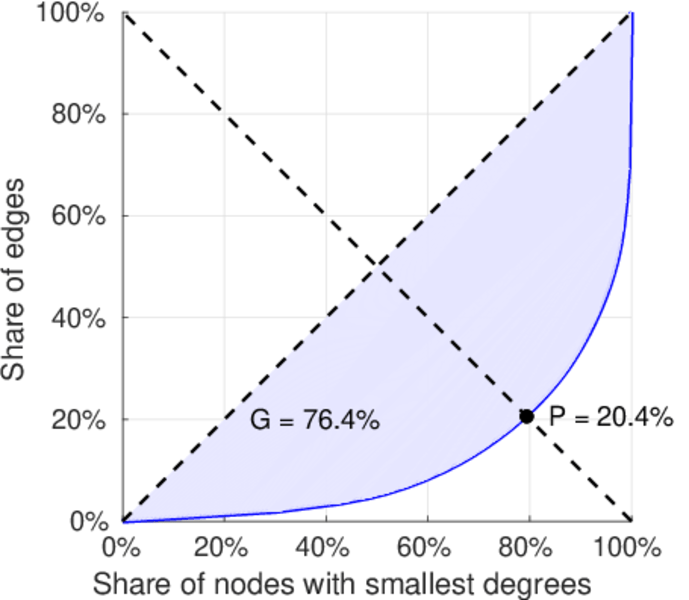
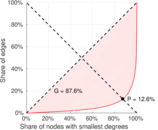
| Gini coefficient | G = | 0.713 603
|
| Balanced inequality ratio | P = | 0.233 364
|
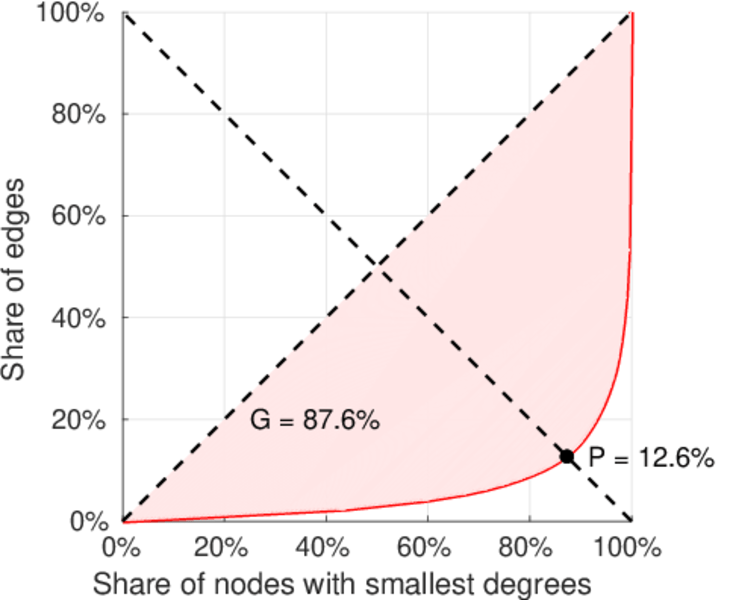
| Left balanced inequality ratio | P1 = | 0.125 588
|
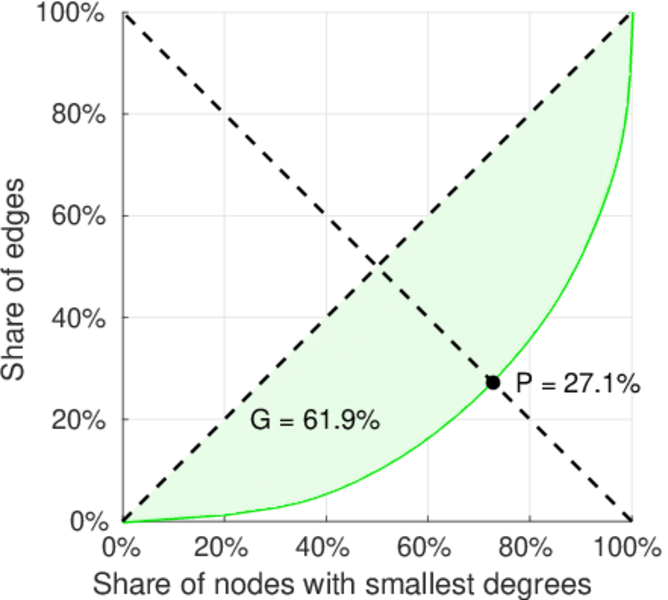
| Right balanced inequality ratio | P2 = | 0.270 616
|
| Relative edge distribution entropy | Her = | 0.811 452
|
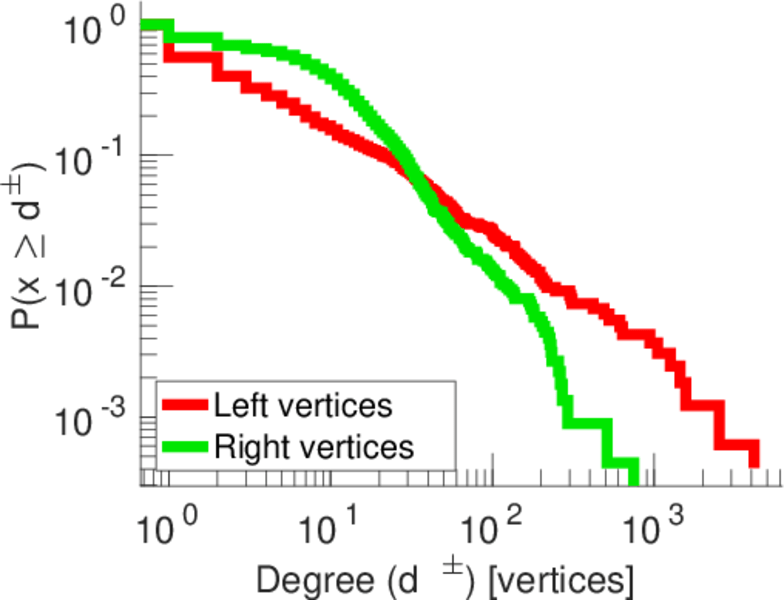
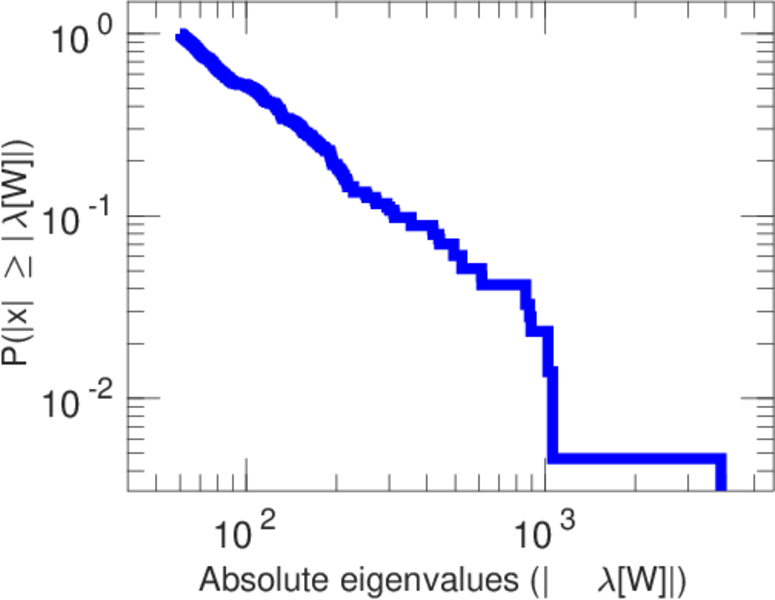
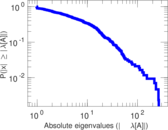
| Power law exponent | γ = | 2.068 49
|
| Tail power law exponent | γt = | 2.021 00
|
| Tail power law exponent with p | γ3 = | 2.021 00
|
| p-value | p = | 0.798 000
|
| Left tail power law exponent with p | γ3,1 = | 2.001 00
|
| Left p-value | p1 = | 0.495 000
|
| Right tail power law exponent with p | γ3,2 = | 2.411 00
|
| Right p-value | p2 = | 0.272 000
|
| Degree assortativity | ρ = | −0.405 850
|
| Degree assortativity p-value | pρ = | 0.000 00
|
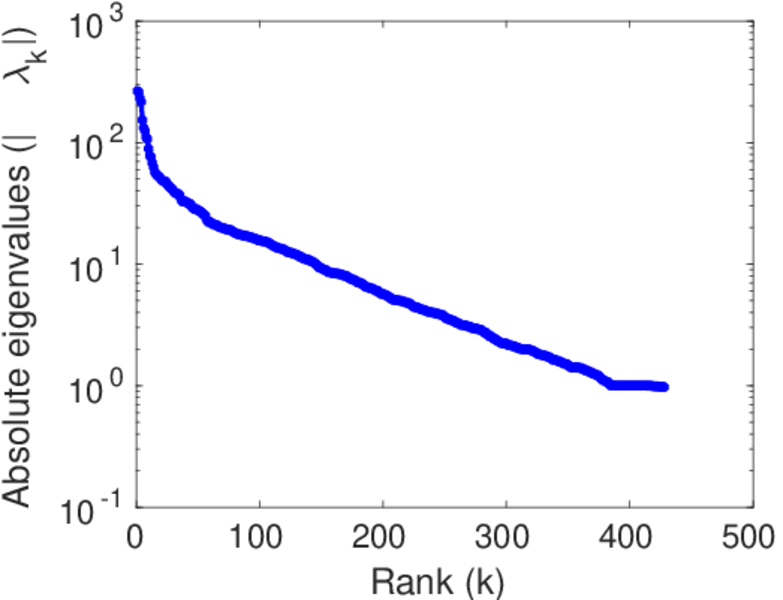
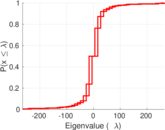
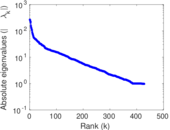
| Spectral norm | α = | 264.661
|
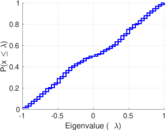
| Algebraic connectivity | a = | 0.196 480
|
| Spectral separation | |λ1[A] / λ2[A]| = | 1.015 29
|
| Controllability | C = | 2,879
|
| Relative controllability | Cr = | 0.742 968
|
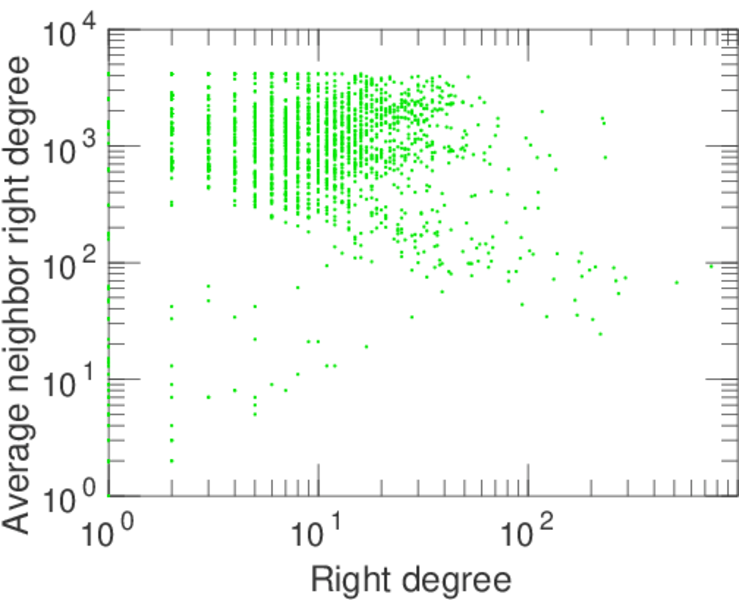
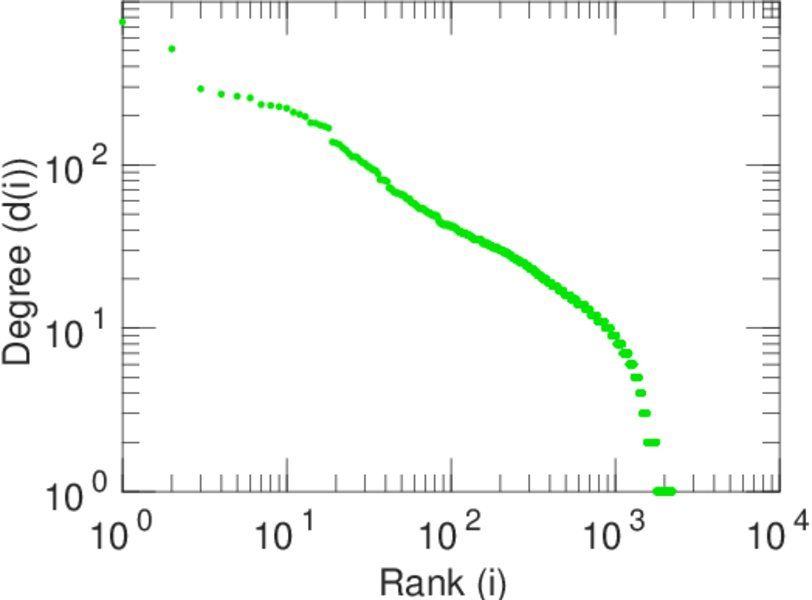
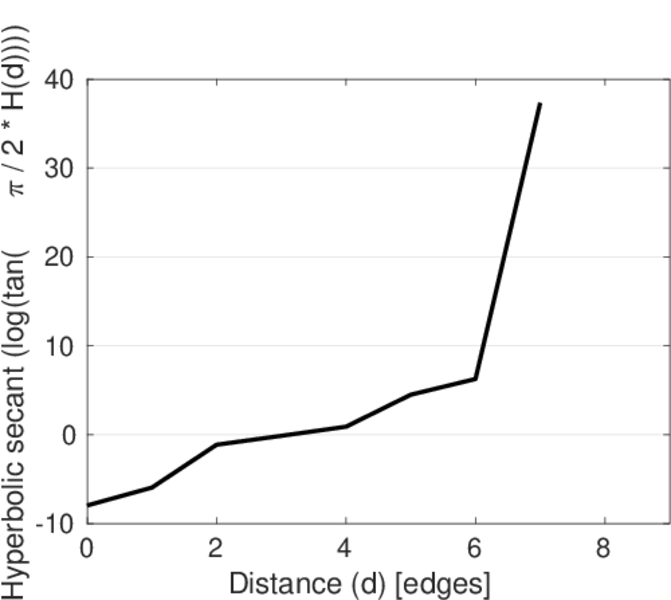
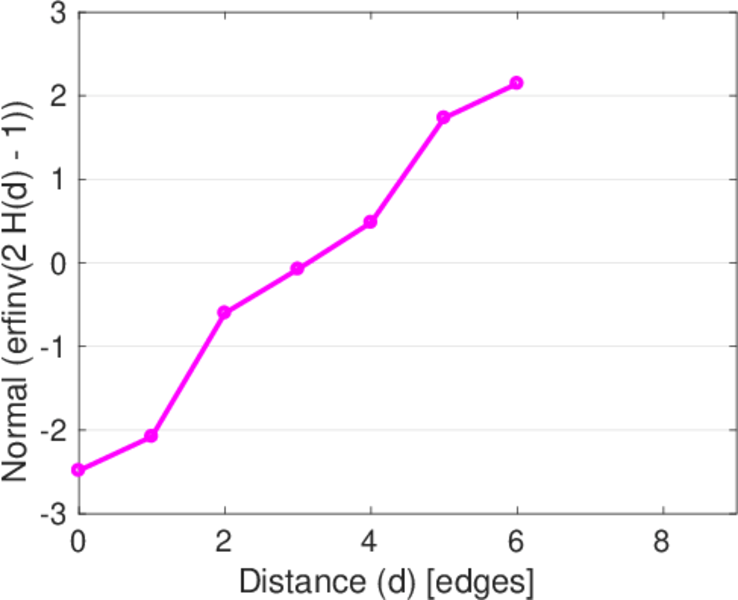
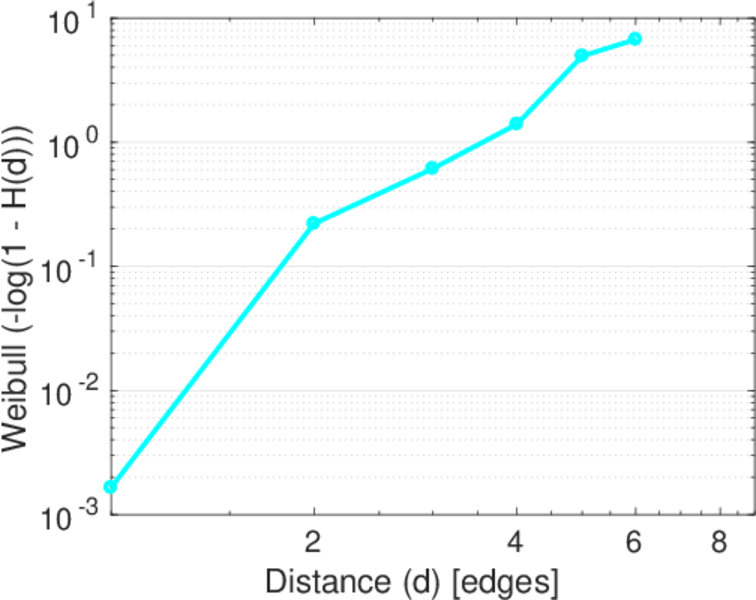
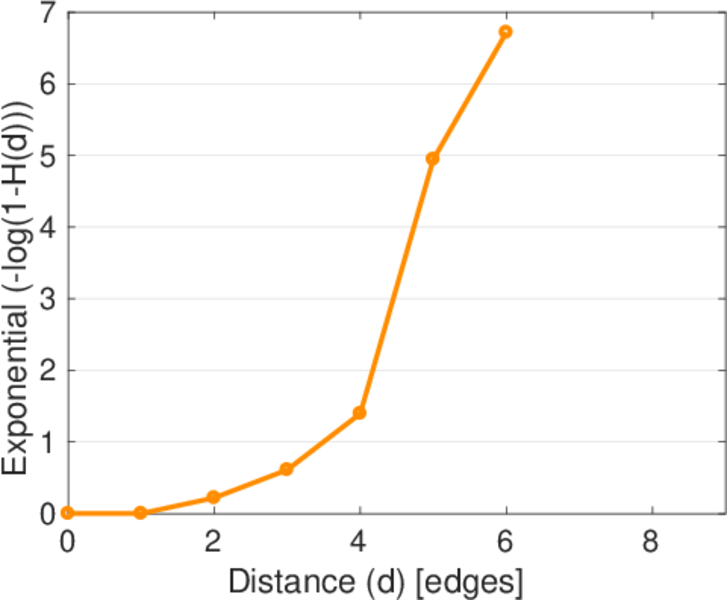
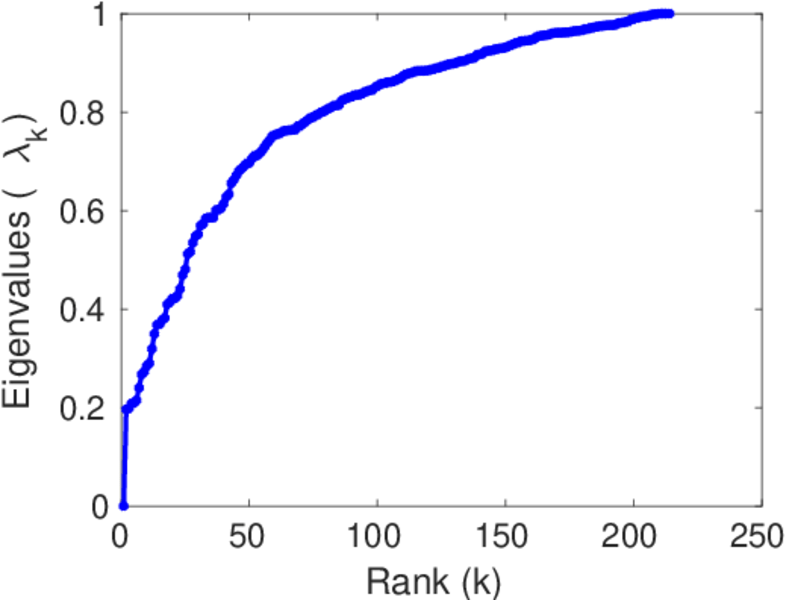
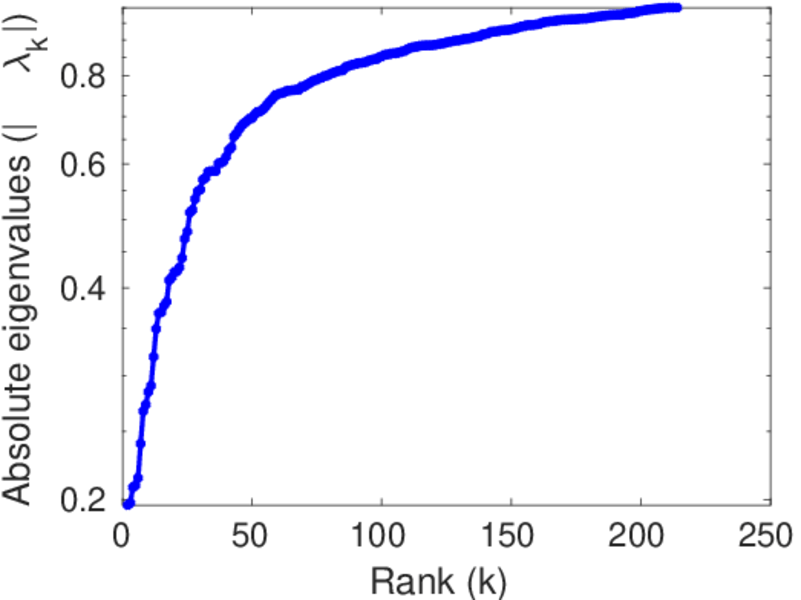
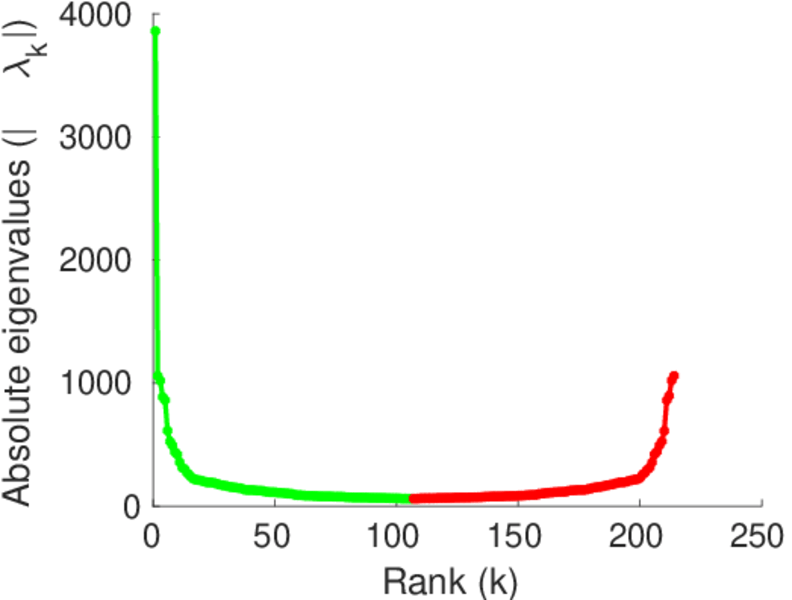
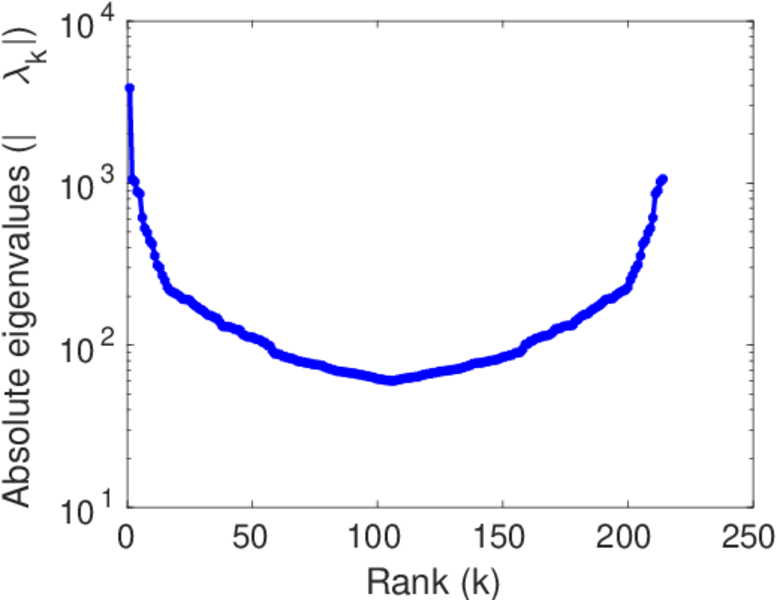
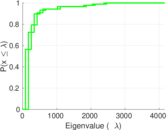
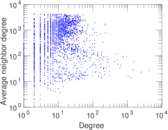
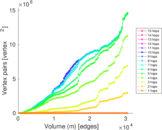
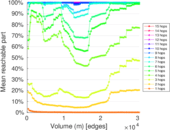
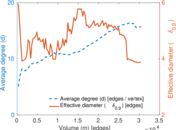
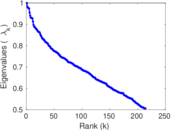
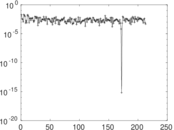
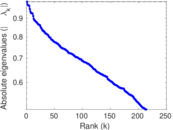
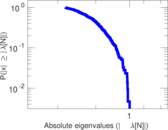
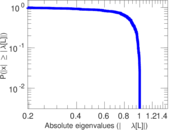
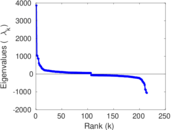
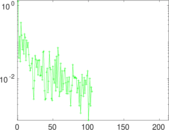
Plots


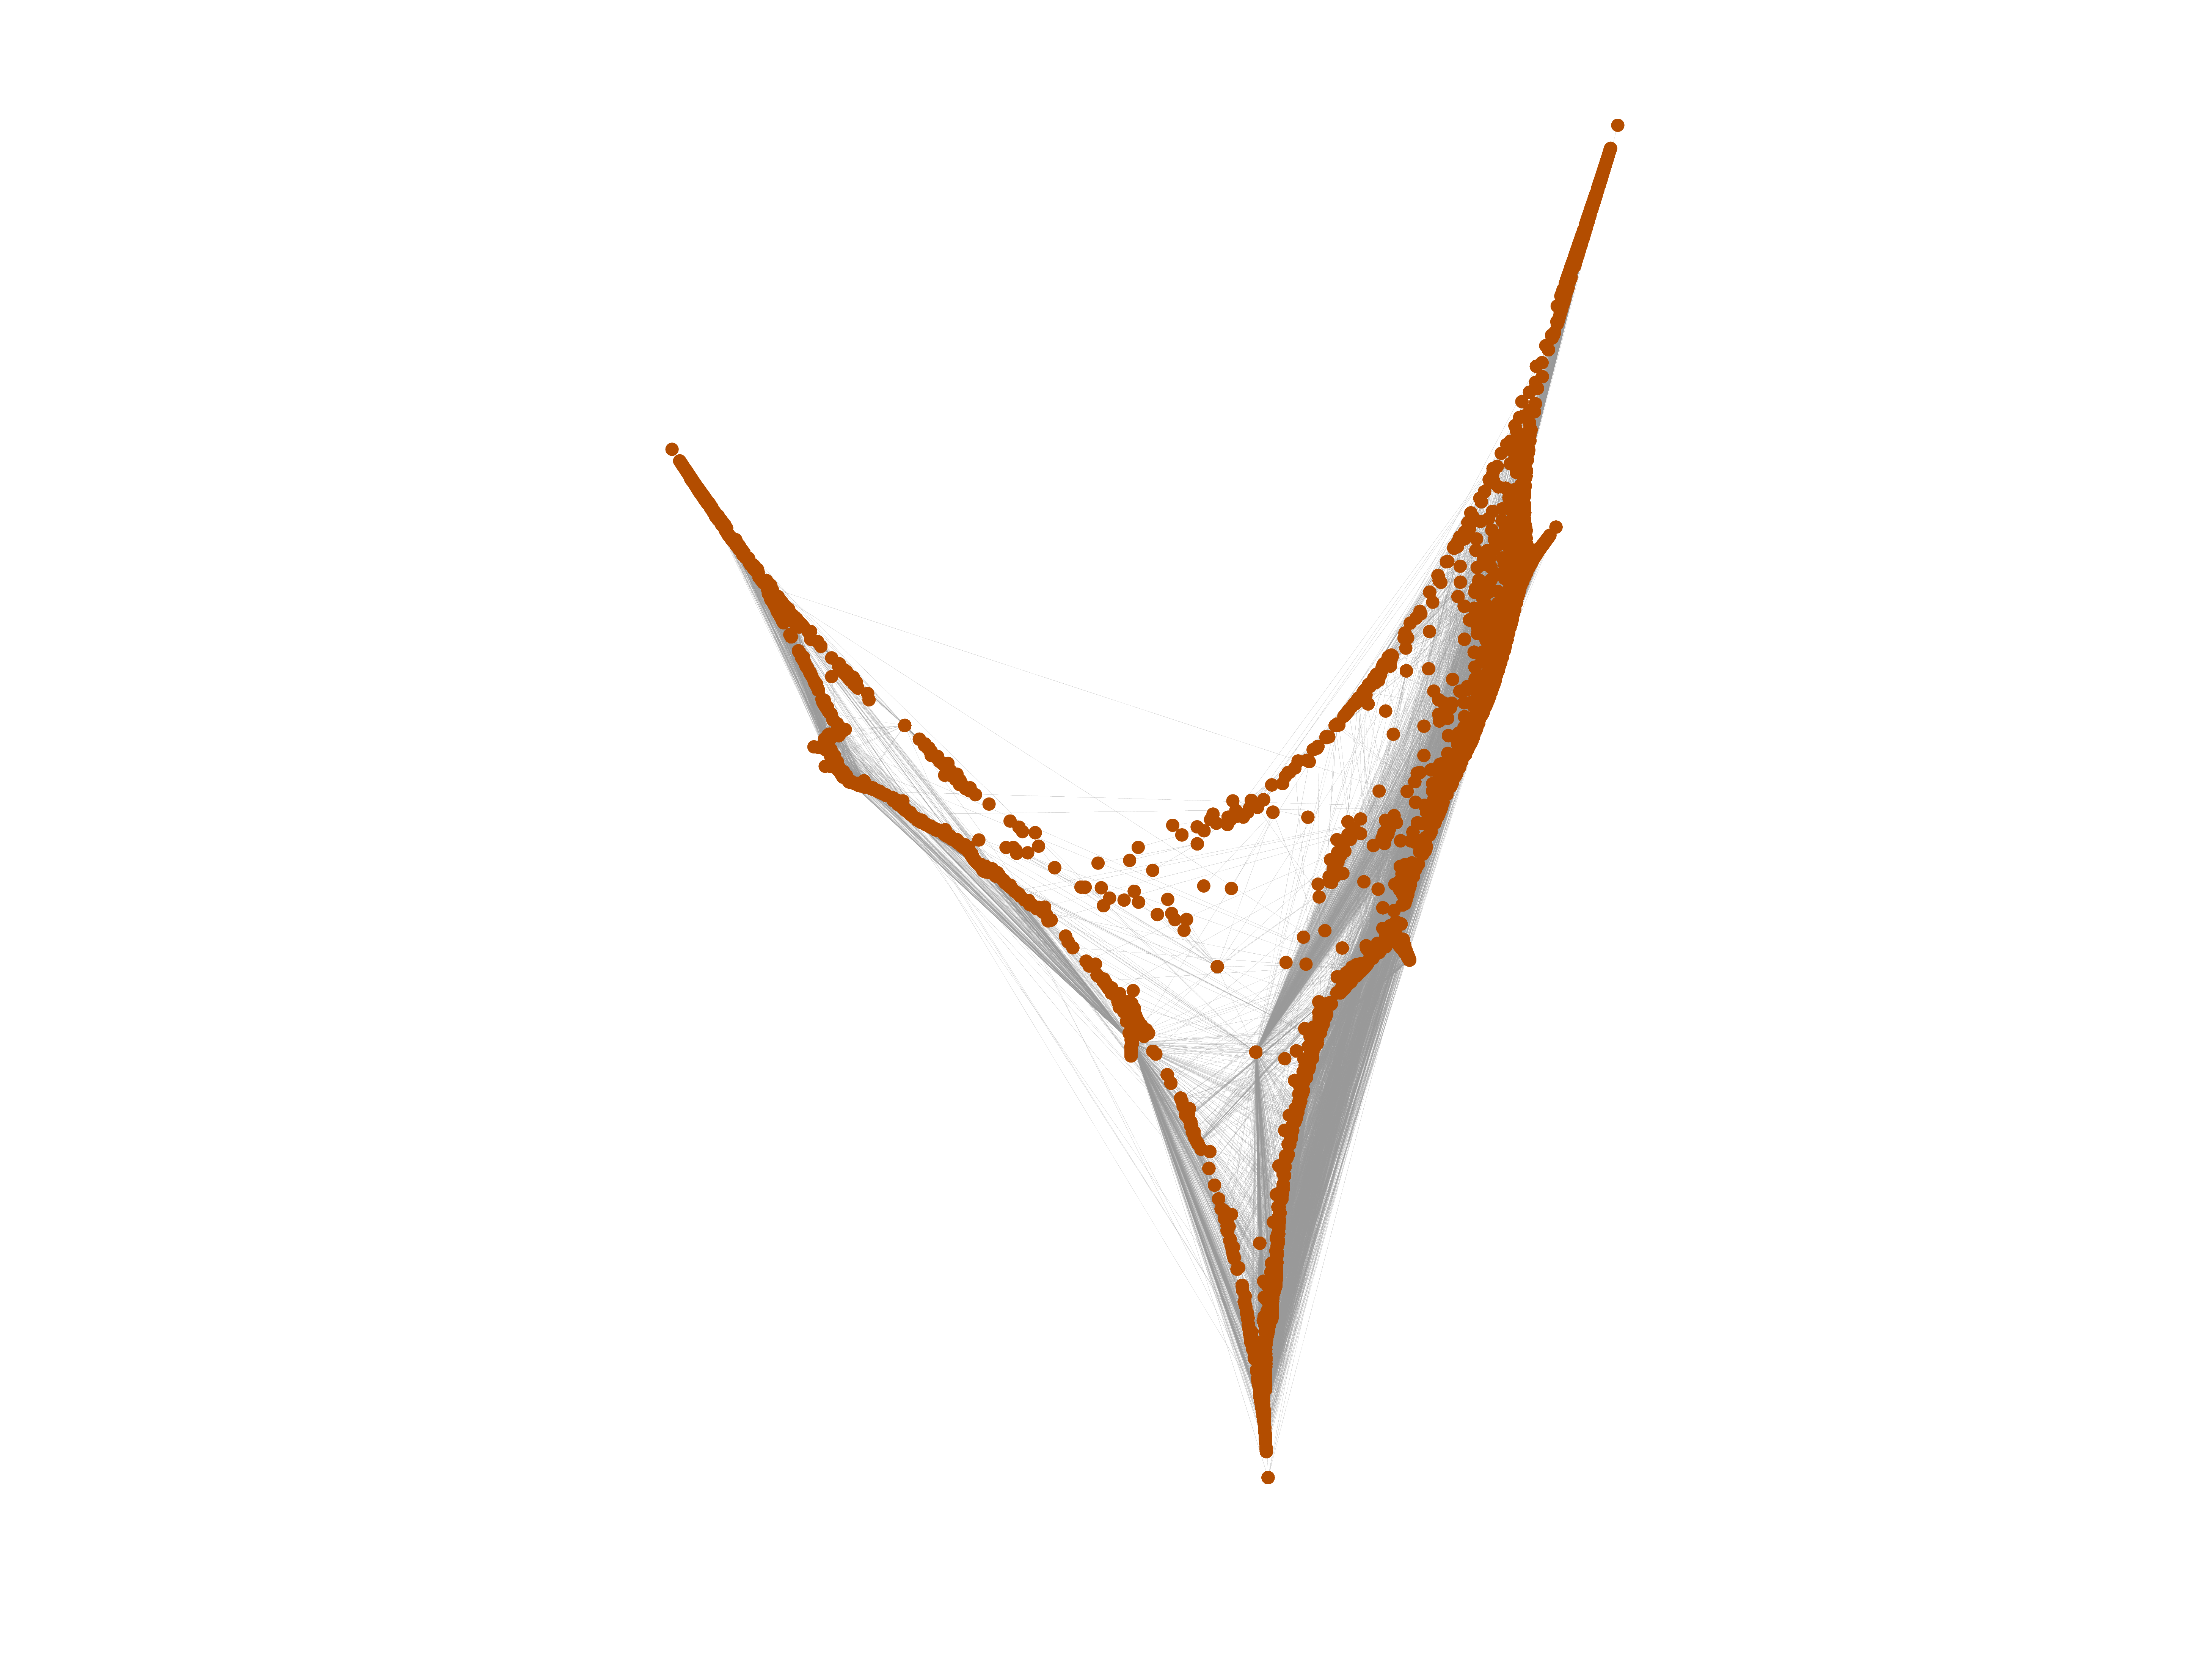
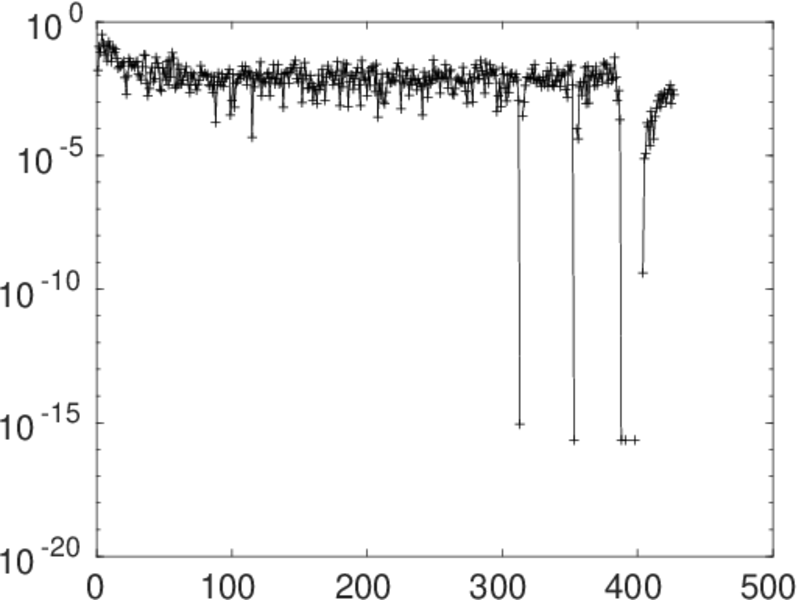
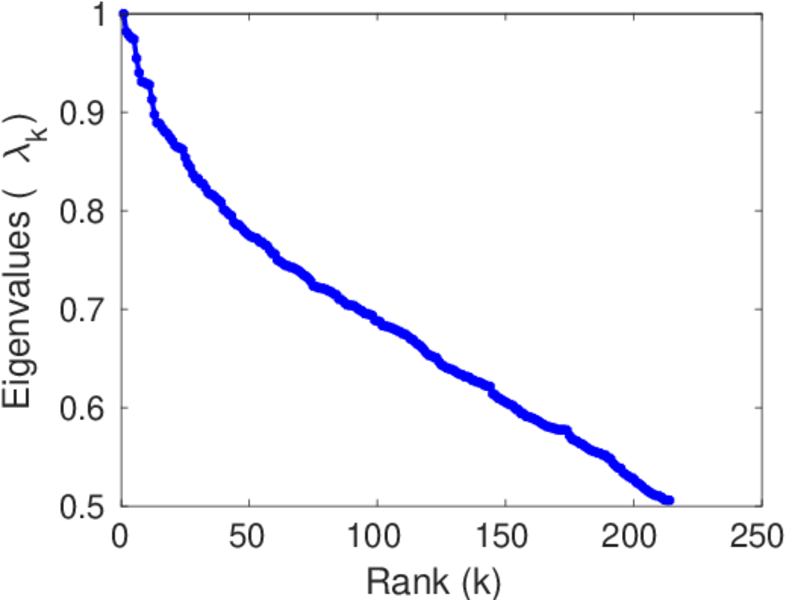
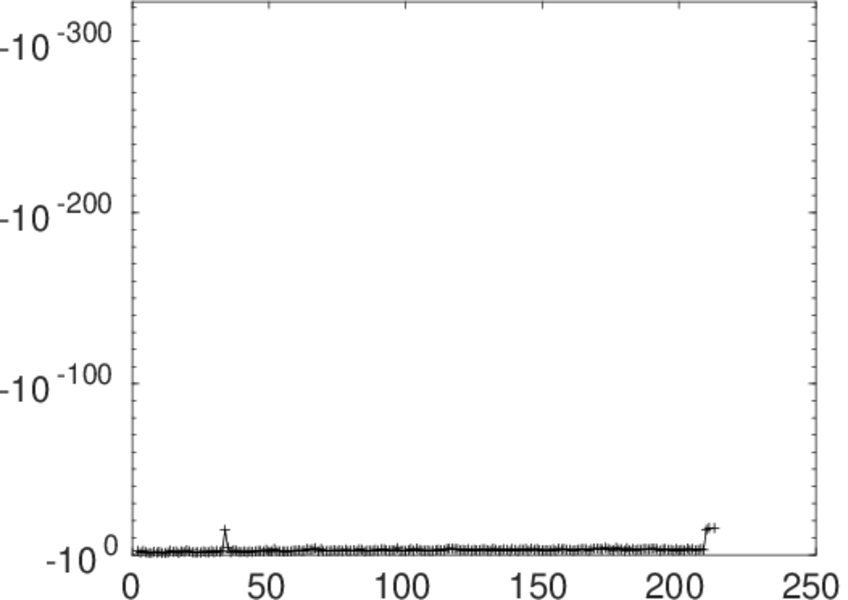
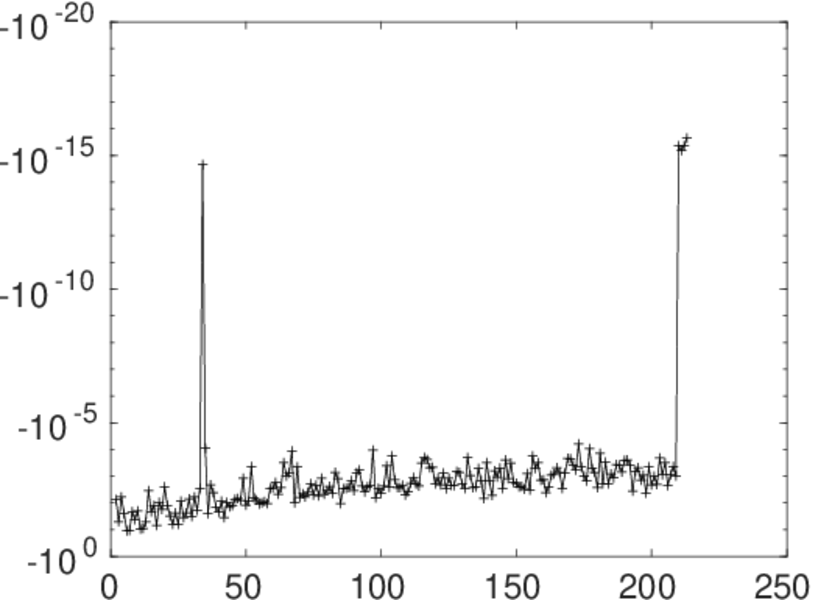
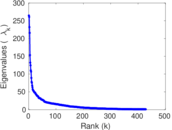
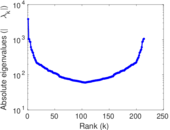
Matrix decompositions plots


Downloads
References
|
[1]
|
Jérôme Kunegis.
KONECT – The Koblenz Network Collection.
In Proc. Int. Conf. on World Wide Web Companion, pages
1343–1350, 2013.
[ http ]
|
|
[2]
|
Wikimedia Foundation.
Wikimedia downloads.
http://dumps.wikimedia.org/, January 2010.
|
 KONECT ‣ Networks ‣
Buy Me a Coffee
KONECT ‣ Networks ‣
Buy Me a Coffee