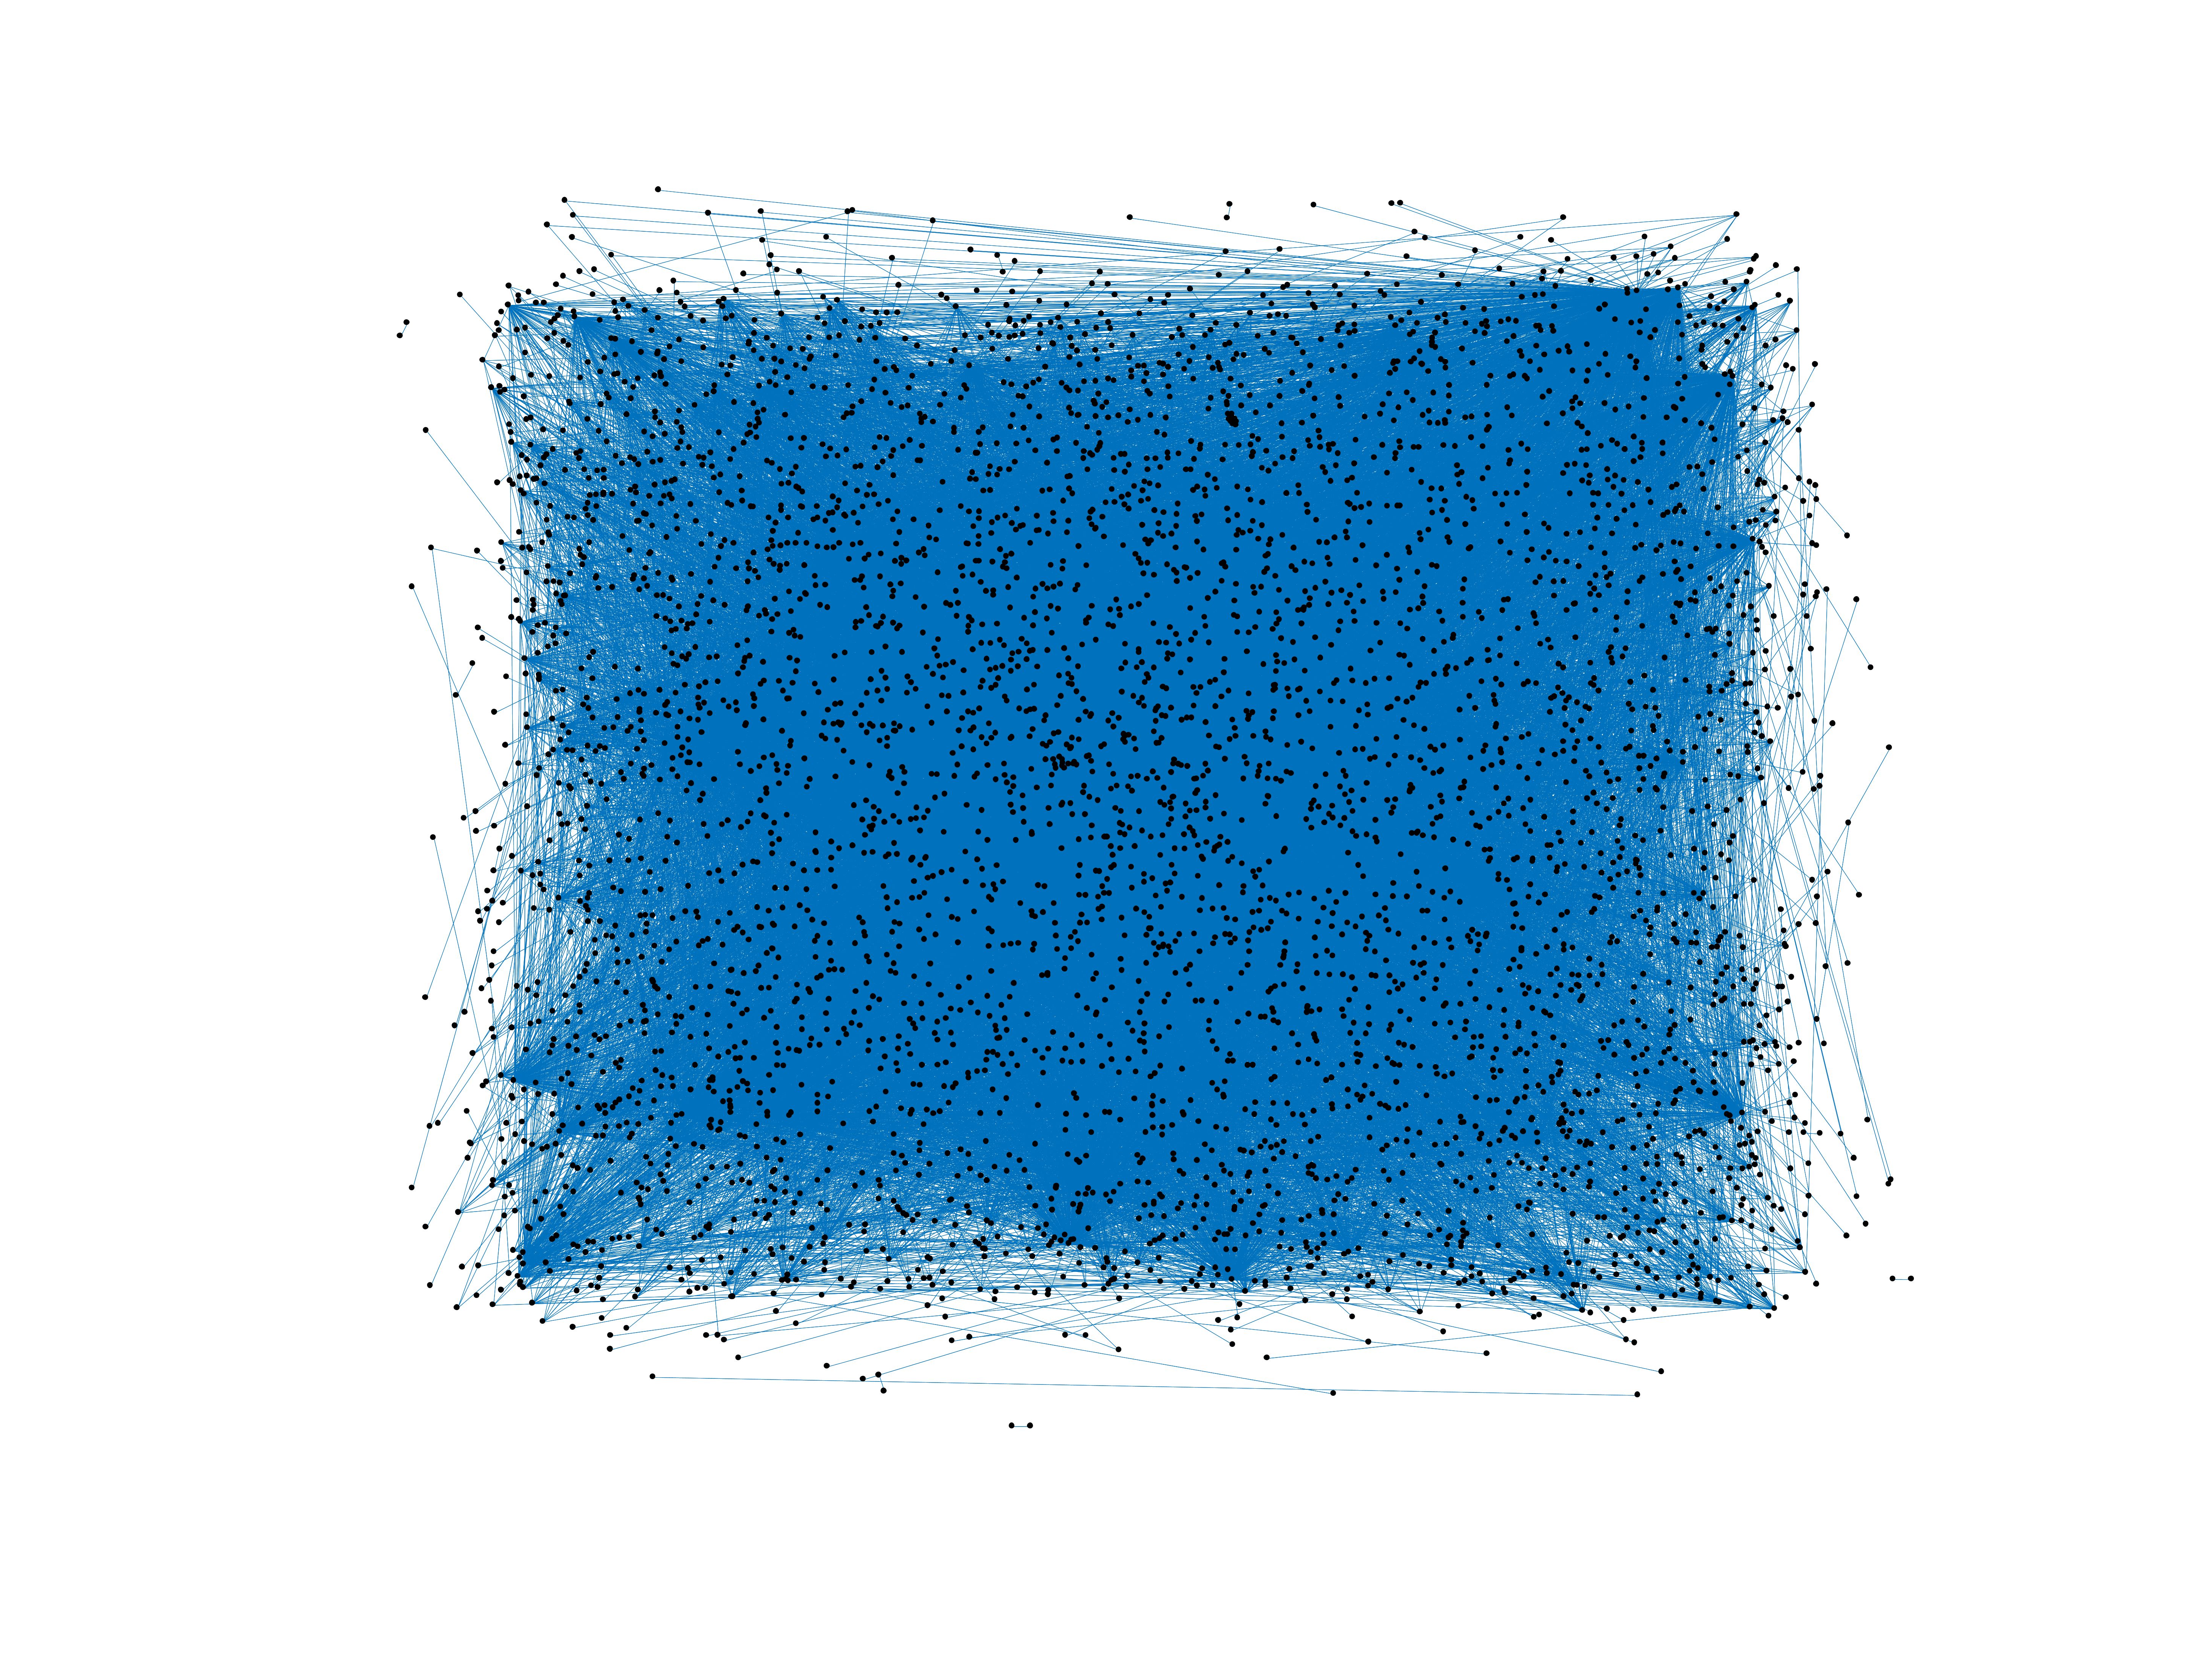
Wikipedia edits (tet)
This is the bipartite edit network of the Tetum Wikipedia. It contains users
and pages from the Tetum Wikipedia, connected by edit events. Each edge
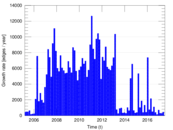
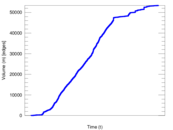
represents an edit. The dataset includes the timestamp of each edit.
Metadata
Statistics
| Size | n = | 4,623
|
| Left size | n1 = | 1,215
|
| Right size | n2 = | 3,408
|
| Volume | m = | 53,419
|
| Unique edge count | m̿ = | 20,551
|
| Wedge count | s = | 3,368,229
|
| Claw count | z = | 550,734,106
|
| Cross count | x = | 86,239,115,893
|
| Square count | q = | 12,434,637
|
| 4-Tour count | T4 = | 113,005,390
|
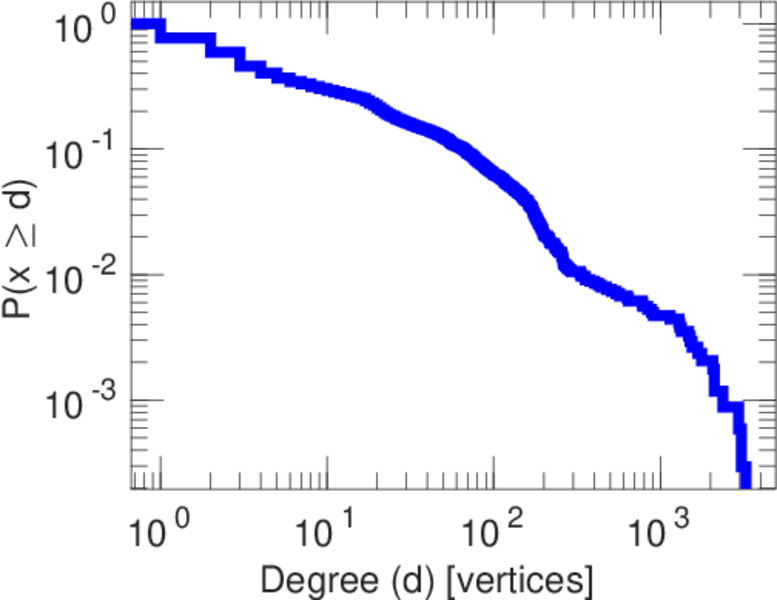
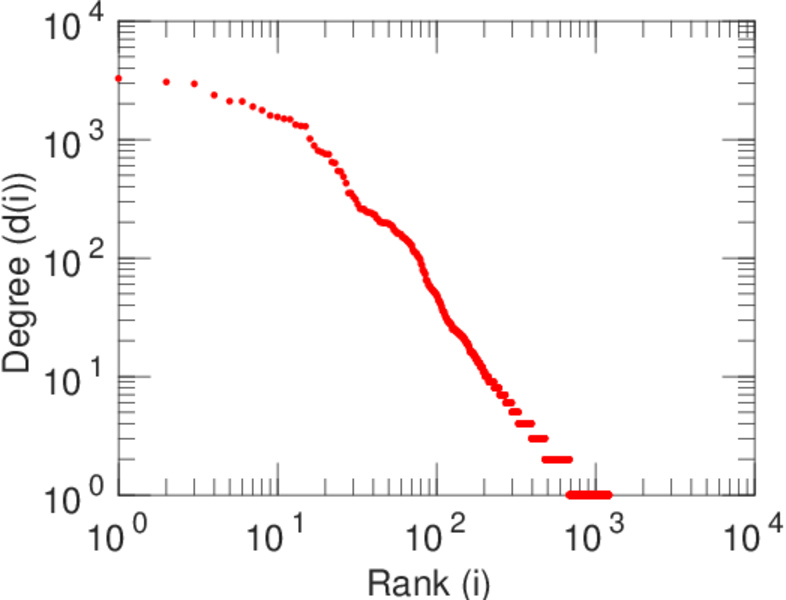
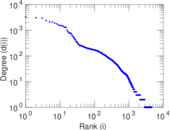
| Maximum degree | dmax = | 3,272
|
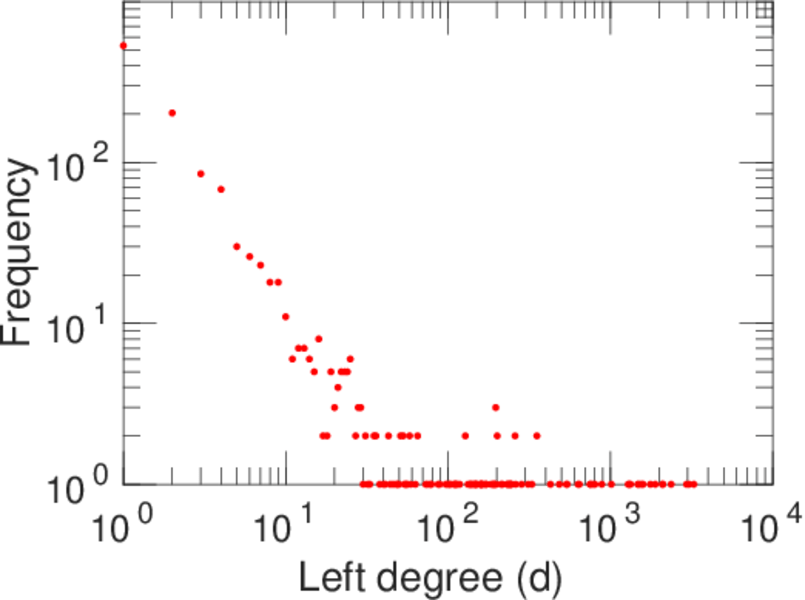
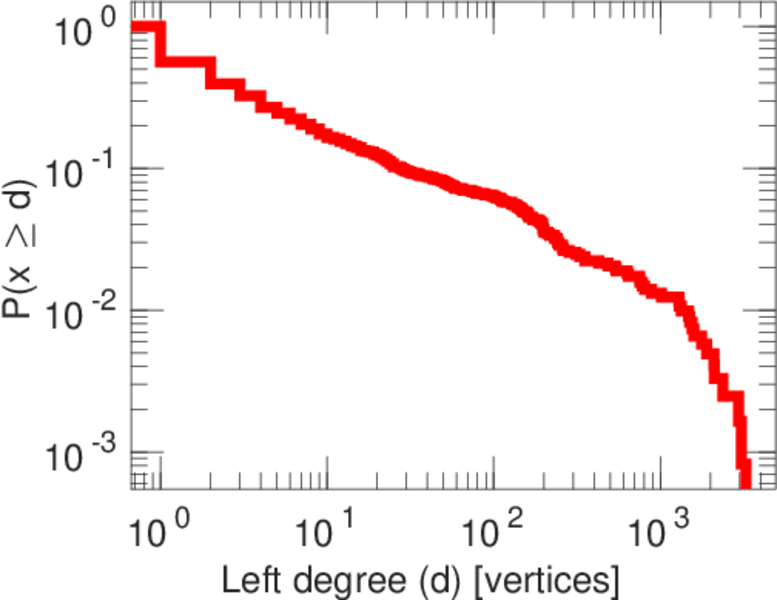
| Maximum left degree | d1max = | 3,272
|
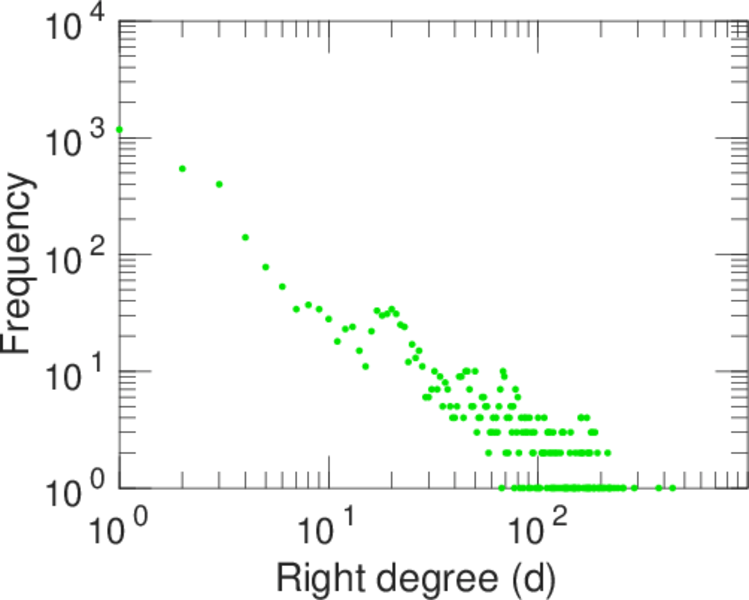
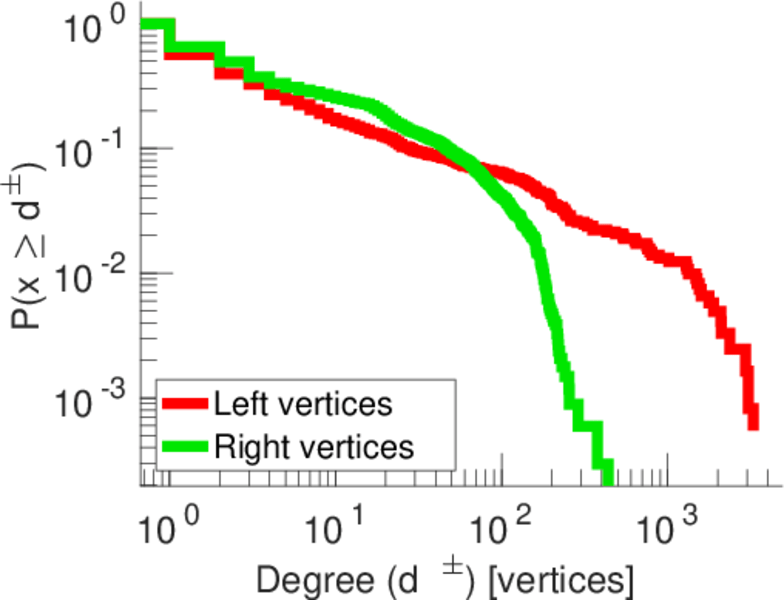
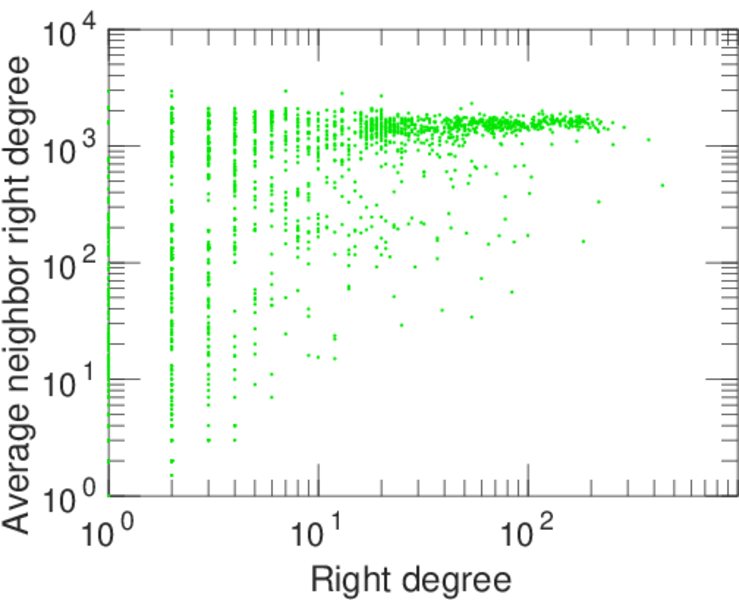
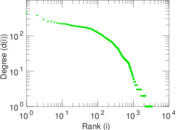
| Maximum right degree | d2max = | 439
|
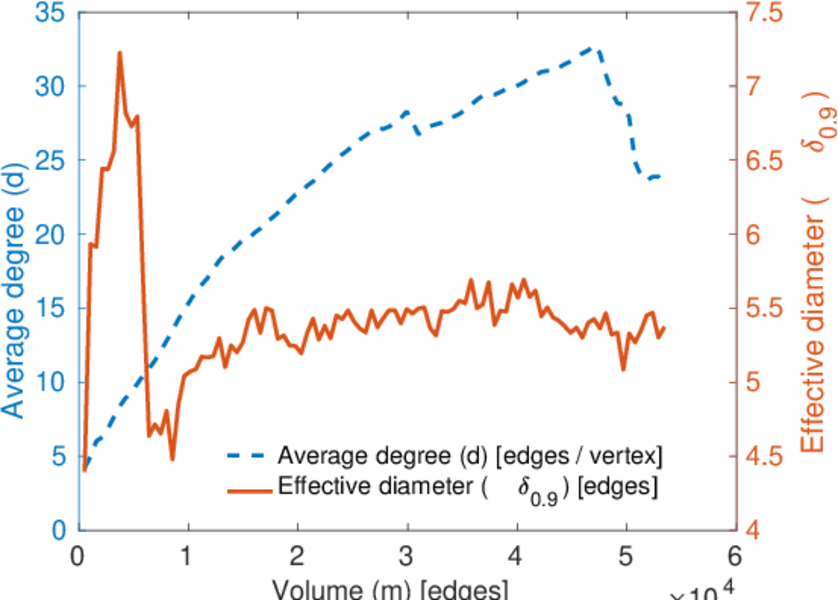
| Average degree | d = | 23.110 1
|
| Average left degree | d1 = | 43.966 3
|
| Average right degree | d2 = | 15.674 6
|
| Fill | p = | 0.004 963 15
|
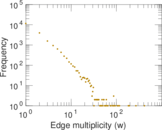
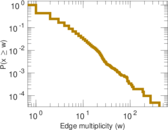
| Average edge multiplicity | m̃ = | 2.599 34
|
| Size of LCC | N = | 4,143
|
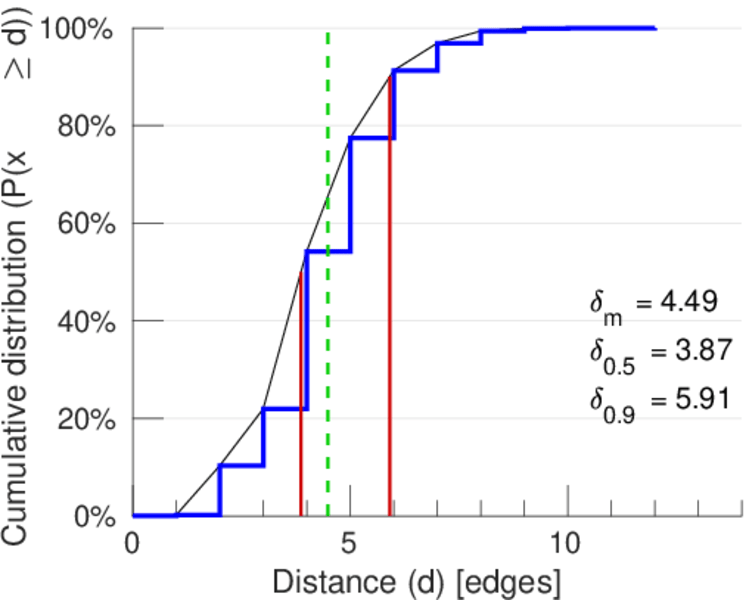
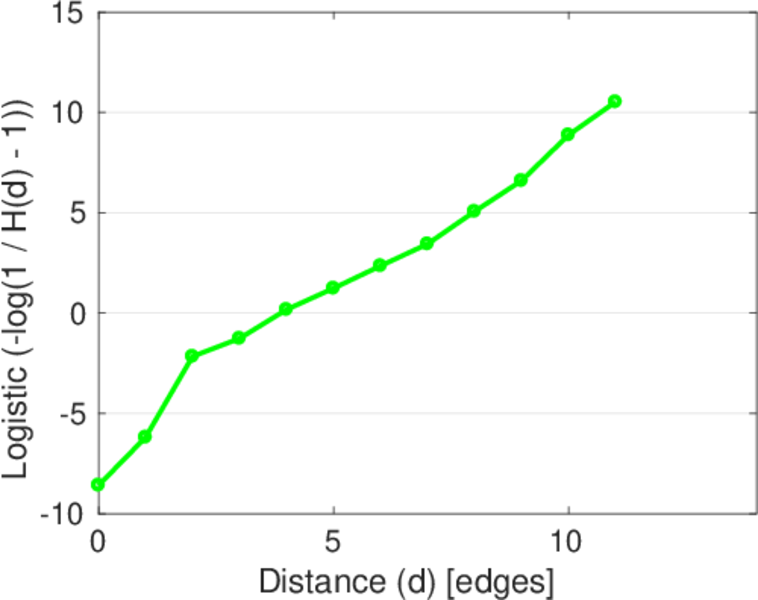
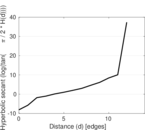
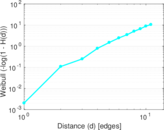
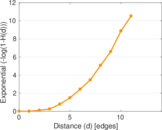
| Diameter | δ = | 14
|
| 50-Percentile effective diameter | δ0.5 = | 3.869 32
|
| 90-Percentile effective diameter | δ0.9 = | 5.907 13
|
| Median distance | δM = | 4
|
| Mean distance | δm = | 4.485 05
|
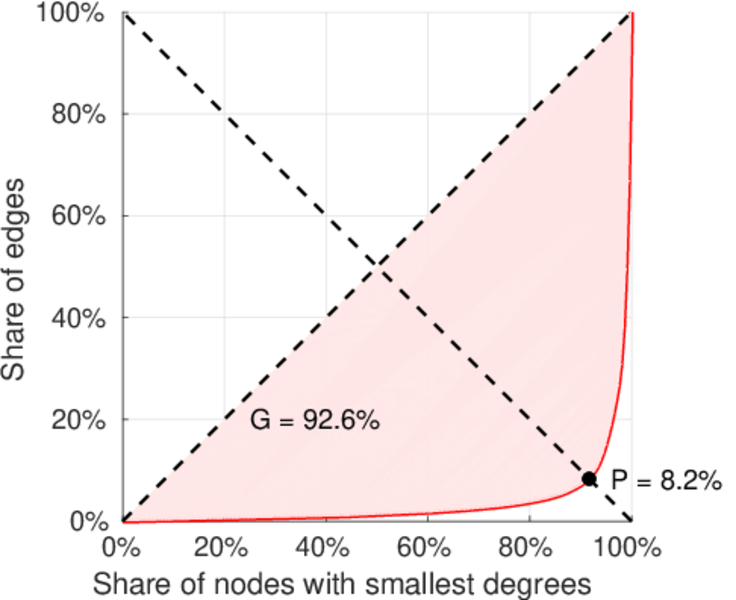
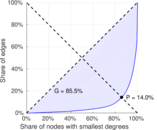
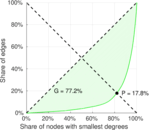
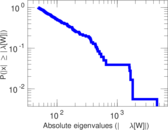
| Gini coefficient | G = | 0.841 713
|
| Balanced inequality ratio | P = | 0.149 310
|
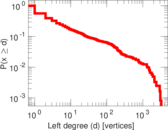
| Left balanced inequality ratio | P1 = | 0.081 731 2
|
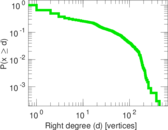
| Right balanced inequality ratio | P2 = | 0.177 577
|
| Relative edge distribution entropy | Her = | 0.803 319
|
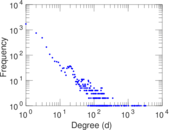
| Power law exponent | γ = | 2.119 99
|
| Tail power law exponent | γt = | 1.741 00
|
| Tail power law exponent with p | γ3 = | 1.741 00
|
| p-value | p = | 0.000 00
|
| Left tail power law exponent with p | γ3,1 = | 1.641 00
|
| Left p-value | p1 = | 0.001 000 00
|
| Right tail power law exponent with p | γ3,2 = | 1.731 00
|
| Right p-value | p2 = | 0.000 00
|
| Degree assortativity | ρ = | −0.207 431
|
| Degree assortativity p-value | pρ = | 1.511 87 × 10−198
|
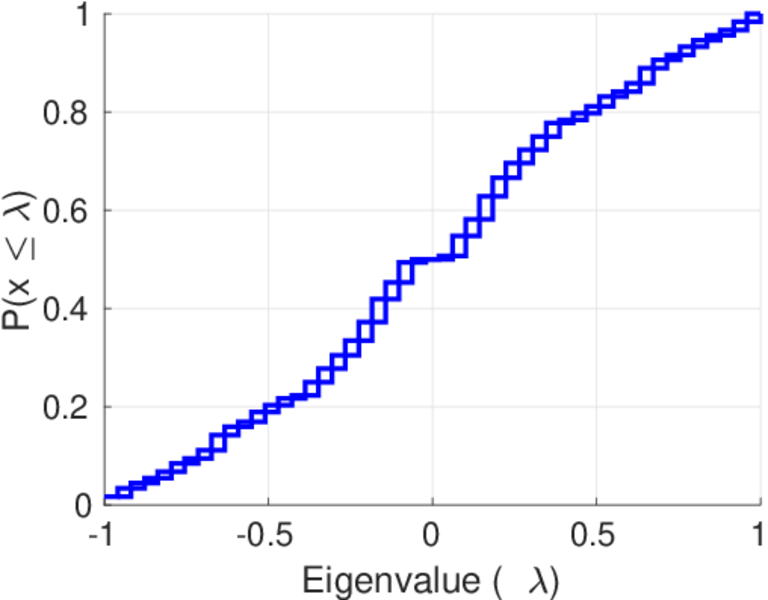
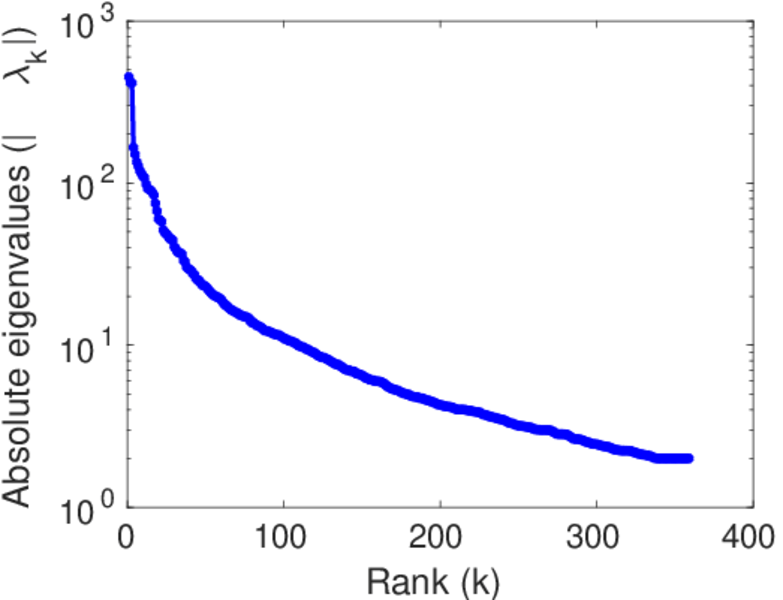
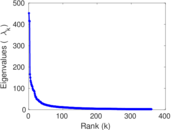
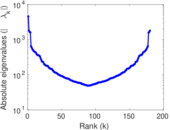
| Spectral norm | α = | 451.992
|
| Algebraic connectivity | a = | 0.034 992 1
|
| Spectral separation | |λ1[A] / λ2[A]| = | 1.085 87
|
| Controllability | C = | 2,975
|
| Relative controllability | Cr = | 0.648 431
|
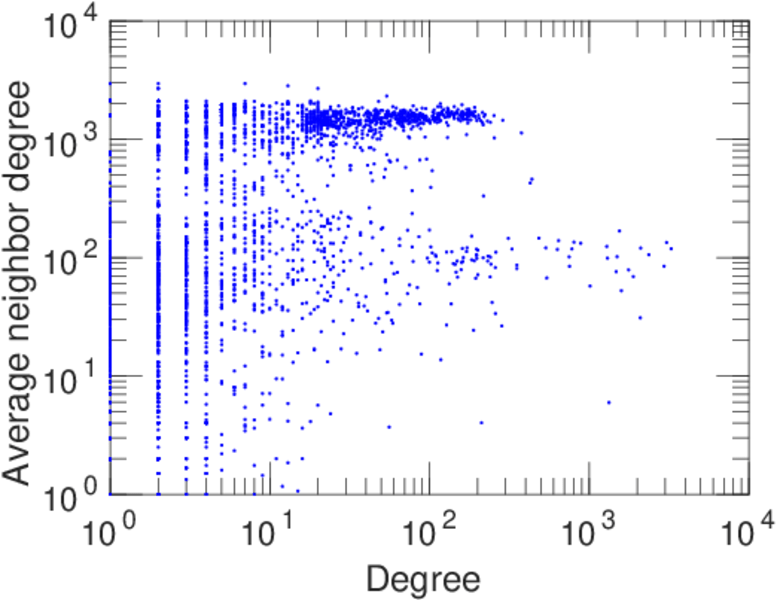
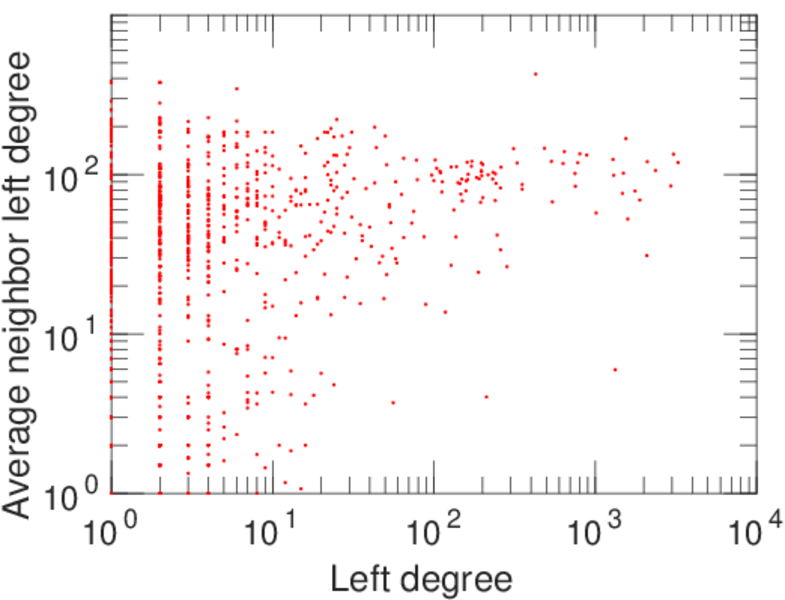
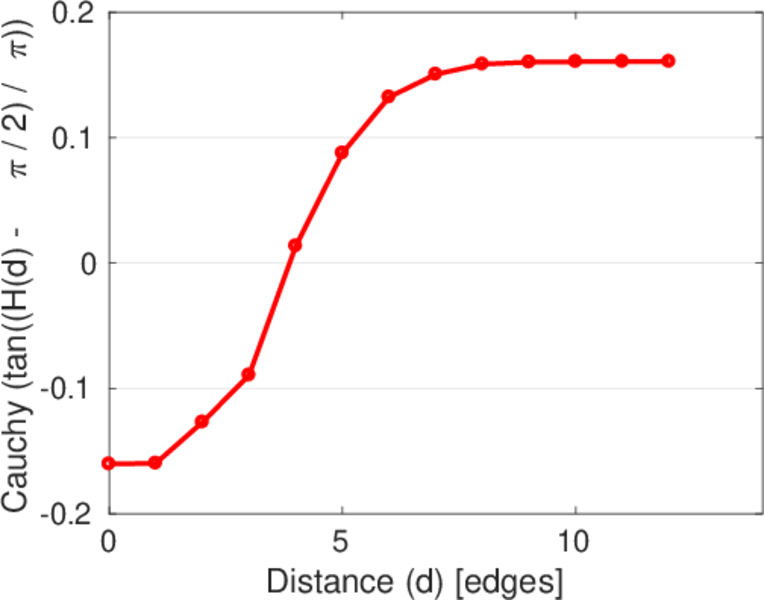
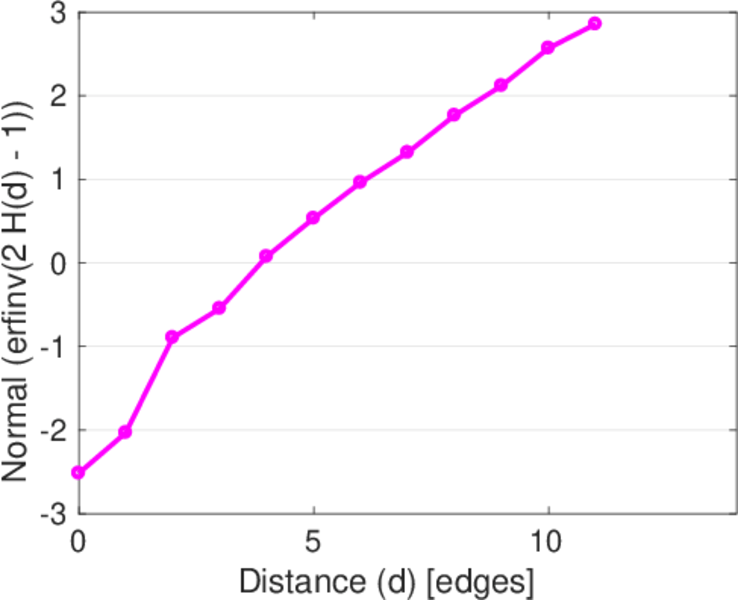
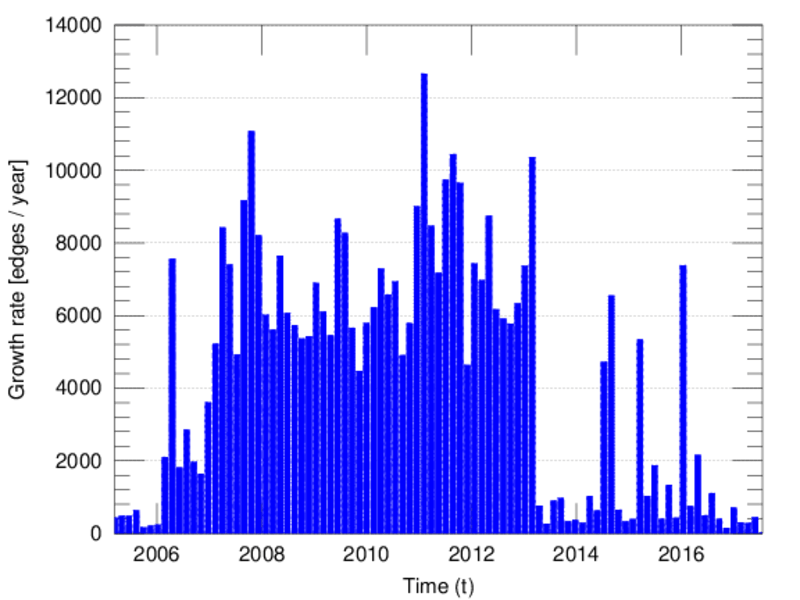
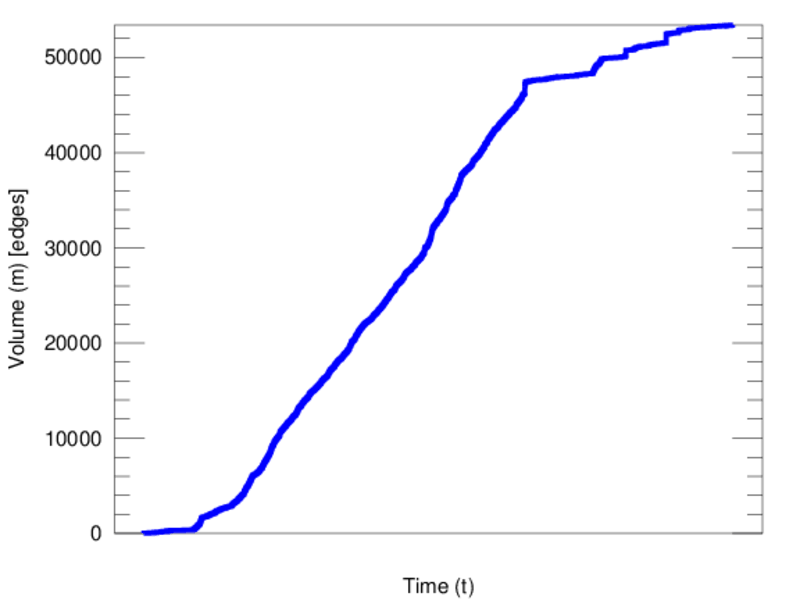
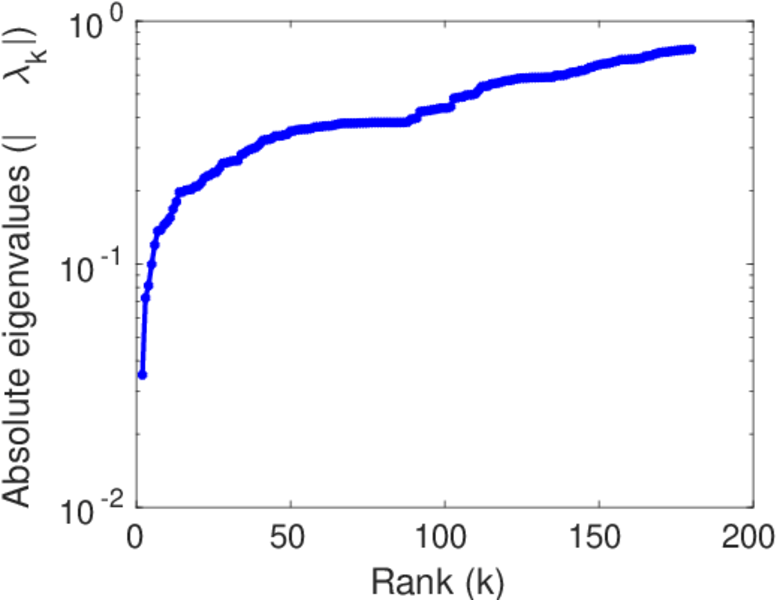
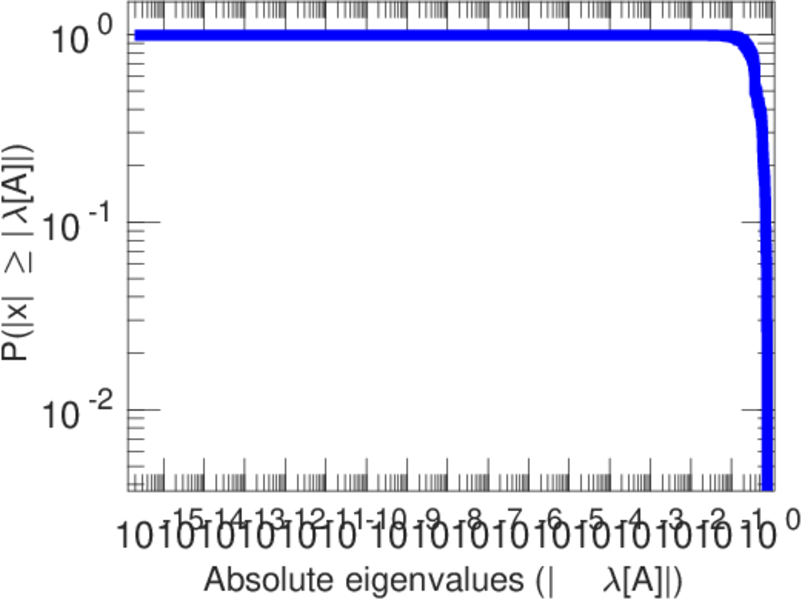
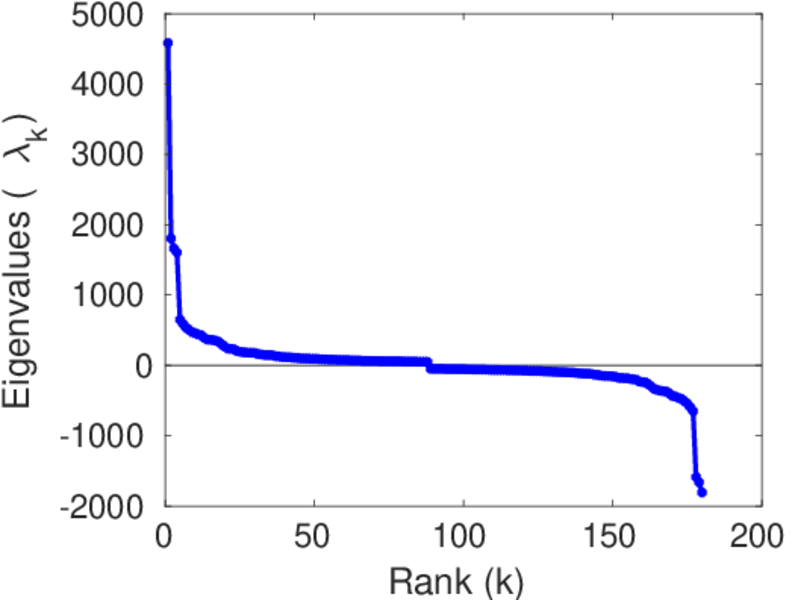
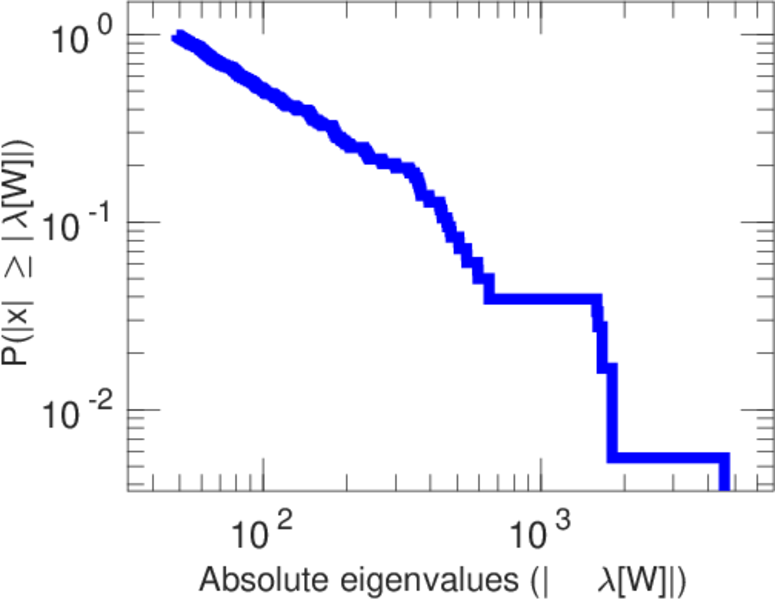
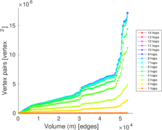
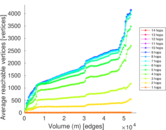
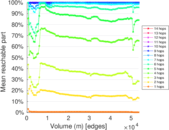
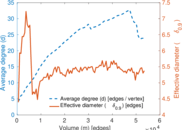
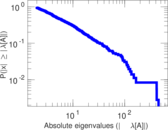
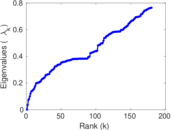
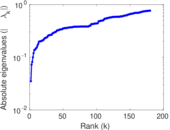
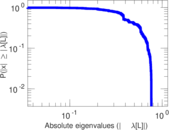
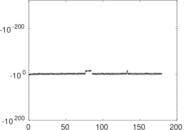
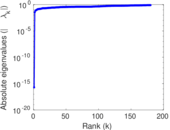
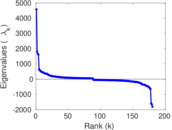
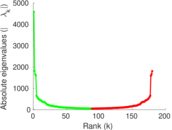
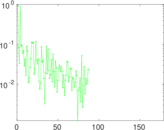
Plots


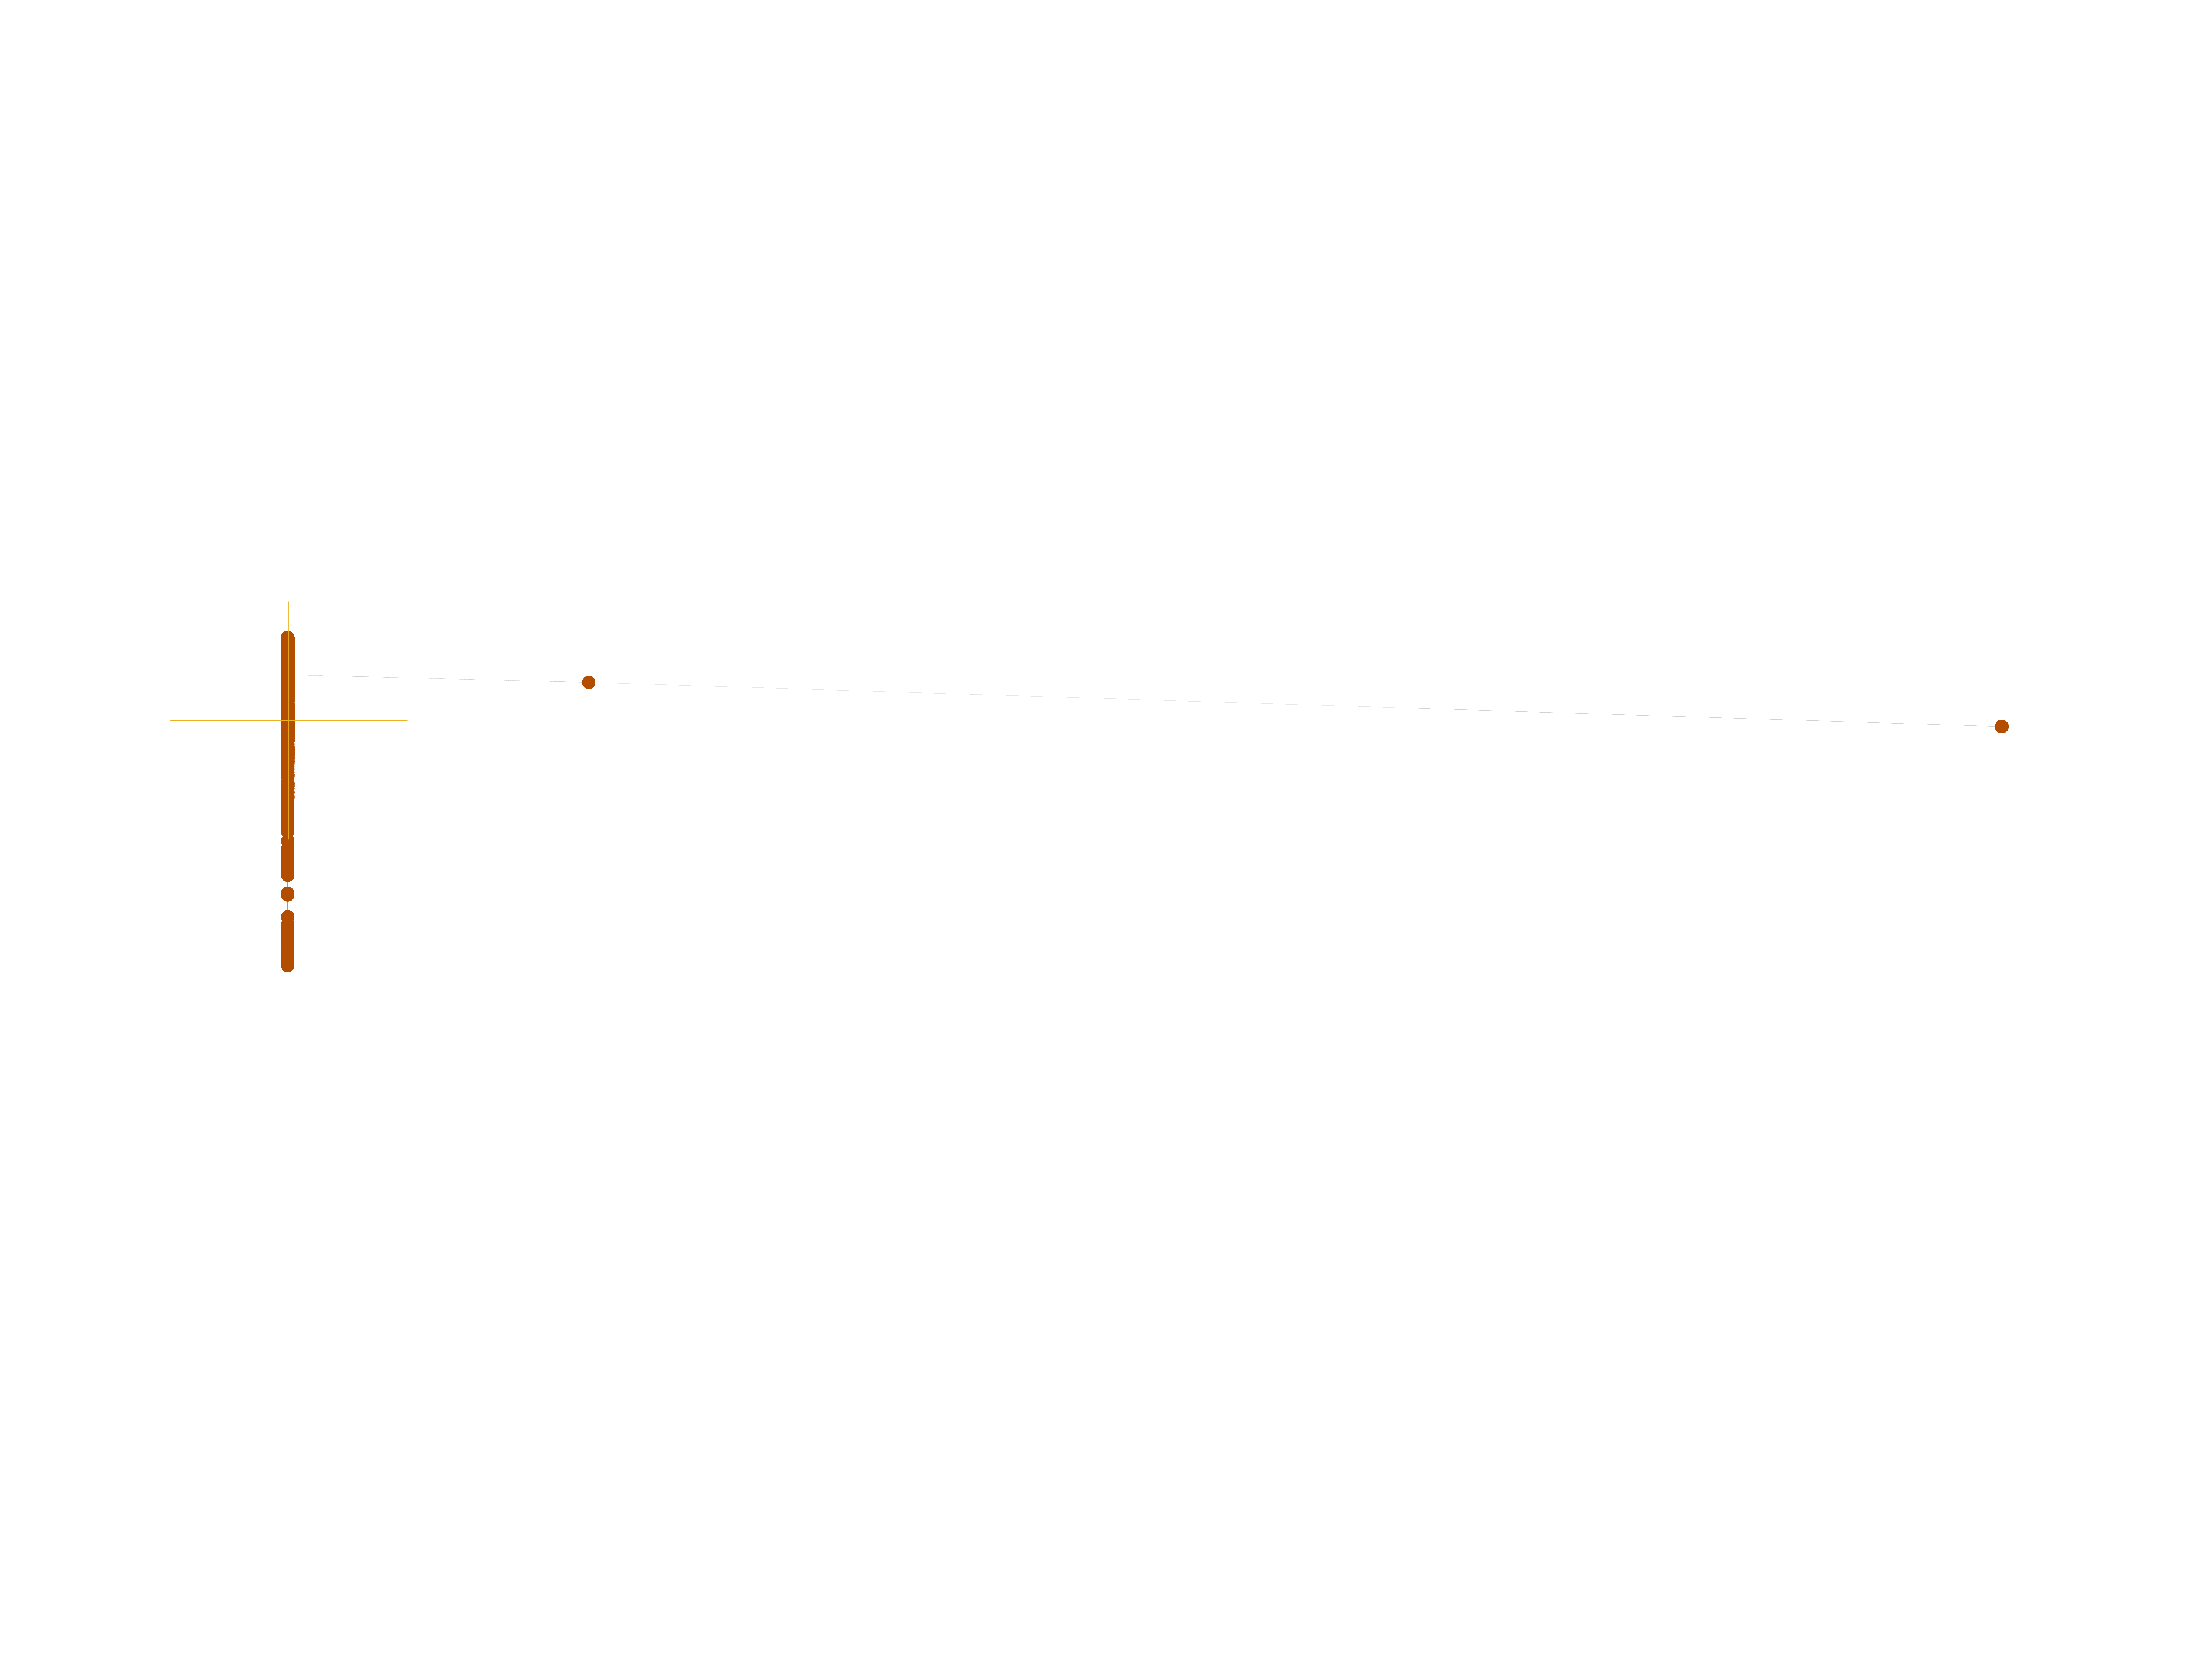
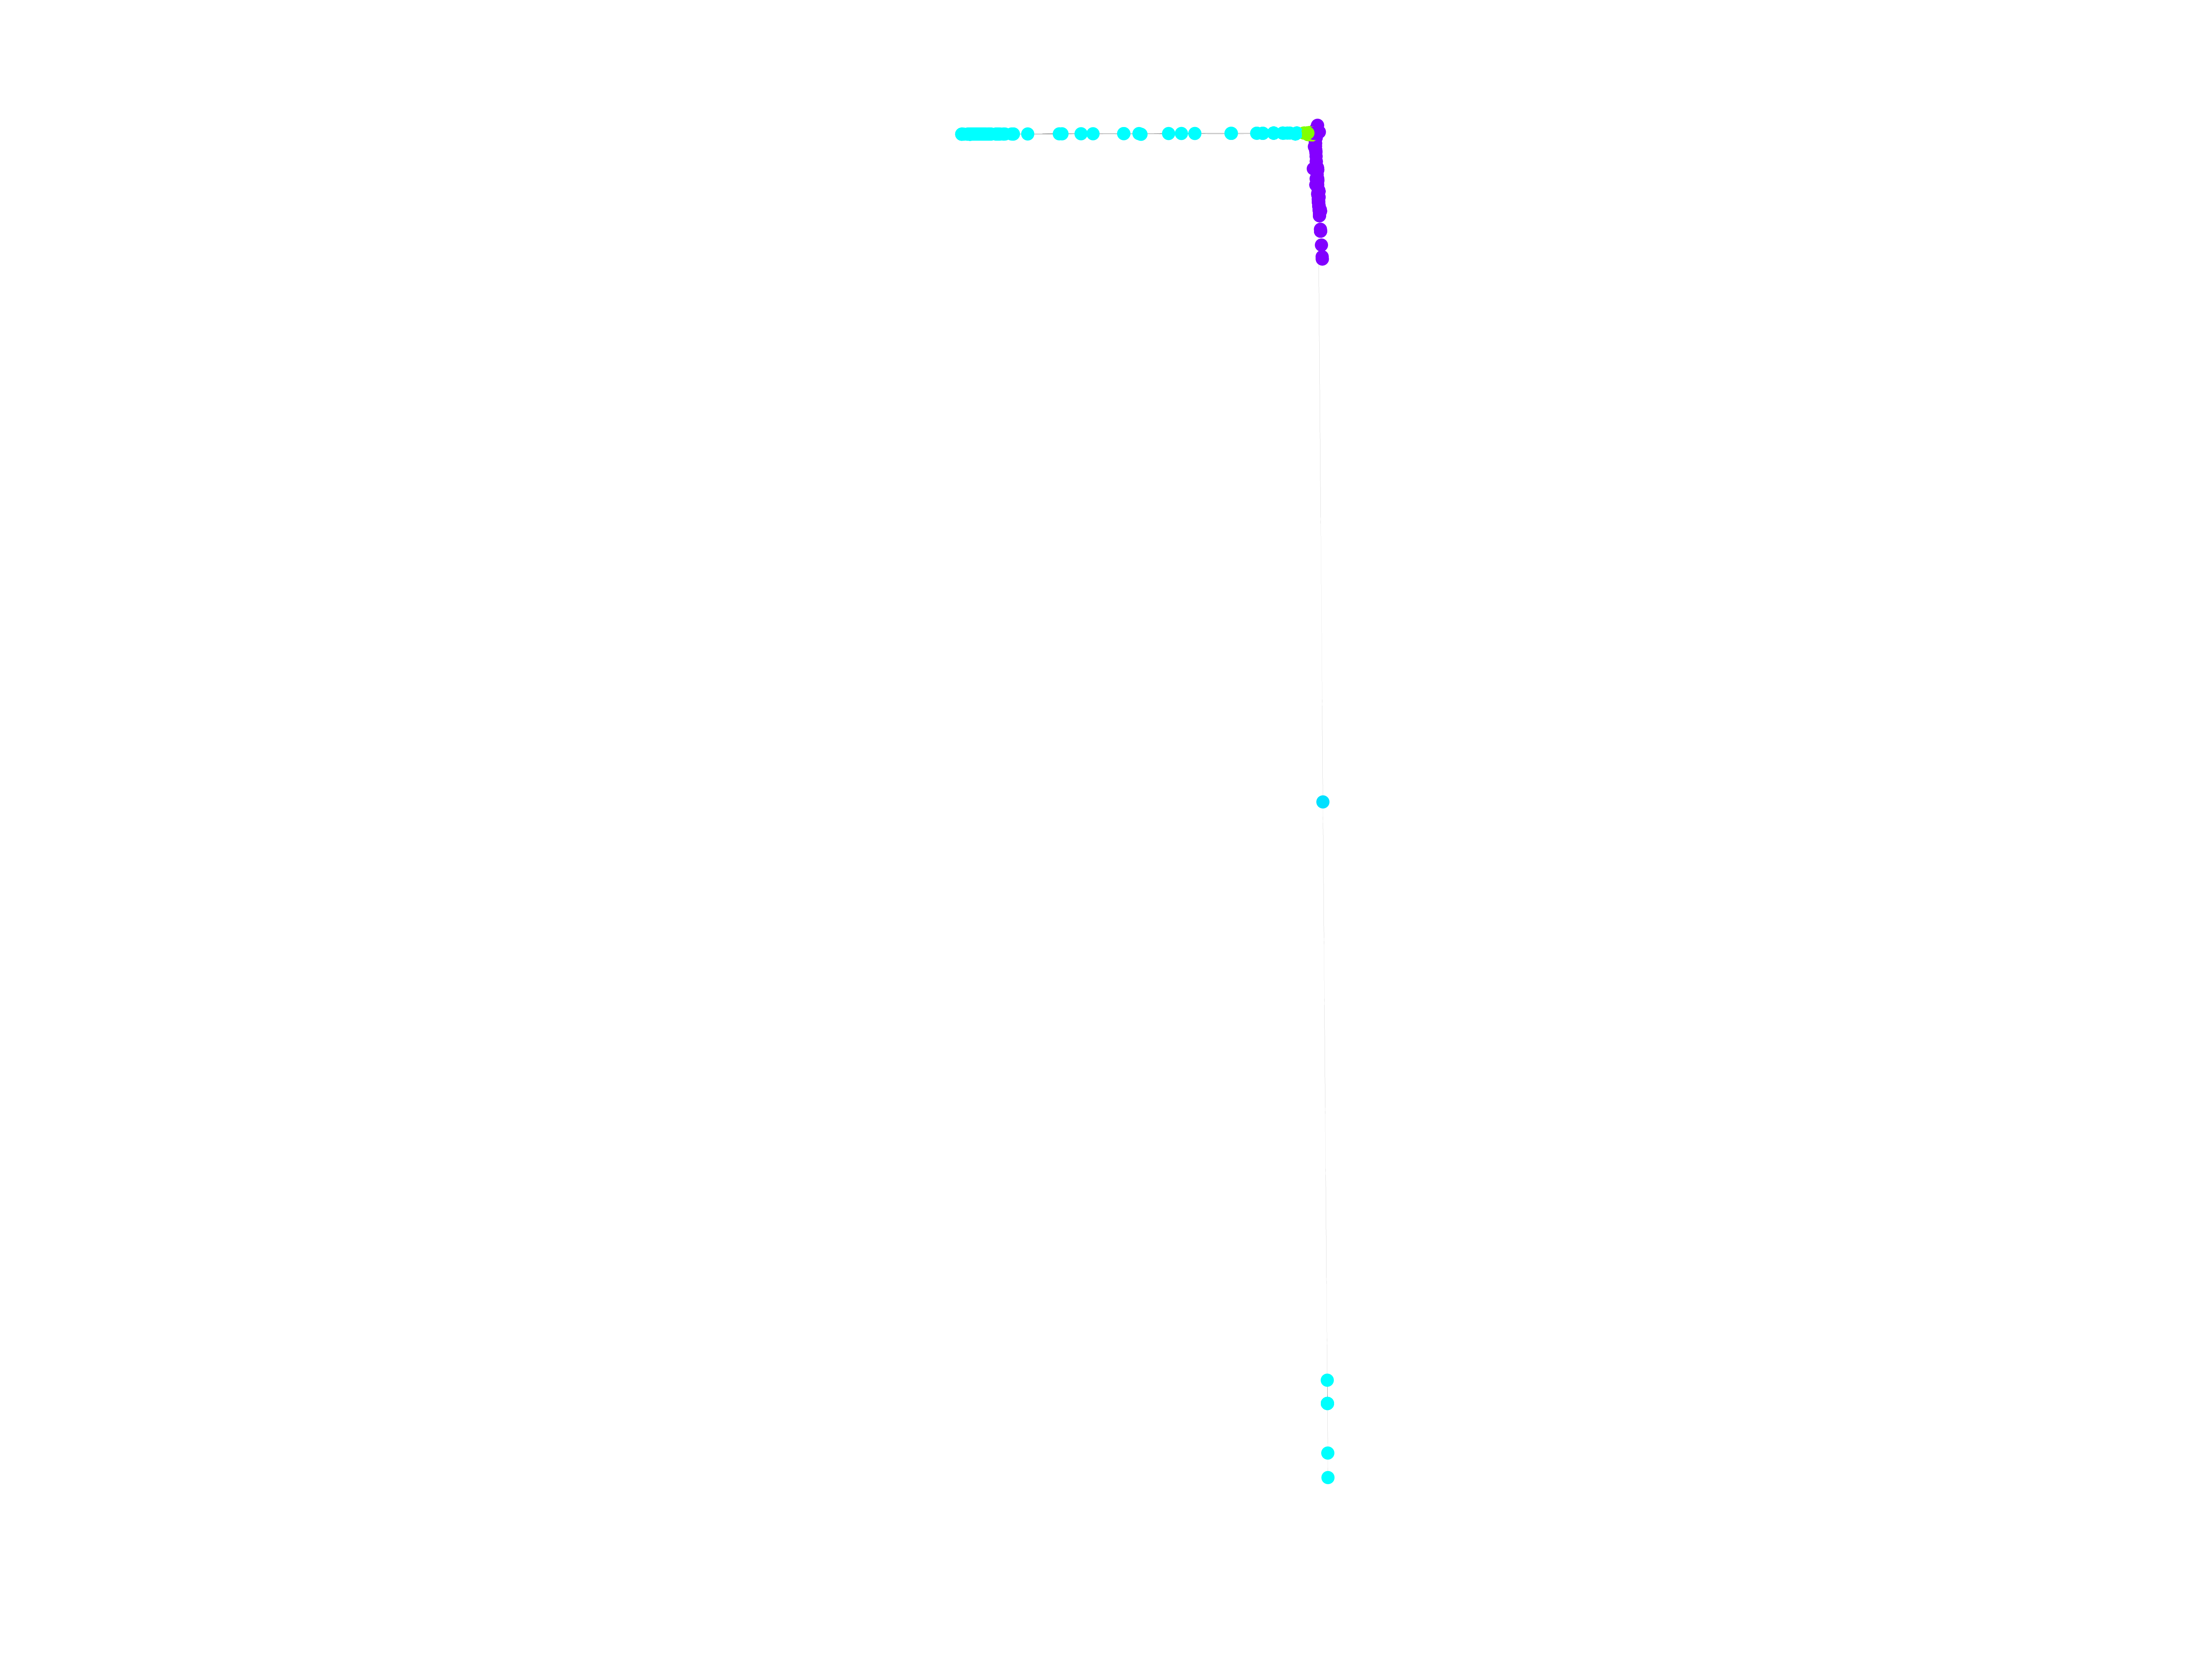
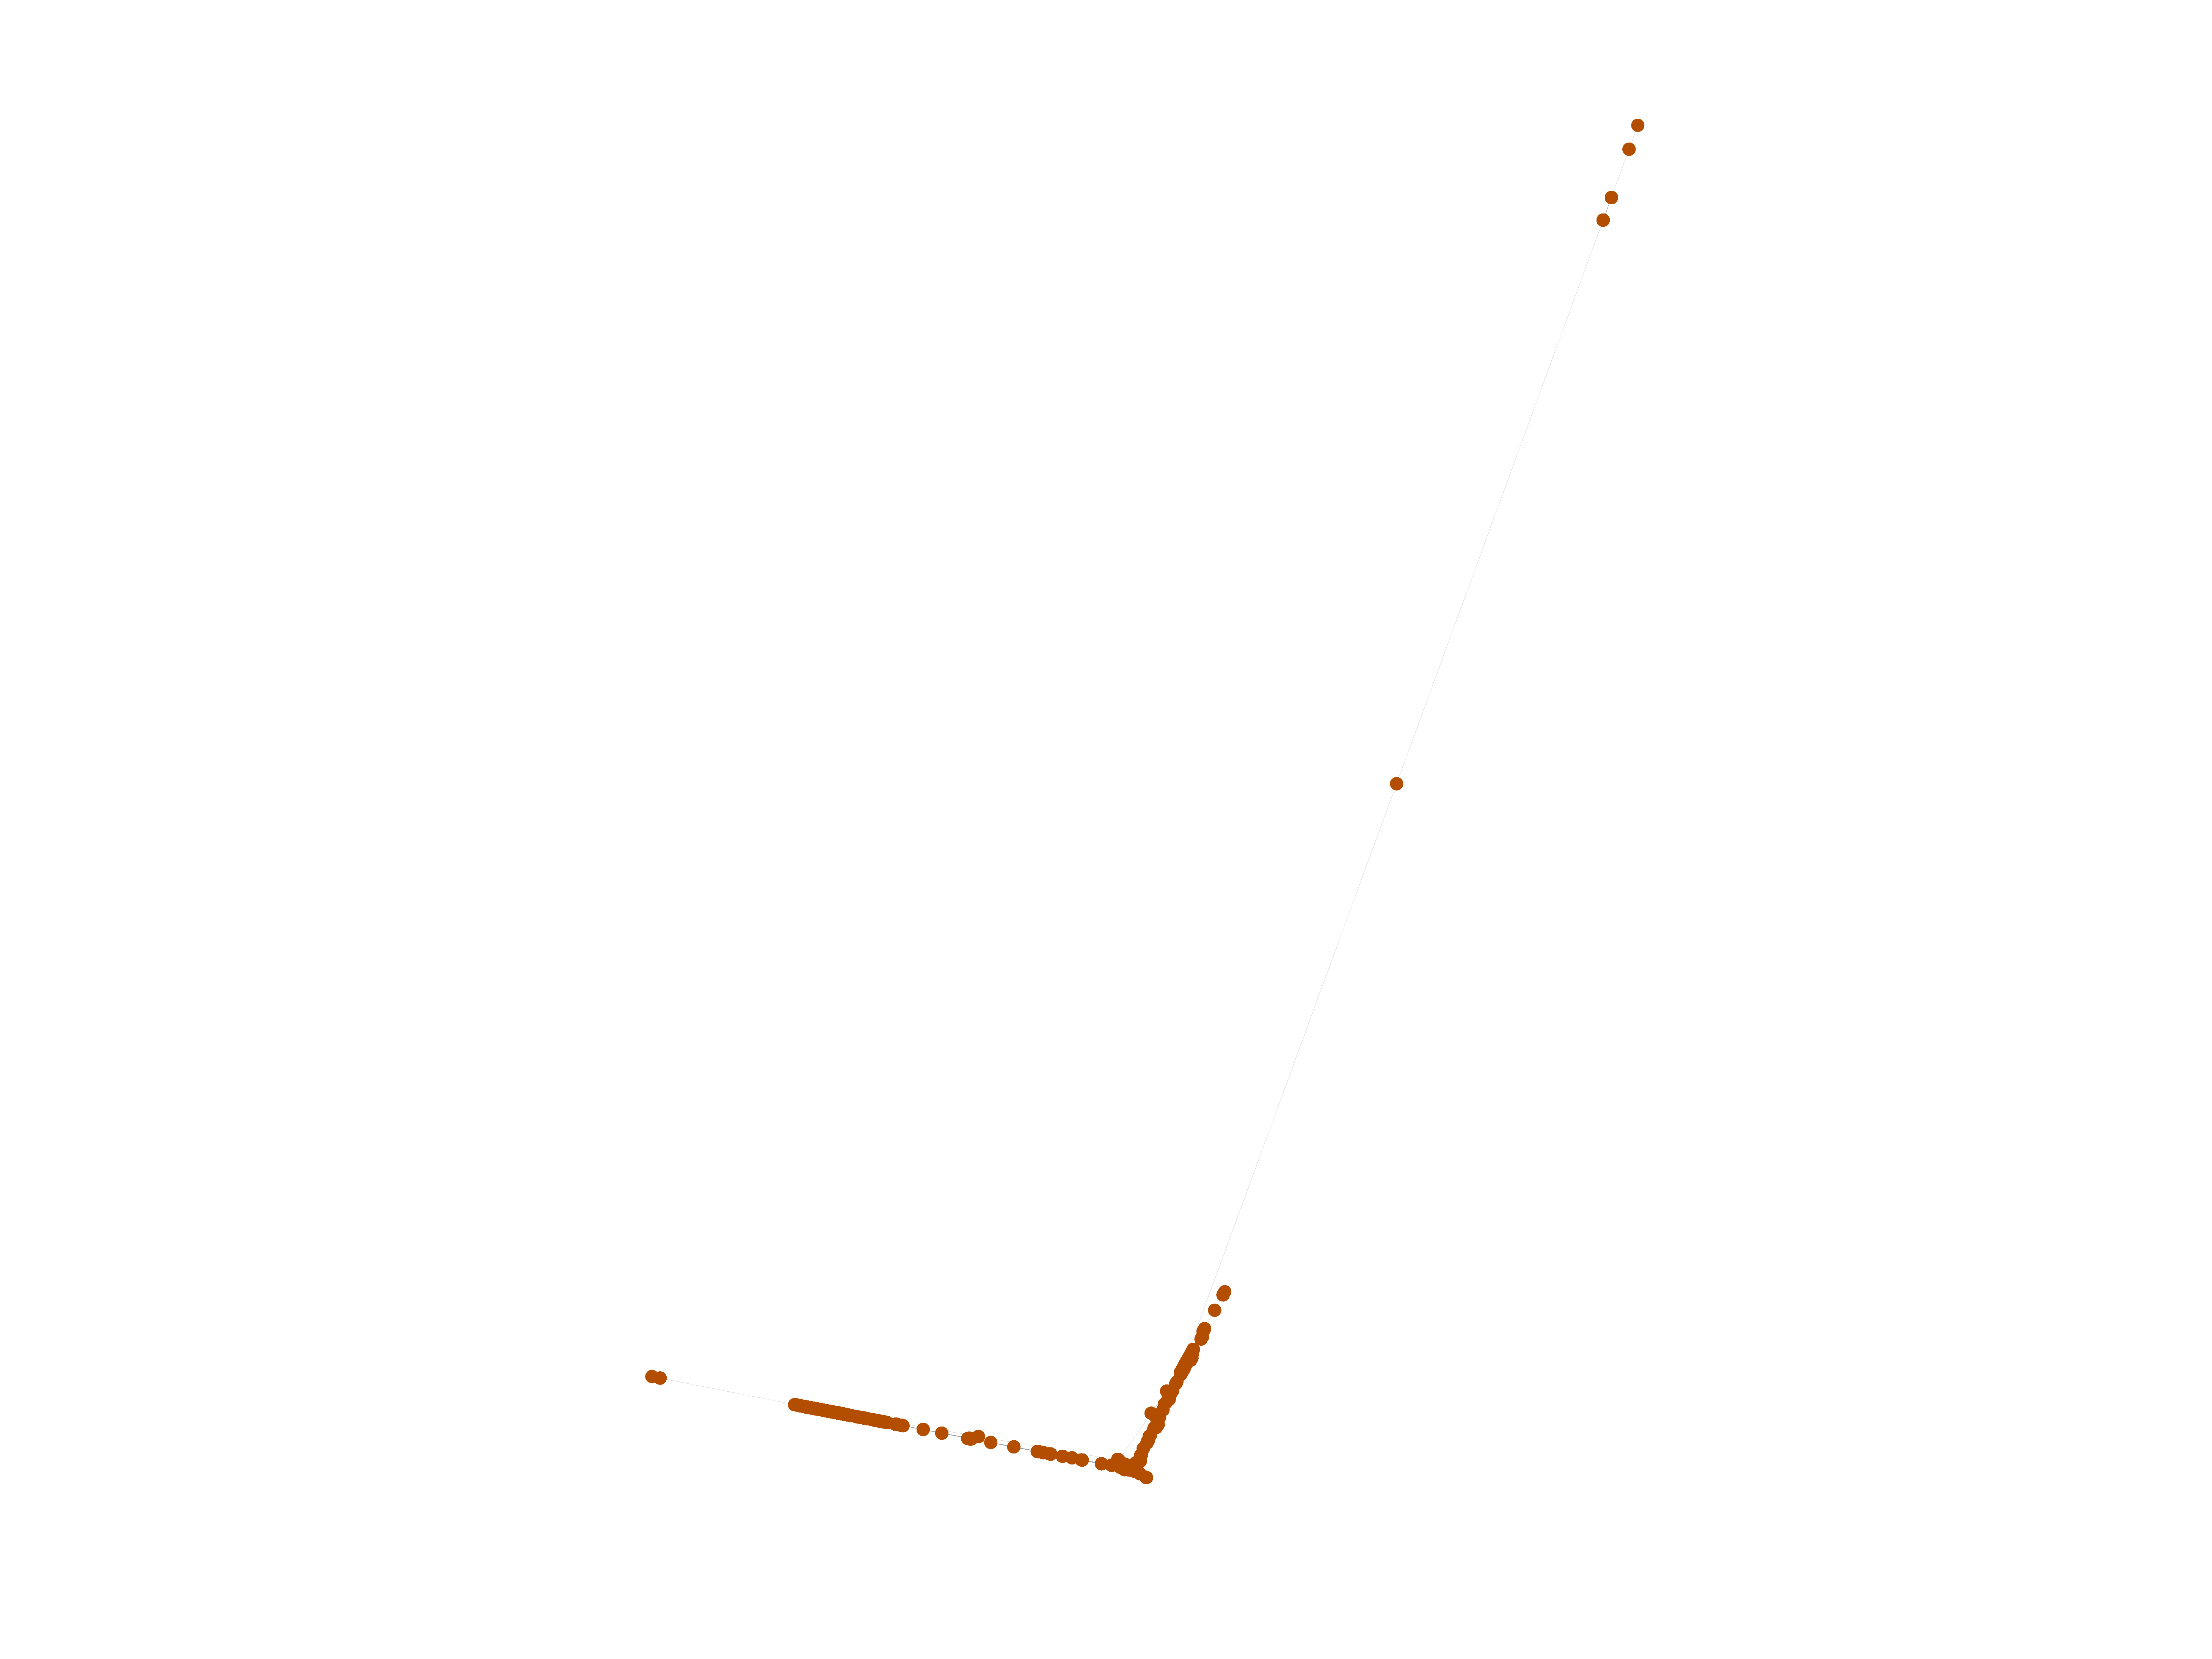
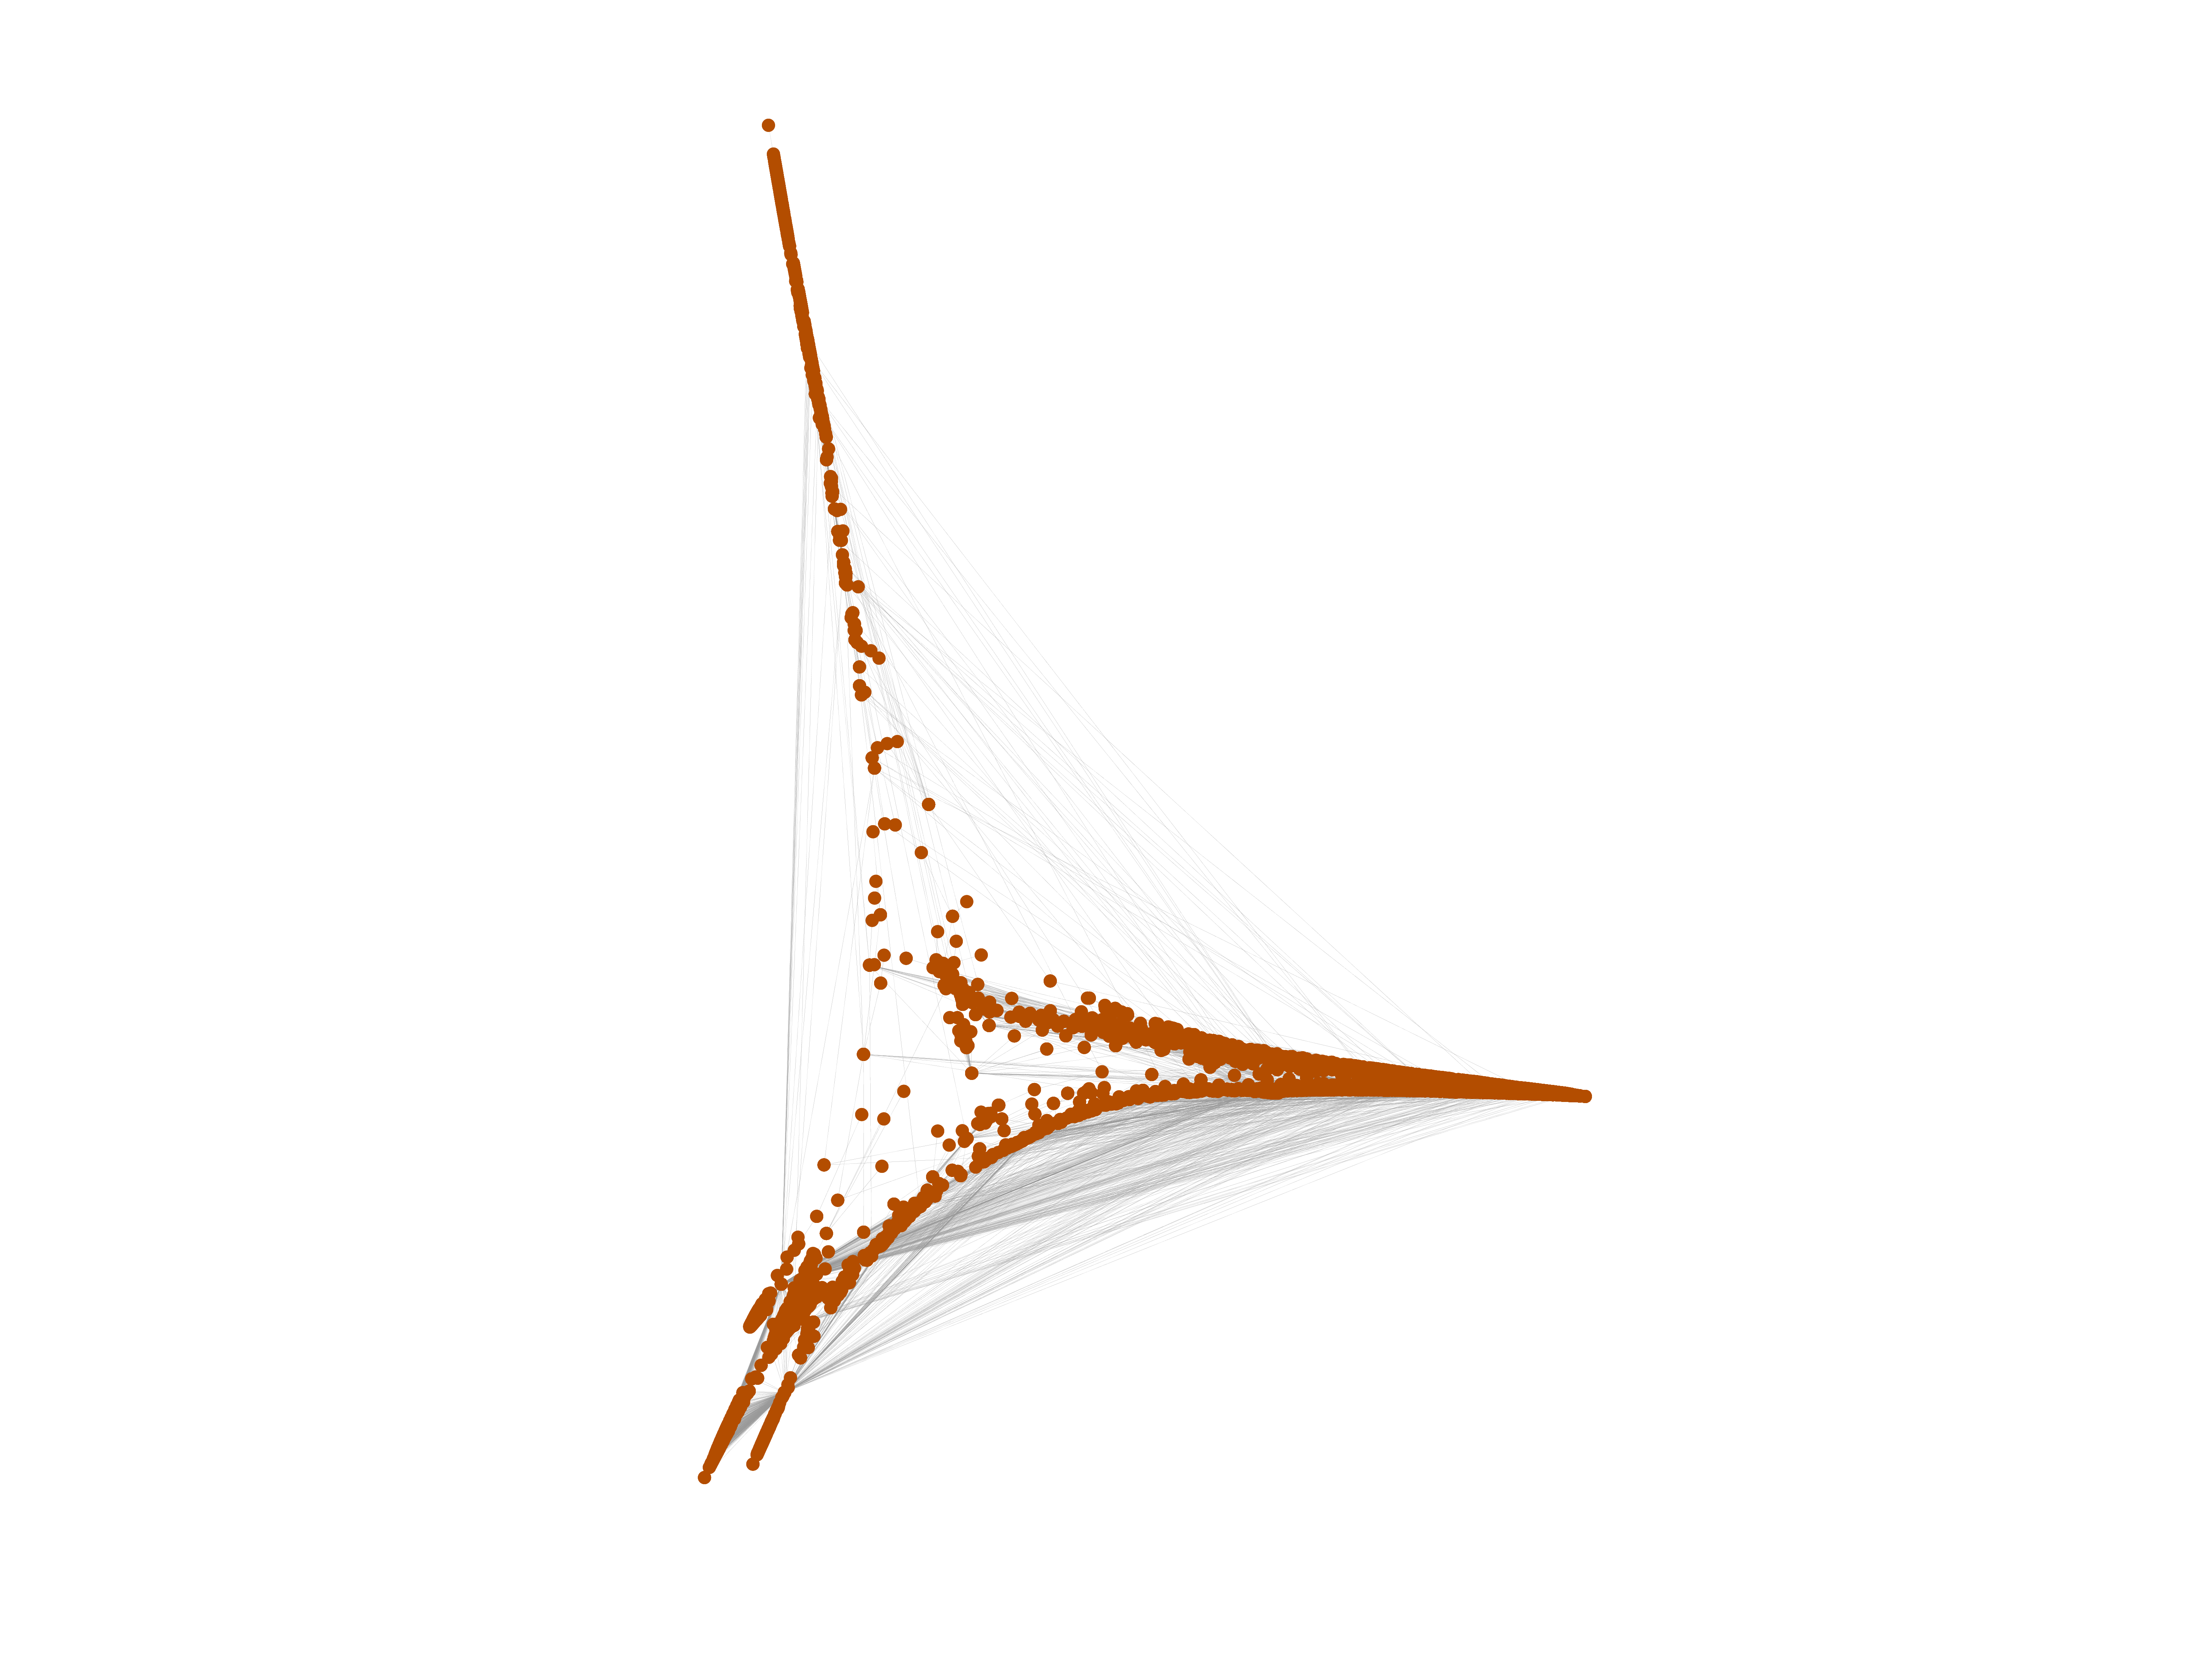
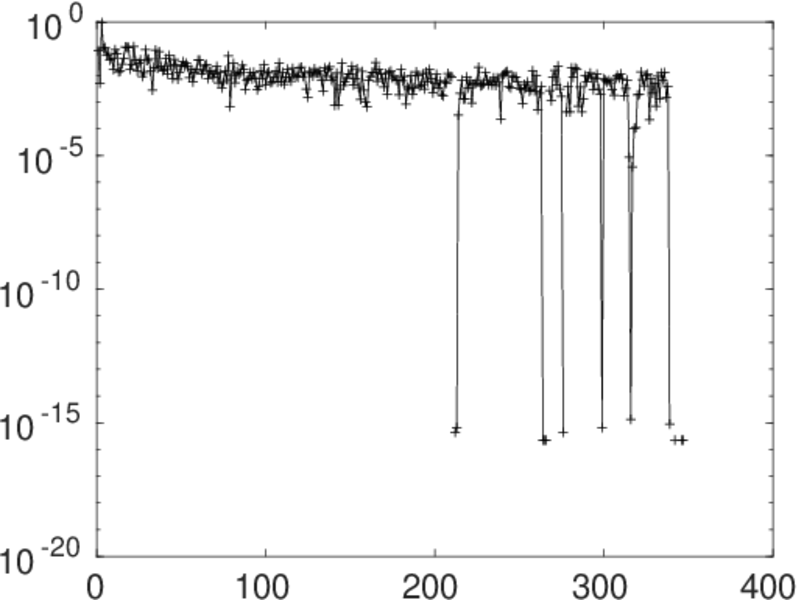
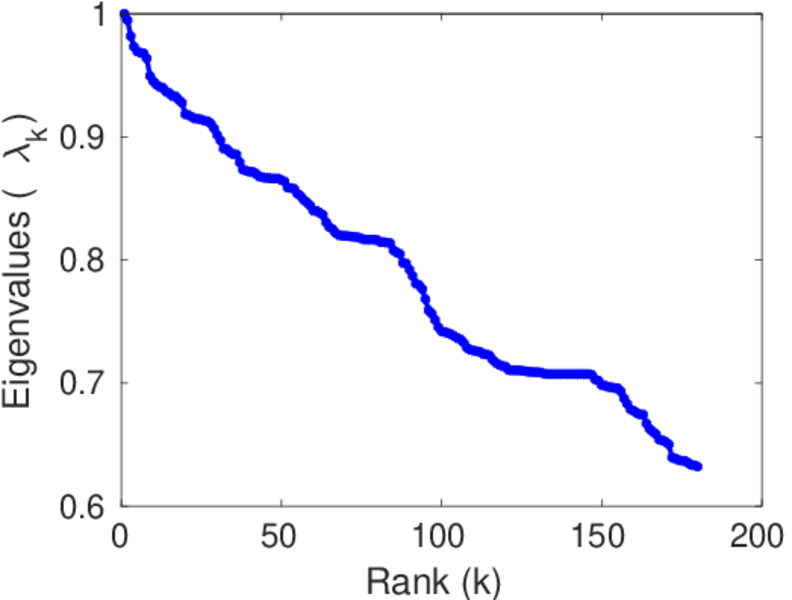
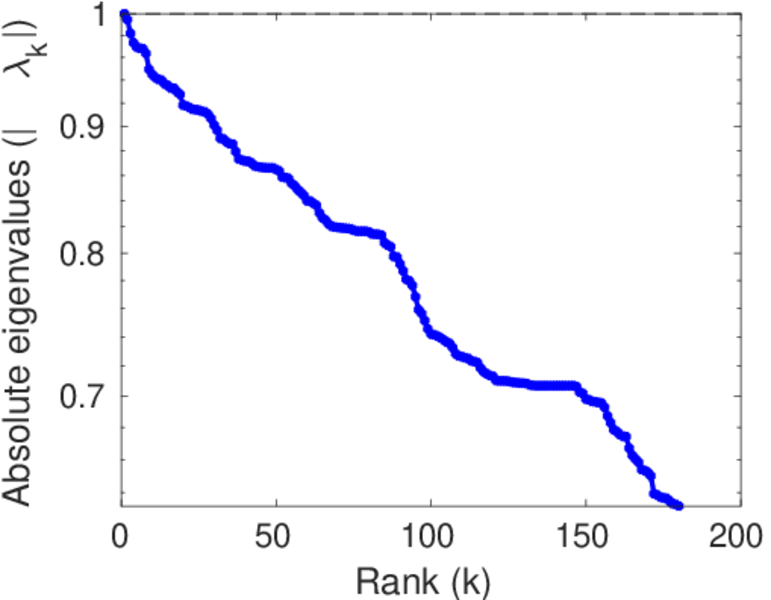
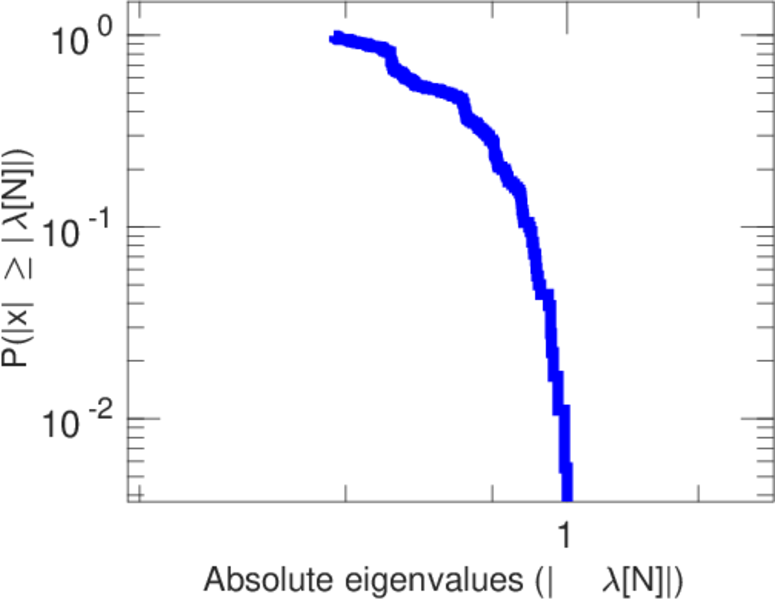
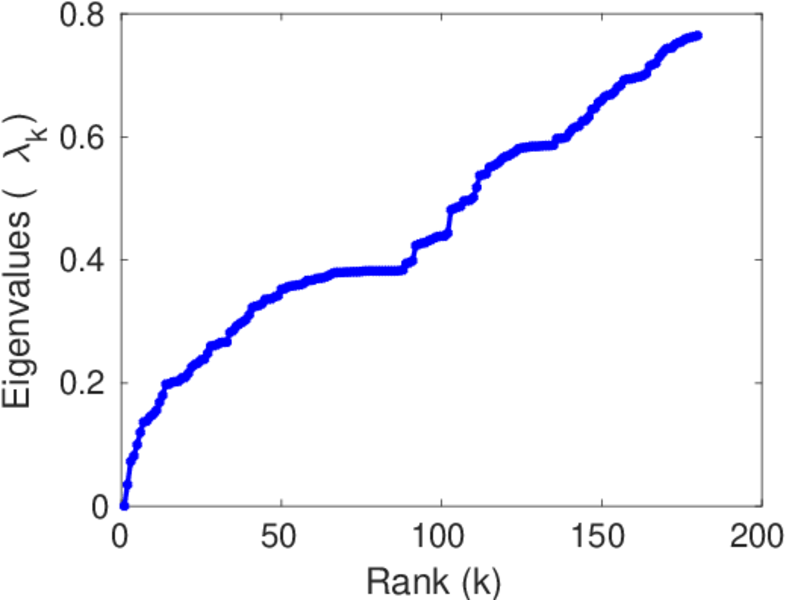
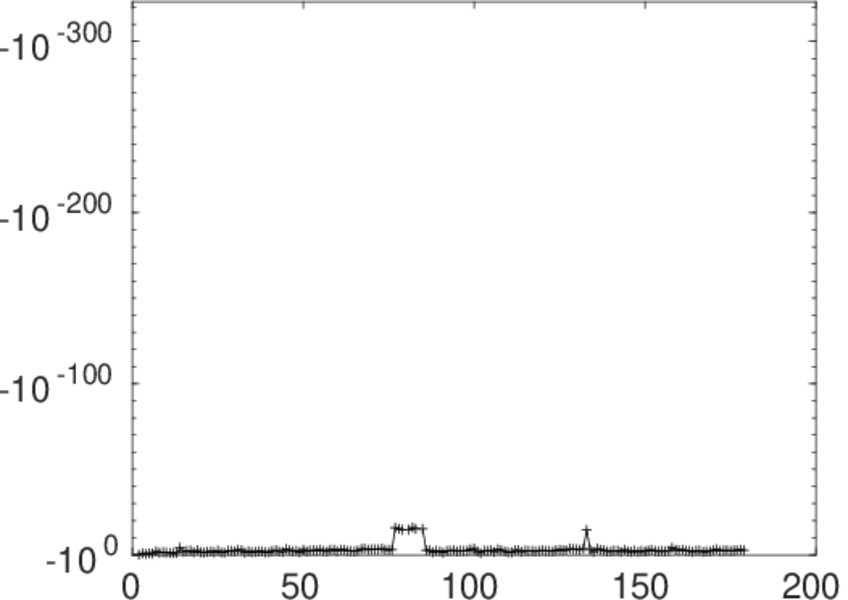
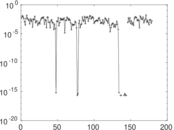
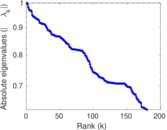
Matrix decompositions plots


Downloads
References
|
[1]
|
Jérôme Kunegis.
KONECT – The Koblenz Network Collection.
In Proc. Int. Conf. on World Wide Web Companion, pages
1343–1350, 2013.
[ http ]
|
|
[2]
|
Wikimedia Foundation.
Wikimedia downloads.
http://dumps.wikimedia.org/, January 2010.
|
 KONECT ‣ Networks ‣
Buy Me a Coffee
KONECT ‣ Networks ‣
Buy Me a Coffee