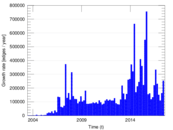
Wikipedia edits (te)
This is the bipartite edit network of the Telugu Wikipedia. It contains users
and pages from the Telugu Wikipedia, connected by edit events. Each edge
represents an edit. The dataset includes the timestamp of each edit.
Metadata
Statistics
| Size | n = | 232,888
|
| Left size | n1 = | 15,537
|
| Right size | n2 = | 217,351
|
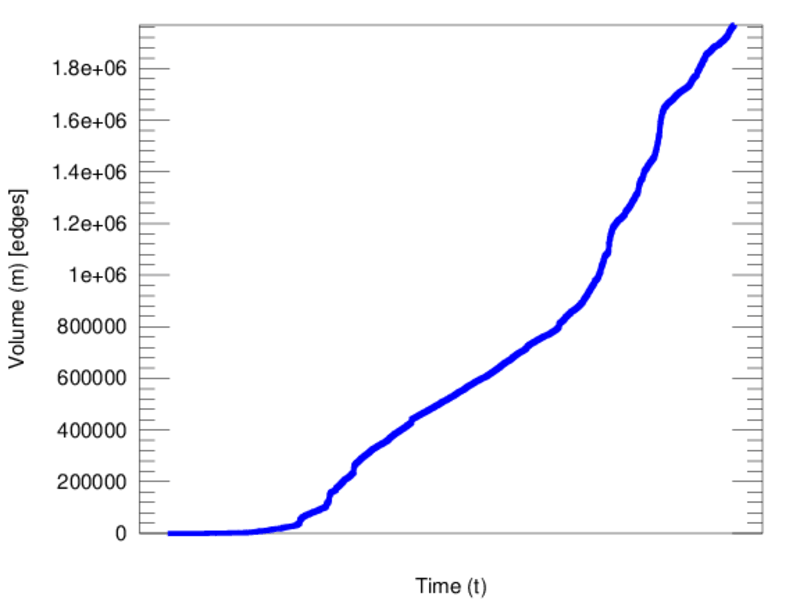
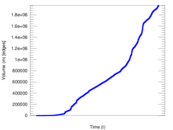
| Volume | m = | 1,968,229
|
| Unique edge count | m̿ = | 834,522
|
| Wedge count | s = | 10,632,925,298
|
| Claw count | z = | 161,830,353,852,854
|
| Square count | q = | 11,053,080,404
|
| 4-Tour count | T4 = | 130,958,018,032
|
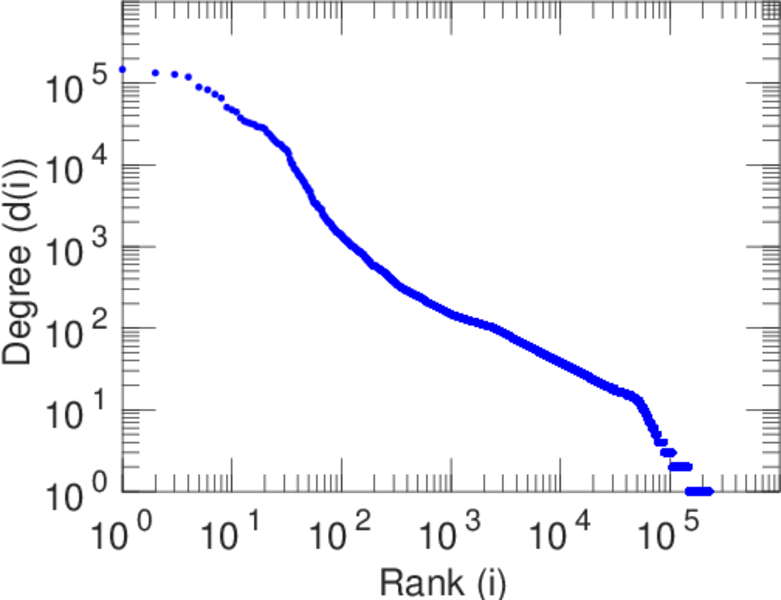
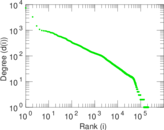
| Maximum degree | dmax = | 147,261
|
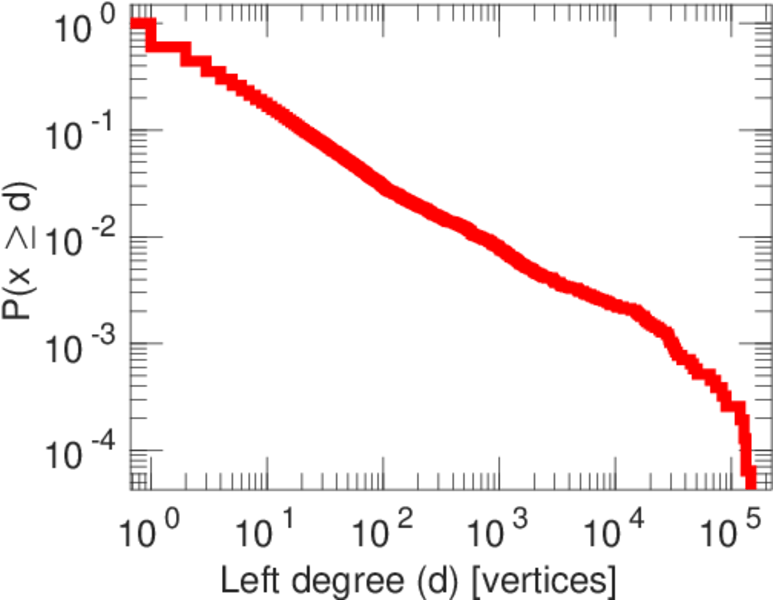
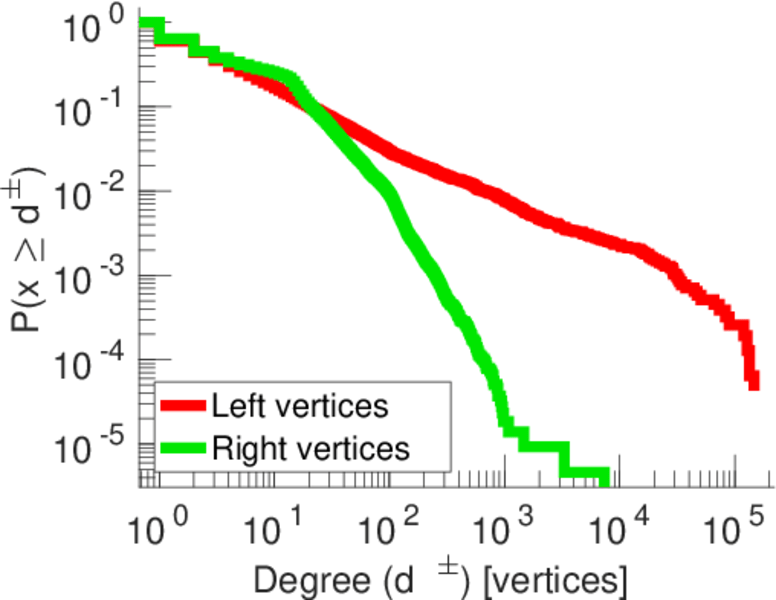
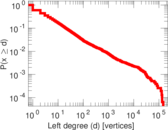
| Maximum left degree | d1max = | 147,261
|
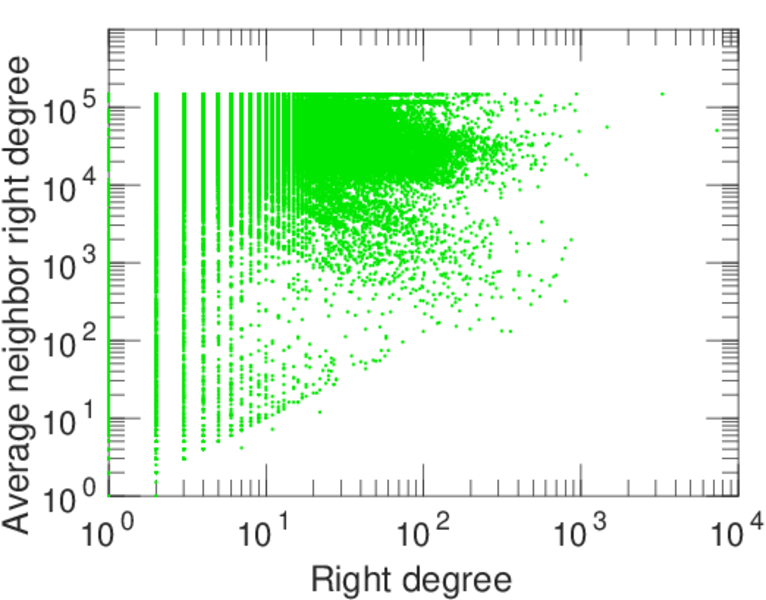
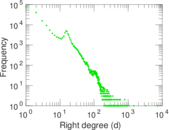
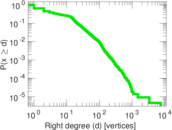
| Maximum right degree | d2max = | 7,345
|
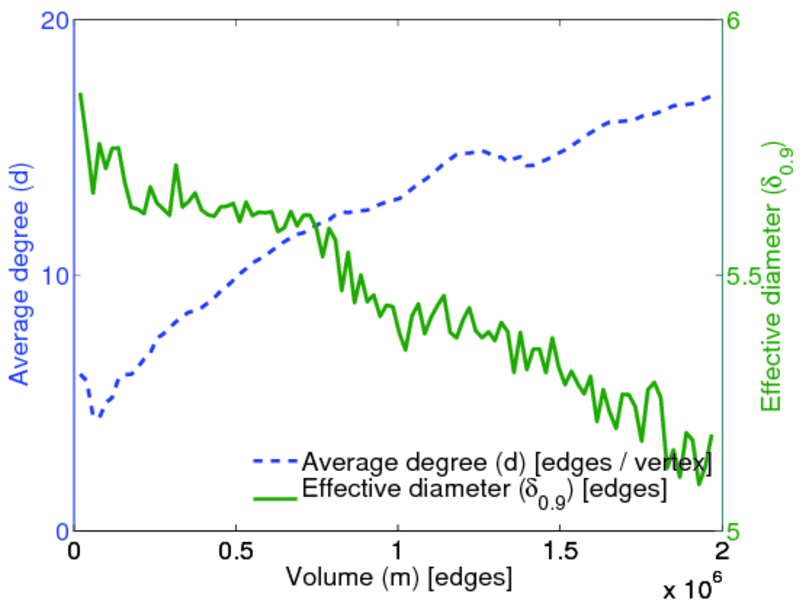
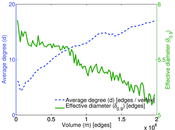
| Average degree | d = | 16.902 8
|
| Average left degree | d1 = | 126.680
|
| Average right degree | d2 = | 9.055 53
|
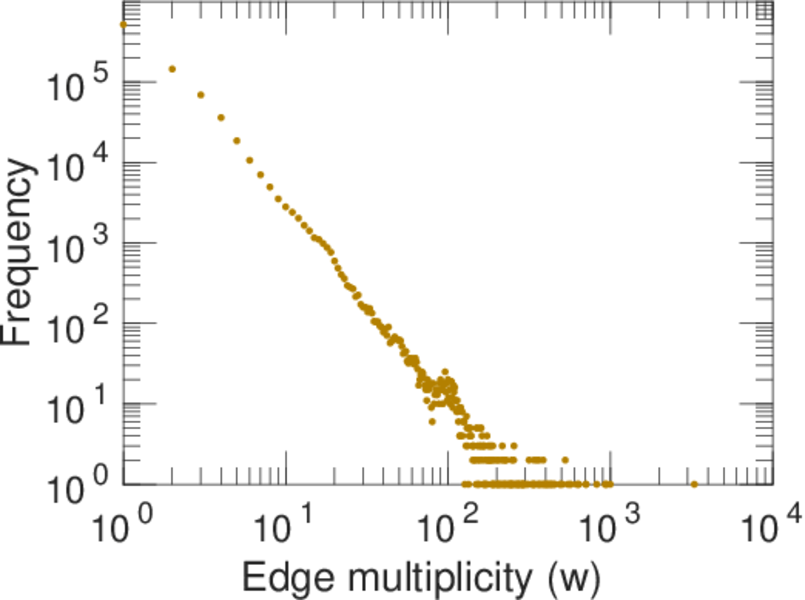
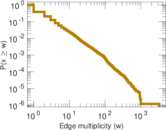
| Average edge multiplicity | m̃ = | 2.358 51
|
| Size of LCC | N = | 229,573
|
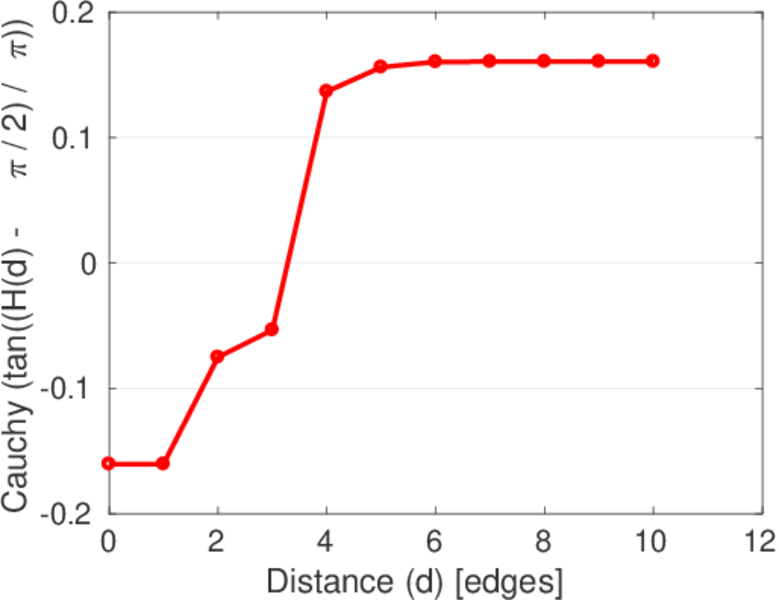
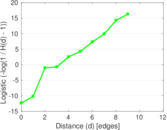
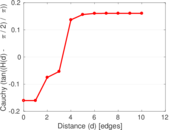
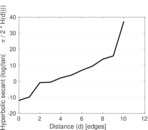
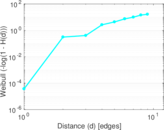
| Diameter | δ = | 12
|
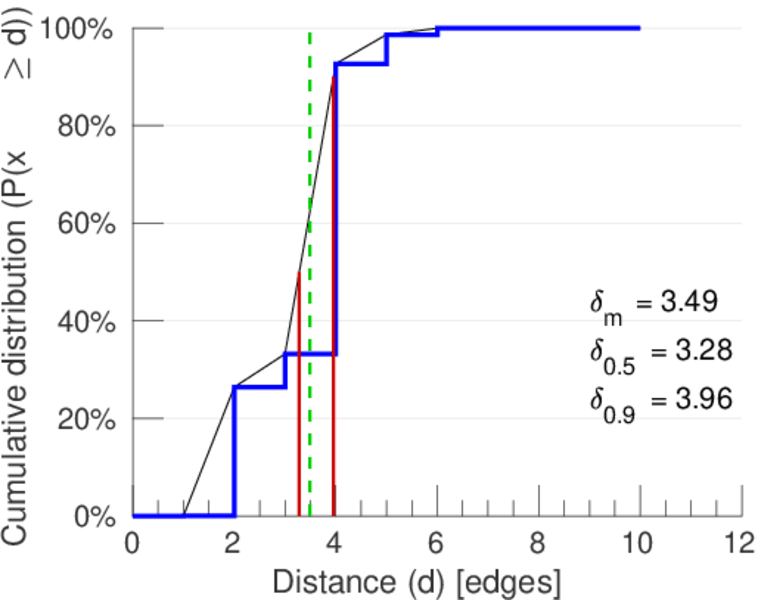
| 50-Percentile effective diameter | δ0.5 = | 3.282 67
|
| 90-Percentile effective diameter | δ0.9 = | 3.955 20
|
| Median distance | δM = | 4
|
| Mean distance | δm = | 3.491 73
|
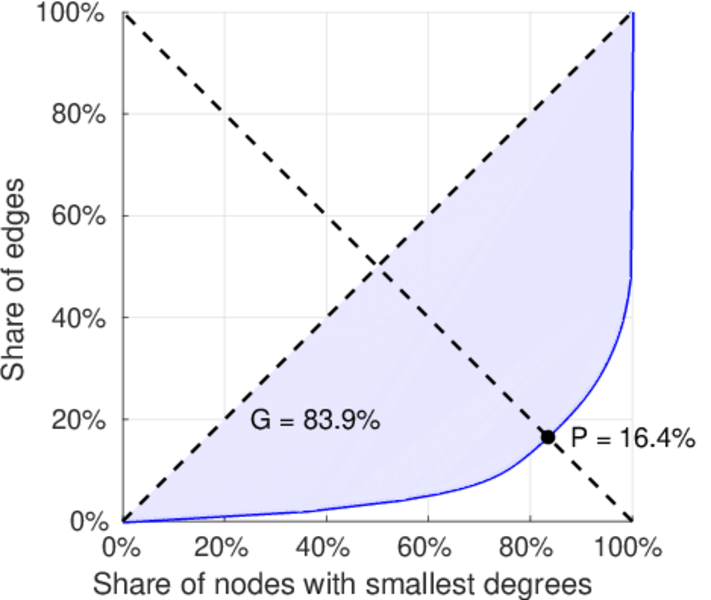
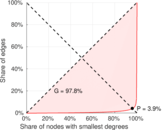
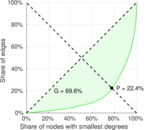
| Gini coefficient | G = | 0.840 475
|
| Balanced inequality ratio | P = | 0.164 487
|
| Left balanced inequality ratio | P1 = | 0.039 363 3
|
| Right balanced inequality ratio | P2 = | 0.224 123
|
| Relative edge distribution entropy | Her = | 0.713 902
|
| Power law exponent | γ = | 2.220 65
|
| Tail power law exponent | γt = | 2.681 00
|
| Tail power law exponent with p | γ3 = | 2.681 00
|
| p-value | p = | 0.000 00
|
| Left tail power law exponent with p | γ3,1 = | 1.871 00
|
| Left p-value | p1 = | 0.000 00
|
| Right tail power law exponent with p | γ3,2 = | 3.041 00
|
| Right p-value | p2 = | 0.000 00
|
| Degree assortativity | ρ = | −0.307 328
|
| Degree assortativity p-value | pρ = | 0.000 00
|
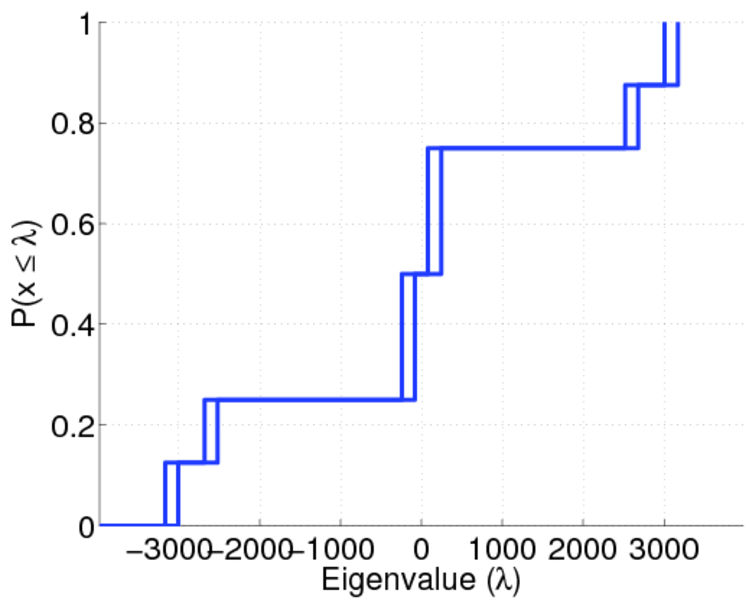
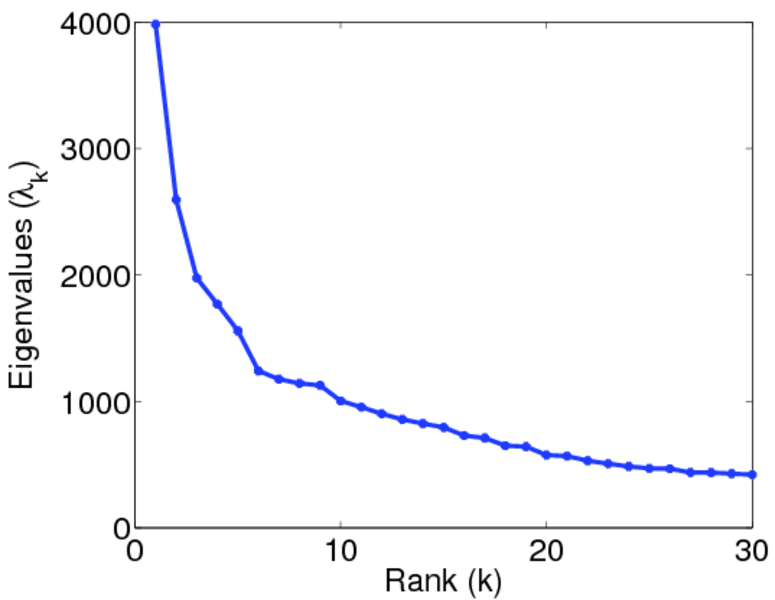
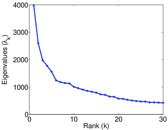
| Spectral norm | α = | 3,983.13
|
| Algebraic connectivity | a = | 0.111 650
|
| Controllability | C = | 211,738
|
| Relative controllability | Cr = | 0.914 615
|
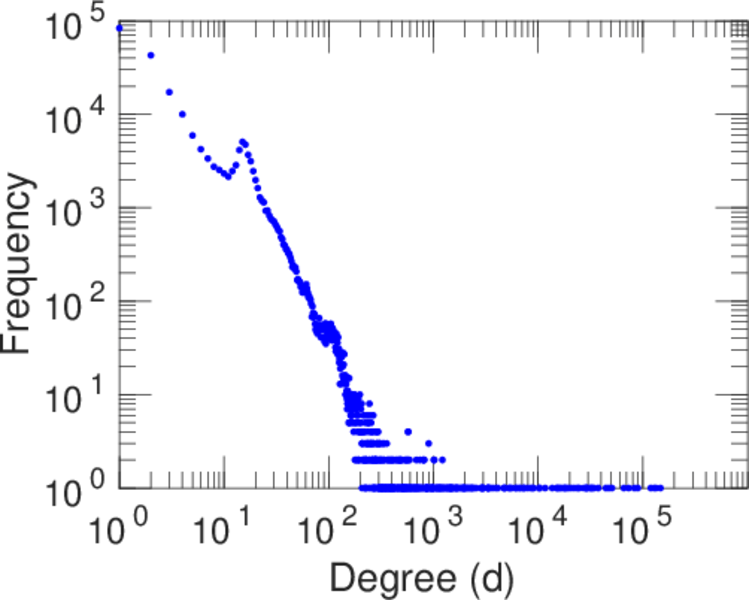
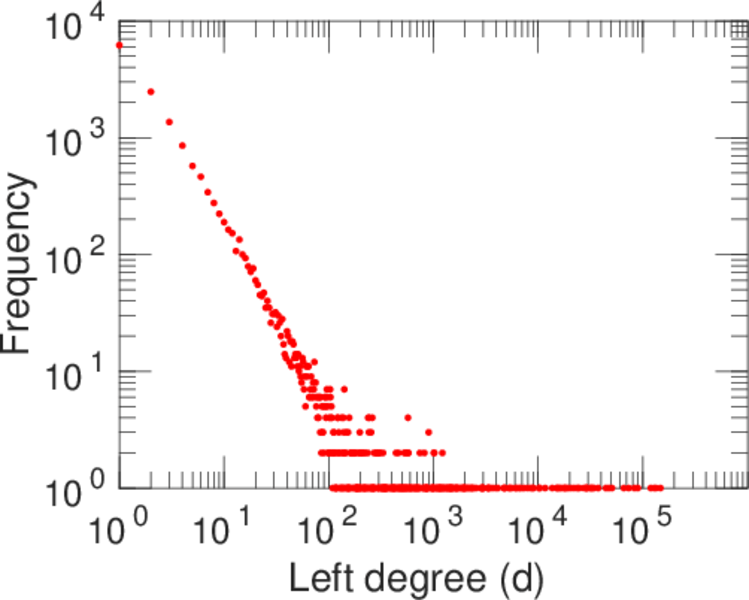
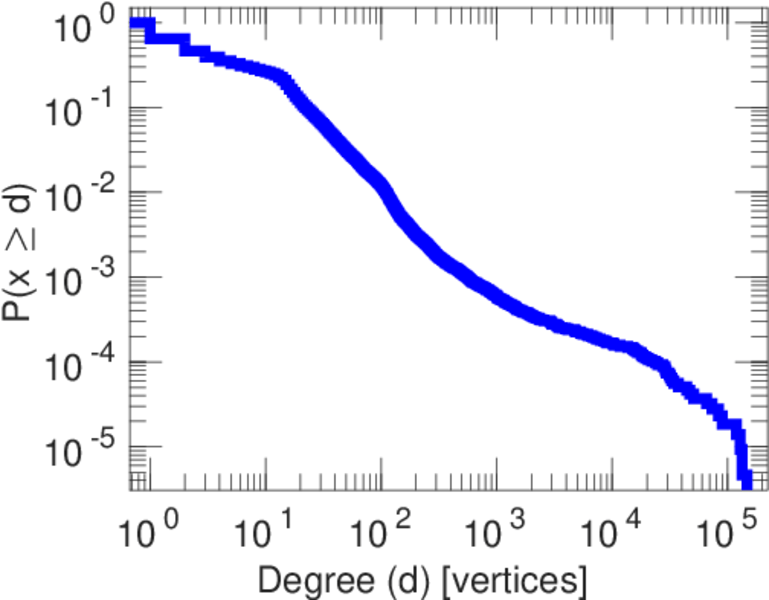
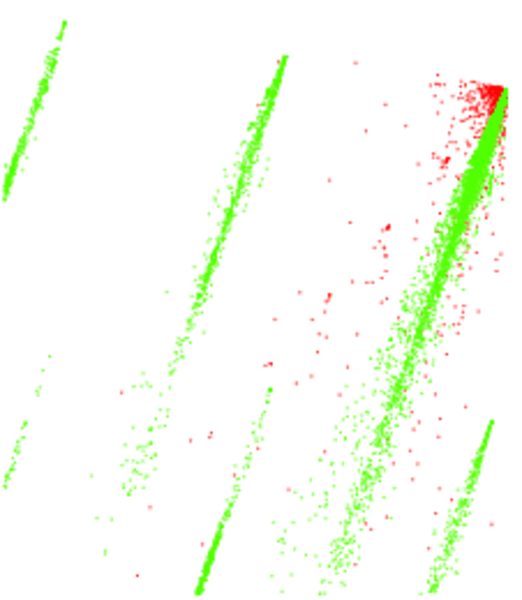
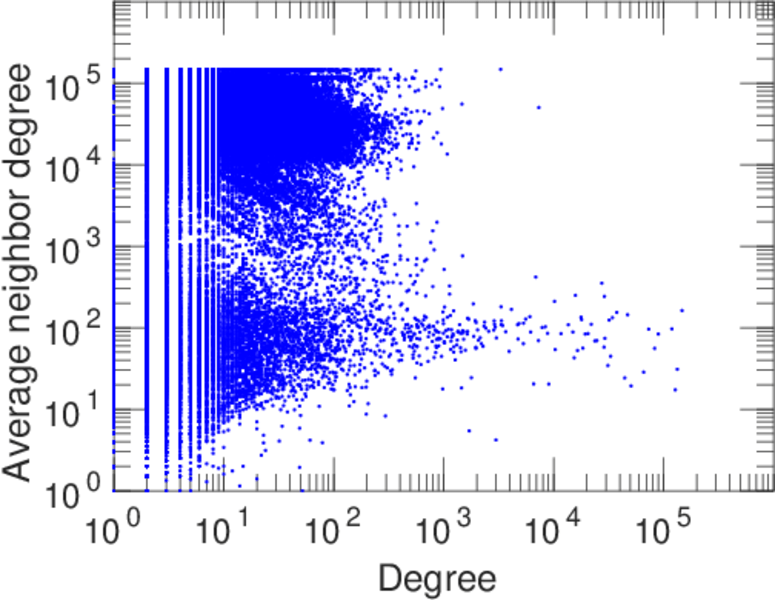
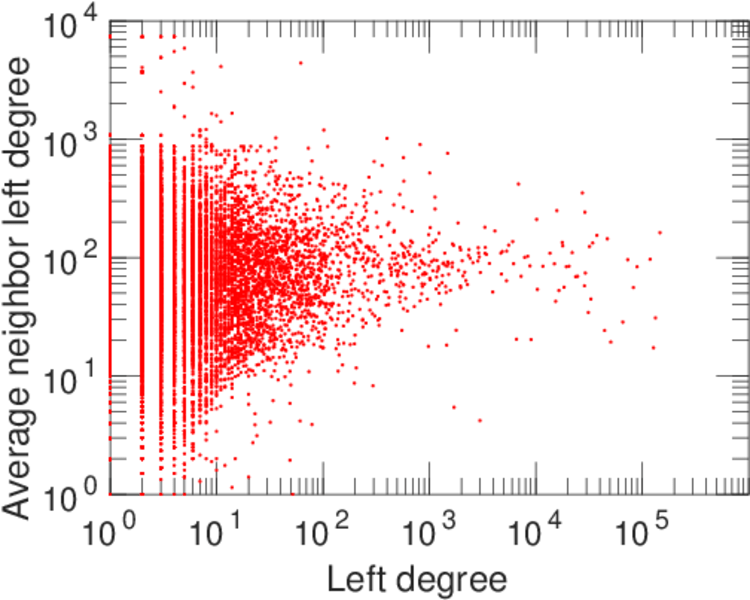
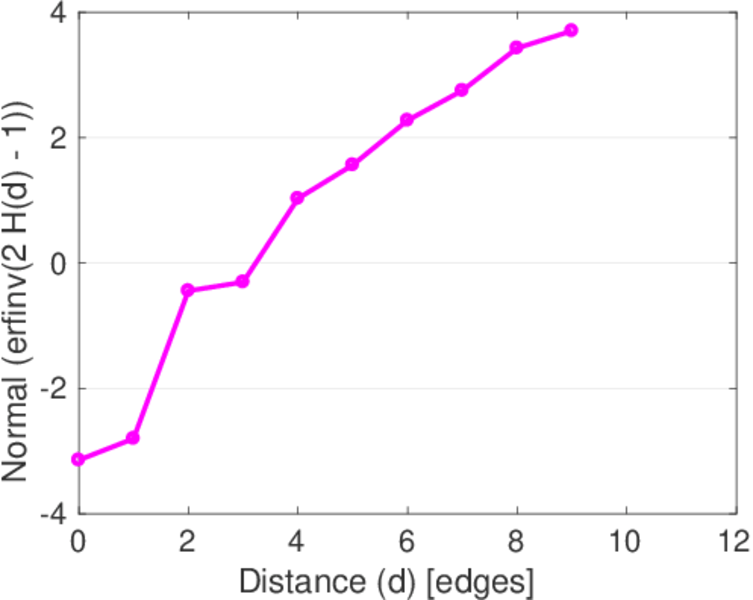
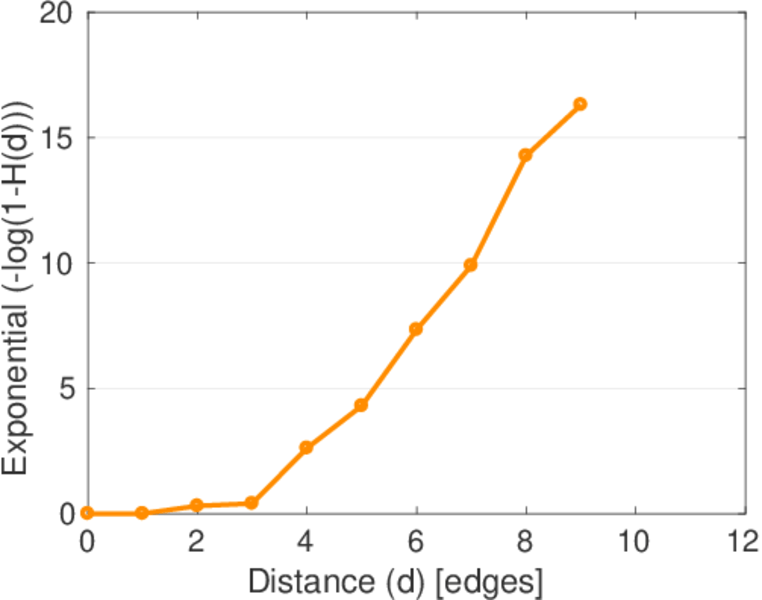
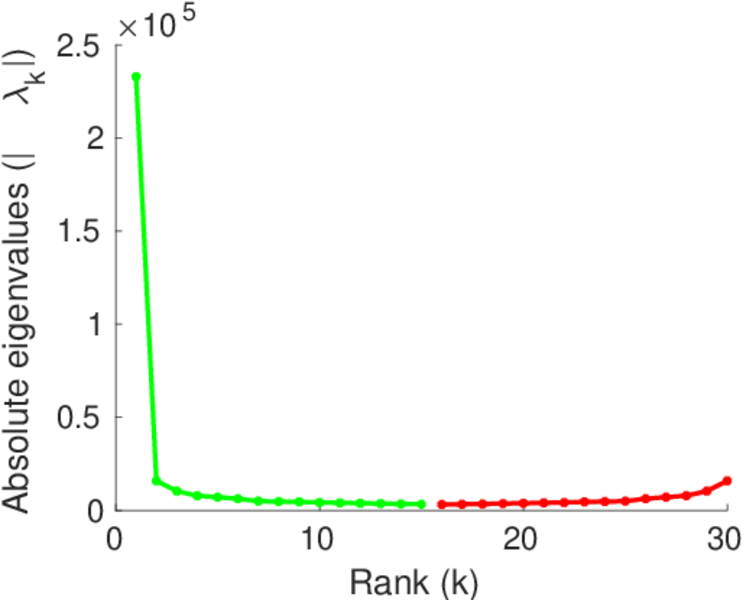
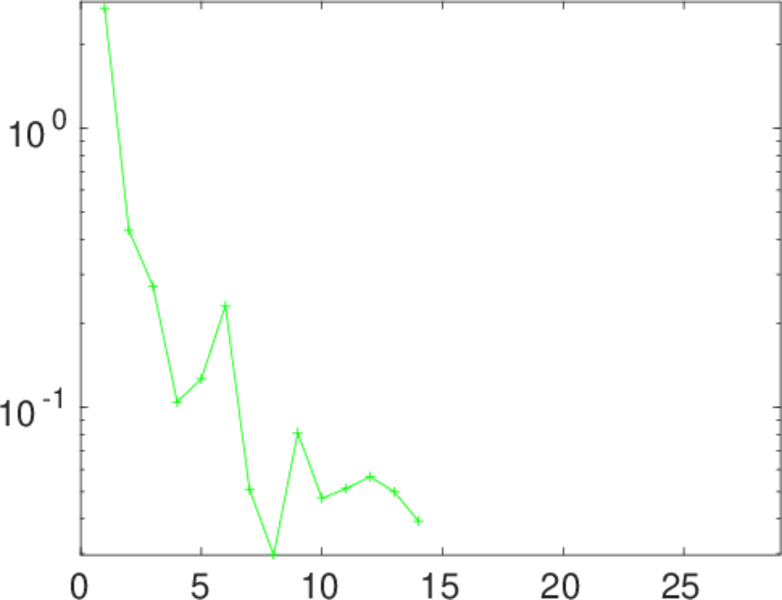
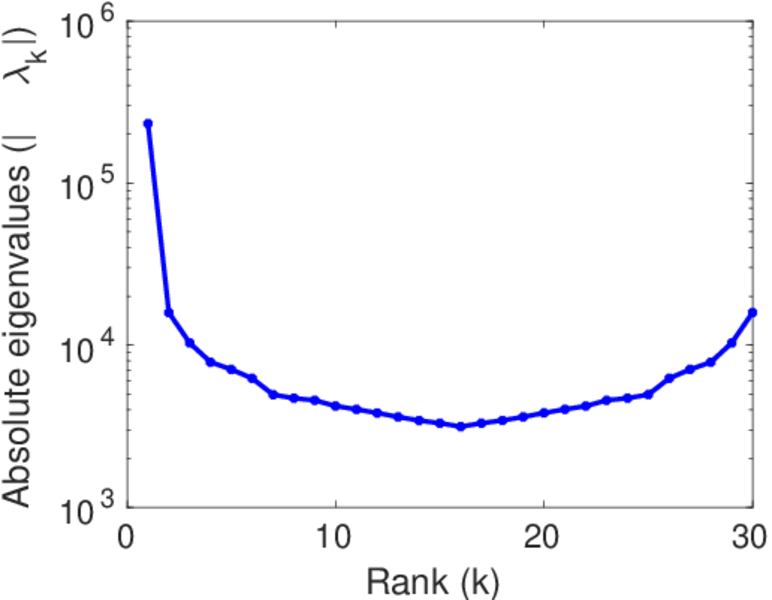
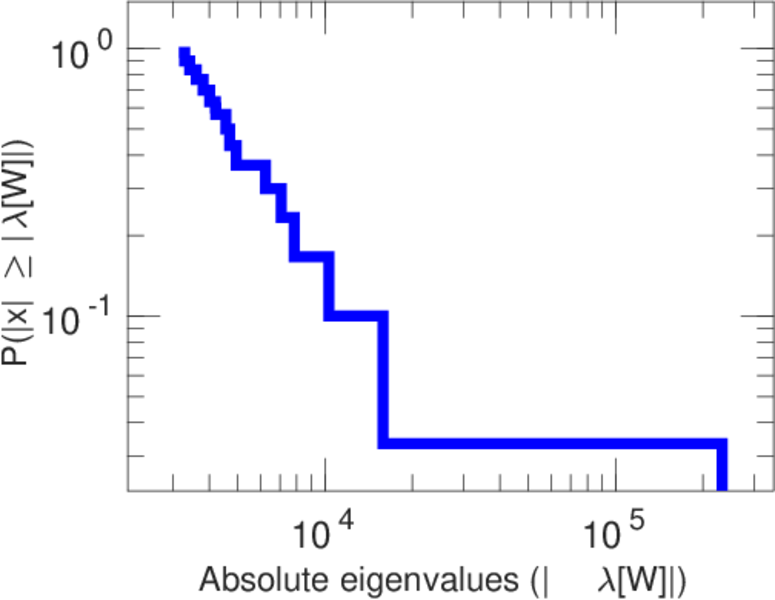
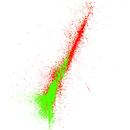
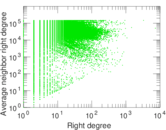
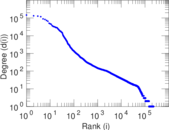
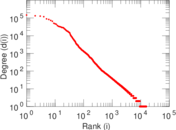
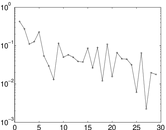
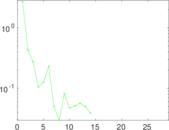
Plots


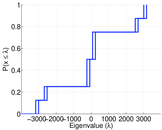
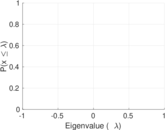

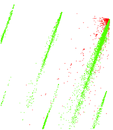


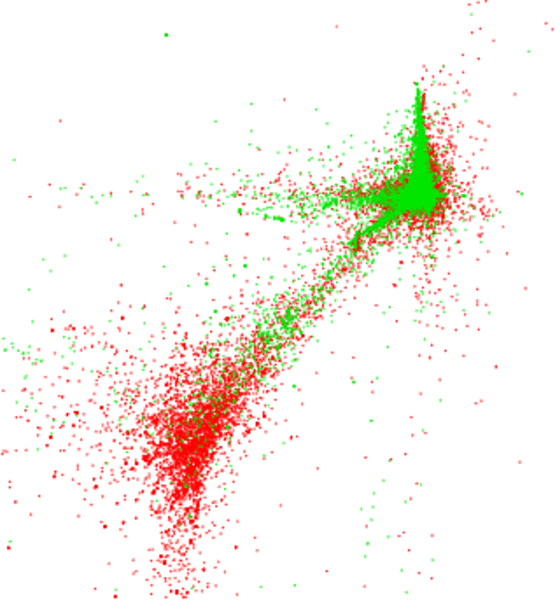
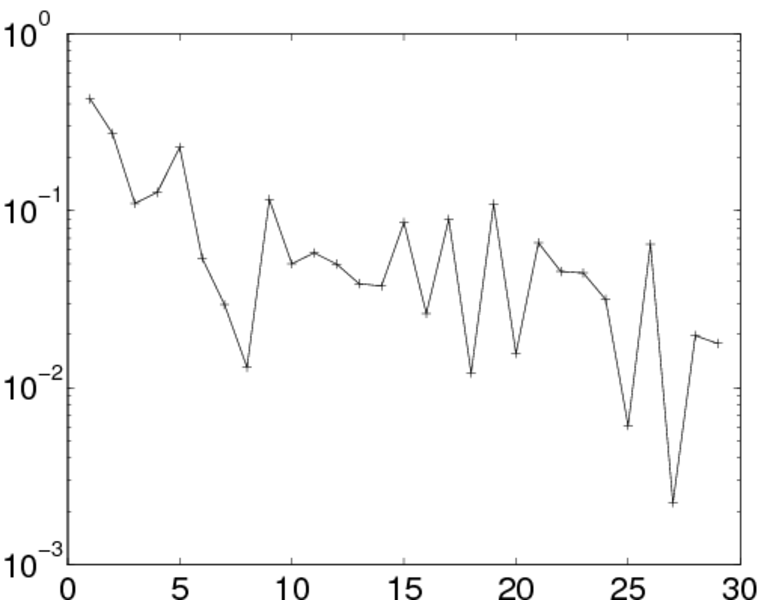
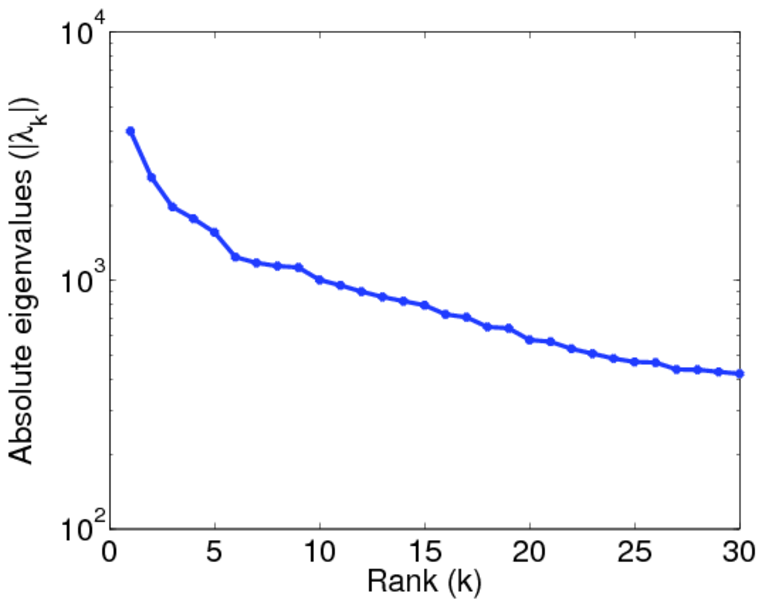
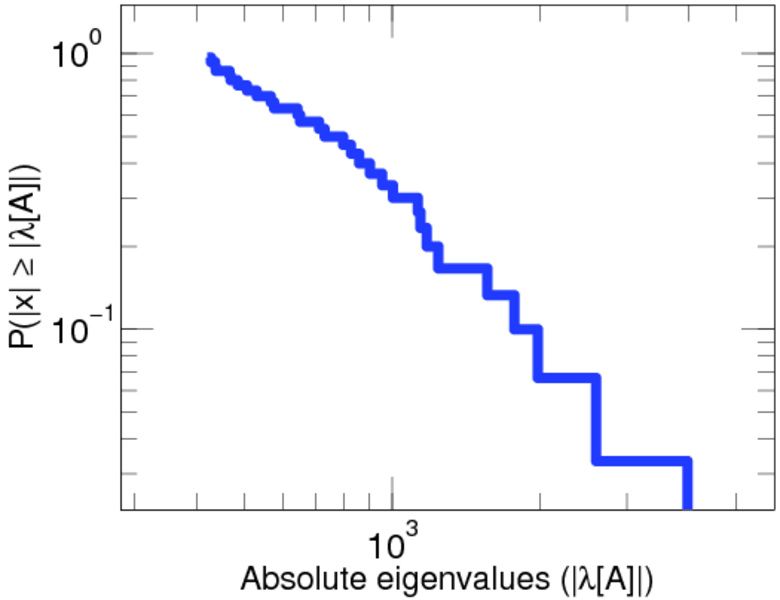
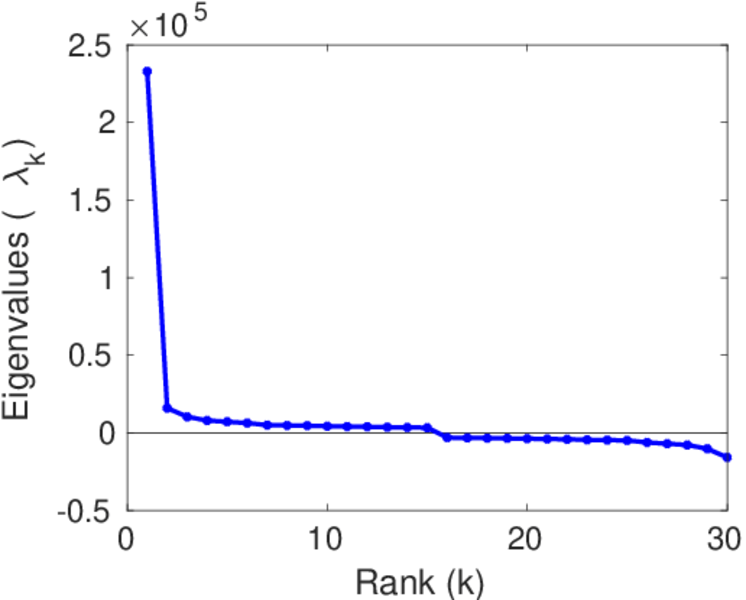
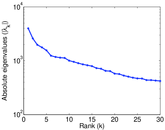
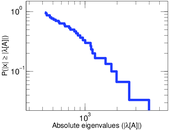
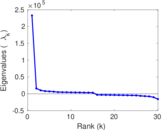
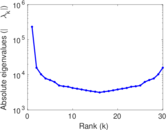
Matrix decompositions plots


Downloads
References
|
[1]
|
Jérôme Kunegis.
KONECT – The Koblenz Network Collection.
In Proc. Int. Conf. on World Wide Web Companion, pages
1343–1350, 2013.
[ http ]
|
|
[2]
|
Wikimedia Foundation.
Wikimedia downloads.
http://dumps.wikimedia.org/, January 2010.
|
 KONECT ‣ Networks ‣
Buy Me a Coffee
KONECT ‣ Networks ‣
Buy Me a Coffee