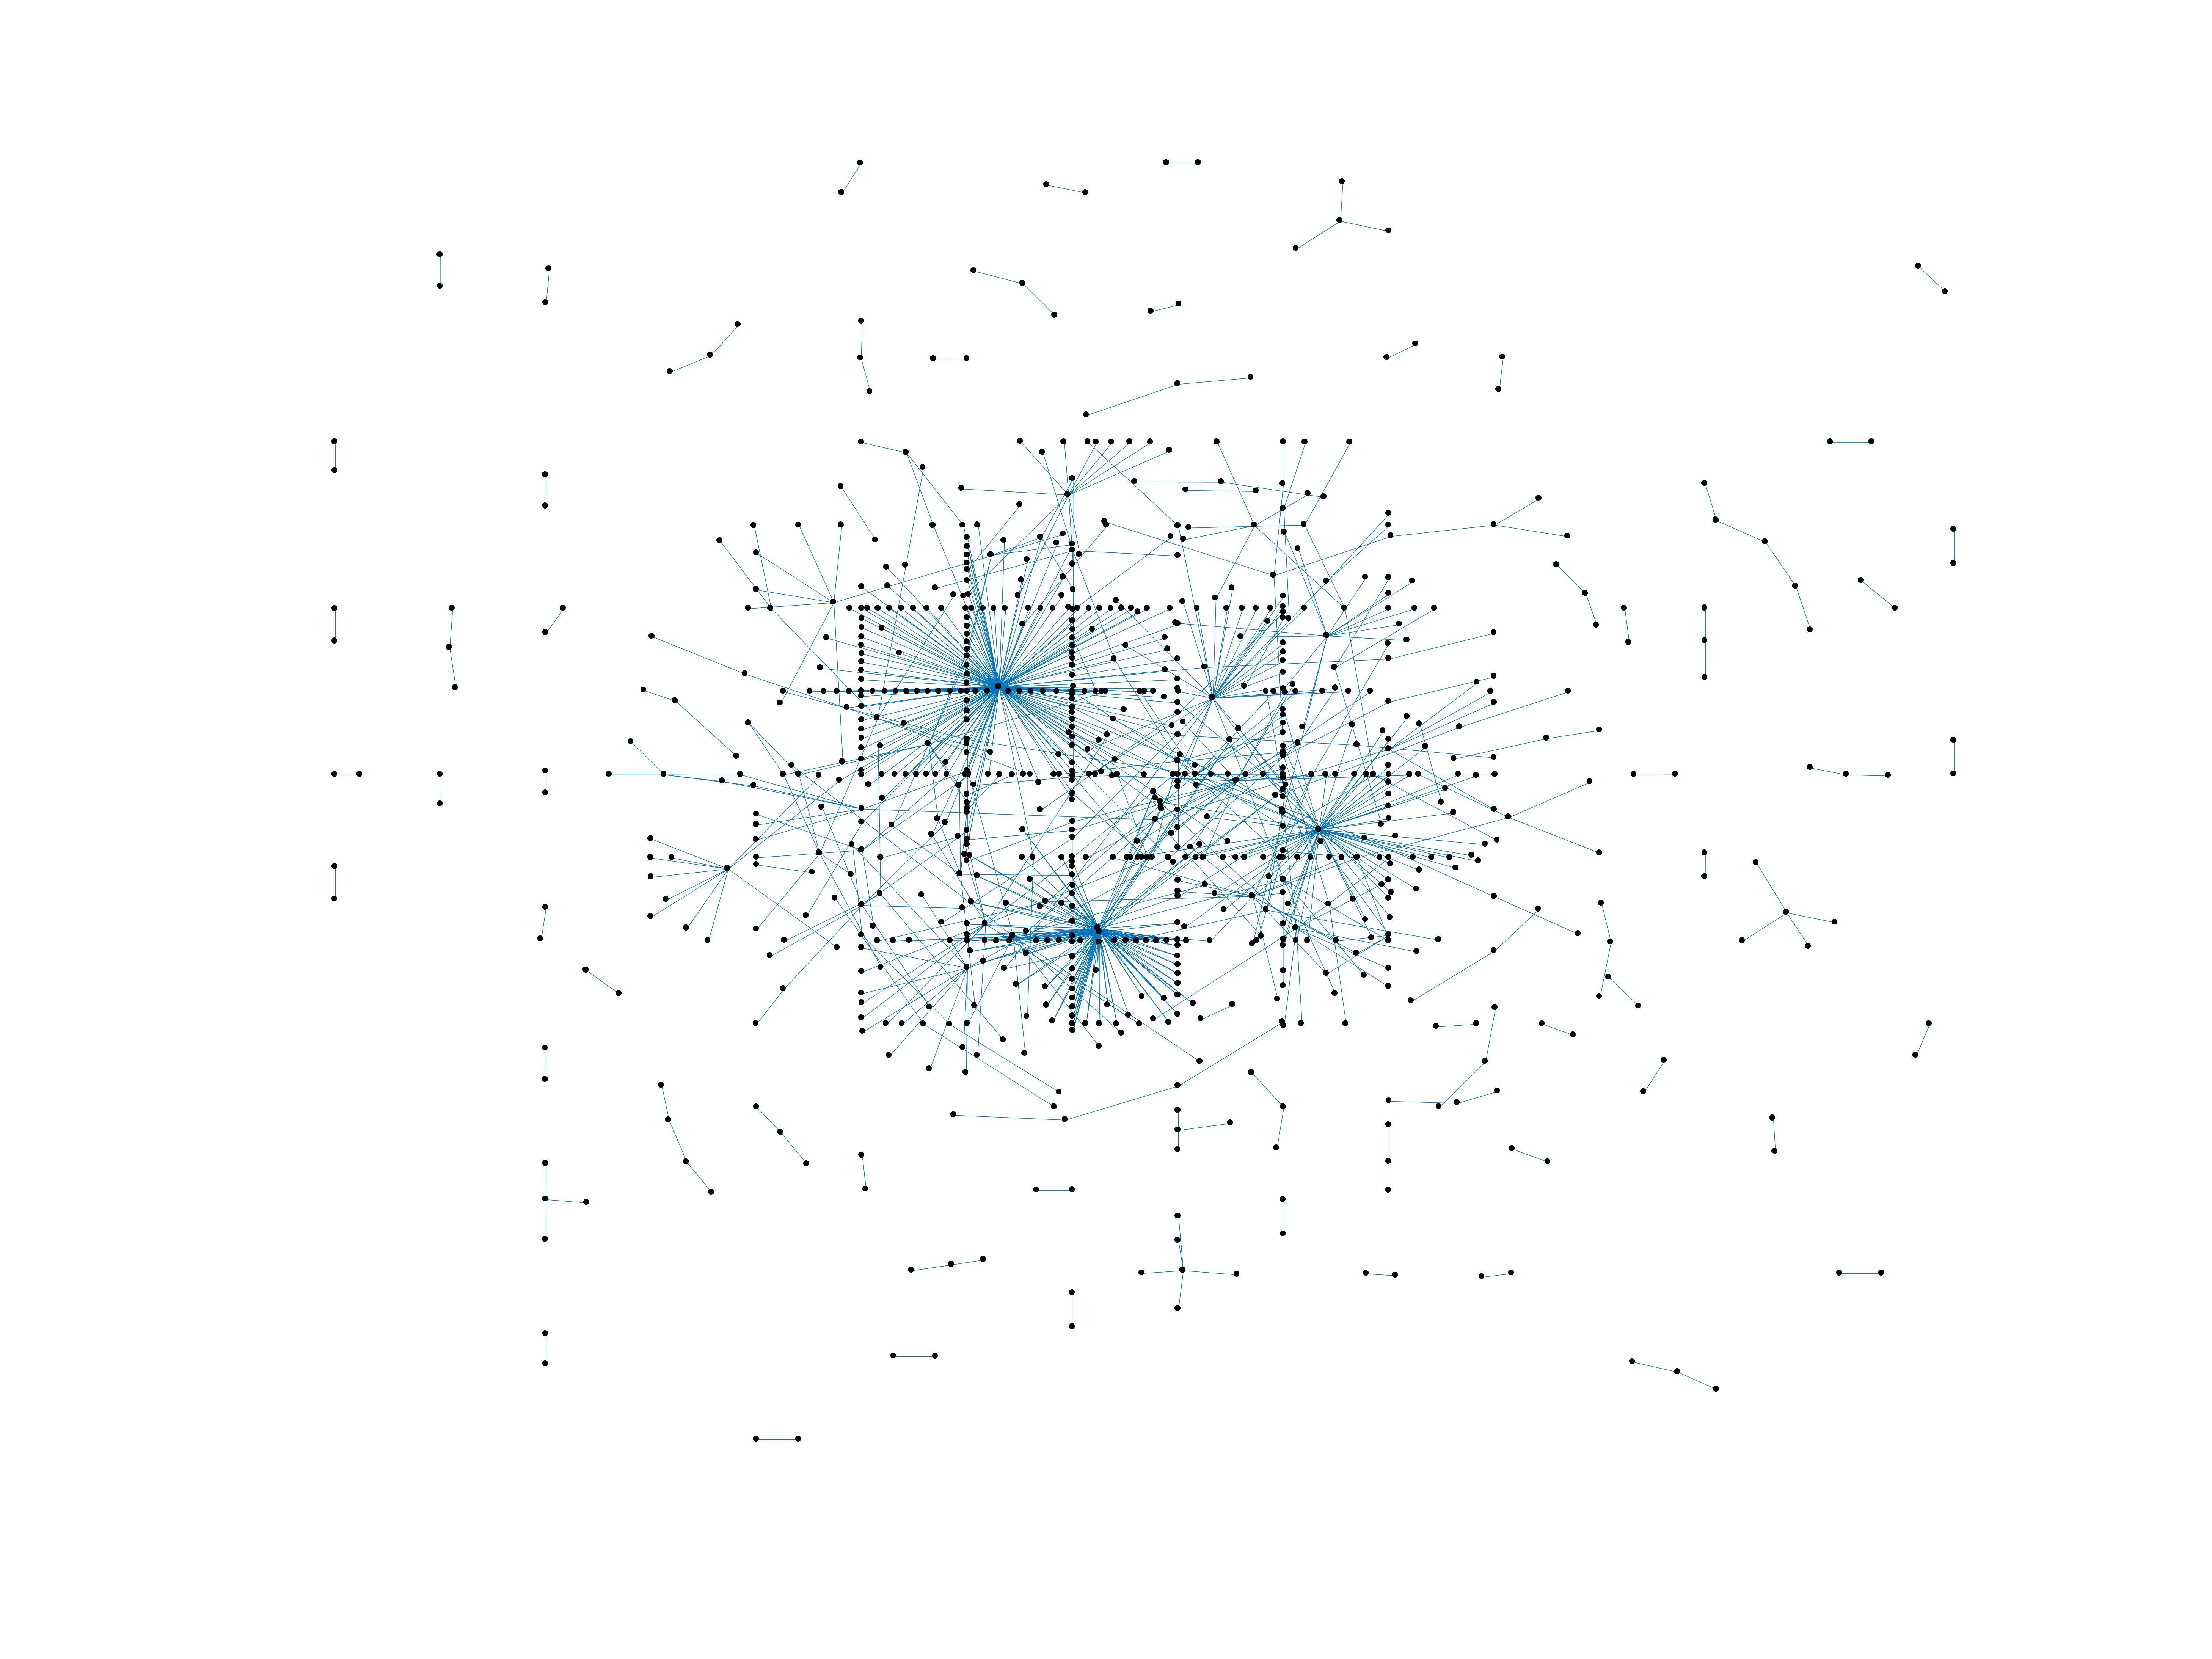
Wikibooks edits (te)
This is the bipartite edit network of the Telugu Wikibooks. It contains users
and pages from the Telugu Wikibooks, connected by edit events. Each edge
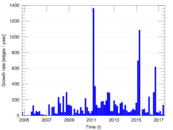
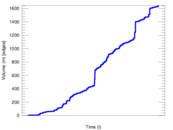
represents an edit. The dataset includes the timestamp of each edit.
Metadata
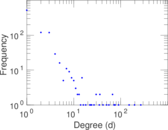
Statistics
| Size | n = | 944
|
| Left size | n1 = | 181
|
| Right size | n2 = | 763
|
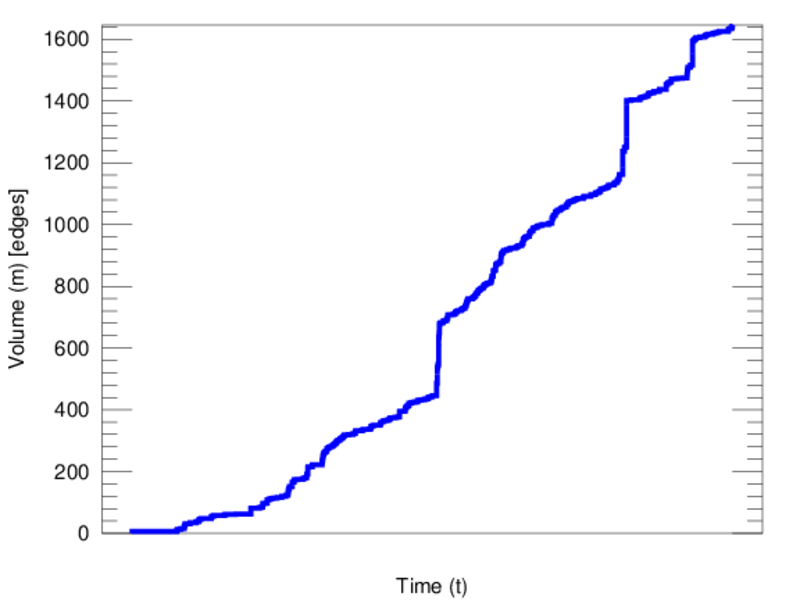
| Volume | m = | 1,646
|
| Unique edge count | m̿ = | 888
|
| Wedge count | s = | 26,273
|
| Claw count | z = | 1,172,821
|
| Cross count | x = | 46,693,881
|
| Square count | q = | 2,755
|
| 4-Tour count | T4 = | 128,952
|
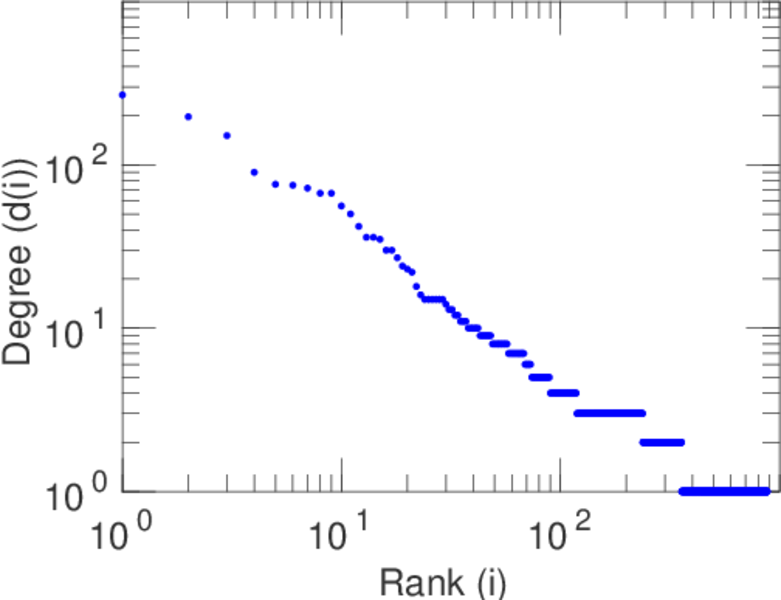
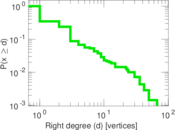
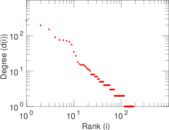
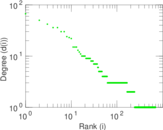
| Maximum degree | dmax = | 268
|
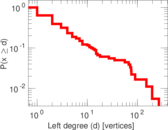
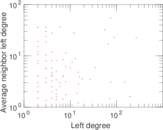
| Maximum left degree | d1max = | 268
|
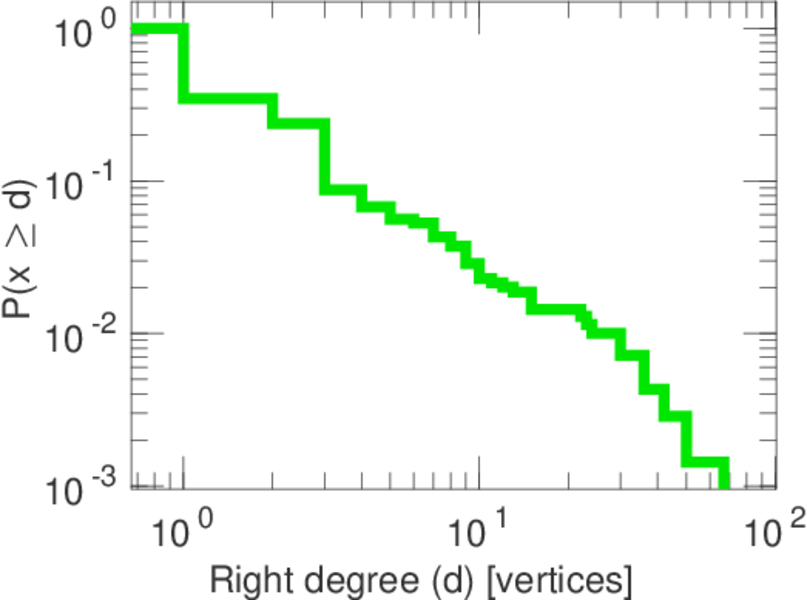
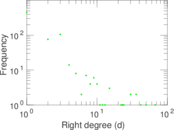
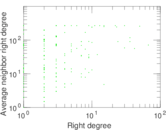
| Maximum right degree | d2max = | 67
|
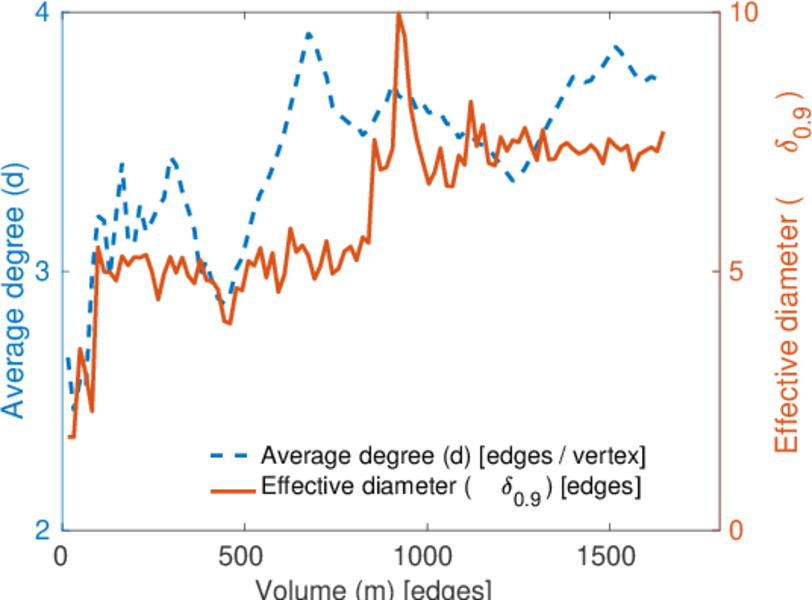
| Average degree | d = | 3.487 29
|
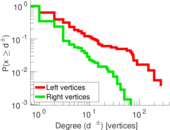
| Average left degree | d1 = | 9.093 92
|
| Average right degree | d2 = | 2.157 27
|
| Fill | p = | 0.006 429 98
|
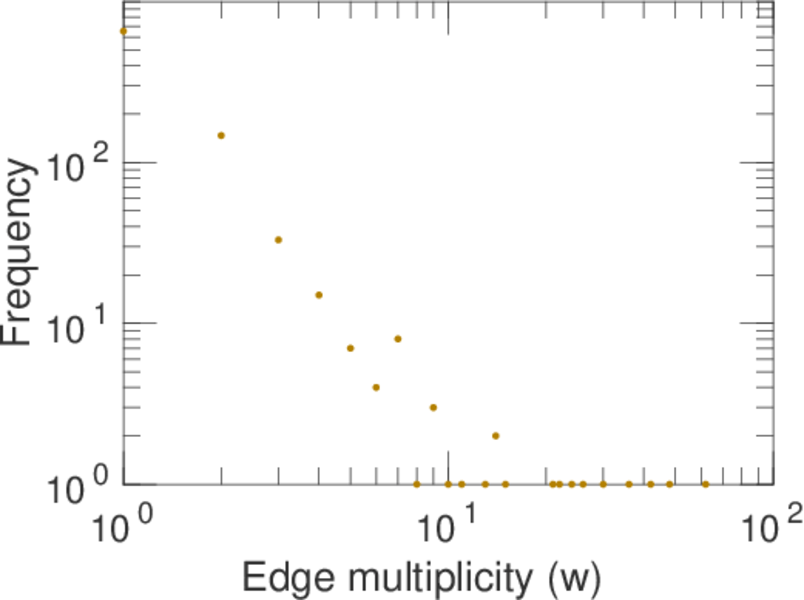
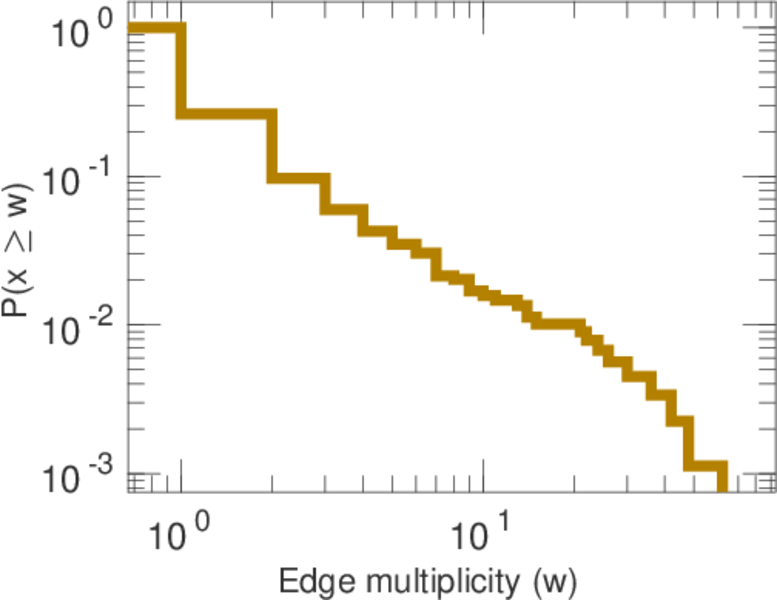
| Average edge multiplicity | m̃ = | 1.853 60
|
| Size of LCC | N = | 275
|
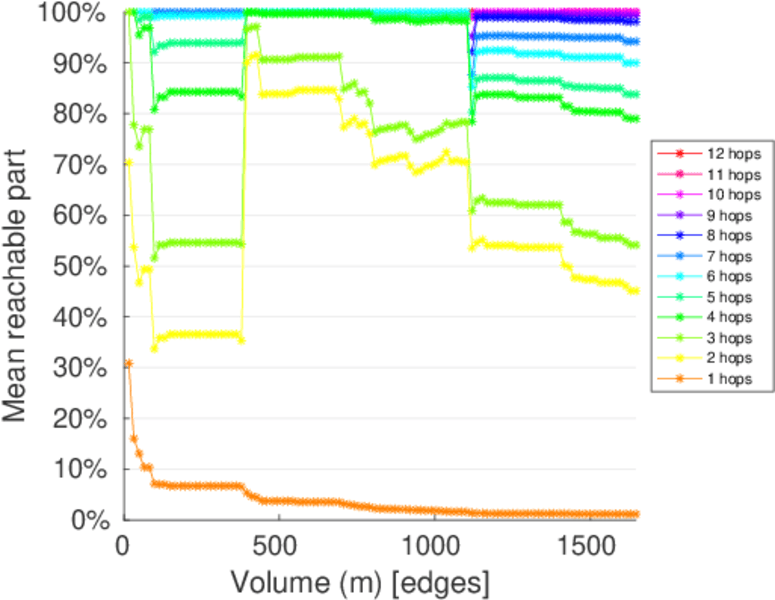
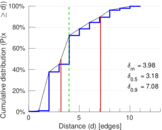
| Diameter | δ = | 11
|
| 50-Percentile effective diameter | δ0.5 = | 3.184 93
|
| 90-Percentile effective diameter | δ0.9 = | 7.082 71
|
| Median distance | δM = | 4
|
| Mean distance | δm = | 3.975 53
|
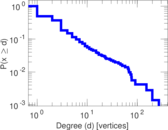
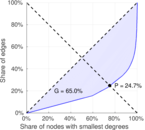
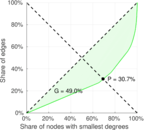
| Gini coefficient | G = | 0.670 296
|
| Balanced inequality ratio | P = | 0.241 798
|
| Left balanced inequality ratio | P1 = | 0.179 830
|
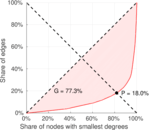
| Right balanced inequality ratio | P2 = | 0.306 804
|
| Relative edge distribution entropy | Her = | 0.860 390
|
| Power law exponent | γ = | 4.645 91
|
| Tail power law exponent | γt = | 2.541 00
|
| Tail power law exponent with p | γ3 = | 2.541 00
|
| p-value | p = | 0.000 00
|
| Left tail power law exponent with p | γ3,1 = | 2.091 00
|
| Left p-value | p1 = | 0.198 000
|
| Right tail power law exponent with p | γ3,2 = | 5.081 00
|
| Right p-value | p2 = | 0.015 000 0
|
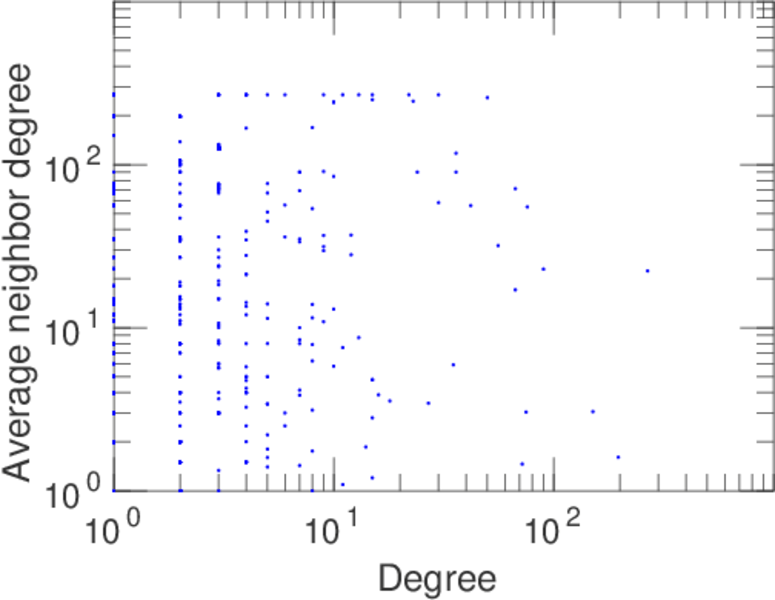
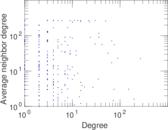
| Degree assortativity | ρ = | −0.169 327
|
| Degree assortativity p-value | pρ = | 3.866 55 × 10−7
|
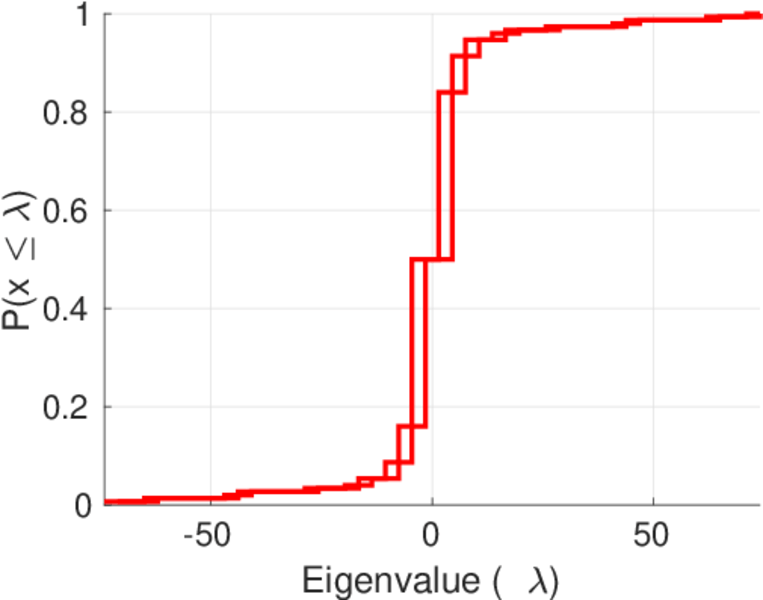
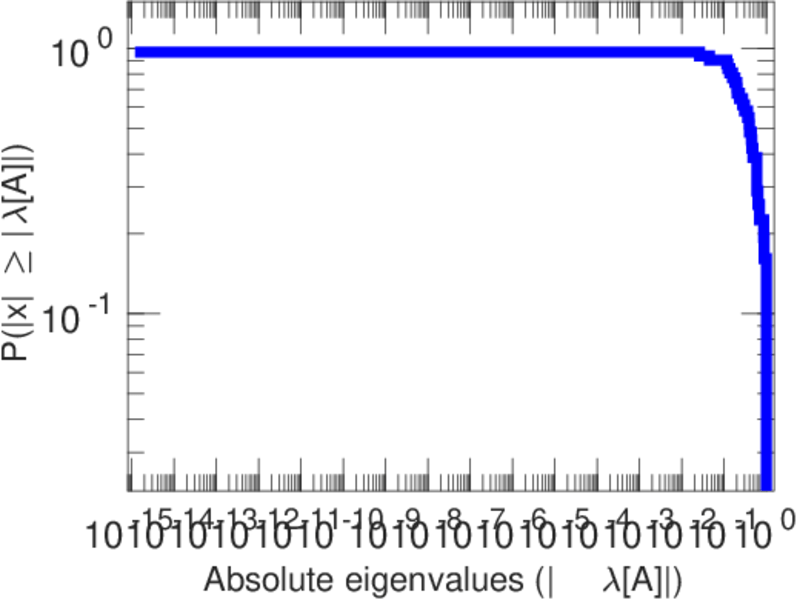
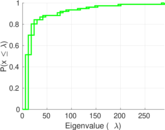
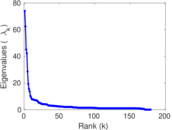
| Spectral norm | α = | 73.959 8
|
| Algebraic connectivity | a = | 0.026 349 4
|
| Spectral separation | |λ1[A] / λ2[A]| = | 1.185 99
|
| Controllability | C = | 538
|
| Relative controllability | Cr = | 0.612 756
|
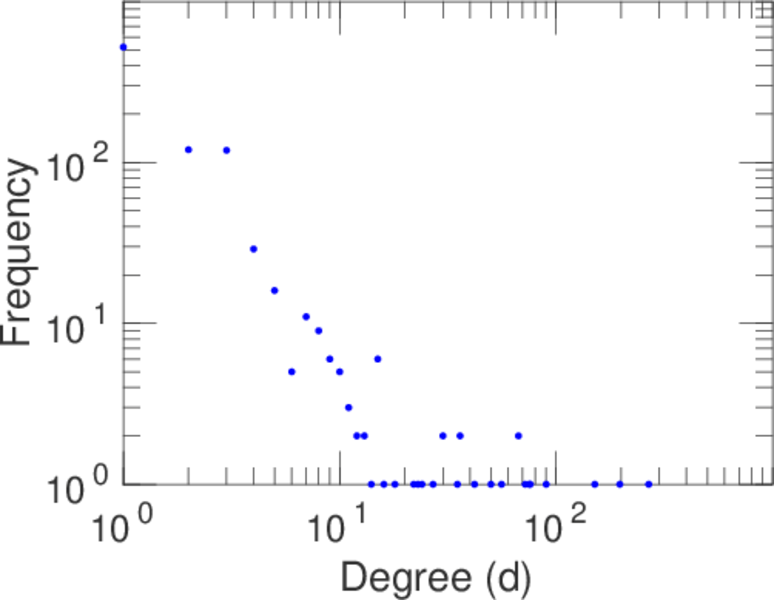
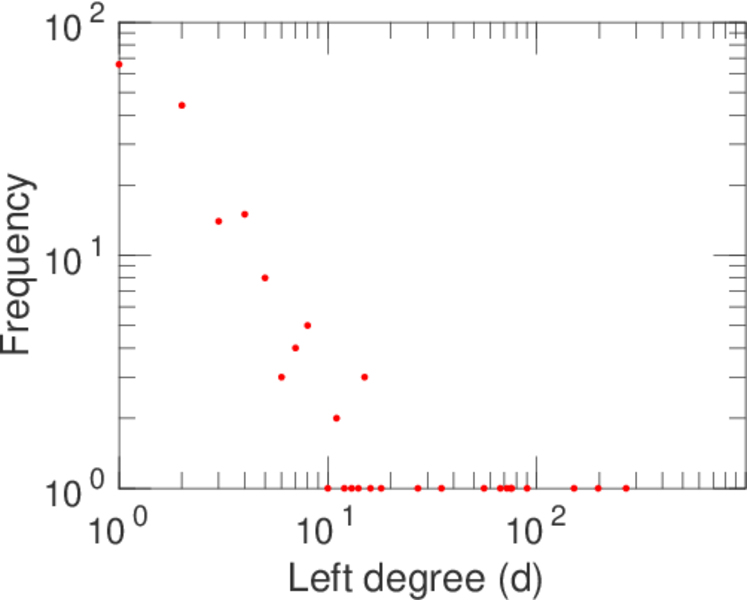
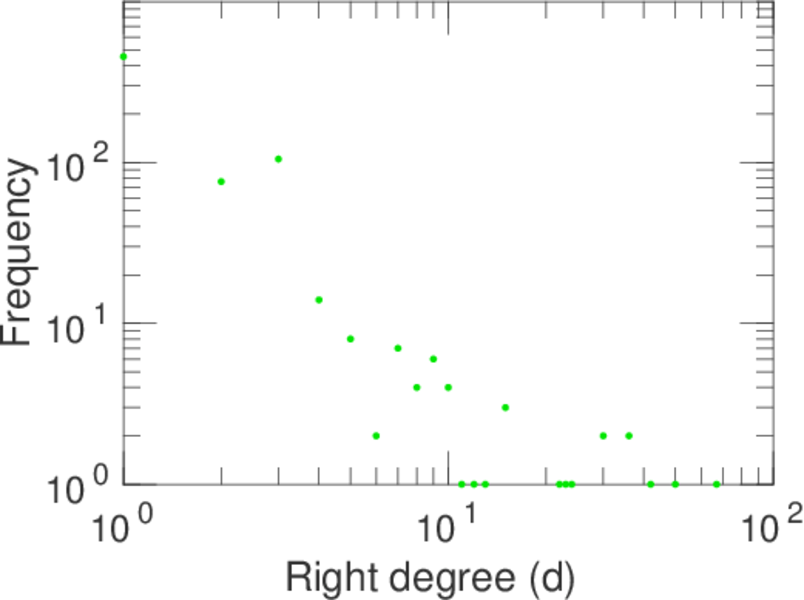
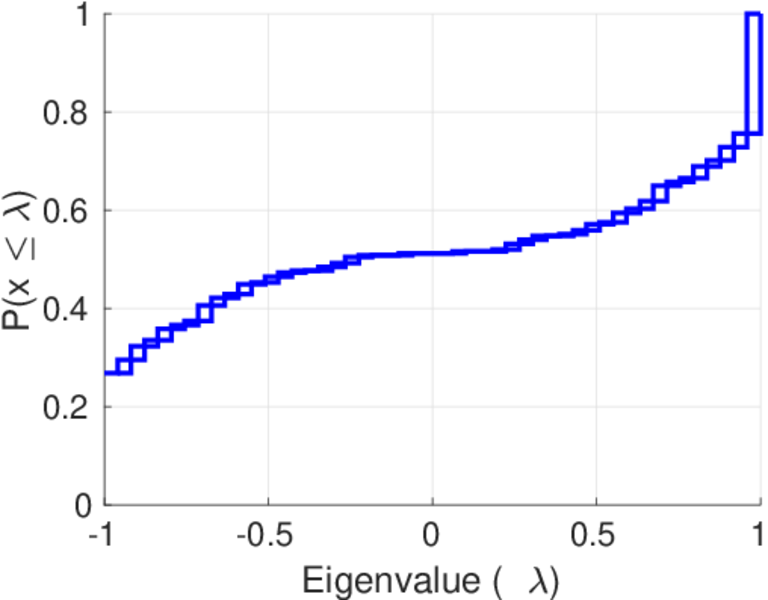
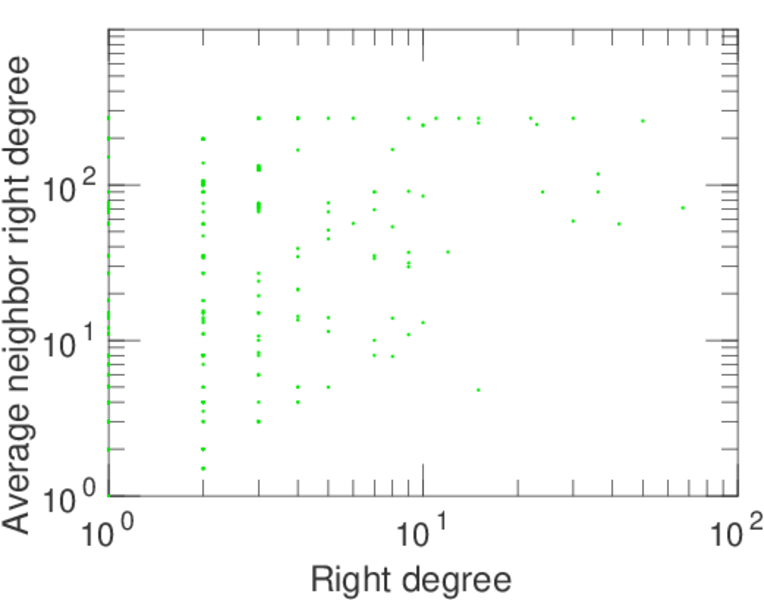
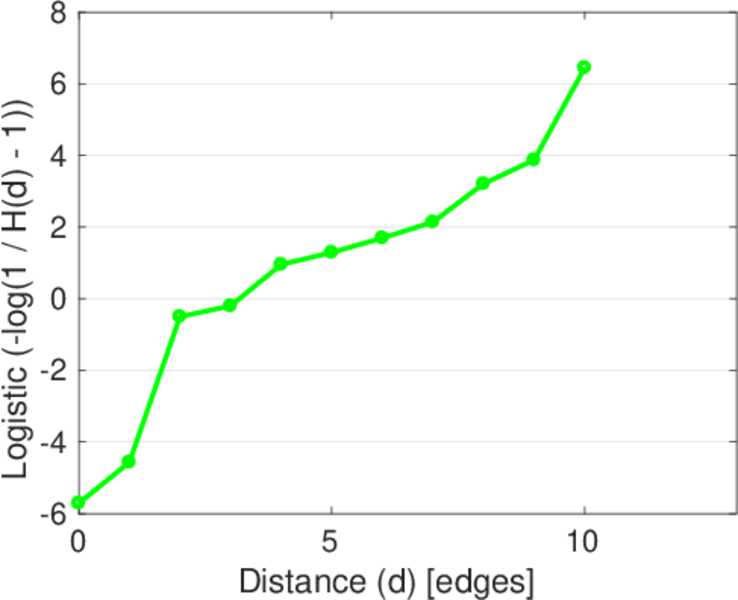
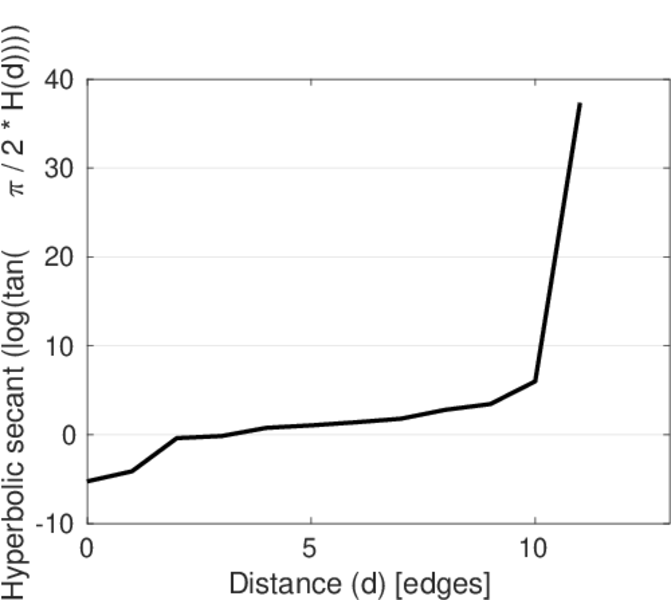
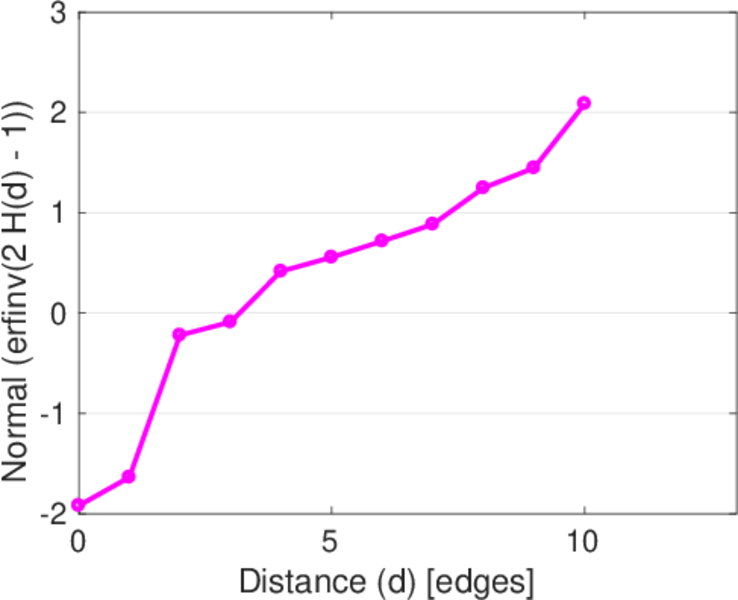
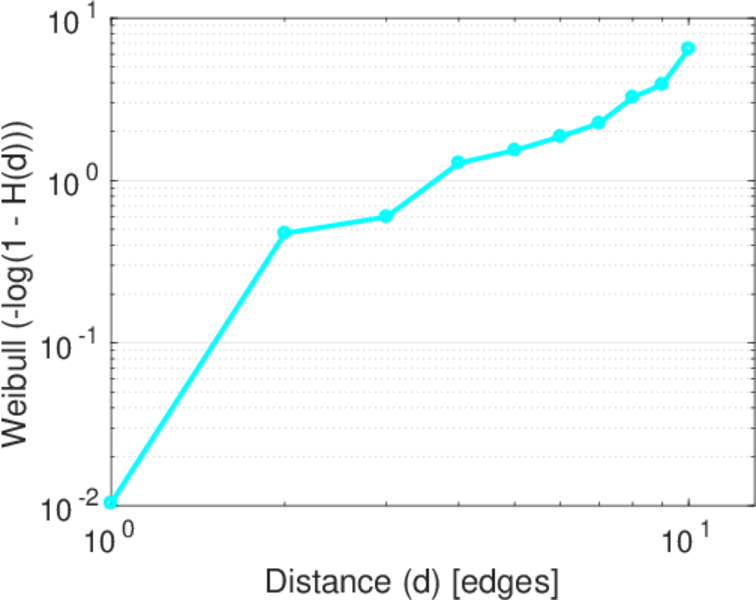
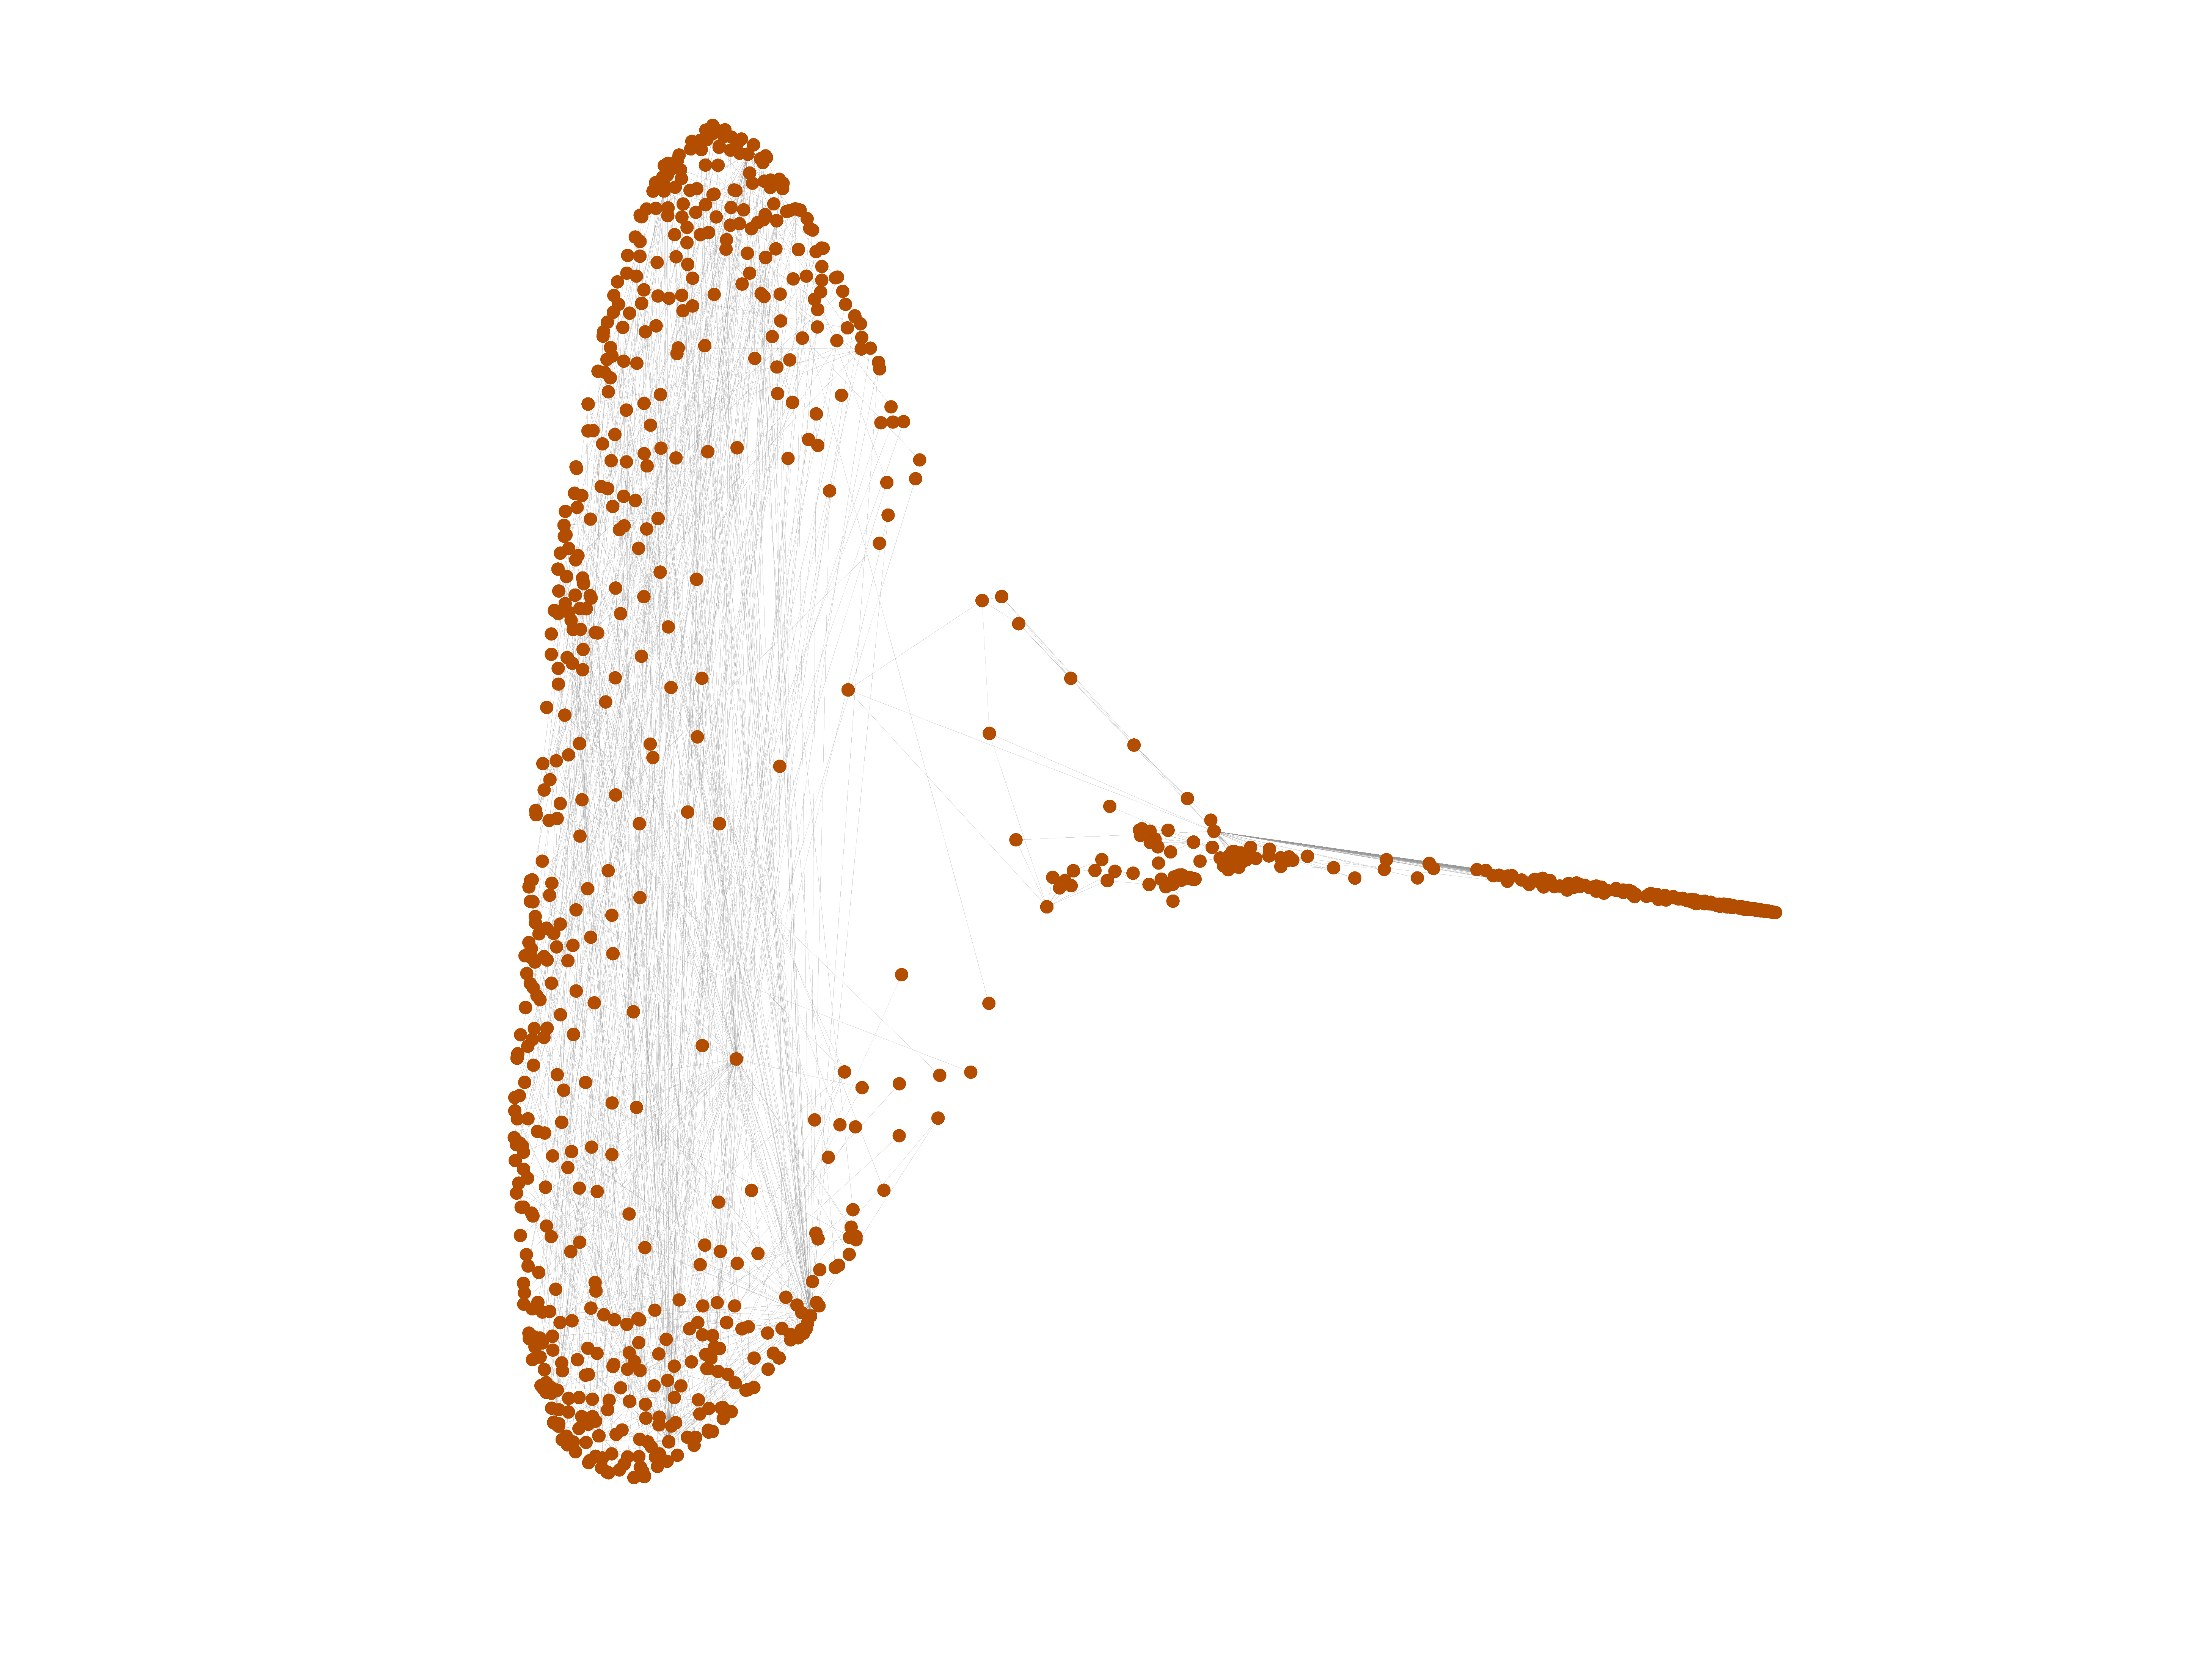
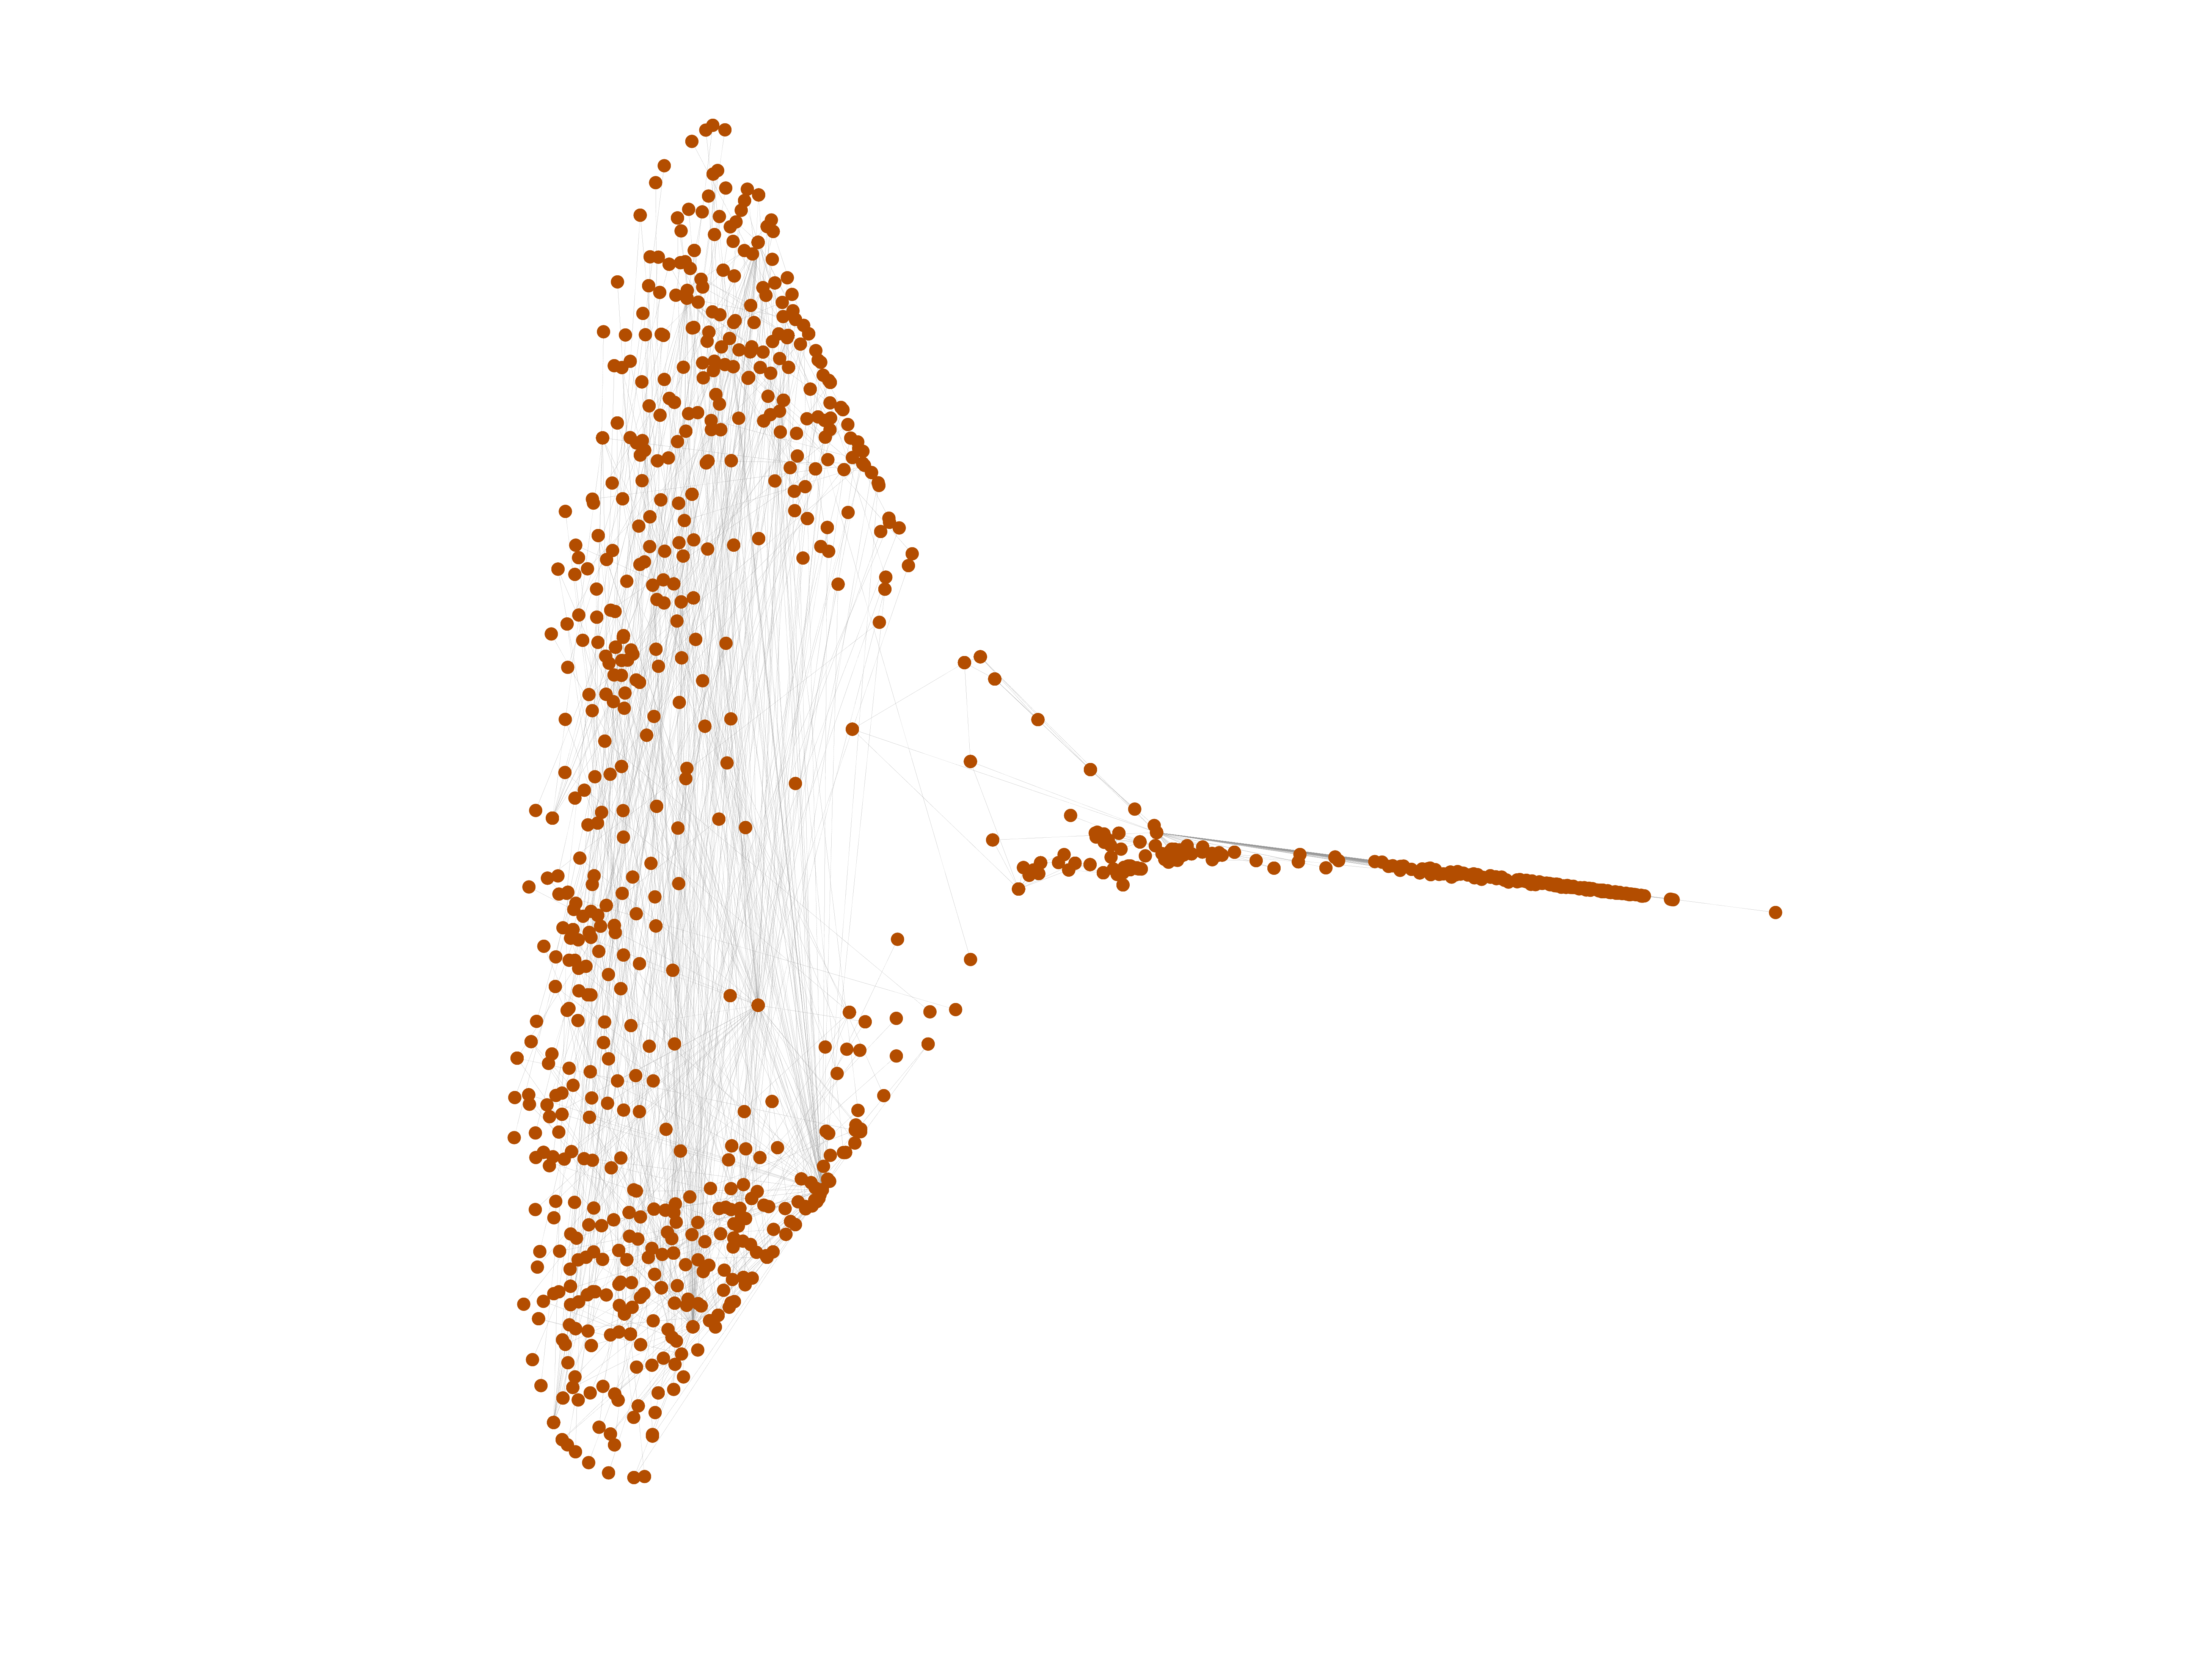
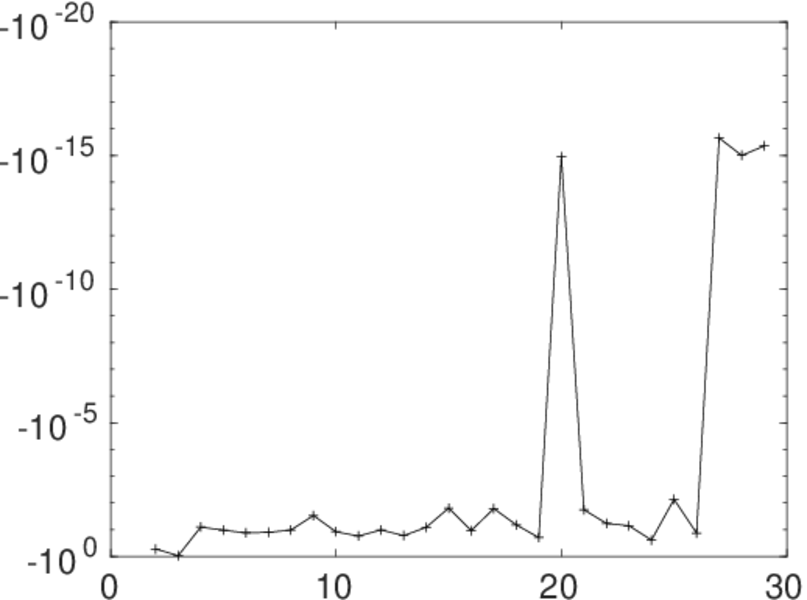
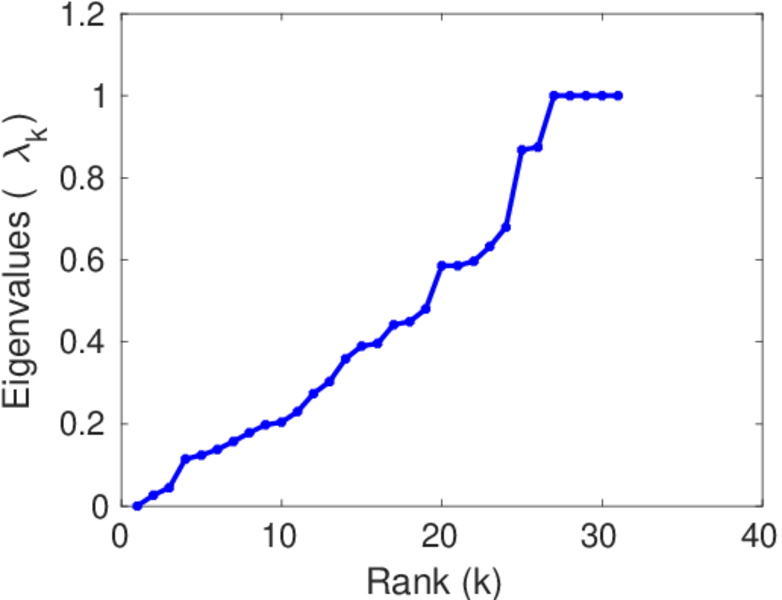
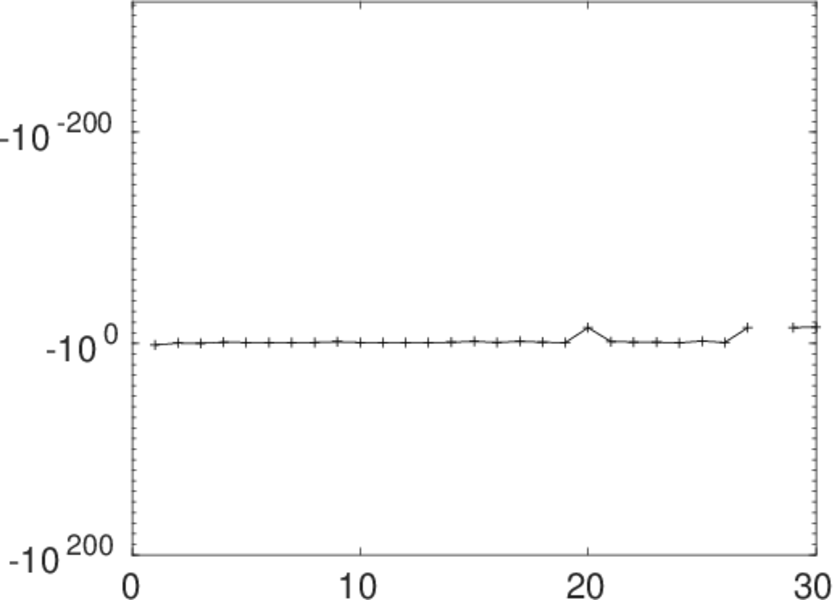
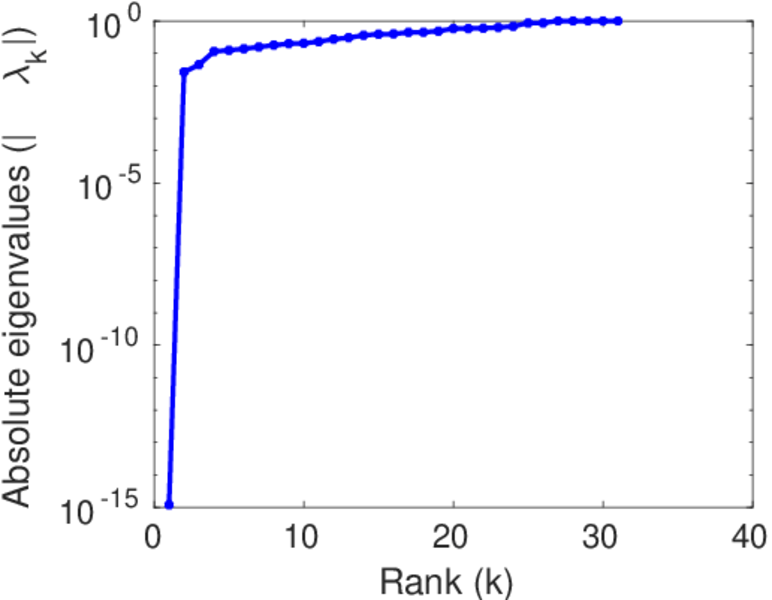
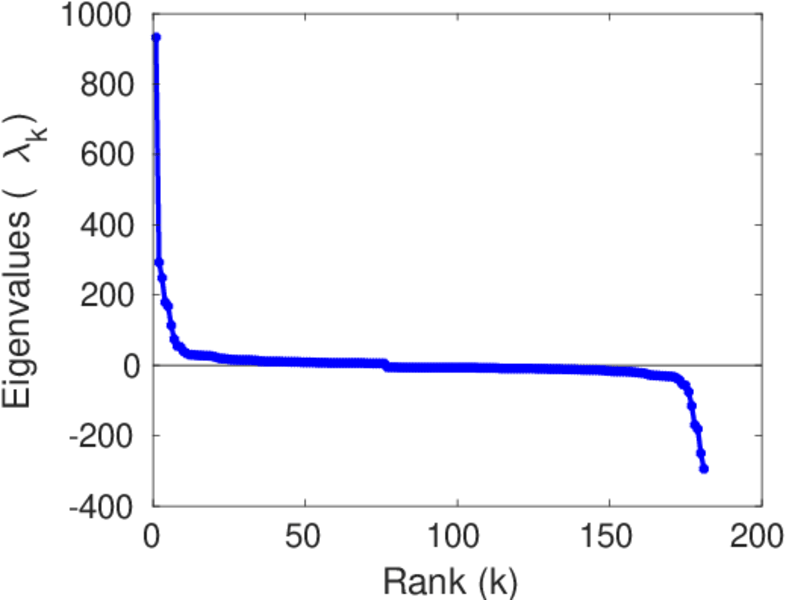
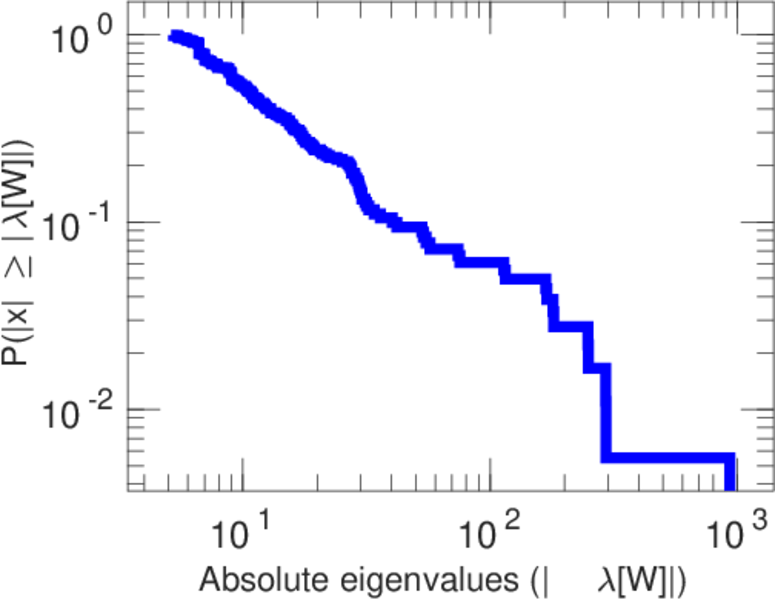
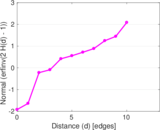
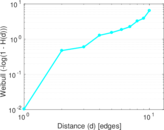
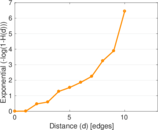
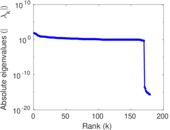
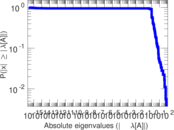
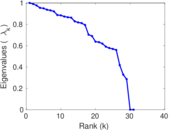
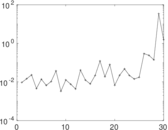
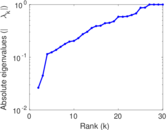
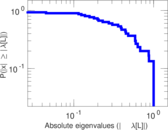
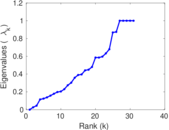
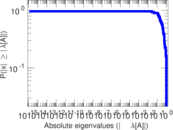
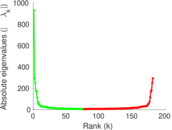
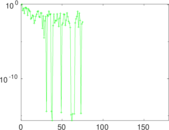
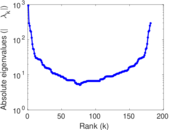
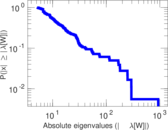
Plots


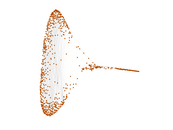
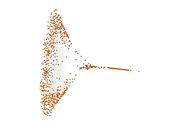


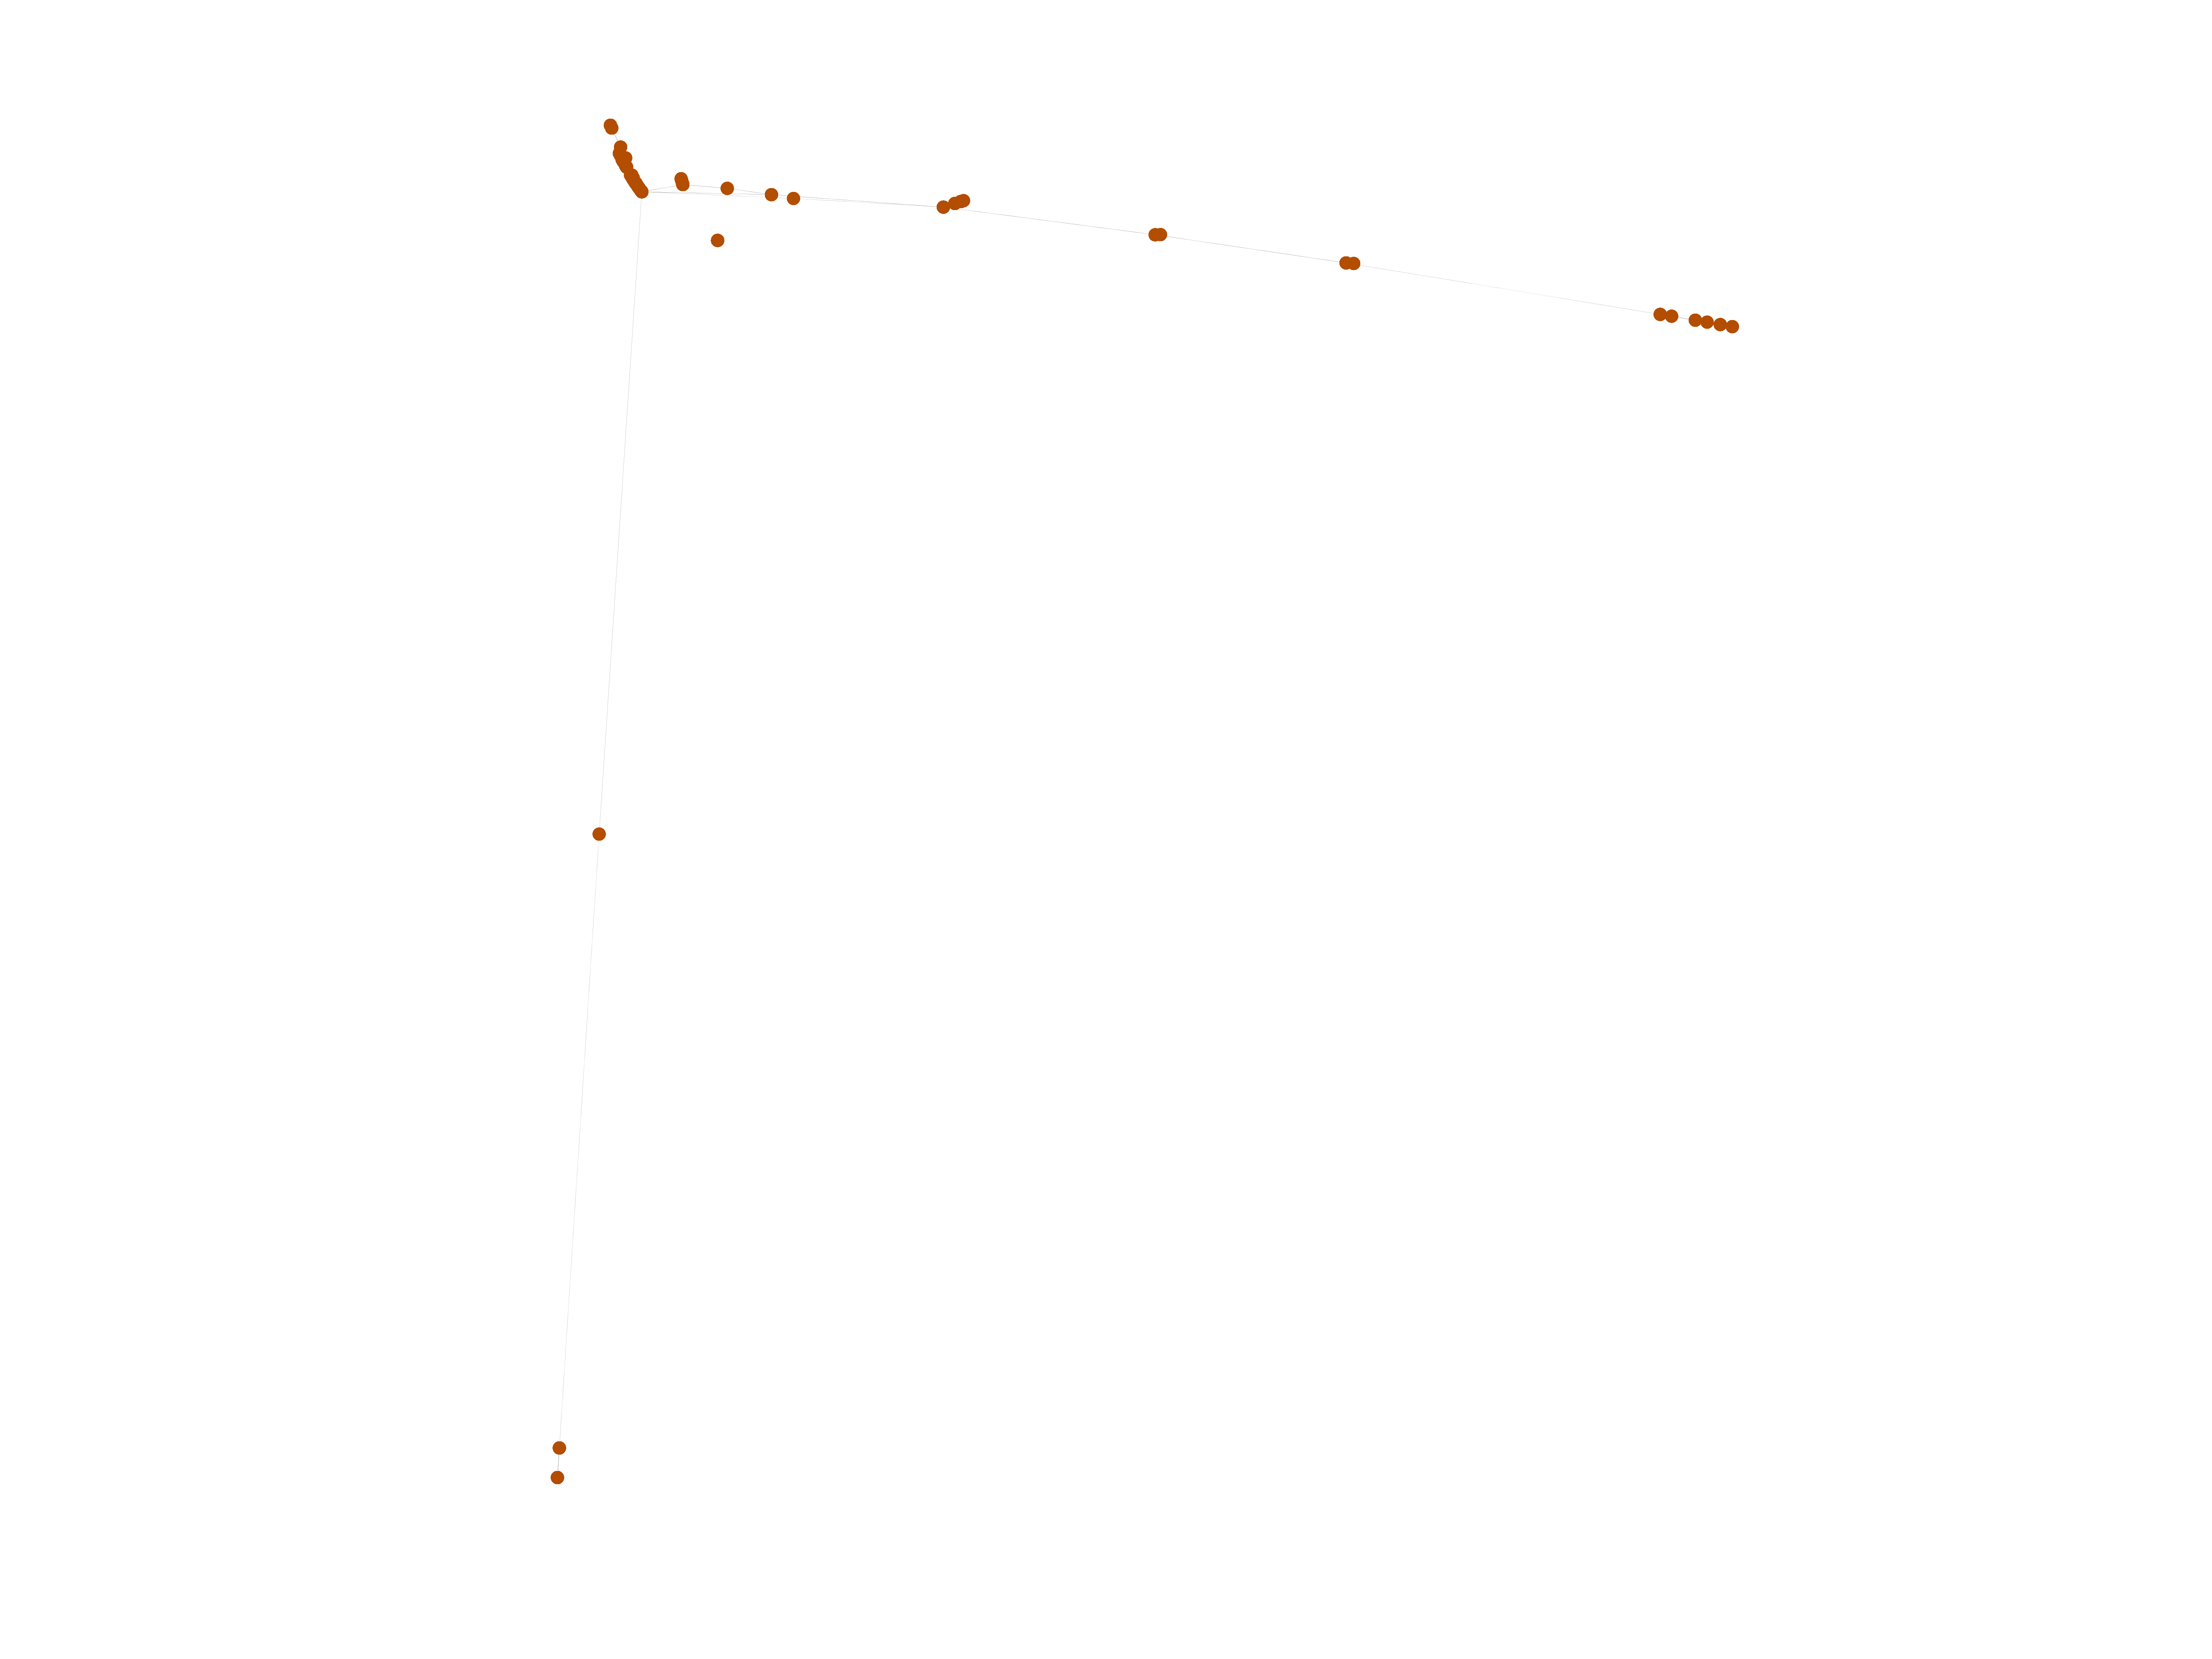
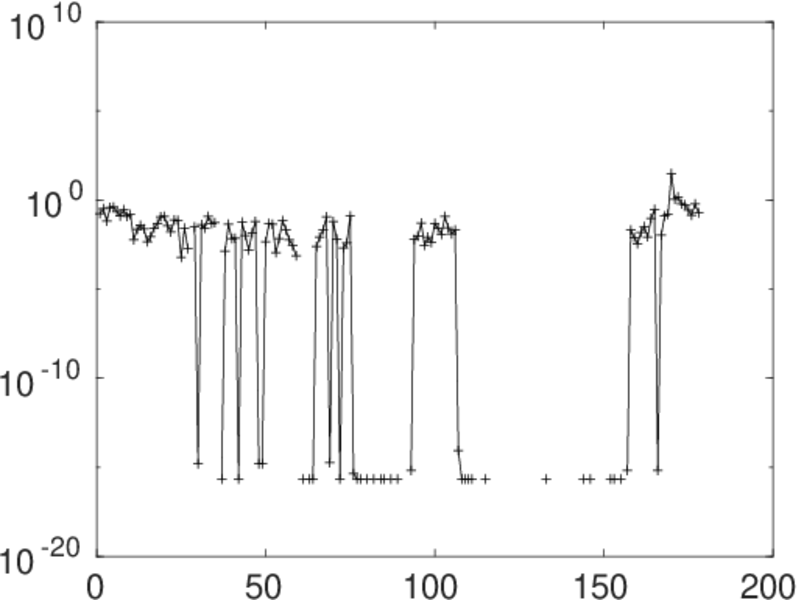
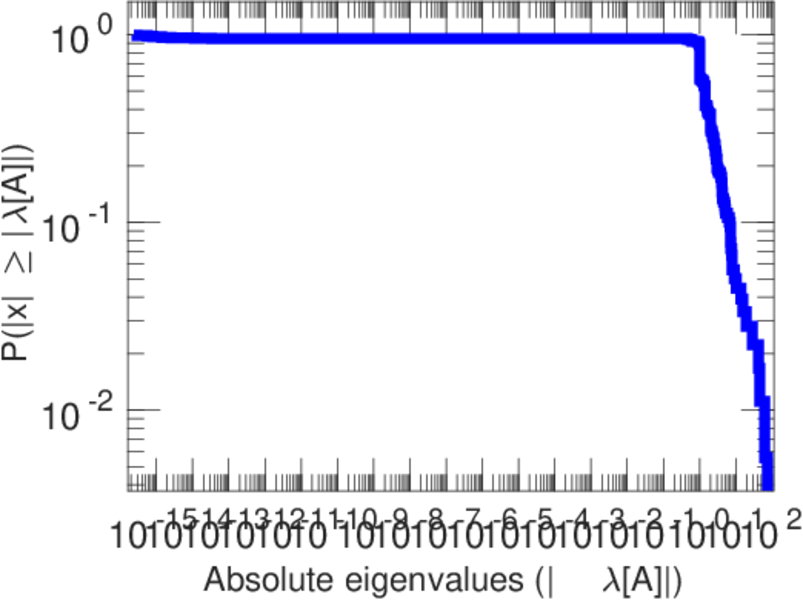
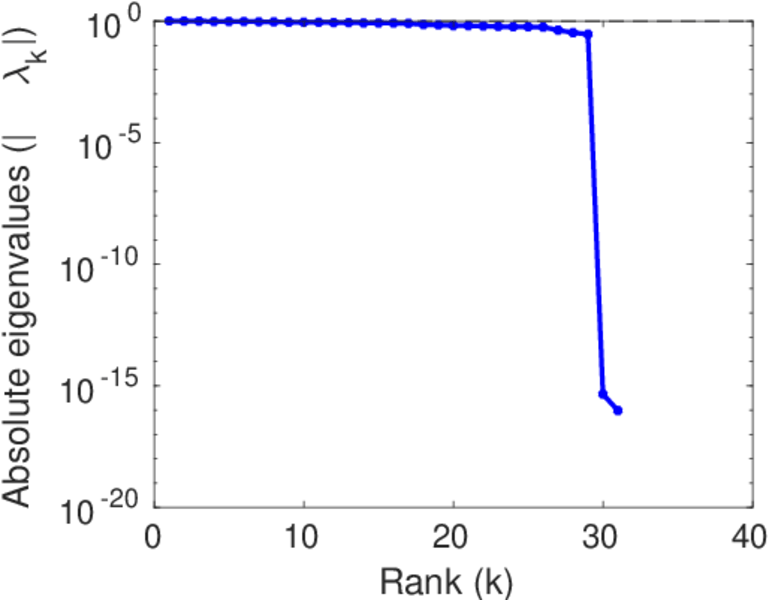
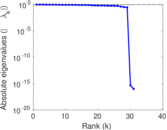
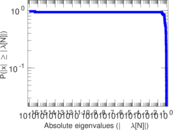
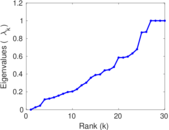
Matrix decompositions plots


Downloads
References
|
[1]
|
Jérôme Kunegis.
KONECT – The Koblenz Network Collection.
In Proc. Int. Conf. on World Wide Web Companion, pages
1343–1350, 2013.
[ http ]
|
|
[2]
|
Wikimedia Foundation.
Wikimedia downloads.
http://dumps.wikimedia.org/, January 2010.
|
 KONECT ‣ Networks ‣
Buy Me a Coffee
KONECT ‣ Networks ‣
Buy Me a Coffee