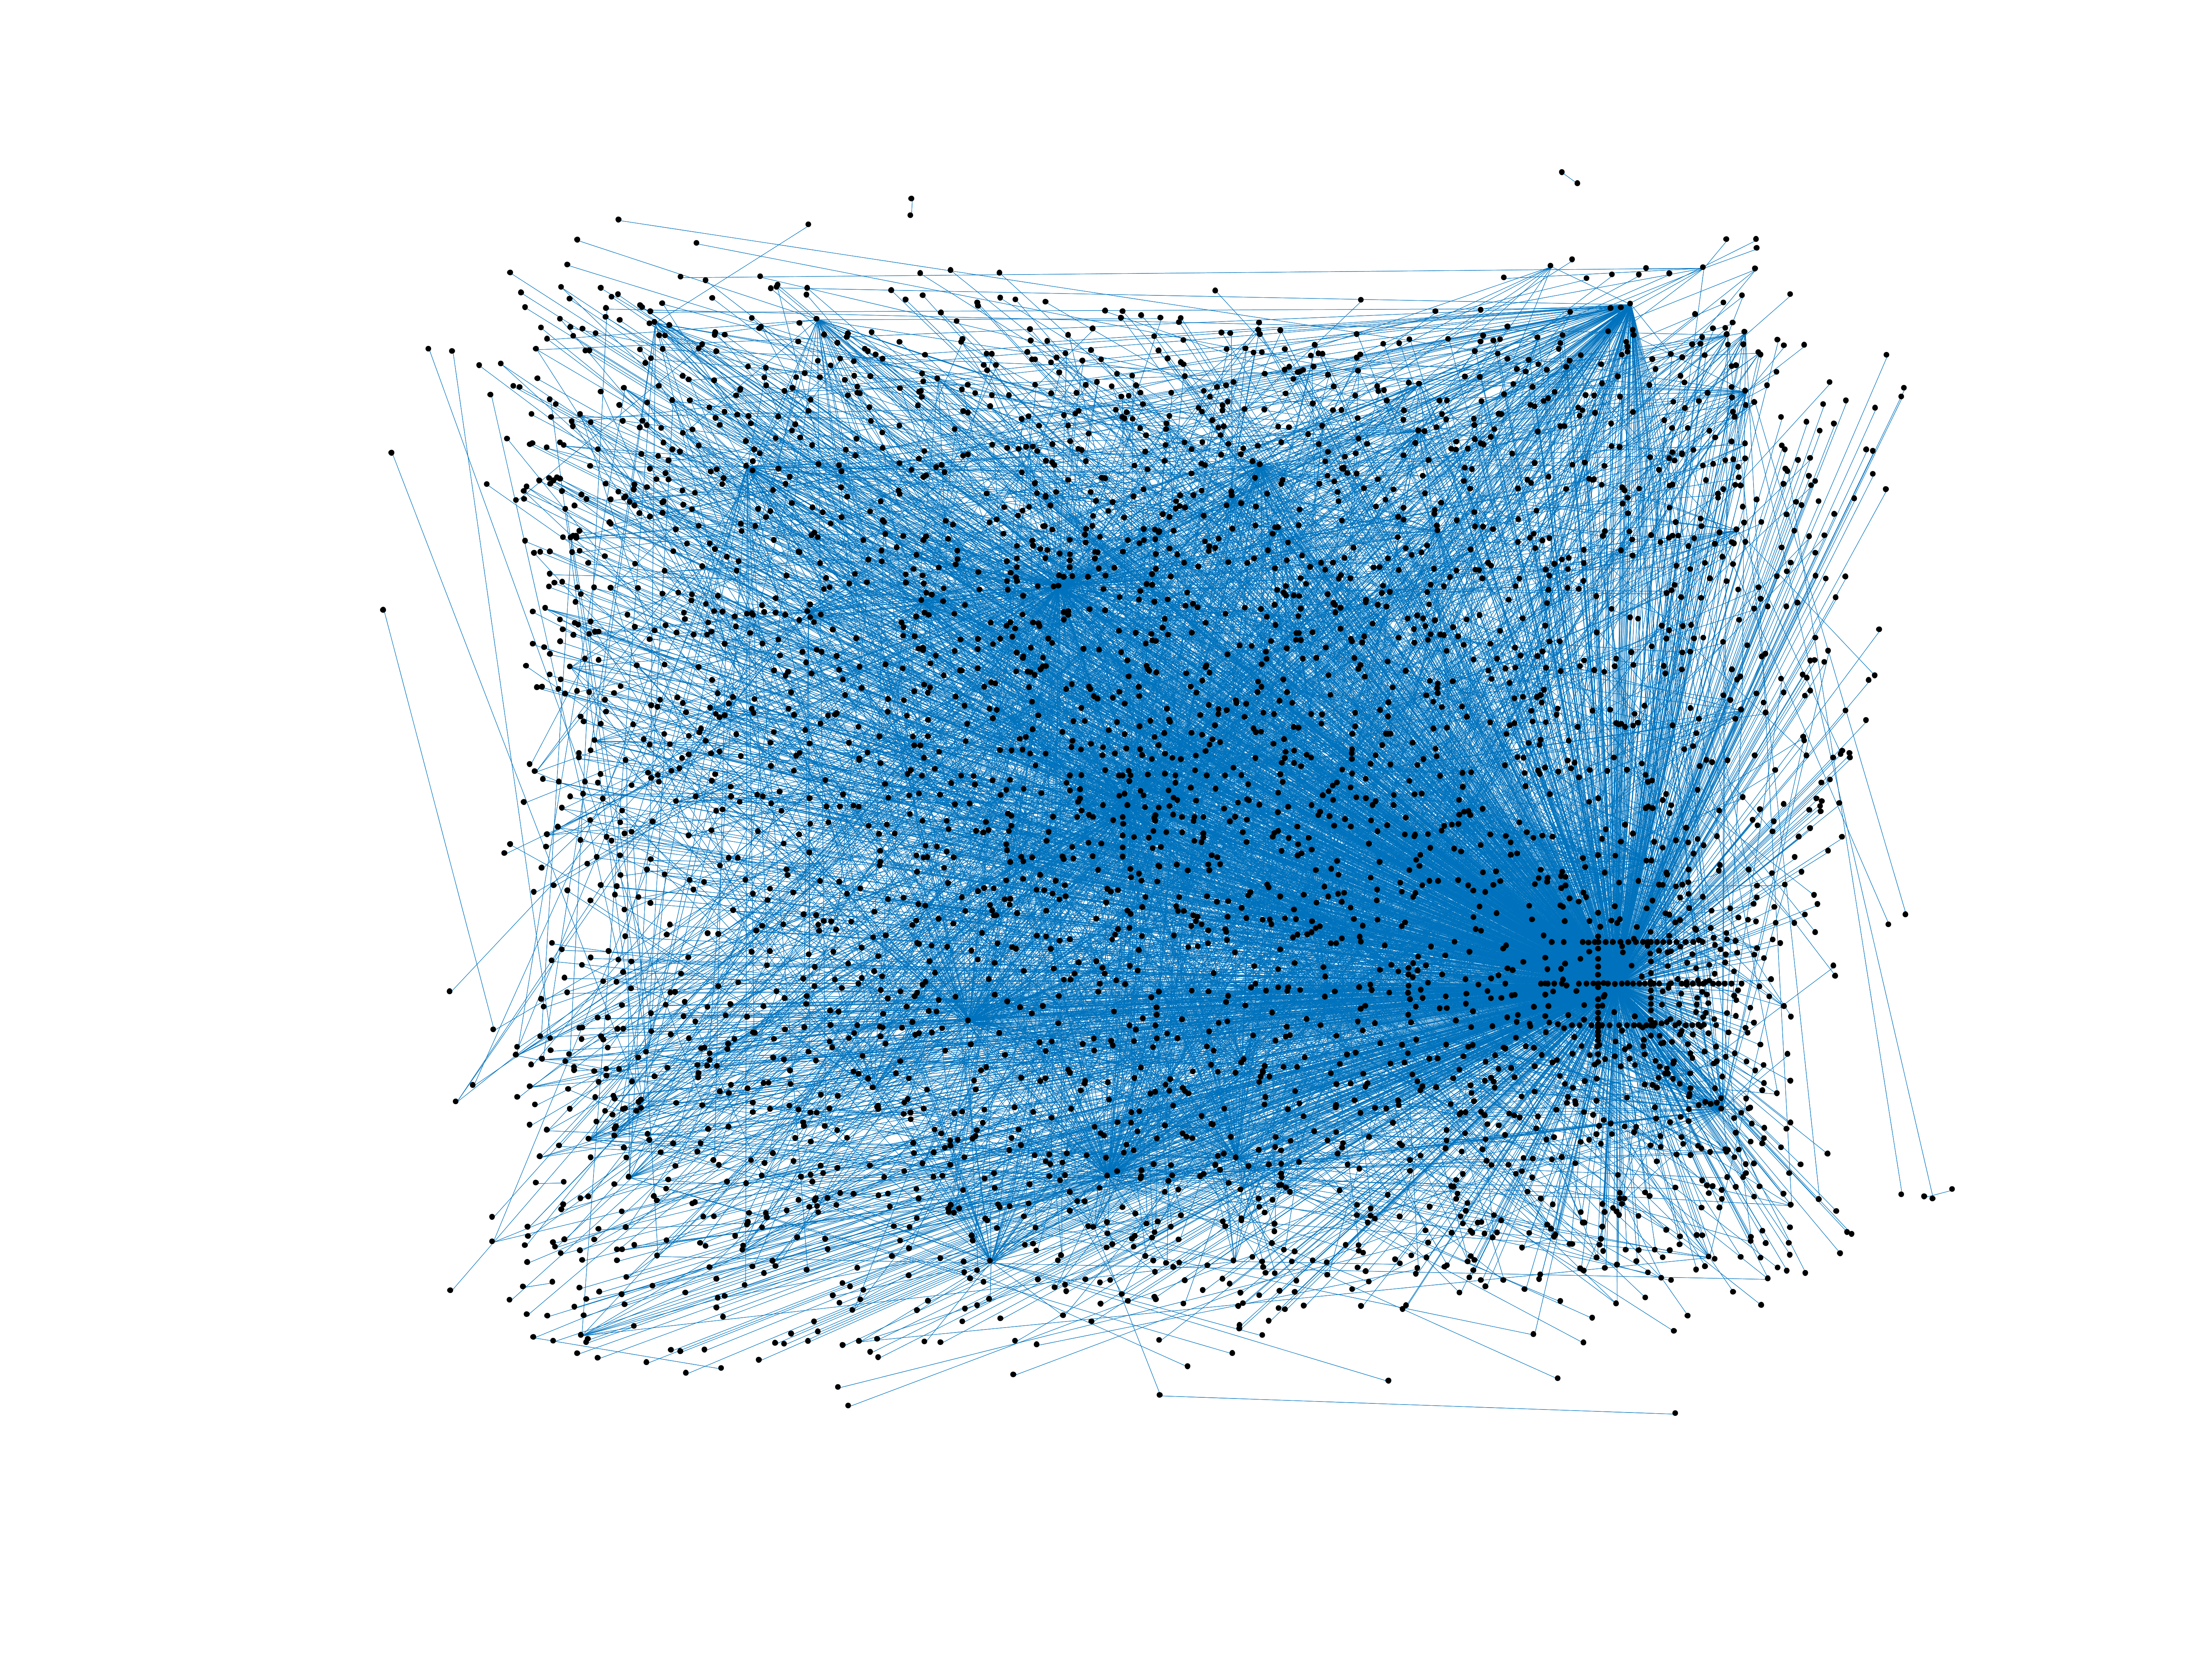
Wikiquote edits (te)
This is the bipartite edit network of the Telugu Wikiquote. It contains users
and pages from the Telugu Wikiquote, connected by edit events. Each edge
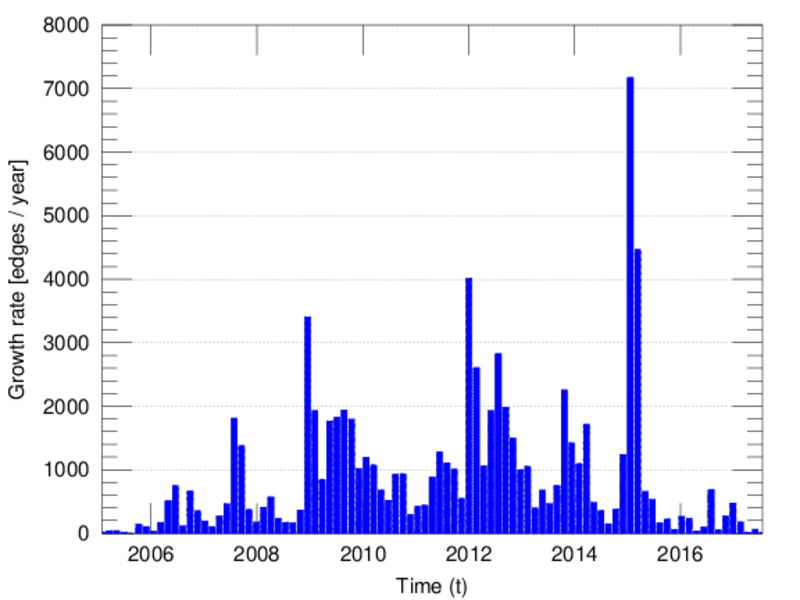
represents an edit. The dataset includes the timestamp of each edit.
Metadata
Statistics
| Size | n = | 3,795
|
| Left size | n1 = | 468
|
| Right size | n2 = | 3,327
|
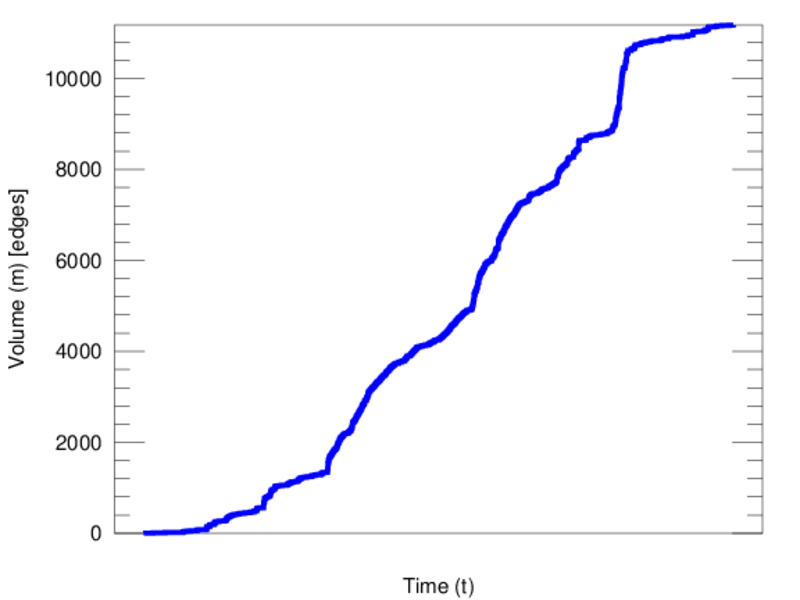
| Volume | m = | 11,174
|
| Unique edge count | m̿ = | 4,982
|
| Wedge count | s = | 2,127,490
|
| Claw count | z = | 1,339,876,784
|
| Cross count | x = | 666,337,117,216
|
| Square count | q = | 37,827
|
| 4-Tour count | T4 = | 8,823,092
|
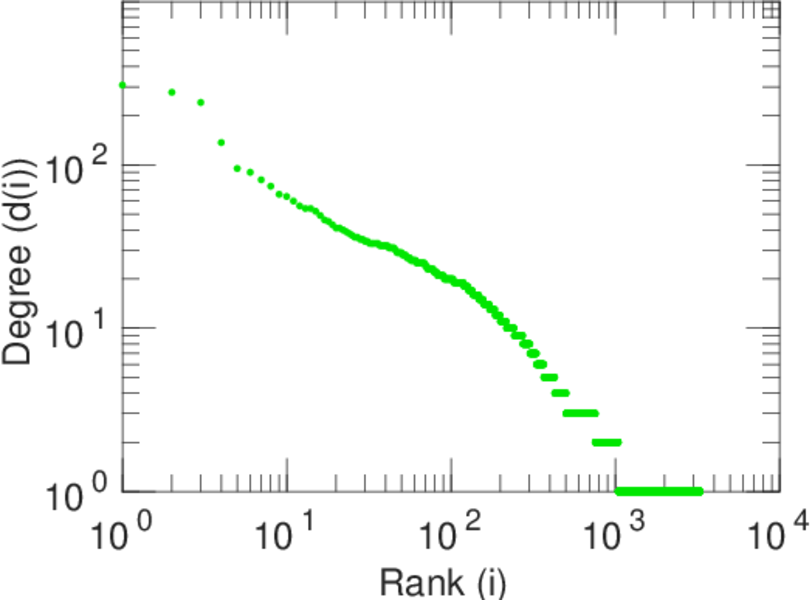
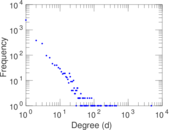
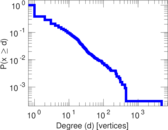
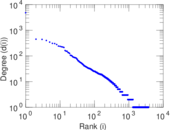
| Maximum degree | dmax = | 4,796
|
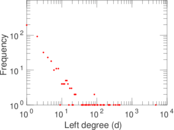
| Maximum left degree | d1max = | 4,796
|
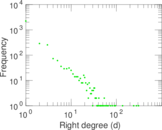
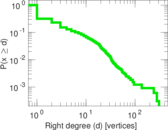
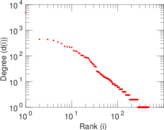
| Maximum right degree | d2max = | 308
|
| Average degree | d = | 5.888 80
|
| Average left degree | d1 = | 23.876 1
|
| Average right degree | d2 = | 3.358 58
|
| Fill | p = | 0.003 199 67
|
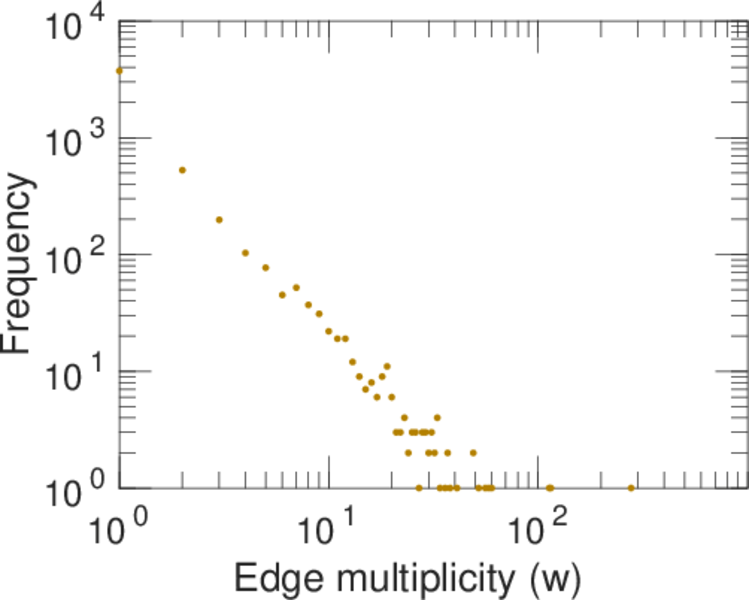
| Average edge multiplicity | m̃ = | 2.242 87
|
| Size of LCC | N = | 3,515
|
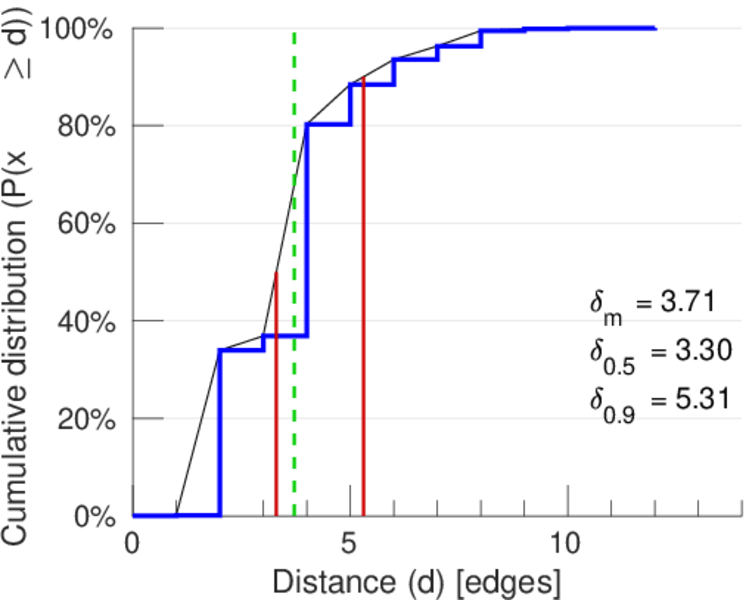
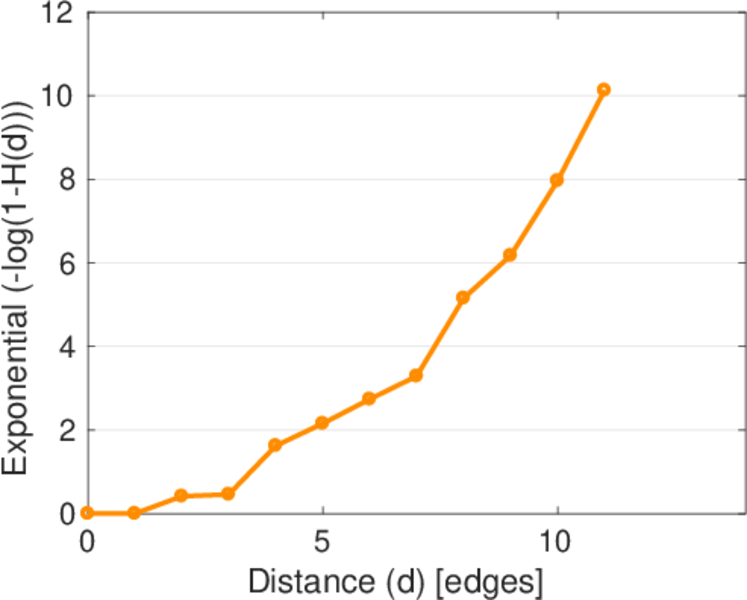
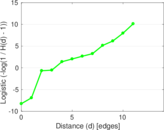
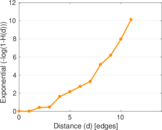
| Diameter | δ = | 12
|
| 50-Percentile effective diameter | δ0.5 = | 3.302 62
|
| 90-Percentile effective diameter | δ0.9 = | 5.309 29
|
| Median distance | δM = | 4
|
| Mean distance | δm = | 3.714 15
|
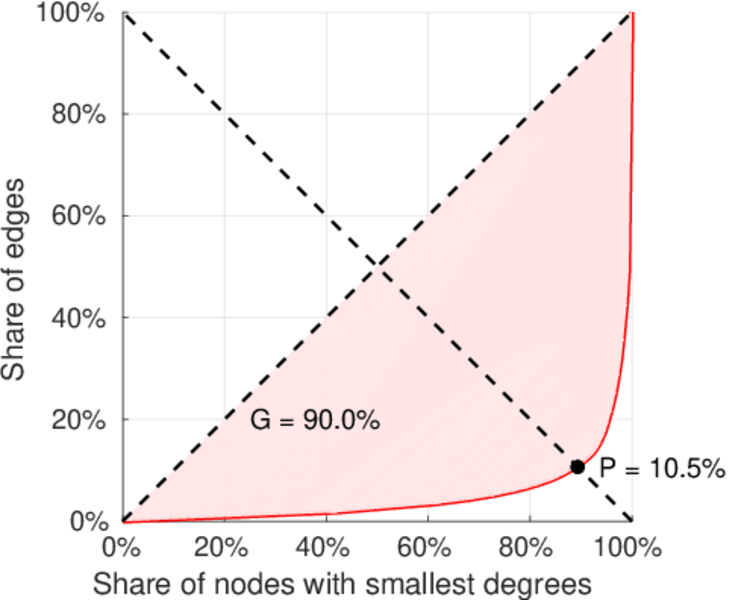
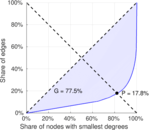
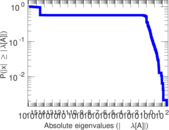
| Gini coefficient | G = | 0.786 166
|
| Balanced inequality ratio | P = | 0.173 573
|
| Left balanced inequality ratio | P1 = | 0.104 976
|
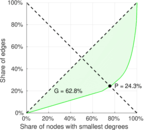
| Right balanced inequality ratio | P2 = | 0.242 796
|
| Relative edge distribution entropy | Her = | 0.761 781
|
| Power law exponent | γ = | 4.746 24
|
| Tail power law exponent | γt = | 2.561 00
|
| Tail power law exponent with p | γ3 = | 2.561 00
|
| p-value | p = | 0.000 00
|
| Left tail power law exponent with p | γ3,1 = | 1.861 00
|
| Left p-value | p1 = | 0.418 000
|
| Right tail power law exponent with p | γ3,2 = | 2.811 00
|
| Right p-value | p2 = | 0.000 00
|
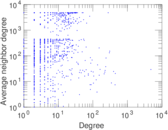
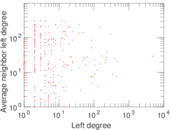
| Degree assortativity | ρ = | −0.324 786
|
| Degree assortativity p-value | pρ = | 9.848 55 × 10−123
|
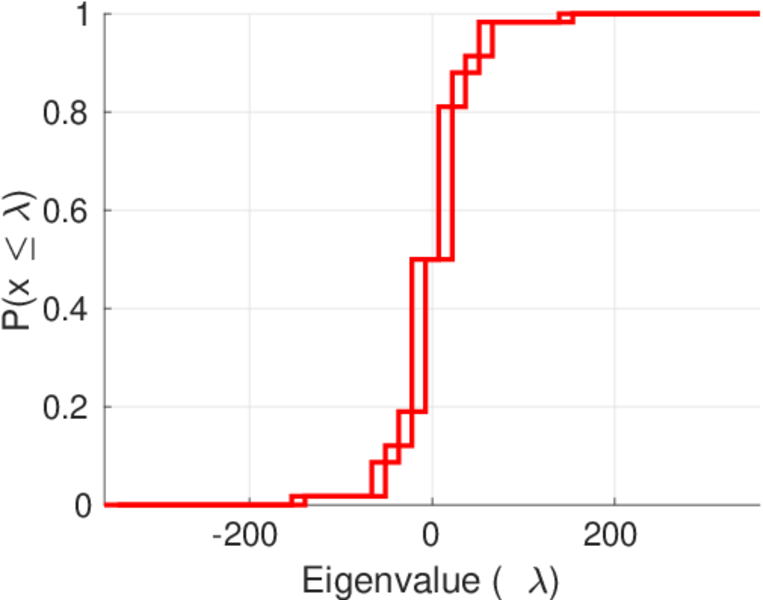
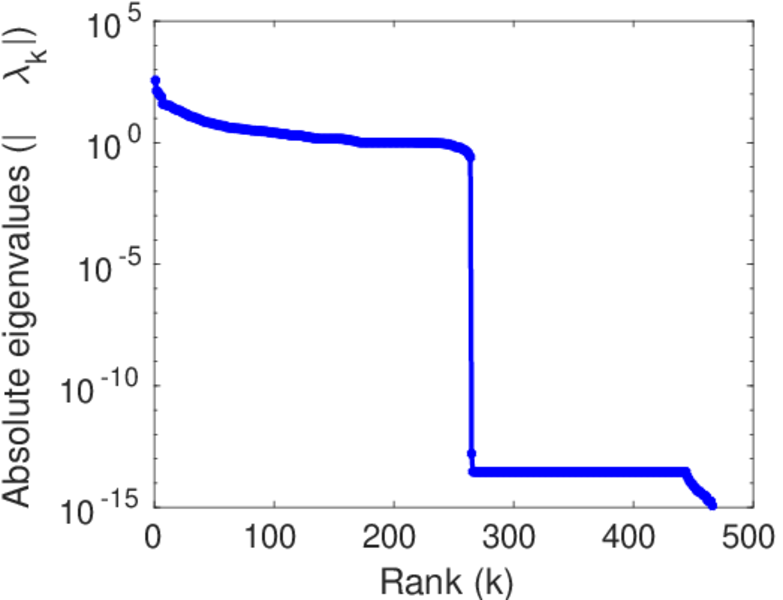
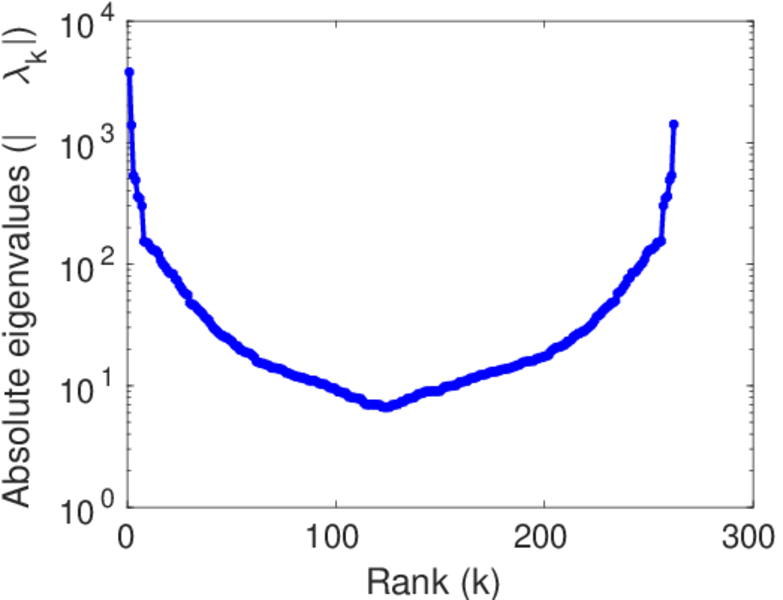
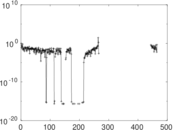
| Spectral norm | α = | 359.345
|
| Algebraic connectivity | a = | 0.021 891 3
|
| Spectral separation | |λ1[A] / λ2[A]| = | 2.682 03
|
| Controllability | C = | 3,216
|
| Relative controllability | Cr = | 0.858 516
|
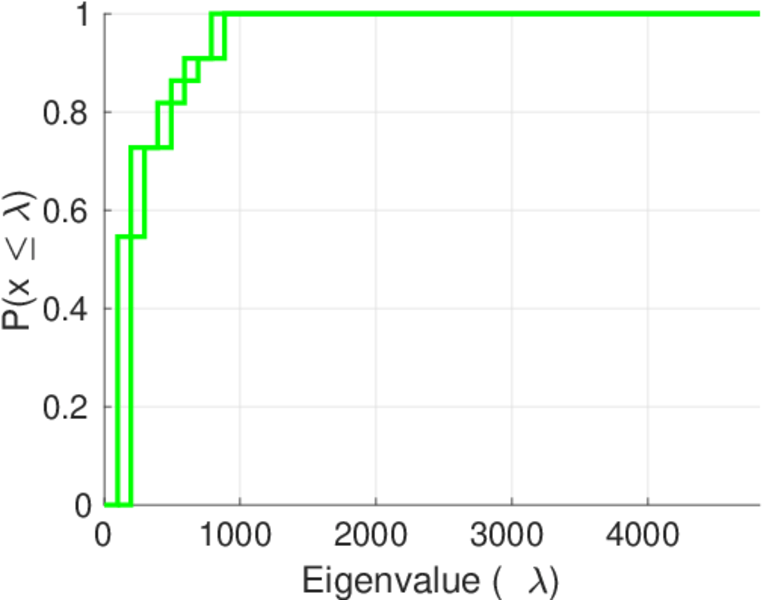
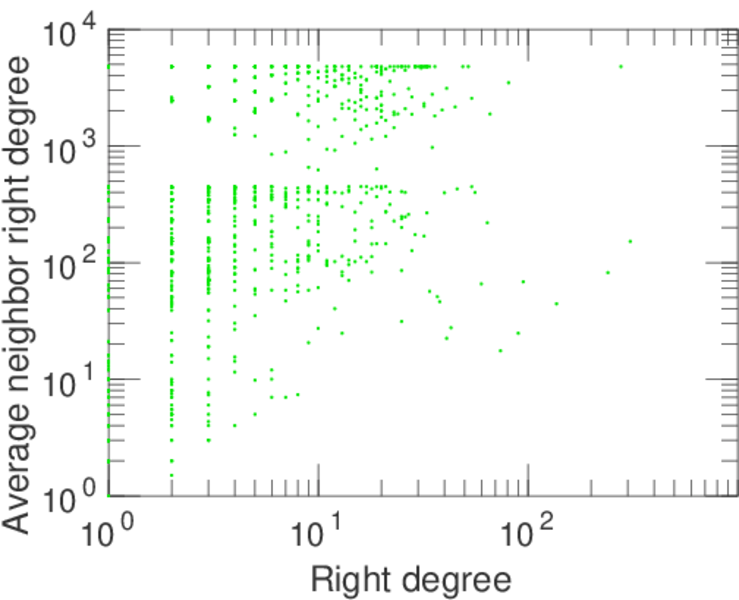
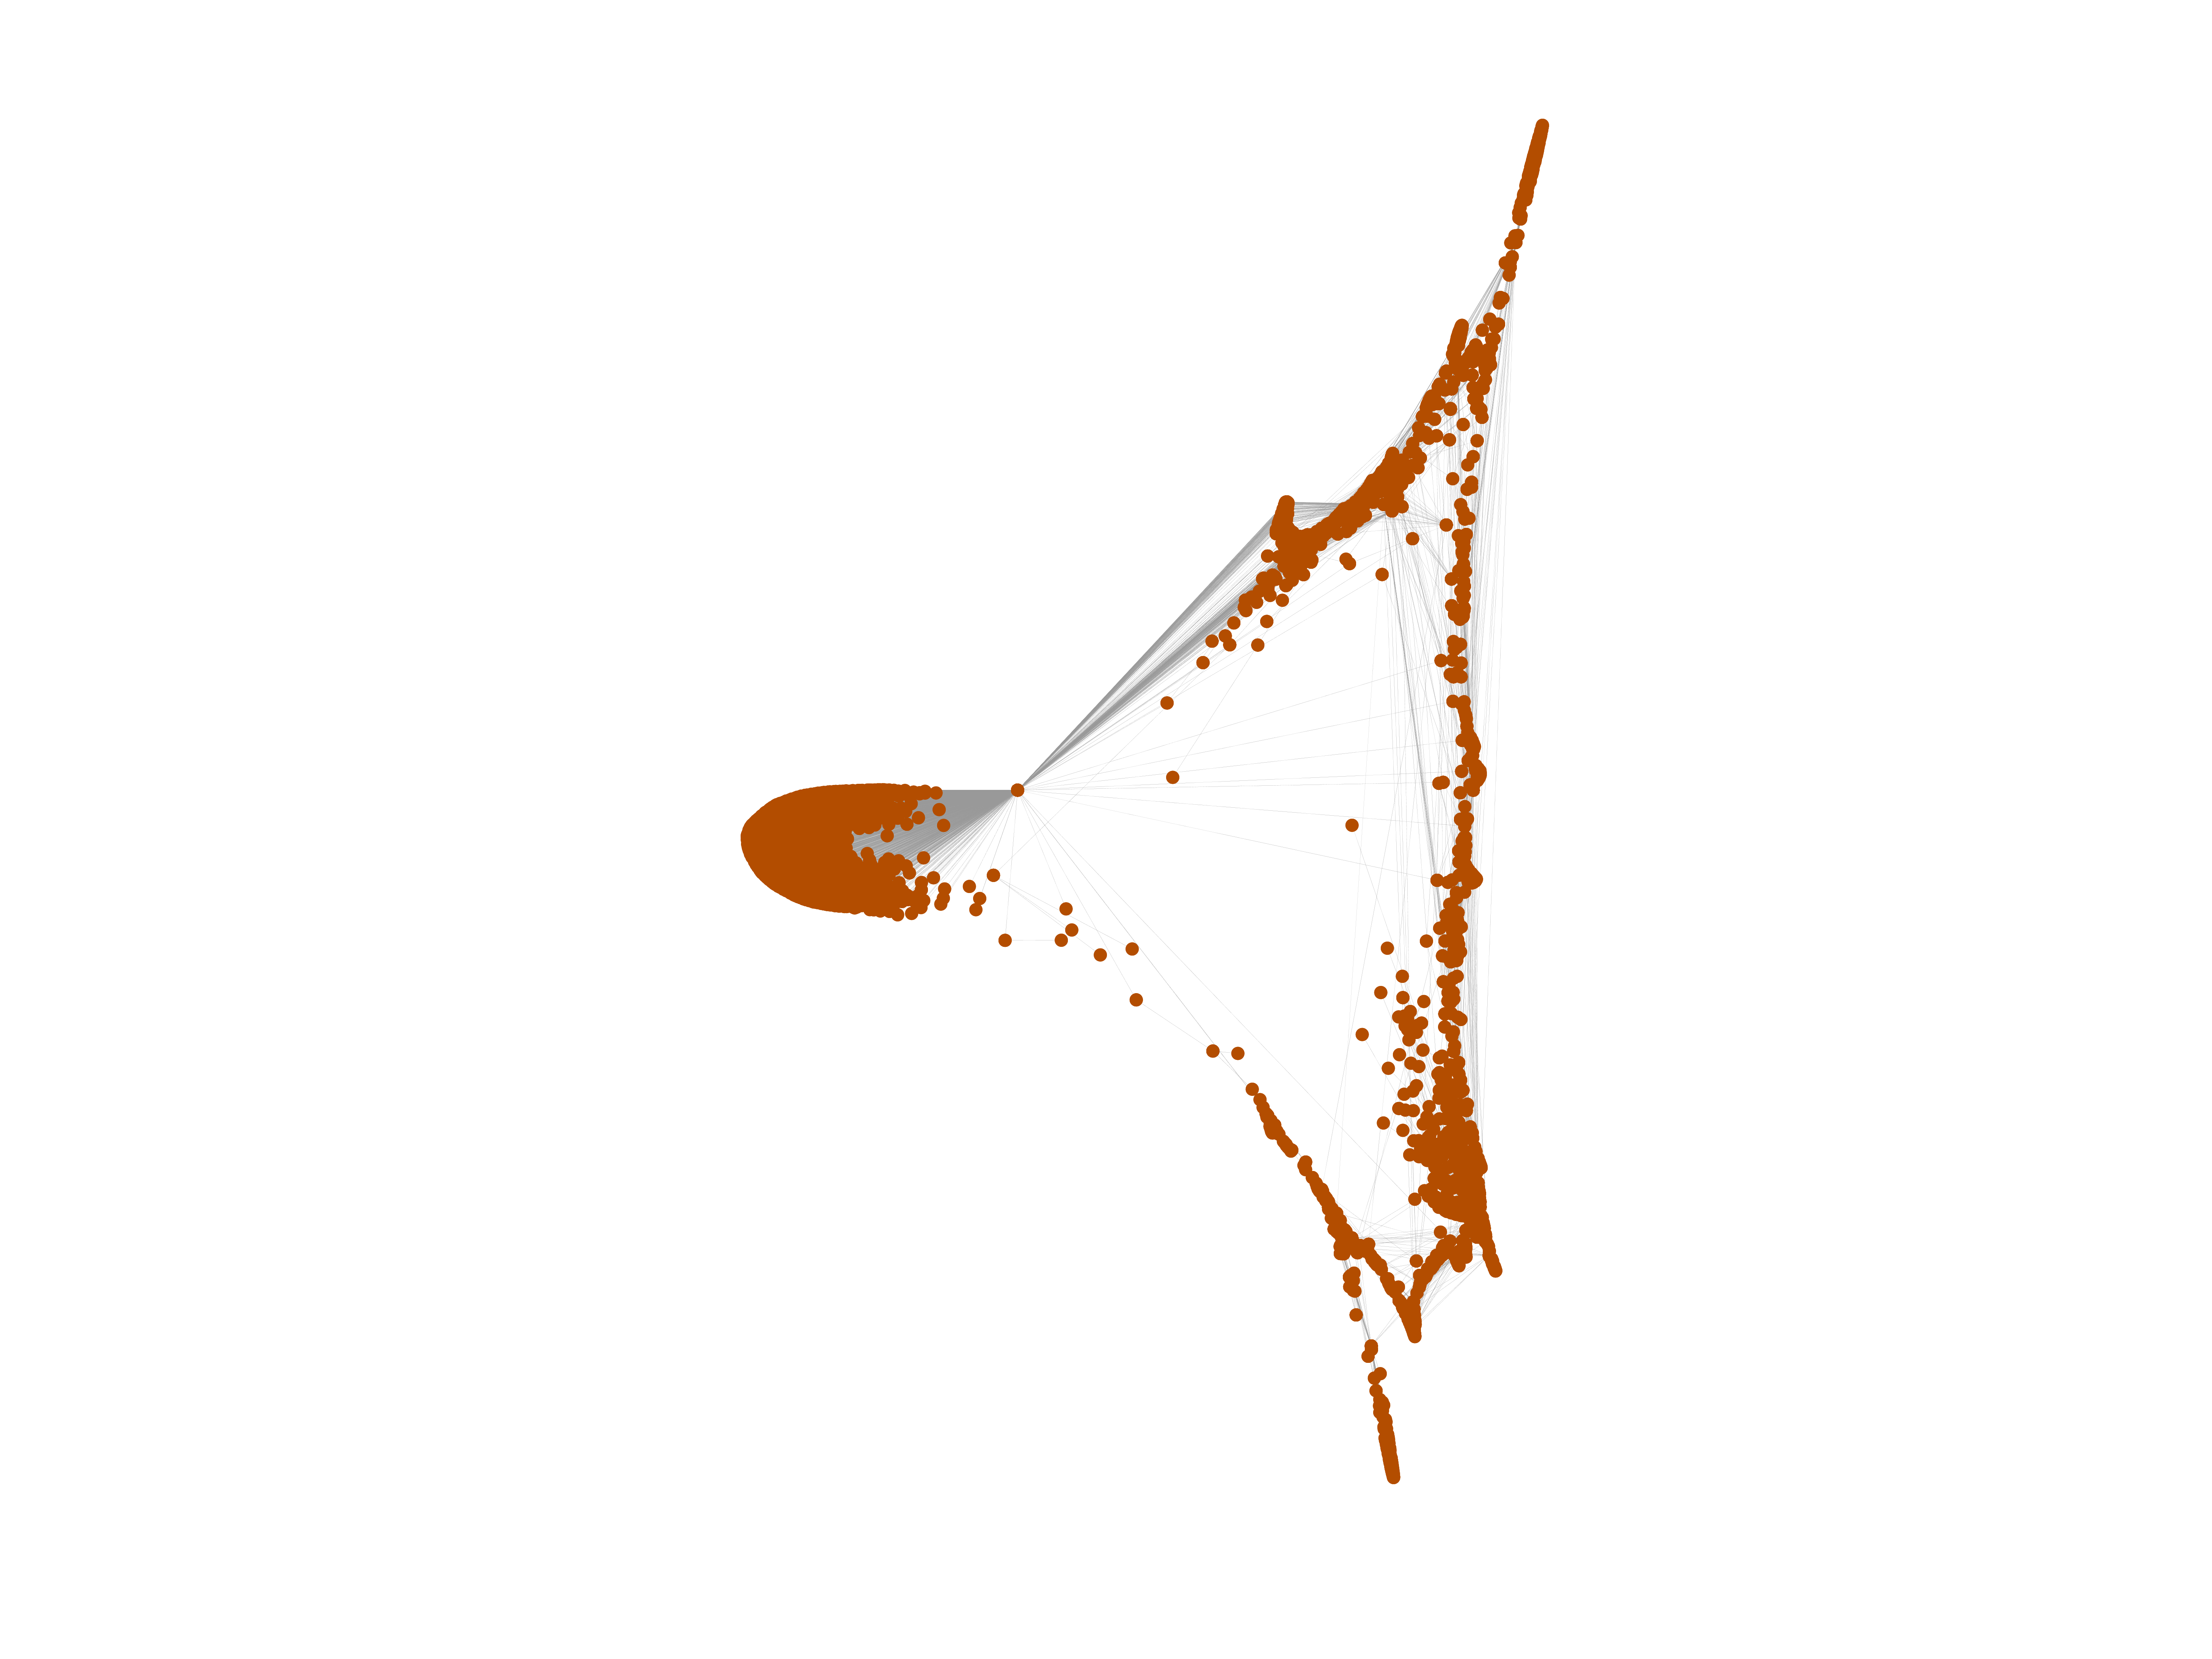
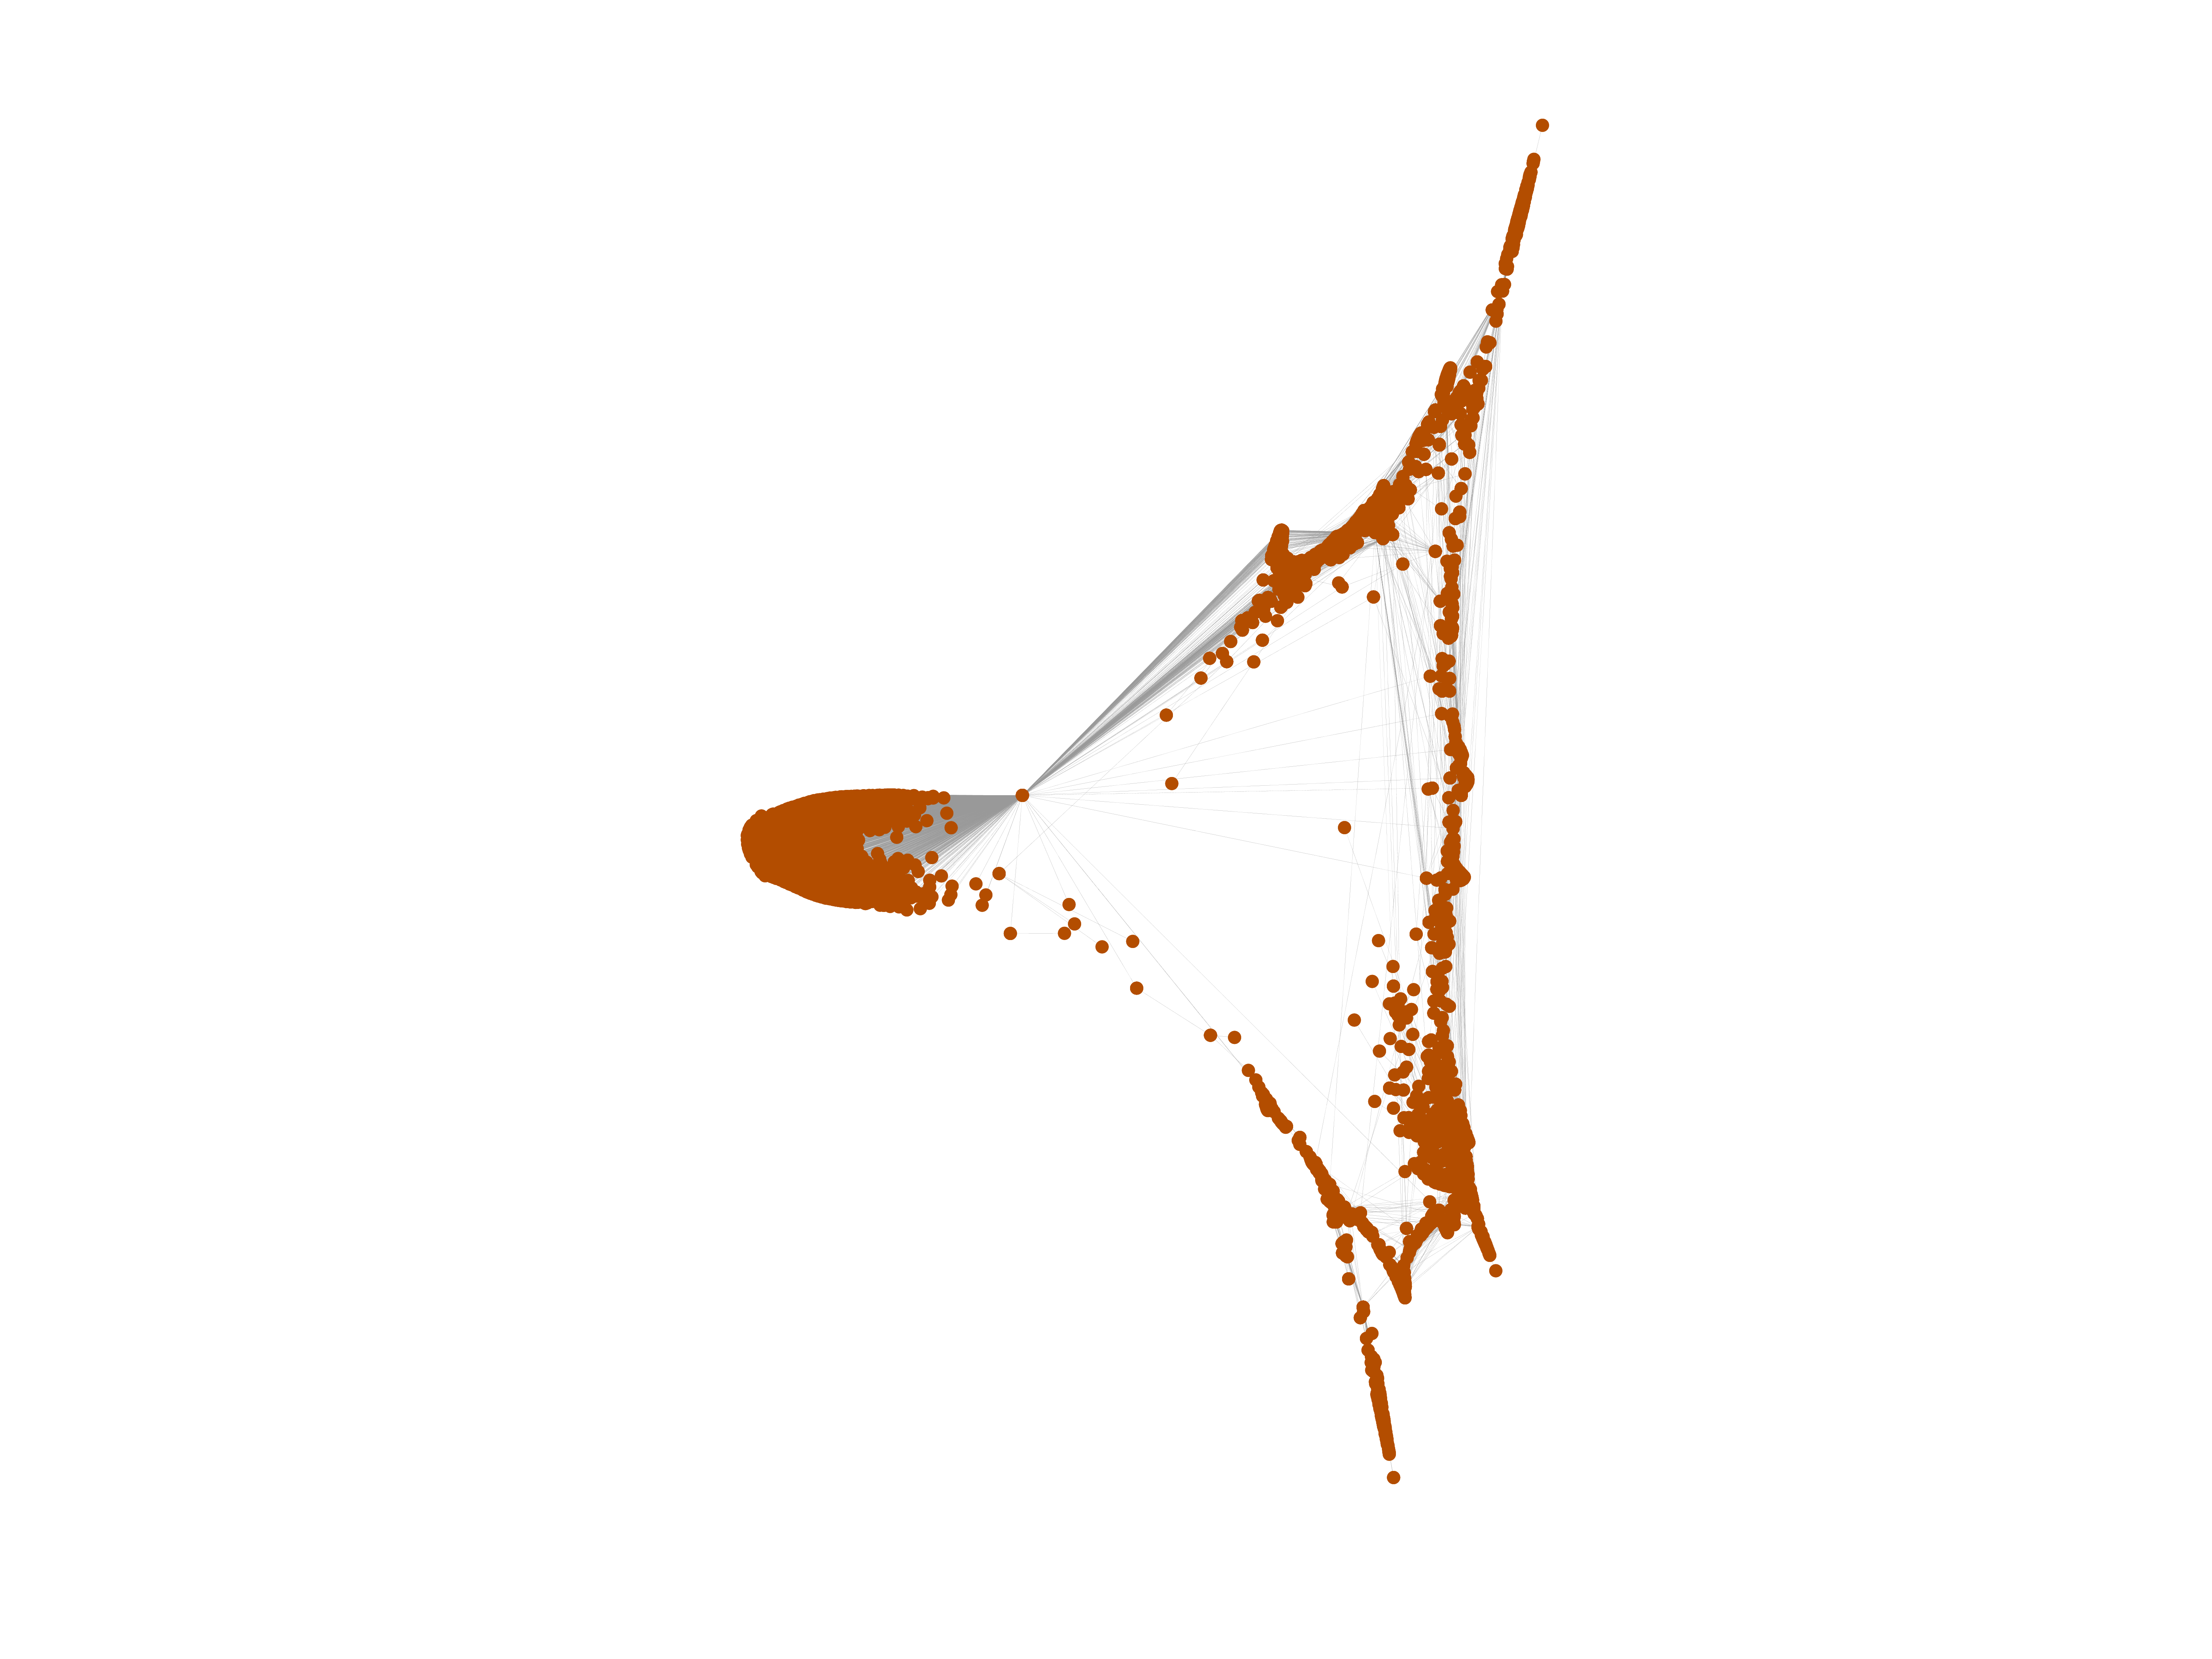
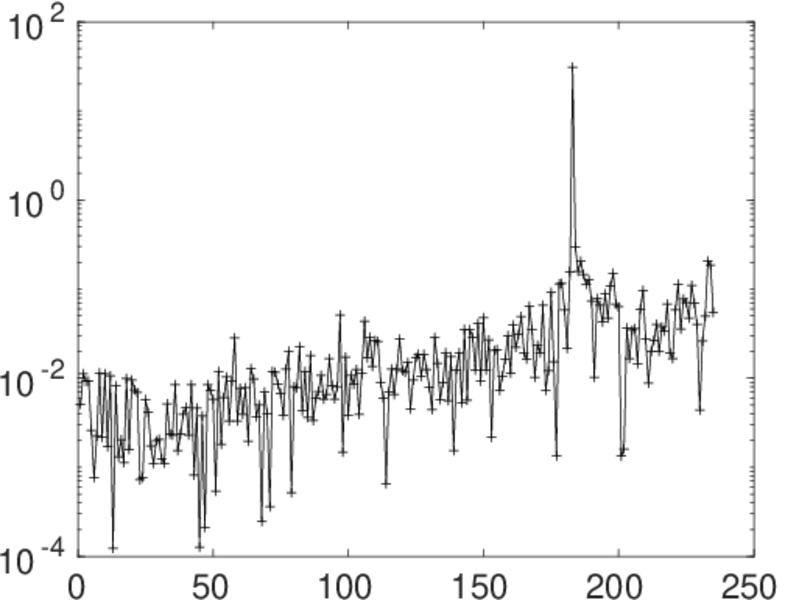
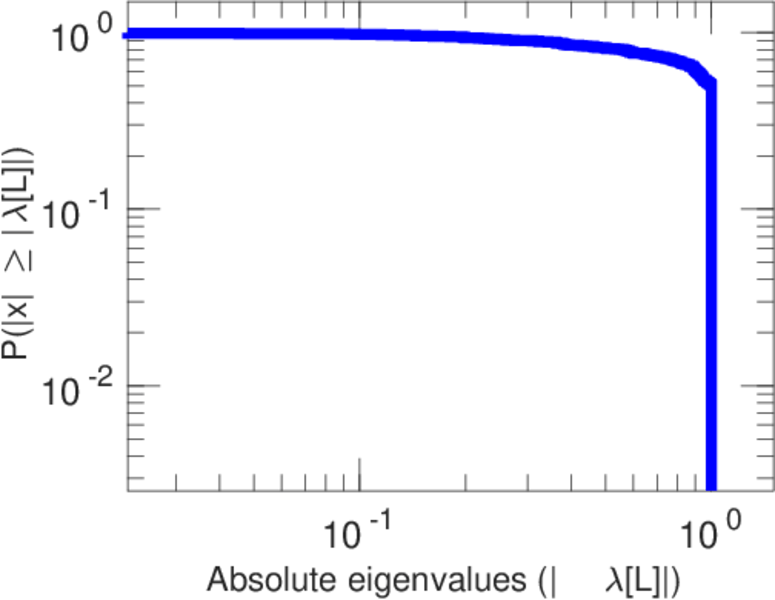
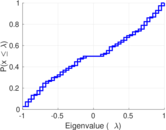
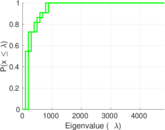
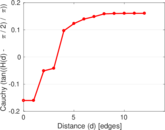
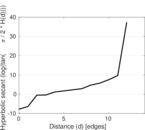
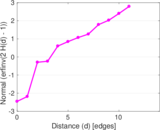
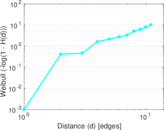
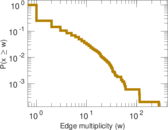
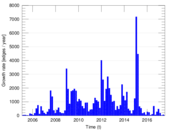
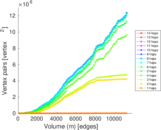
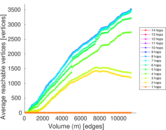
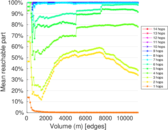
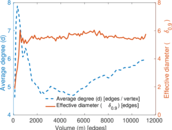
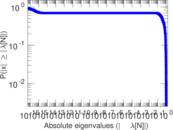
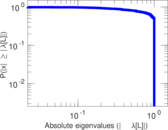
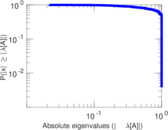
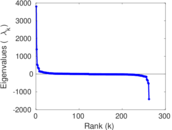
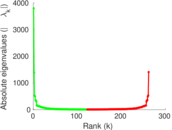
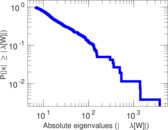
Plots


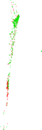


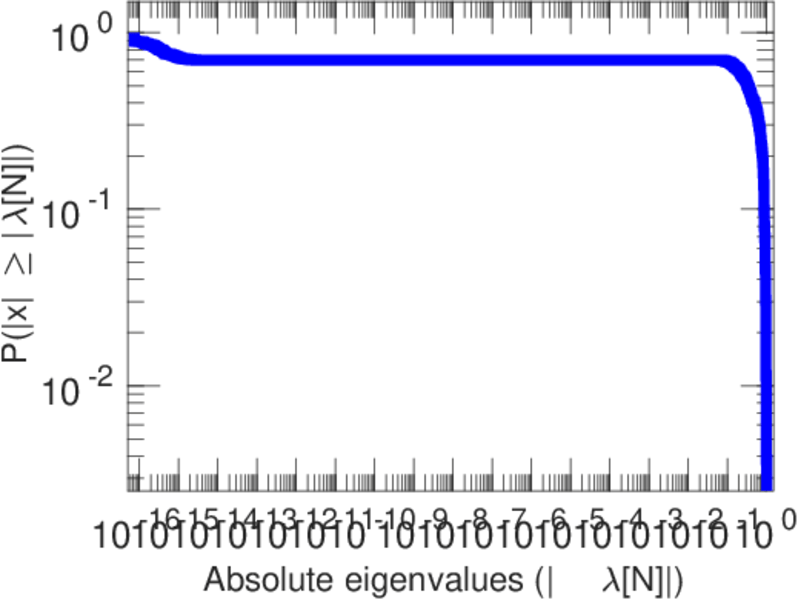
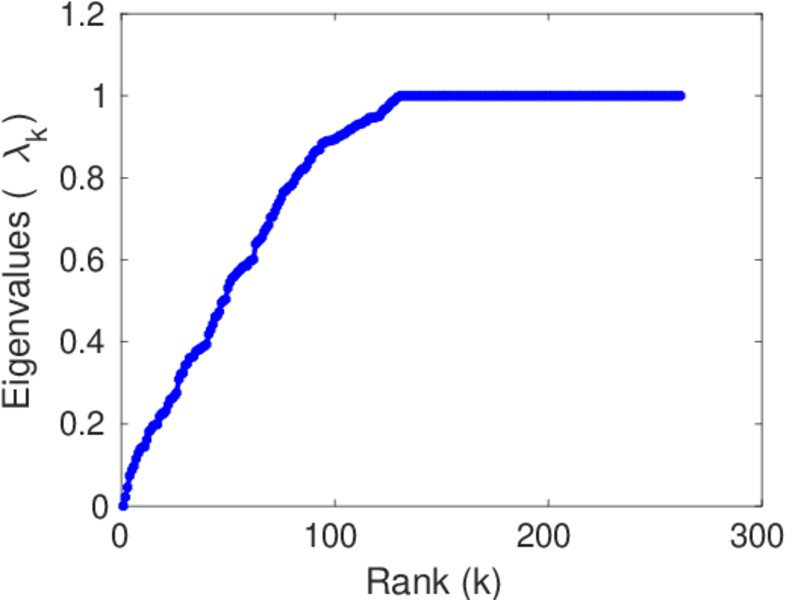
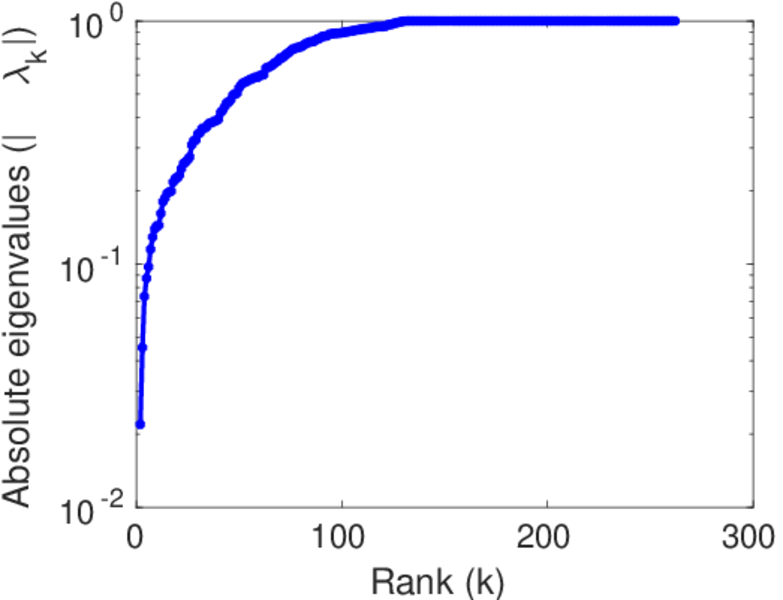
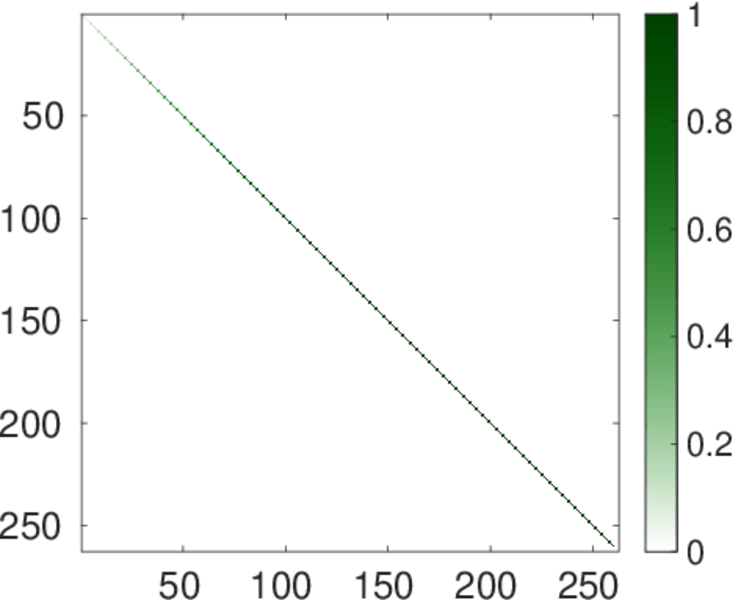
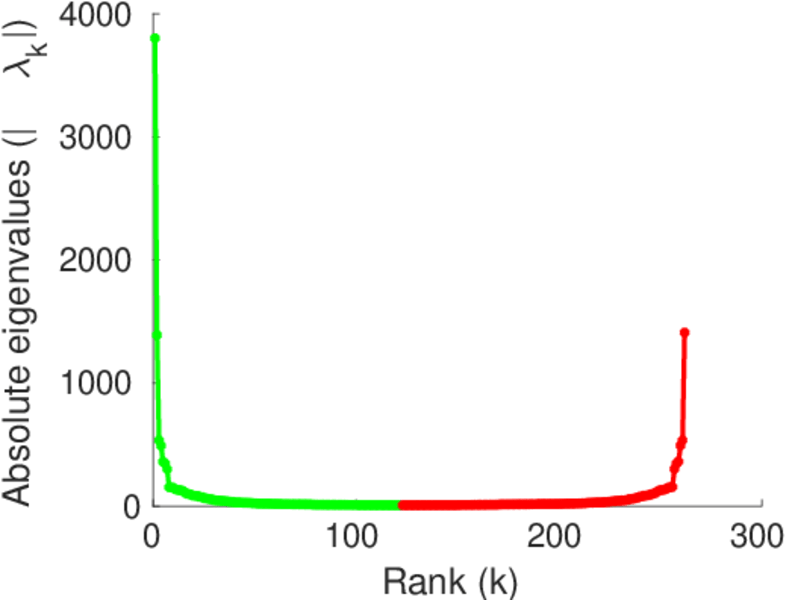
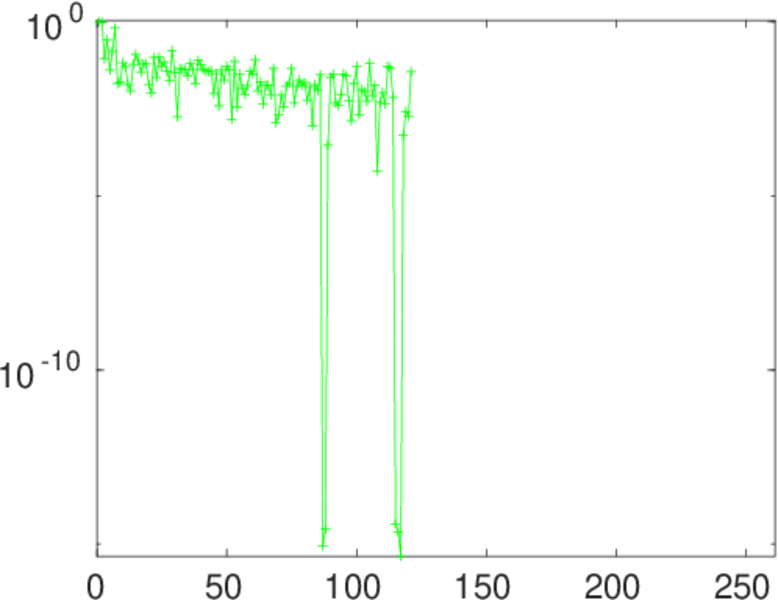
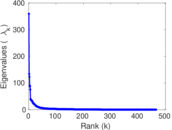
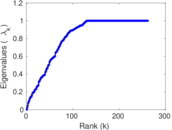
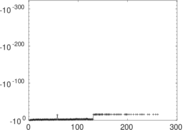
Matrix decompositions plots


Downloads
References
|
[1]
|
Jérôme Kunegis.
KONECT – The Koblenz Network Collection.
In Proc. Int. Conf. on World Wide Web Companion, pages
1343–1350, 2013.
[ http ]
|
|
[2]
|
Wikimedia Foundation.
Wikimedia downloads.
http://dumps.wikimedia.org/, January 2010.
|
 KONECT ‣ Networks ‣
Buy Me a Coffee
KONECT ‣ Networks ‣
Buy Me a Coffee