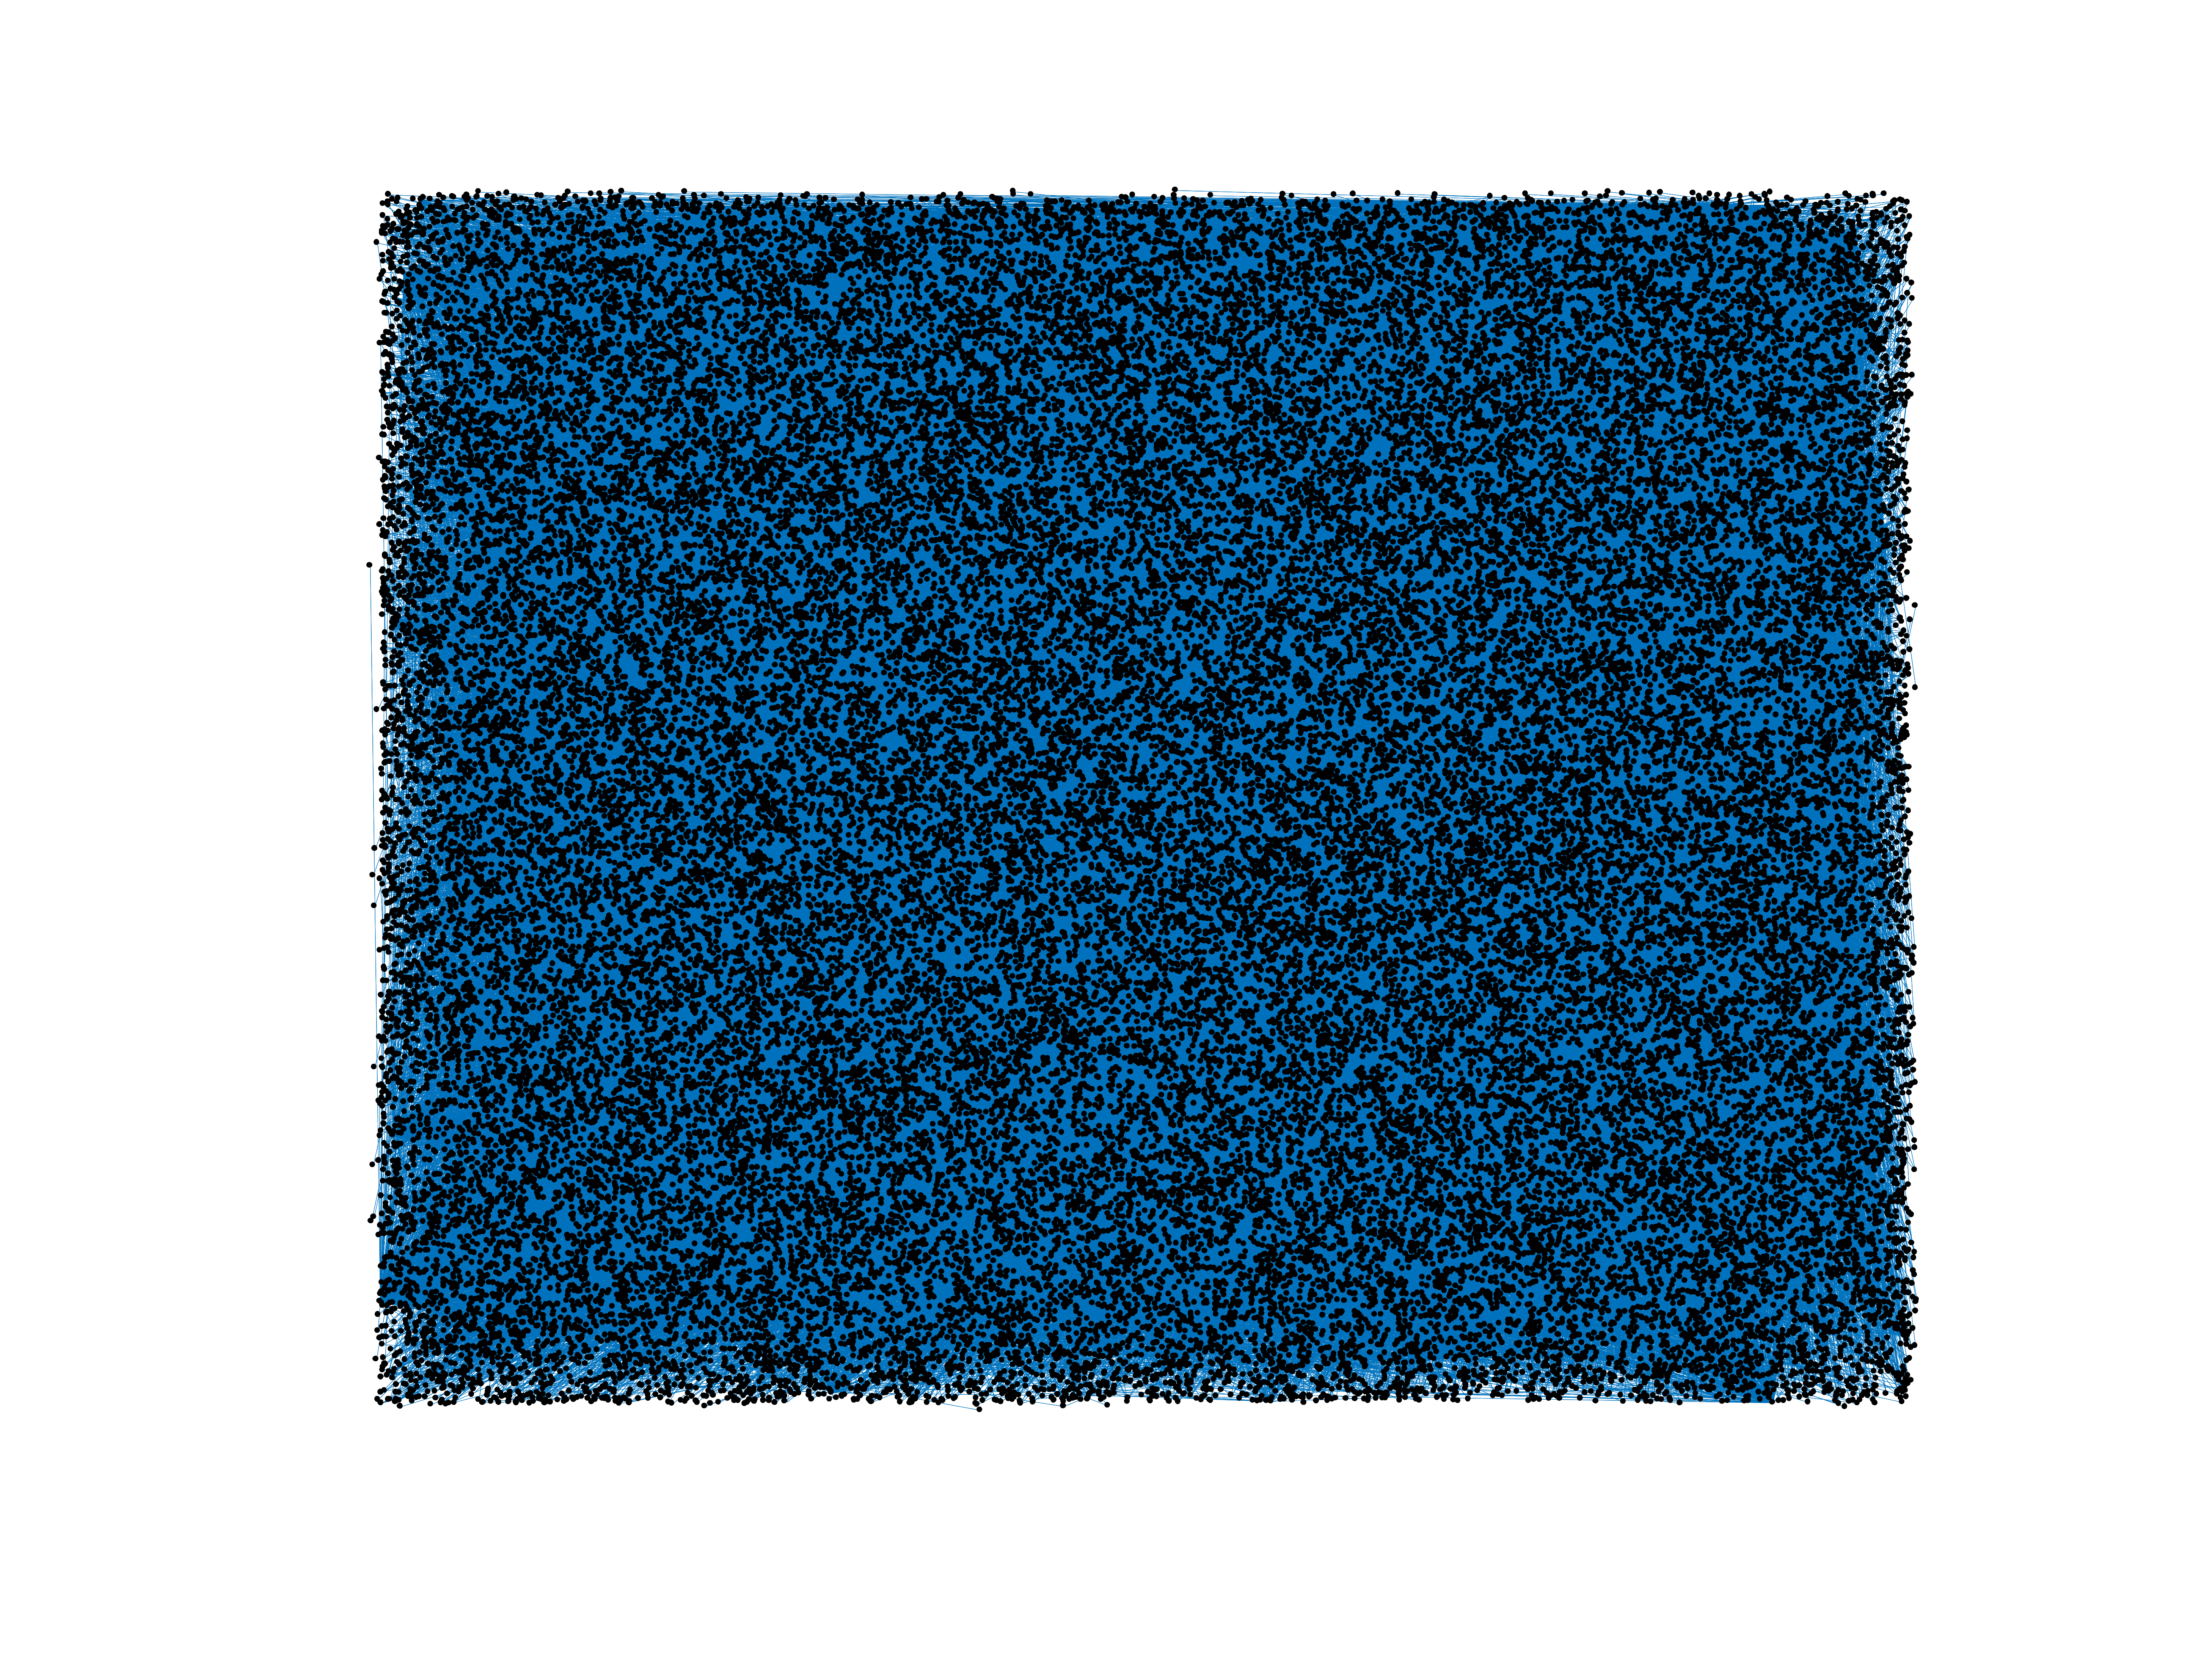
Wikiquote edits (te)
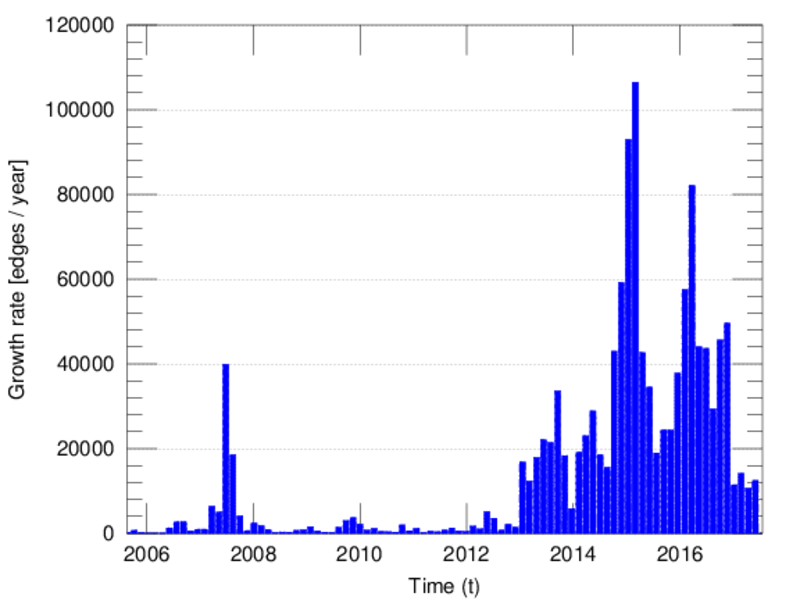
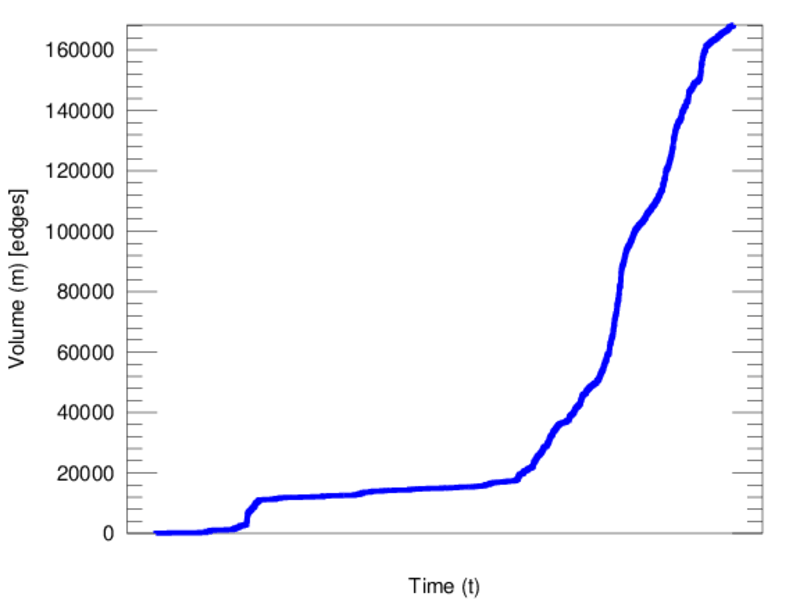
This is the bipartite edit network of the Telugu Wikisource. It contains users
and pages from the Telugu Wikisource, connected by edit events. Each edge
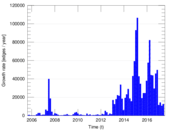
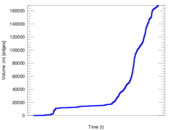
represents an edit. The dataset includes the timestamp of each edit.
Metadata
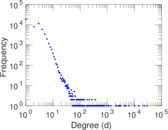
Statistics
| Size | n = | 54,263
|
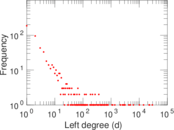
| Left size | n1 = | 649
|
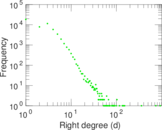
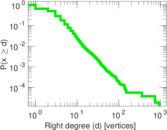
| Right size | n2 = | 53,614
|
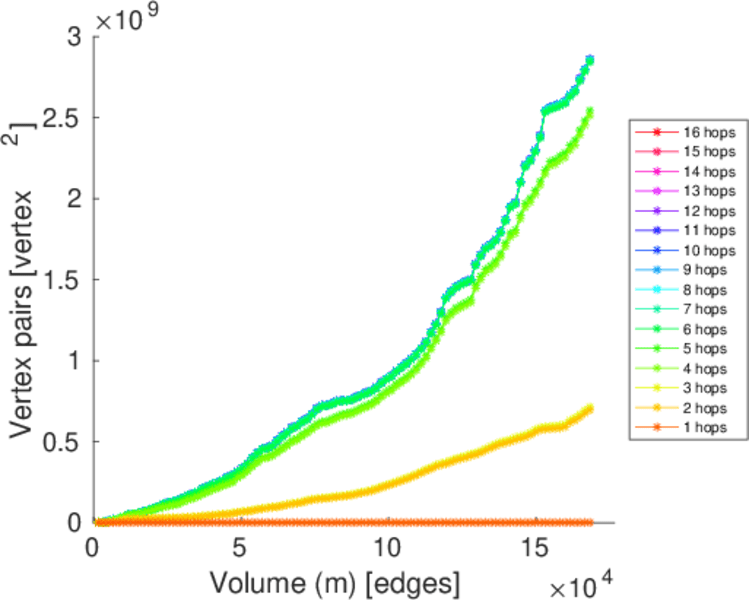
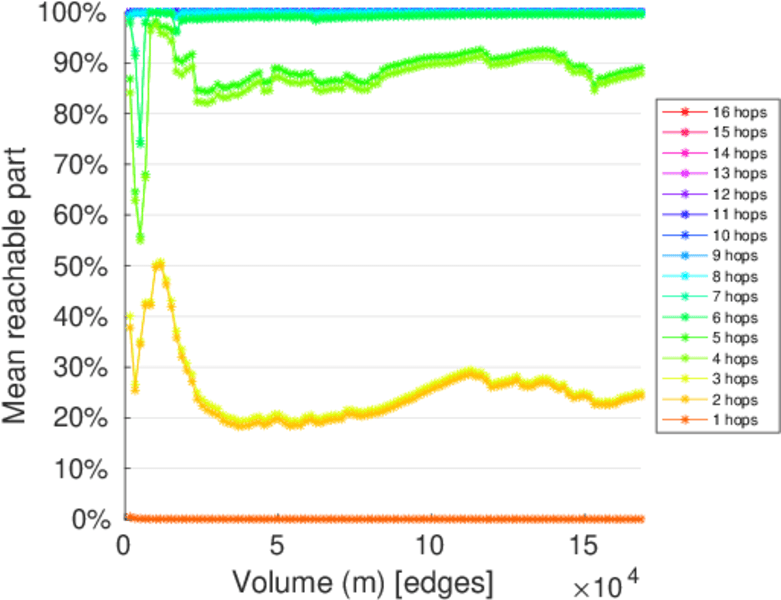
| Volume | m = | 168,296
|
| Unique edge count | m̿ = | 105,834
|
| Wedge count | s = | 458,170,784
|
| Claw count | z = | 2,116,343,002,054
|
| Cross count | x = | 8,356,449,439,287,824
|
| Square count | q = | 126,201,939
|
| 4-Tour count | T4 = | 2,842,526,044
|
| Maximum degree | dmax = | 29,288
|
| Maximum left degree | d1max = | 29,288
|
| Maximum right degree | d2max = | 925
|
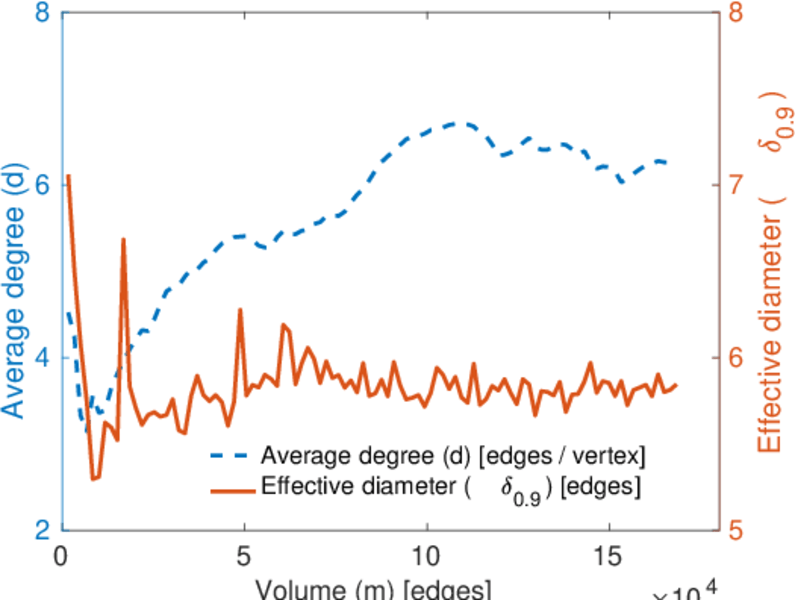
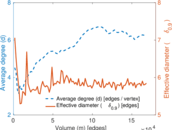
| Average degree | d = | 6.202 97
|
| Average left degree | d1 = | 259.316
|
| Average right degree | d2 = | 3.139 03
|
| Fill | p = | 0.003 041 60
|
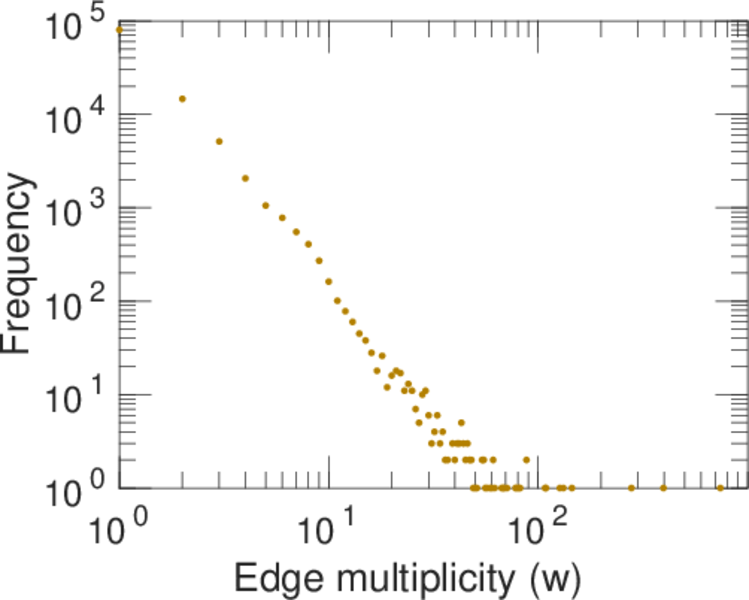
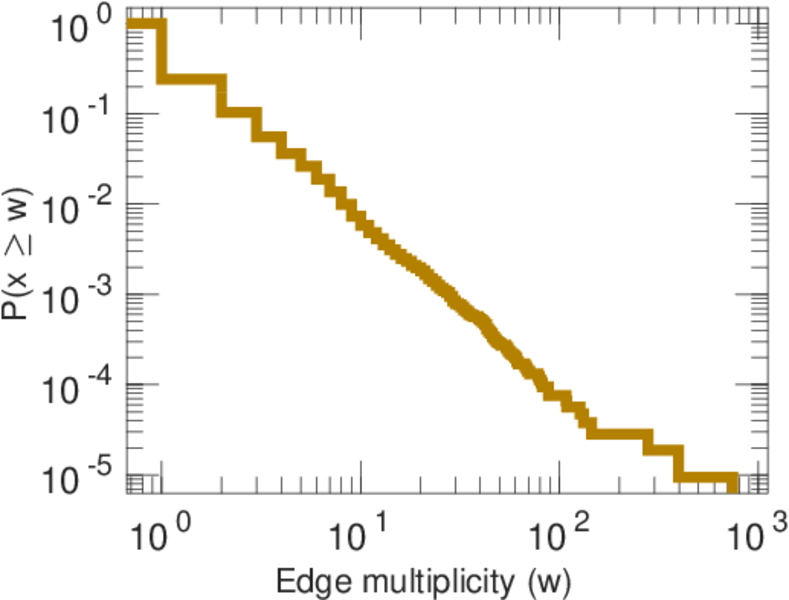
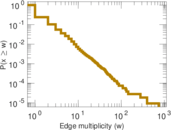
| Average edge multiplicity | m̃ = | 1.590 19
|
| Size of LCC | N = | 53,459
|
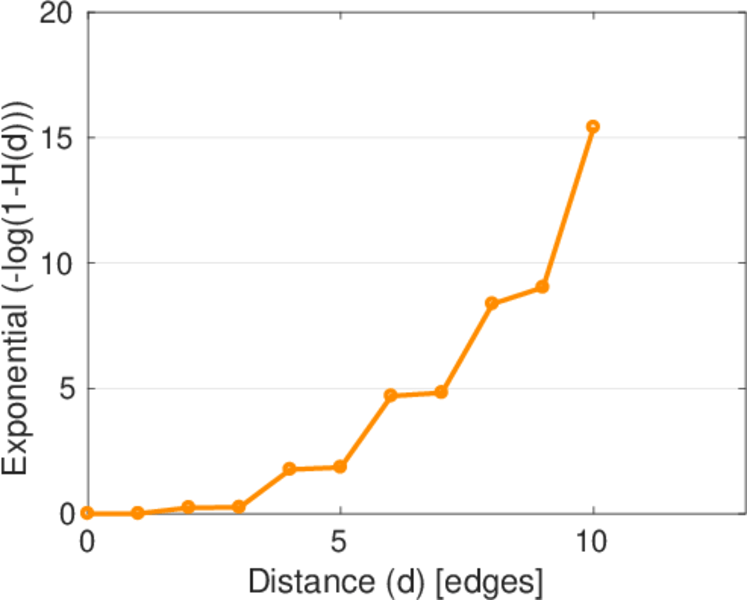
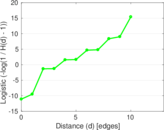
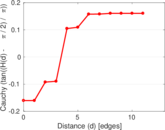
| Diameter | δ = | 14
|
| 50-Percentile effective diameter | δ0.5 = | 3.461 60
|
| 90-Percentile effective diameter | δ0.9 = | 5.390 26
|
| Median distance | δM = | 4
|
| Mean distance | δm = | 3.918 83
|
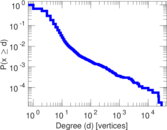
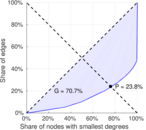
| Gini coefficient | G = | 0.708 637
|
| Balanced inequality ratio | P = | 0.237 255
|
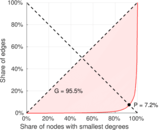
| Left balanced inequality ratio | P1 = | 0.072 473 5
|
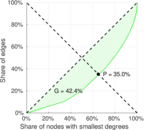
| Right balanced inequality ratio | P2 = | 0.349 866
|
| Relative edge distribution entropy | Her = | 0.704 148
|
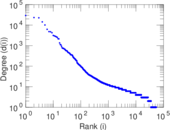
| Power law exponent | γ = | 2.790 32
|
| Tail power law exponent | γt = | 4.651 00
|
| Tail power law exponent with p | γ3 = | 4.651 00
|
| p-value | p = | 0.000 00
|
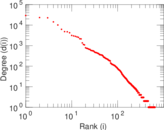
| Left tail power law exponent with p | γ3,1 = | 1.451 00
|
| Left p-value | p1 = | 0.010 000 0
|
| Right tail power law exponent with p | γ3,2 = | 7.431 00
|
| Right p-value | p2 = | 0.000 00
|
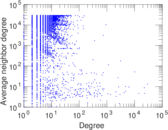
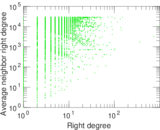
| Degree assortativity | ρ = | +0.099 089 1
|
| Degree assortativity p-value | pρ = | 4.309 29 × 10−229
|
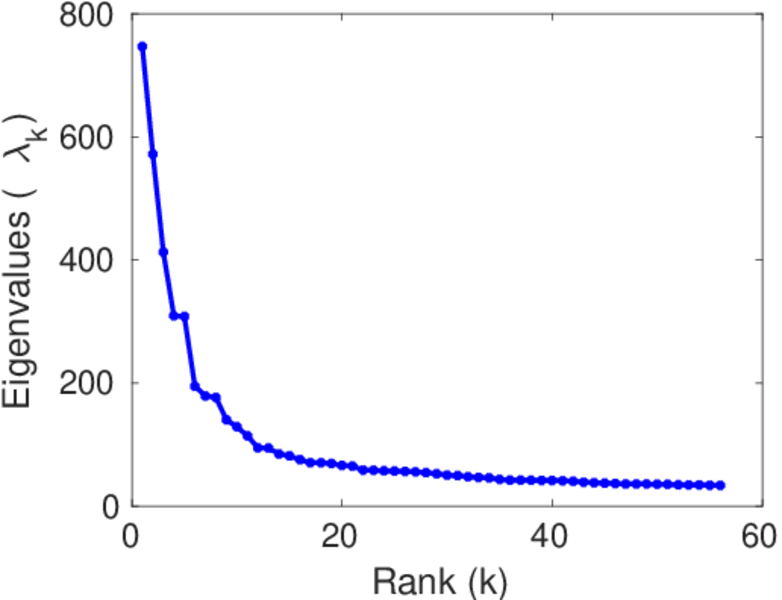
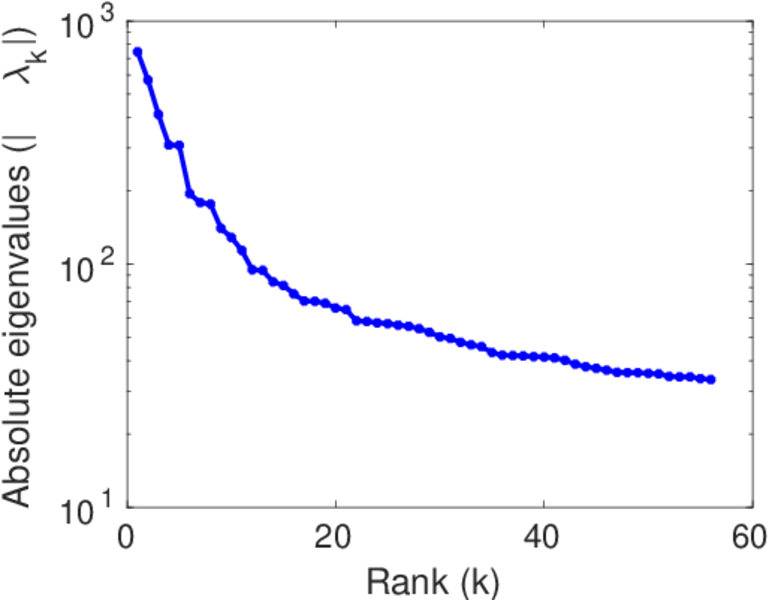
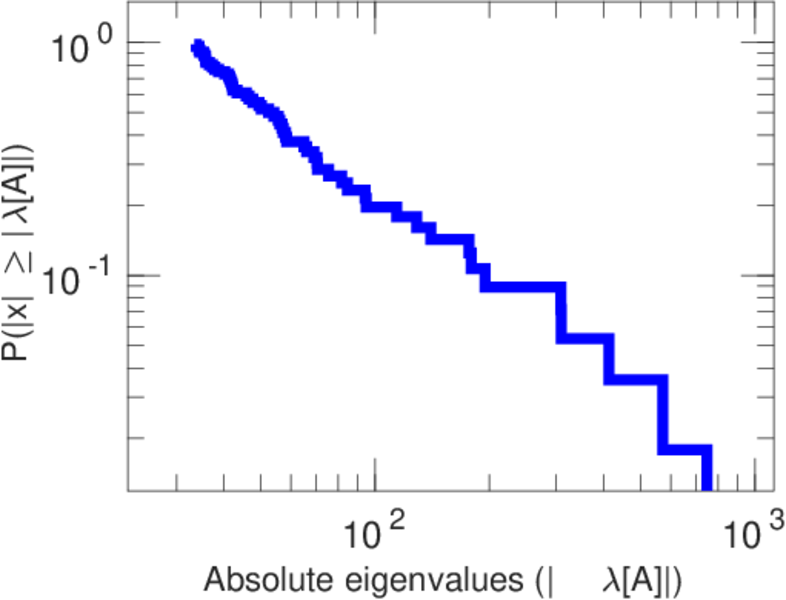
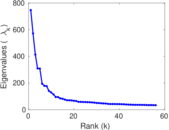
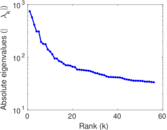
| Spectral norm | α = | 746.591
|
| Algebraic connectivity | a = | 0.020 578 1
|
| Spectral separation | |λ1[A] / λ2[A]| = | 1.306 43
|
| Controllability | C = | 52,590
|
| Relative controllability | Cr = | 0.977 546
|
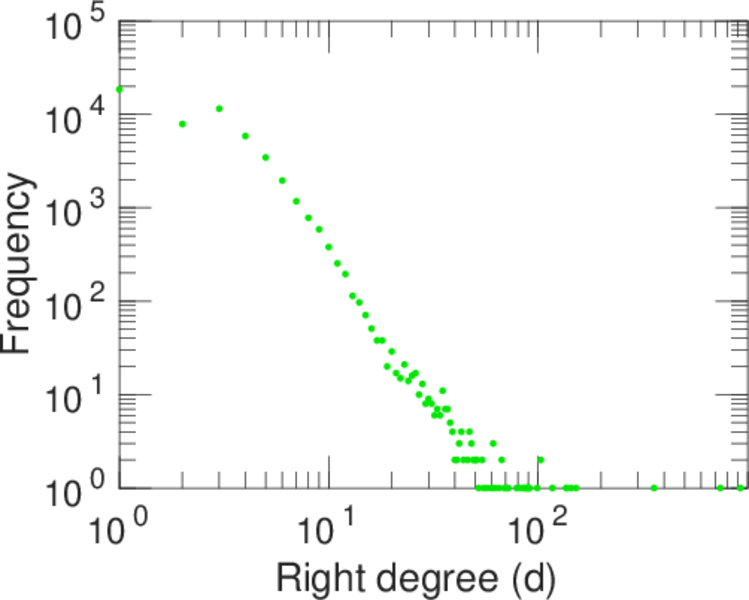
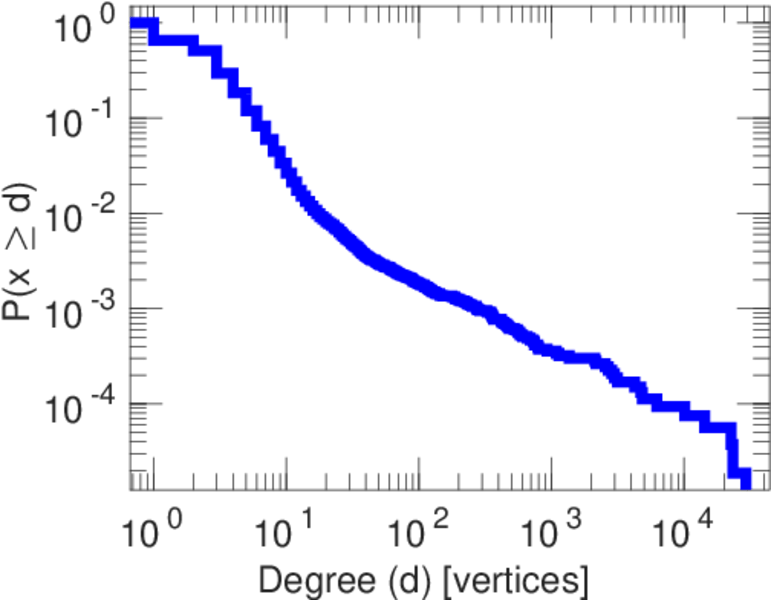
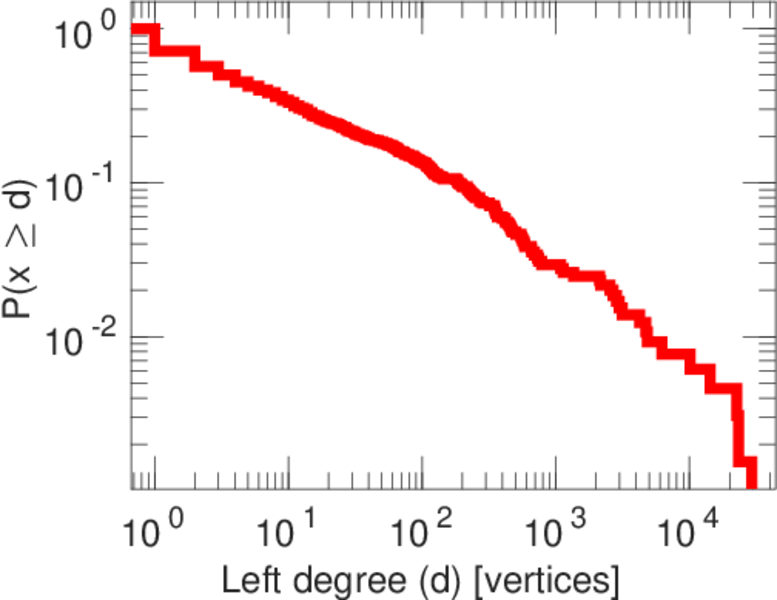
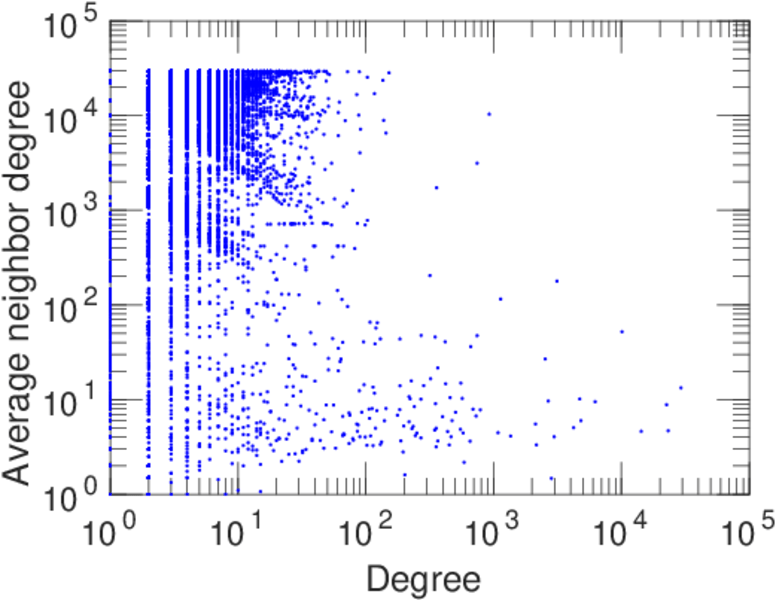
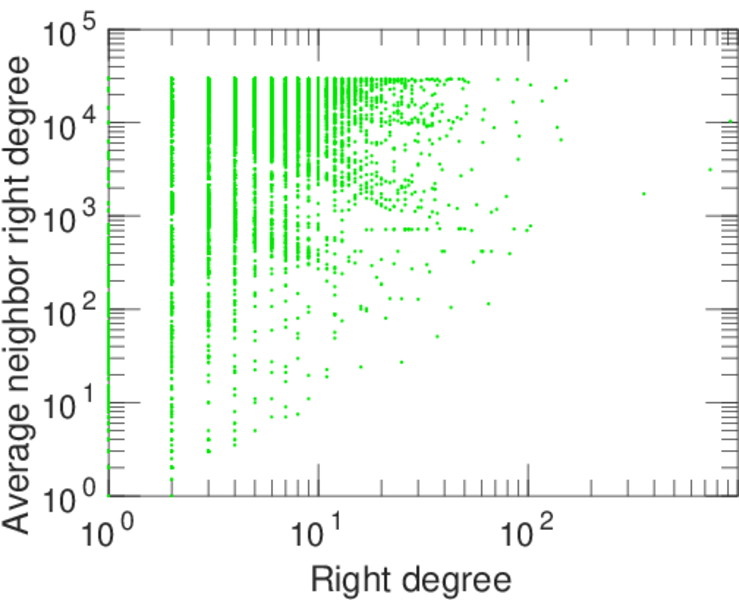
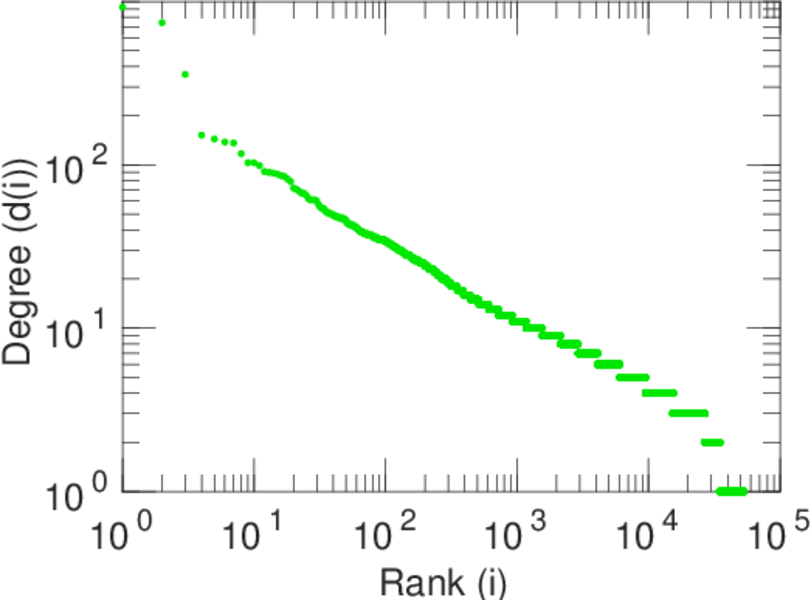
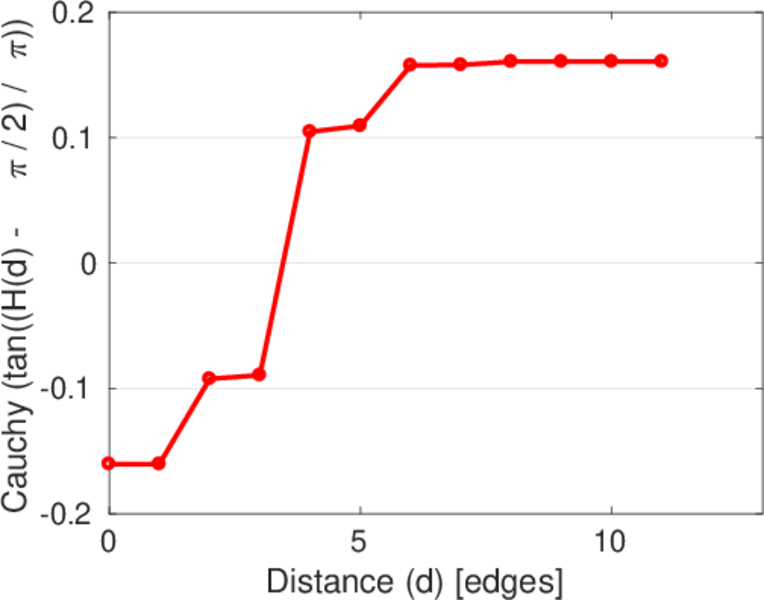
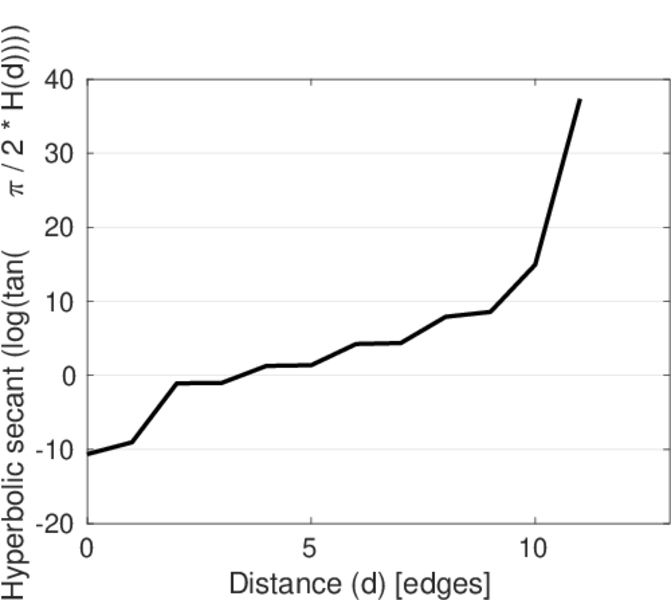
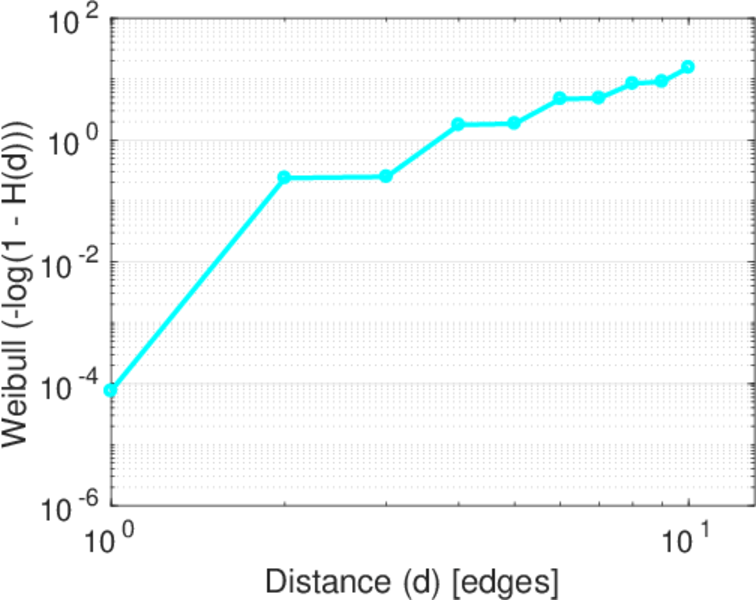
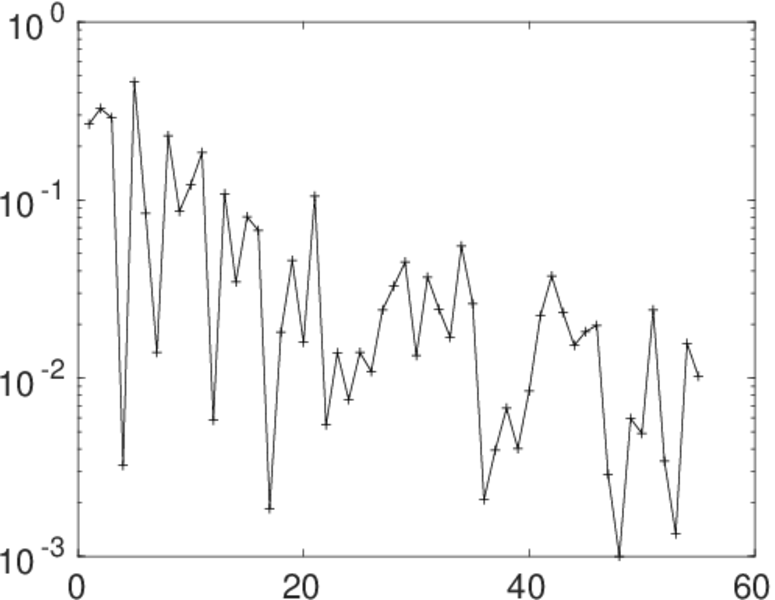
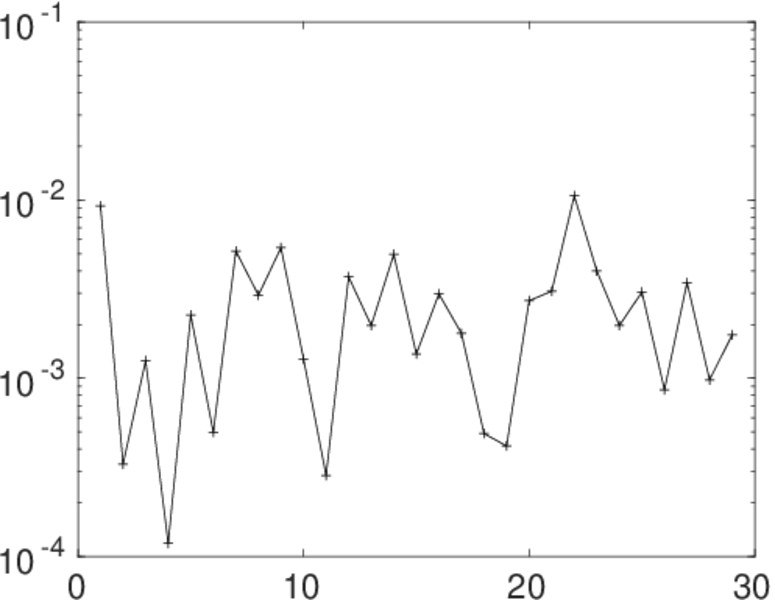
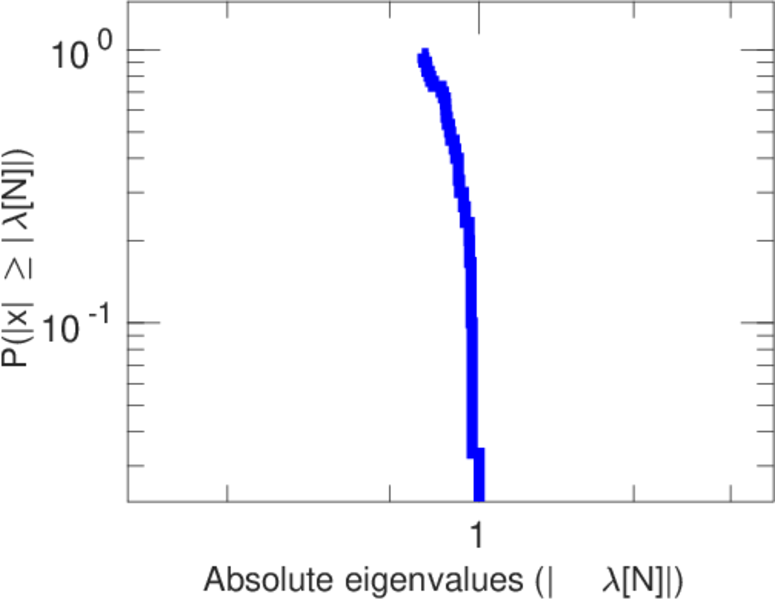
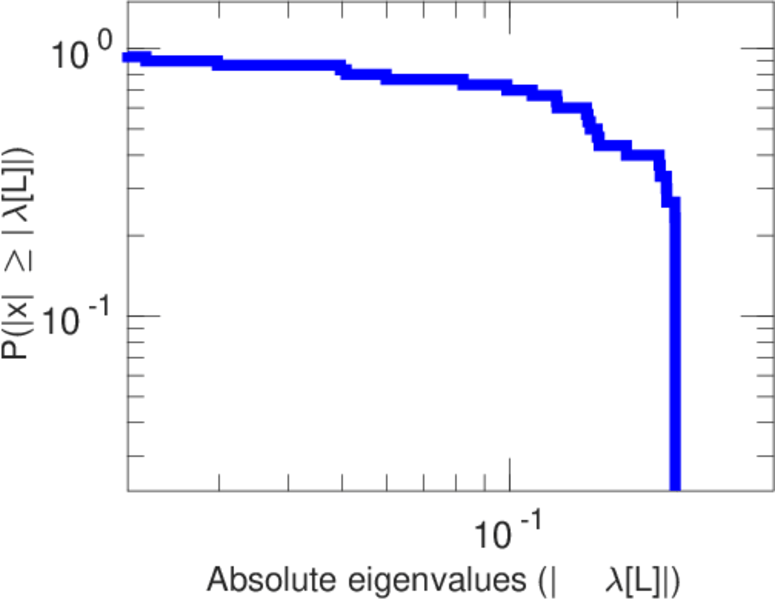
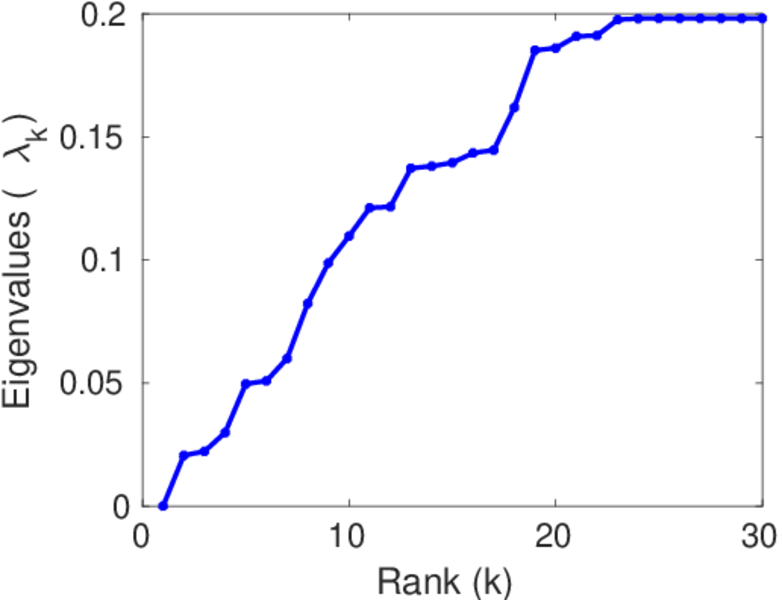
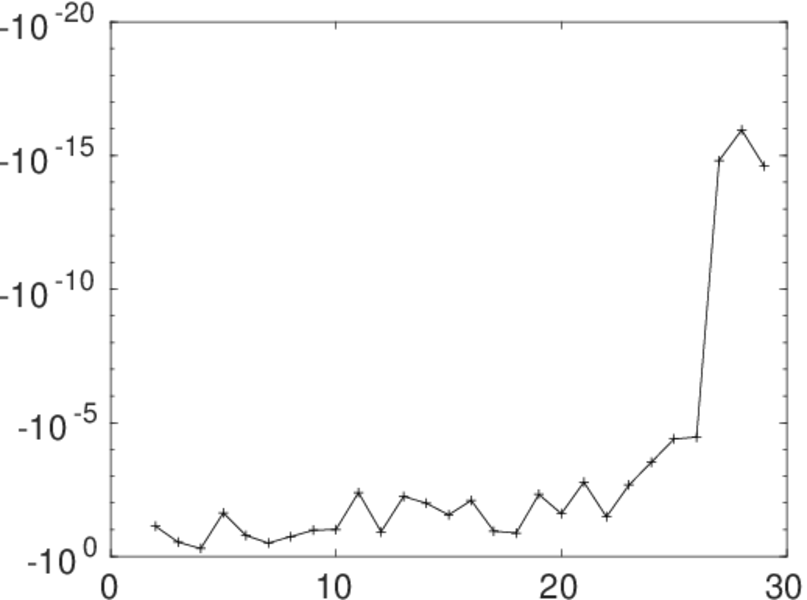
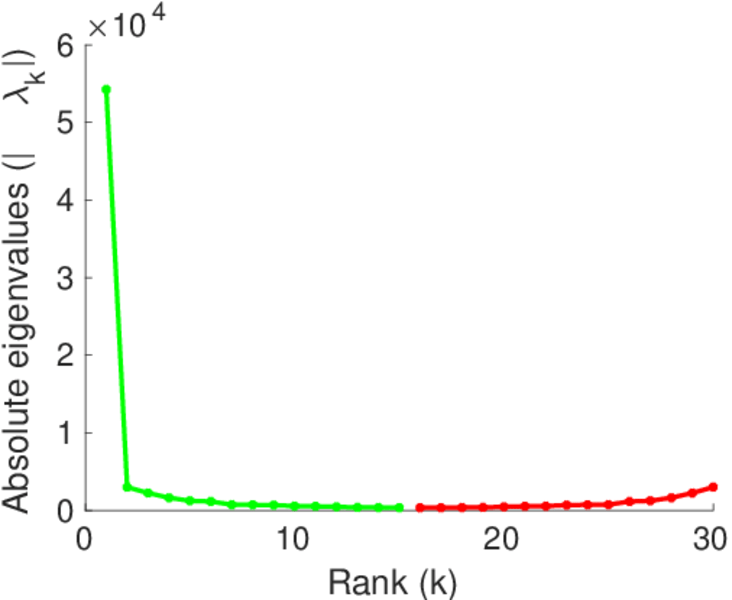
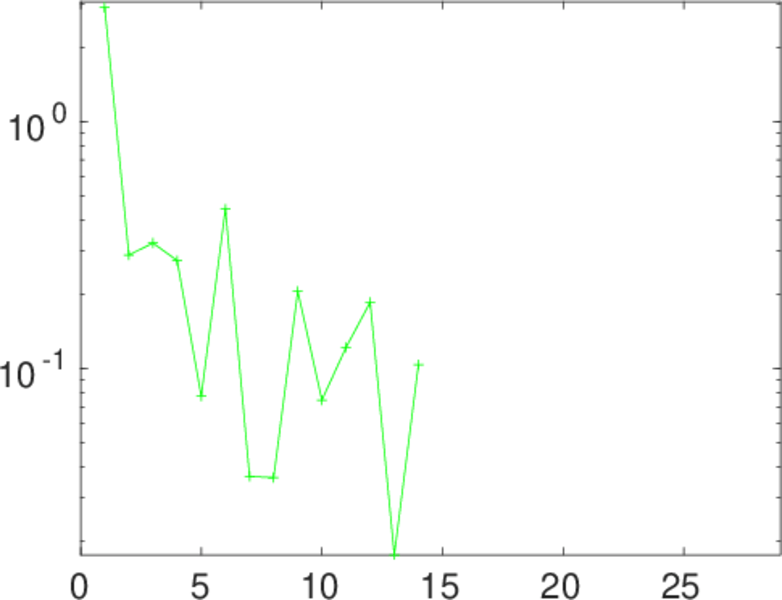
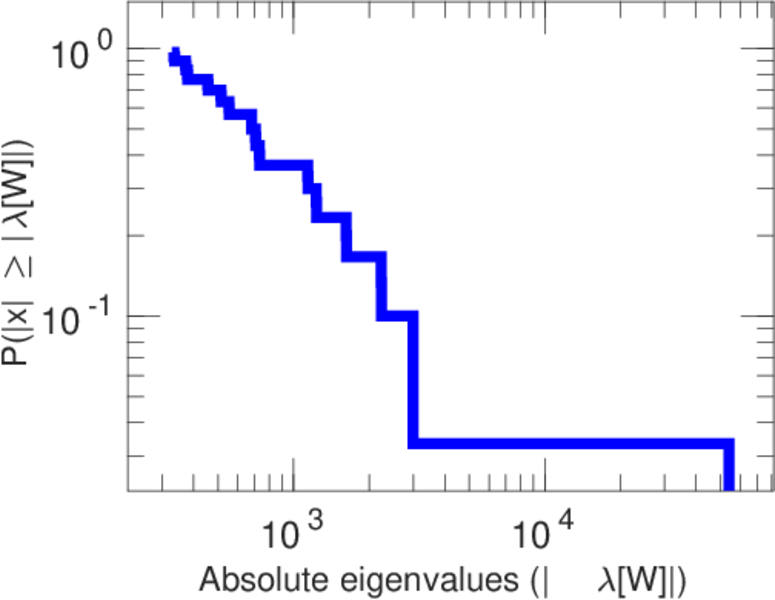
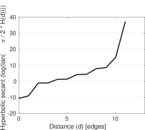
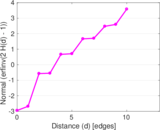
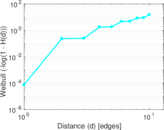
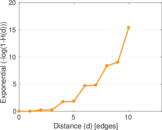
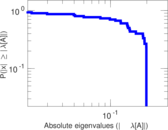
Plots


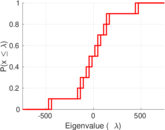
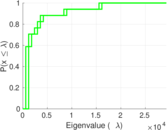


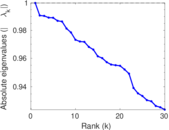
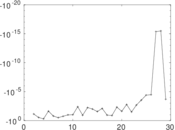
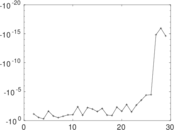
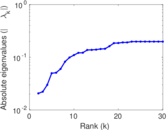
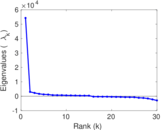
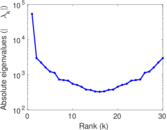
Matrix decompositions plots


Downloads
References
|
[1]
|
Jérôme Kunegis.
KONECT – The Koblenz Network Collection.
In Proc. Int. Conf. on World Wide Web Companion, pages
1343–1350, 2013.
[ http ]
|
|
[2]
|
Wikimedia Foundation.
Wikimedia downloads.
http://dumps.wikimedia.org/, January 2010.
|
 KONECT ‣ Networks ‣
Buy Me a Coffee
KONECT ‣ Networks ‣
Buy Me a Coffee