Wiktionary edits (te)
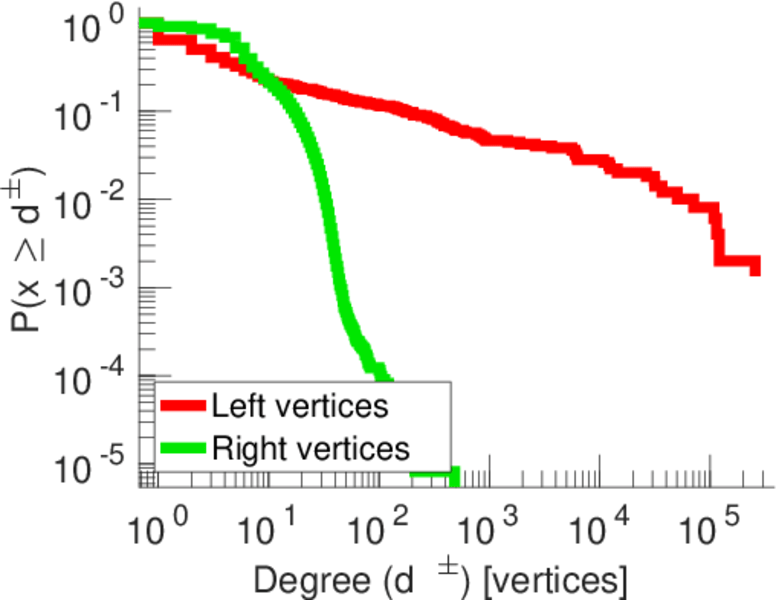
This is the bipartite edit network of the Telugu Wiktionary. It contains users
and pages from the Telugu Wiktionary, connected by edit events. Each edge
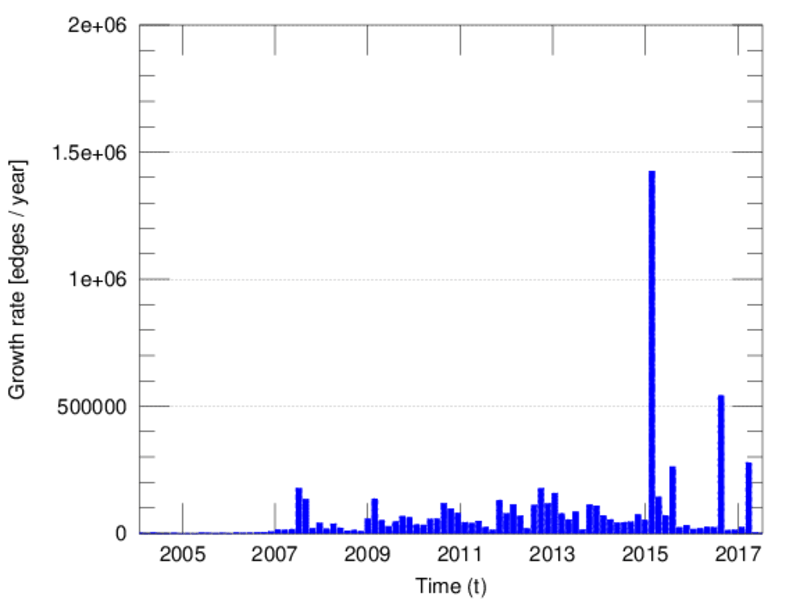
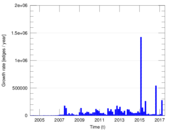
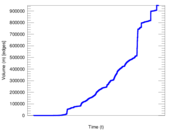
represents an edit. The dataset includes the timestamp of each edit.
Metadata
Statistics
| Size | n = | 121,969
|
| Left size | n1 = | 494
|
| Right size | n2 = | 121,475
|
| Volume | m = | 948,302
|
| Unique edge count | m̿ = | 529,573
|
| Wedge count | s = | 16,121,252,572
|
| Claw count | z = | 470,778,798,199,590
|
| Square count | q = | 17,385,311,138
|
| 4-Tour count | T4 = | 203,568,560,114
|
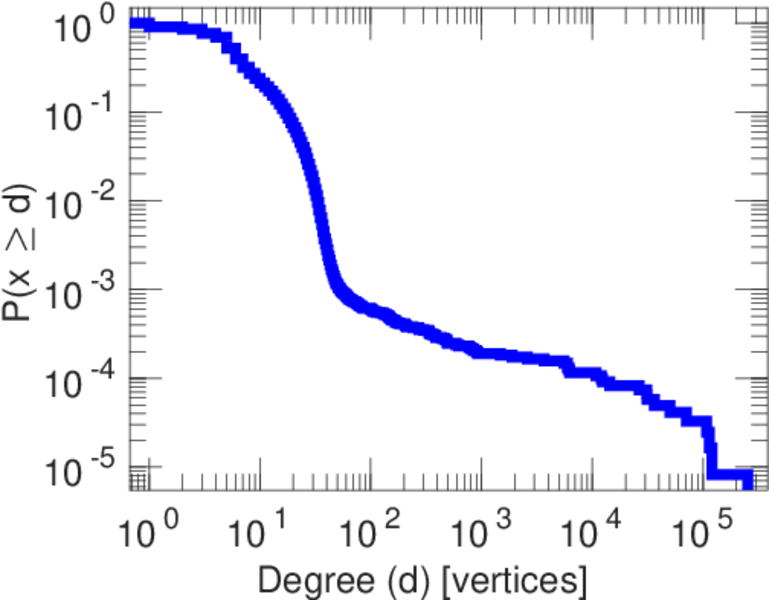
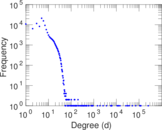
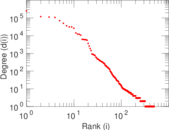
| Maximum degree | dmax = | 254,492
|
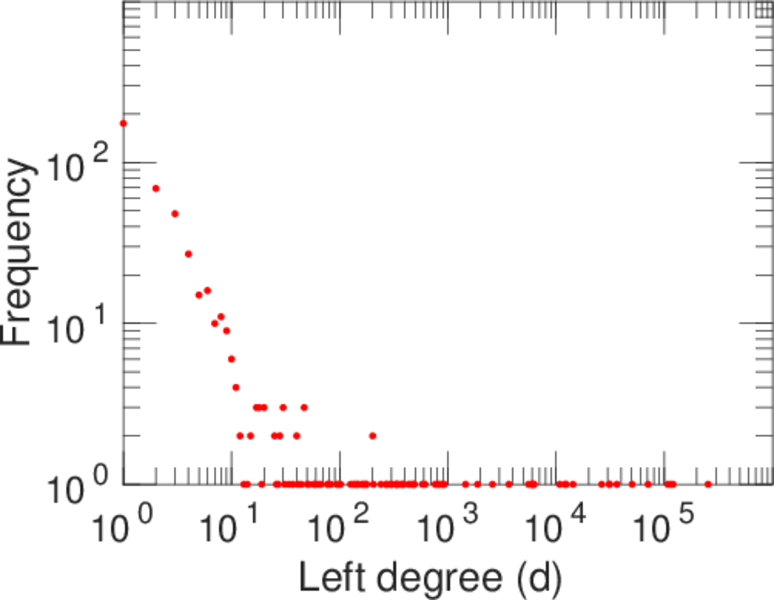
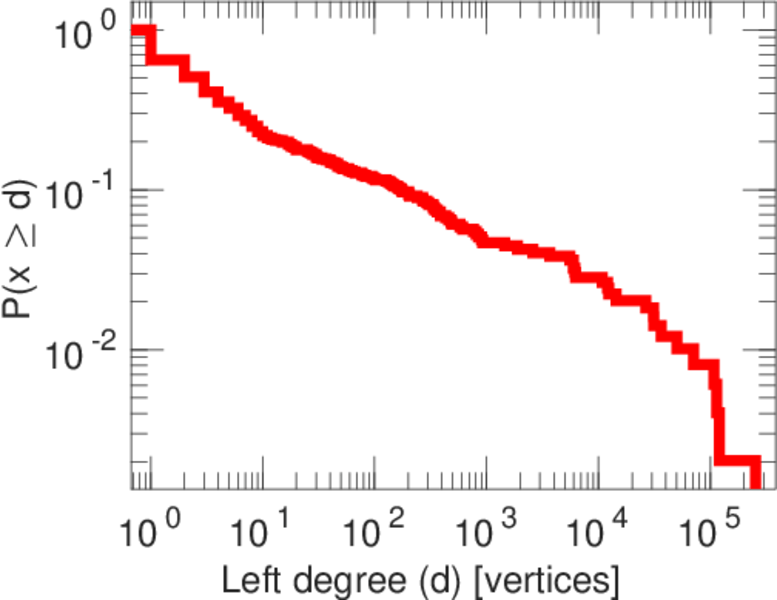
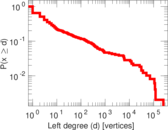
| Maximum left degree | d1max = | 254,492
|
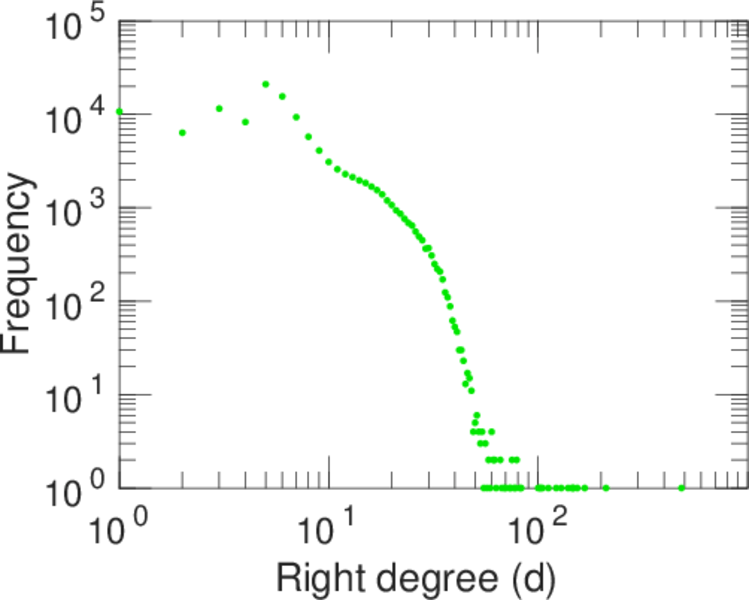
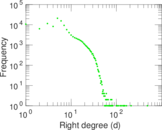
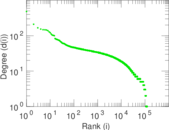
| Maximum right degree | d2max = | 484
|
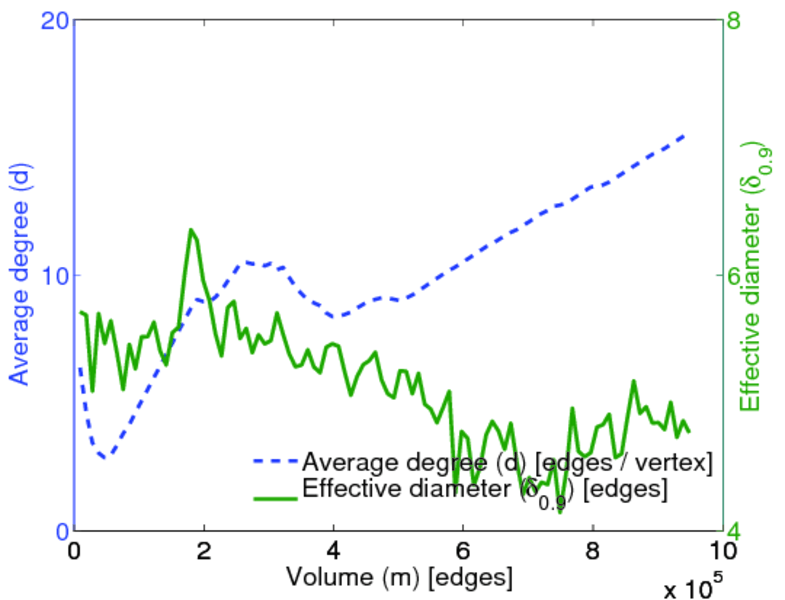
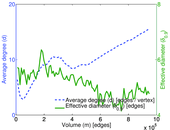
| Average degree | d = | 15.549 9
|
| Average left degree | d1 = | 1,919.64
|
| Average right degree | d2 = | 7.806 56
|
| Fill | p = | 0.008 824 94
|
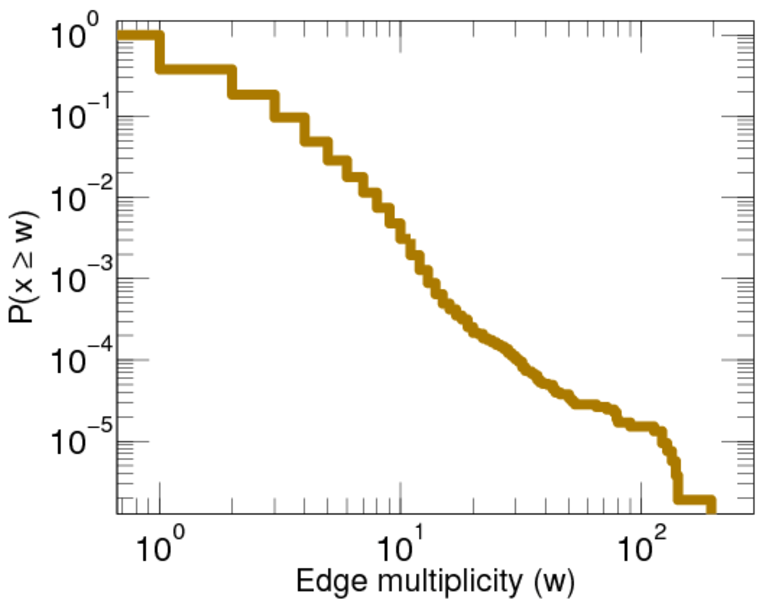
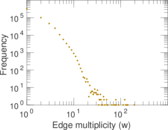
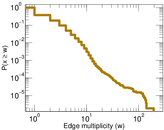
| Average edge multiplicity | m̃ = | 1.790 69
|
| Size of LCC | N = | 121,584
|
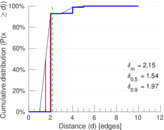
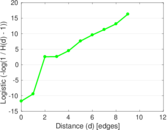
| Diameter | δ = | 11
|
| 50-Percentile effective diameter | δ0.5 = | 1.538 54
|
| 90-Percentile effective diameter | δ0.9 = | 1.969 44
|
| Median distance | δM = | 2
|
| Mean distance | δm = | 2.151 82
|
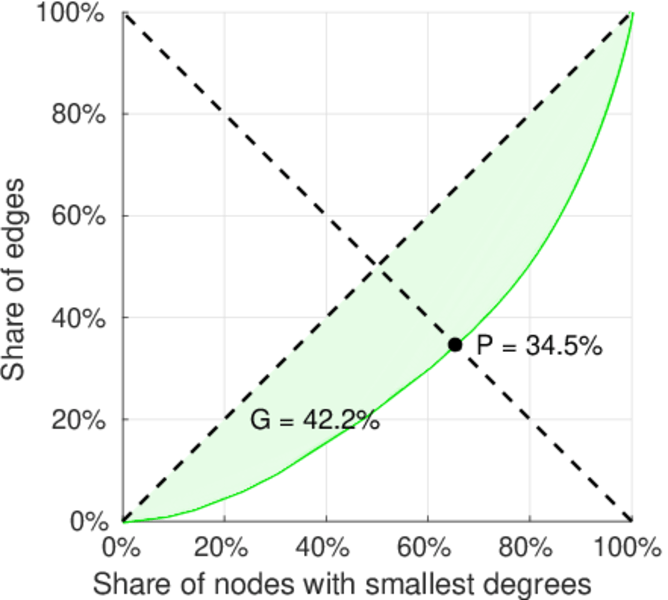
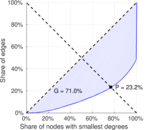
| Balanced inequality ratio | P = | 0.232 642
|
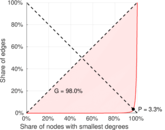
| Left balanced inequality ratio | P1 = | 0.032 533 9
|
| Right balanced inequality ratio | P2 = | 0.345 419
|
| Relative edge distribution entropy | Her = | 0.663 325
|
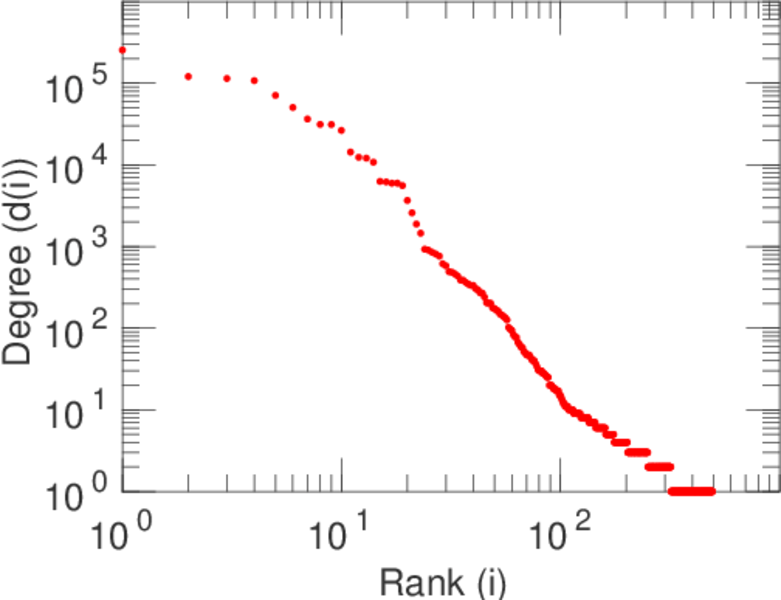
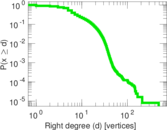
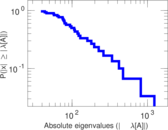
| Power law exponent | γ = | 1.777 50
|
| Tail power law exponent | γt = | 5.681 00
|
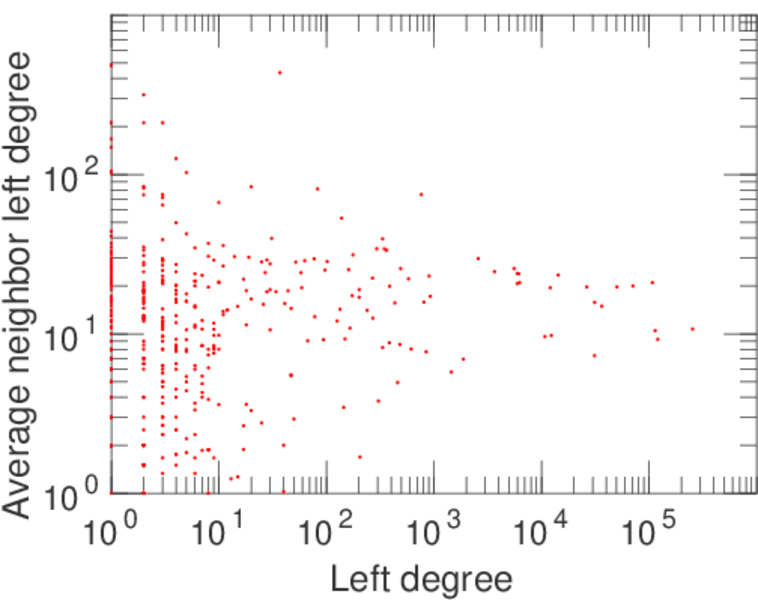
| Degree assortativity | ρ = | −0.395 704
|
| Degree assortativity p-value | pρ = | 0.000 00
|
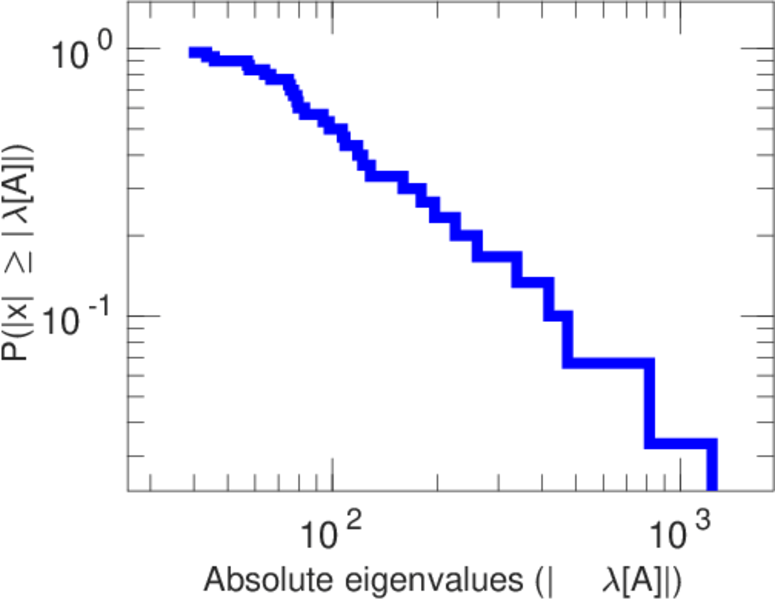
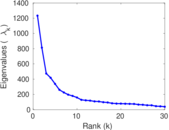
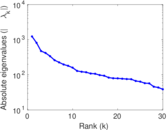
| Spectral norm | α = | 1,233.38
|
| Spectral separation | |λ1[A] / λ2[A]| = | 1.515 63
|
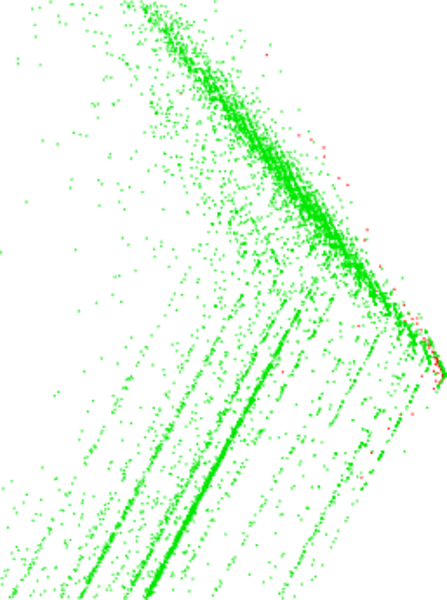
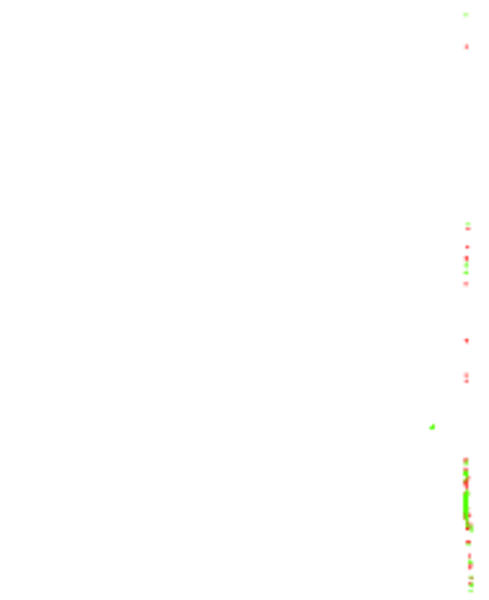
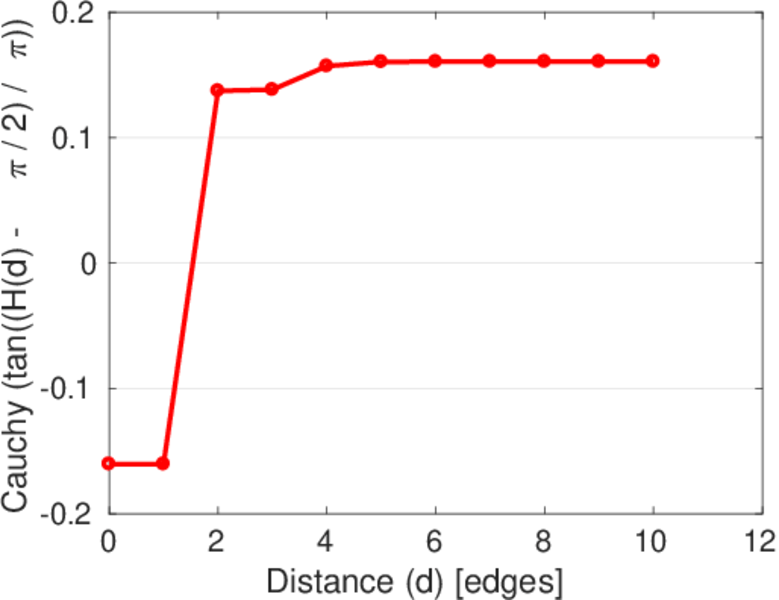
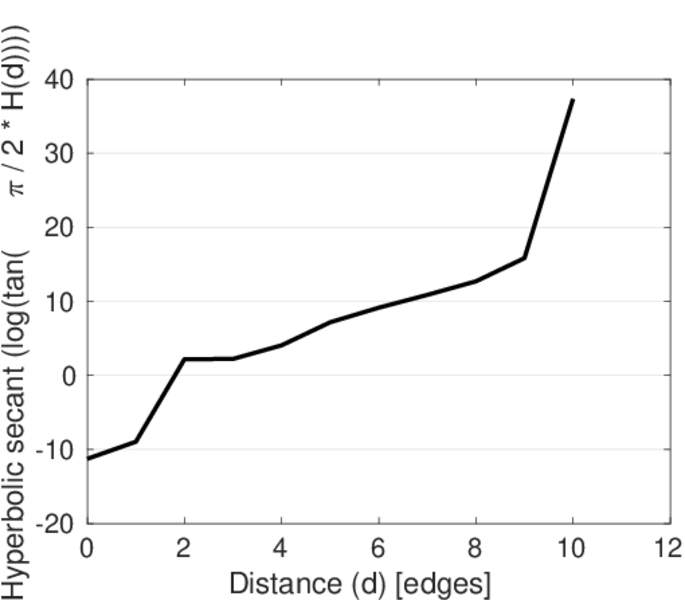
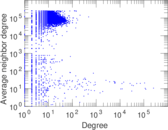
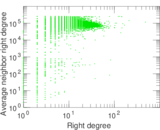
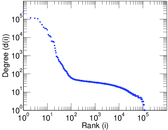
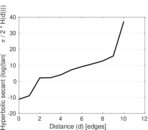
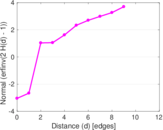
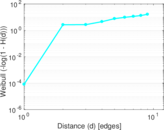
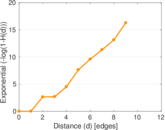
Plots


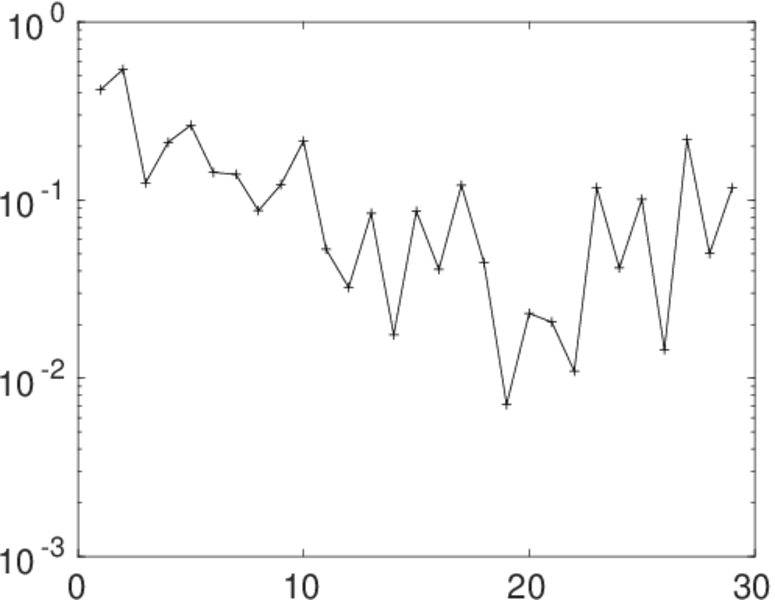
Matrix decompositions plots

Downloads
References
|
[1]
|
Jérôme Kunegis.
KONECT – The Koblenz Network Collection.
In Proc. Int. Conf. on World Wide Web Companion, pages
1343–1350, 2013.
[ http ]
|
|
[2]
|
Wikimedia Foundation.
Wikimedia downloads.
http://dumps.wikimedia.org/, January 2010.
|
 KONECT ‣ Networks ‣
Buy Me a Coffee
KONECT ‣ Networks ‣
Buy Me a Coffee