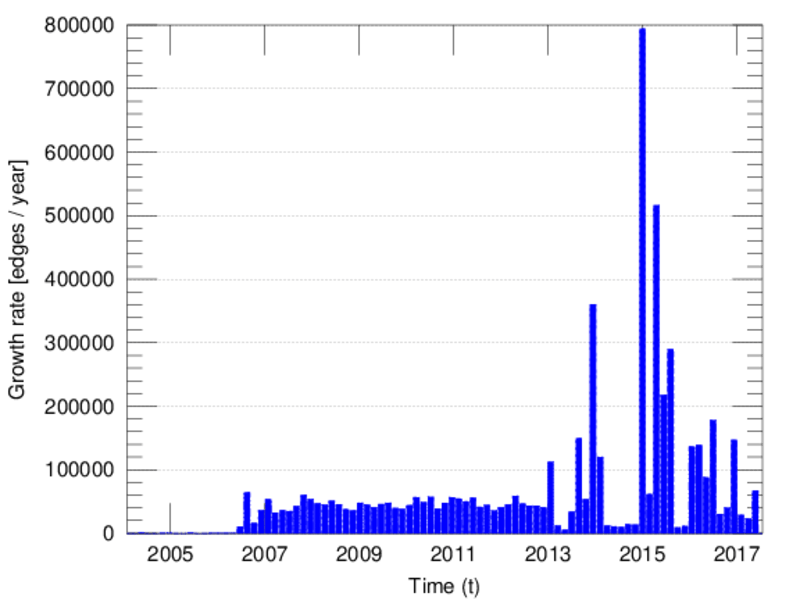
Wikipedia edits (tg)
This is the bipartite edit network of the Tajik Wikipedia. It contains users
and pages from the Tajik Wikipedia, connected by edit events. Each edge
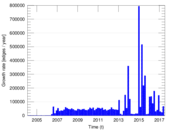
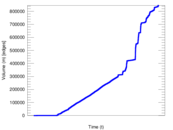
represents an edit. The dataset includes the timestamp of each edit.
Metadata
Statistics
| Size | n = | 143,873
|
| Left size | n1 = | 3,383
|
| Right size | n2 = | 140,490
|
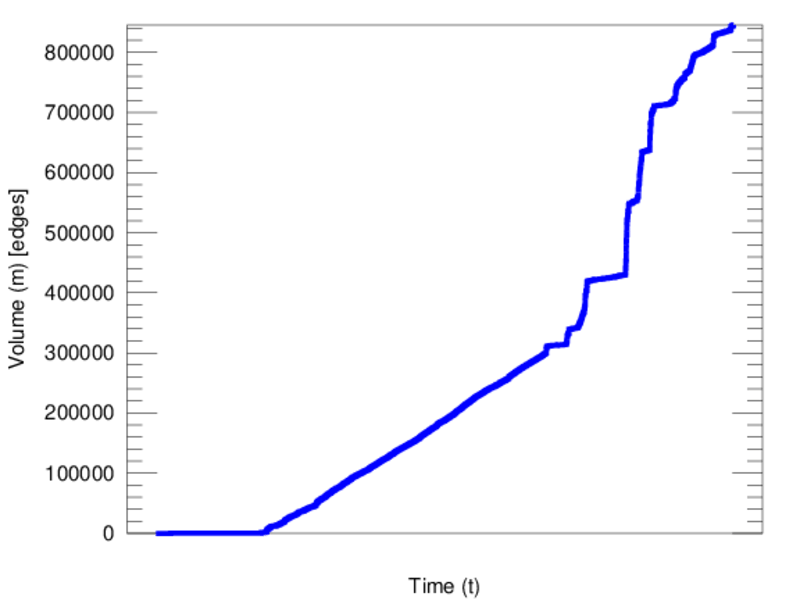
| Volume | m = | 845,441
|
| Unique edge count | m̿ = | 405,714
|
| Wedge count | s = | 4,662,388,384
|
| Claw count | z = | 83,408,197,112,668
|
| Cross count | x = | 1,414,085,821,831,175,680
|
| Square count | q = | 2,353,785,597
|
| 4-Tour count | T4 = | 37,480,695,868
|
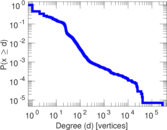
| Maximum degree | dmax = | 276,730
|
| Maximum left degree | d1max = | 276,730
|
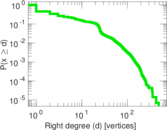
| Maximum right degree | d2max = | 486
|
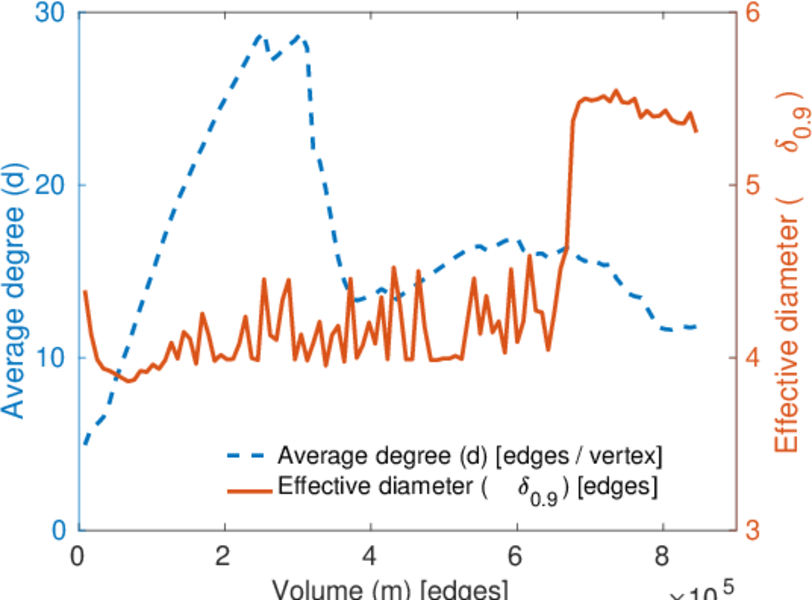
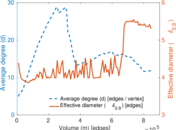
| Average degree | d = | 11.752 6
|
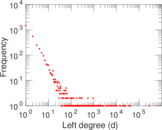
| Average left degree | d1 = | 249.909
|
| Average right degree | d2 = | 6.017 80
|
| Fill | p = | 0.000 853 636
|
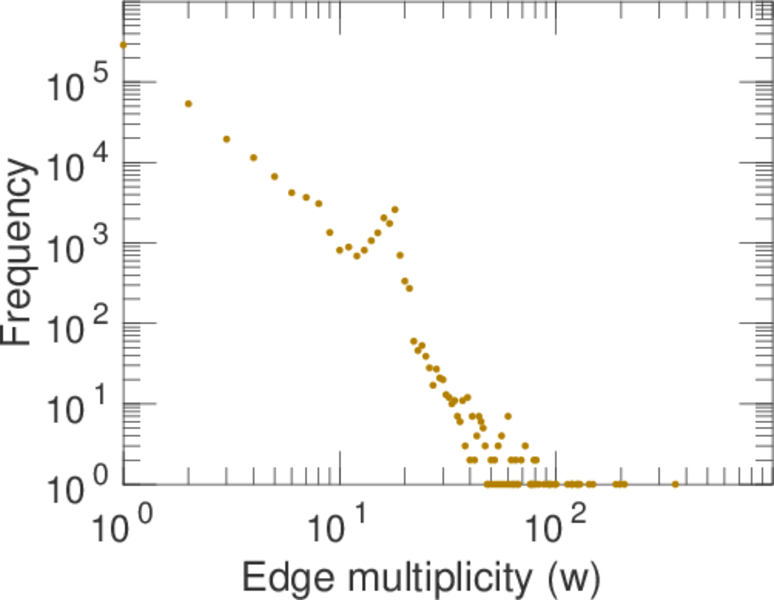
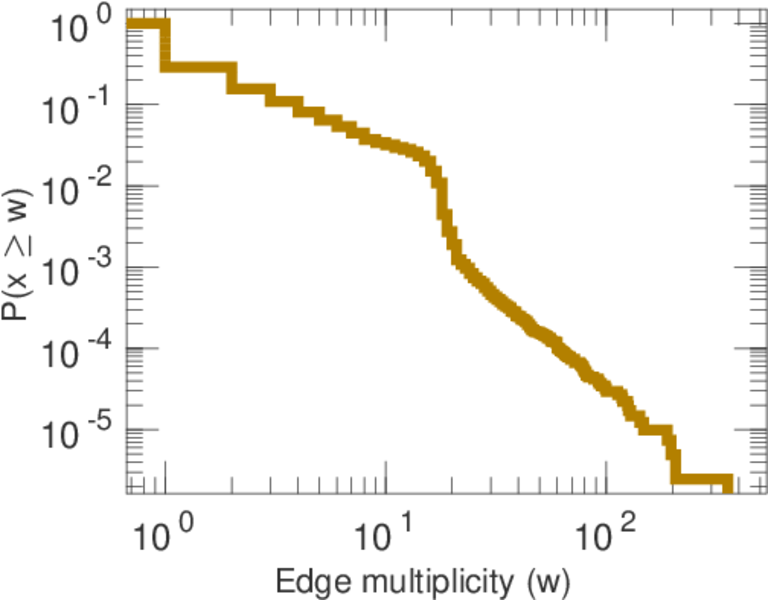
| Average edge multiplicity | m̃ = | 2.083 83
|
| Size of LCC | N = | 142,619
|
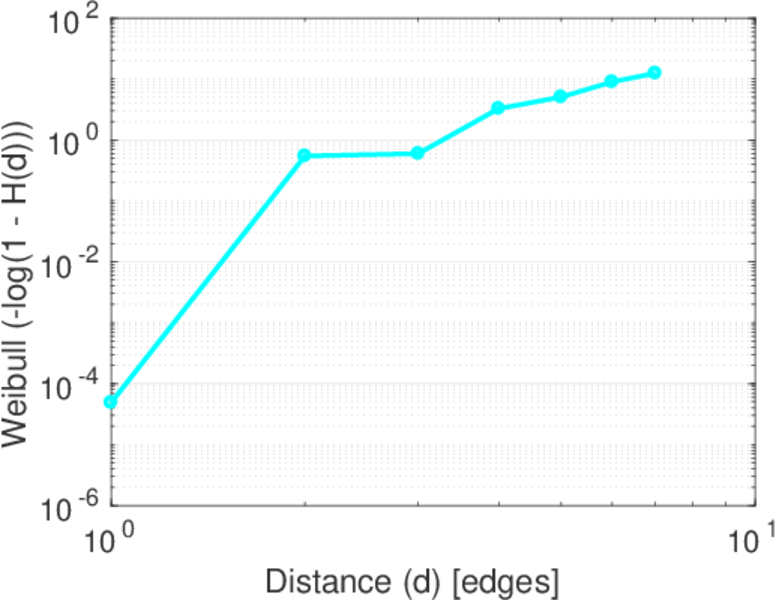
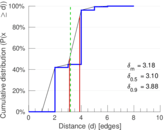
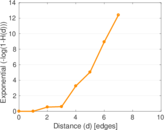
| Diameter | δ = | 10
|
| 50-Percentile effective diameter | δ0.5 = | 3.100 48
|
| 90-Percentile effective diameter | δ0.9 = | 3.880 01
|
| Median distance | δM = | 4
|
| Mean distance | δm = | 3.177 20
|
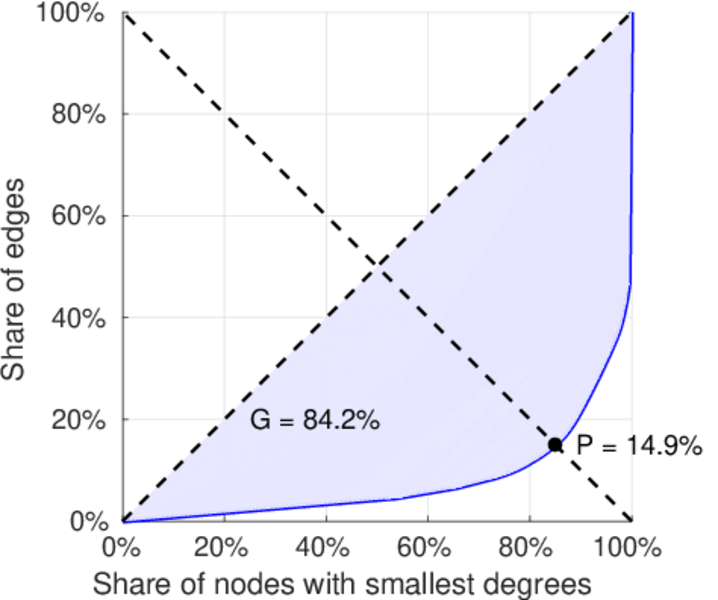
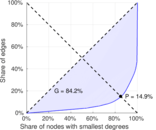
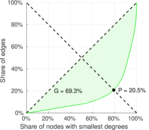
| Gini coefficient | G = | 0.844 439
|
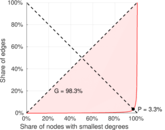
| Balanced inequality ratio | P = | 0.147 225
|
| Left balanced inequality ratio | P1 = | 0.033 435 8
|
| Right balanced inequality ratio | P2 = | 0.205 428
|
| Relative edge distribution entropy | Her = | 0.695 764
|
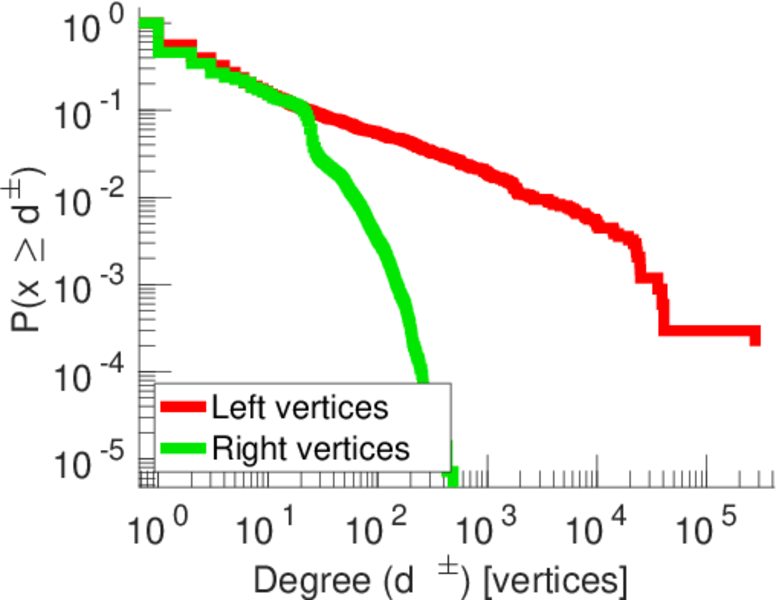
| Tail power law exponent | γt = | 1.991 00
|
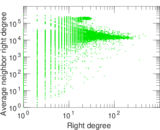
| Degree assortativity | ρ = | −0.438 404
|
| Degree assortativity p-value | pρ = | 0.000 00
|
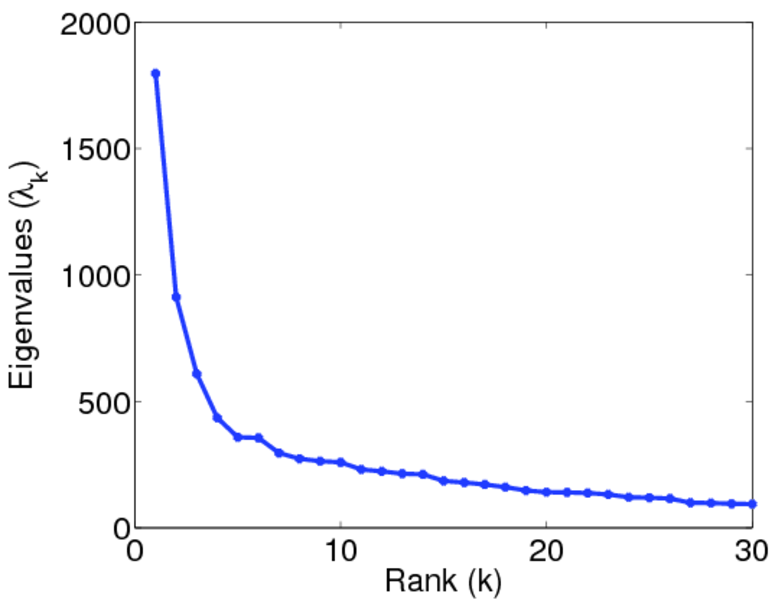
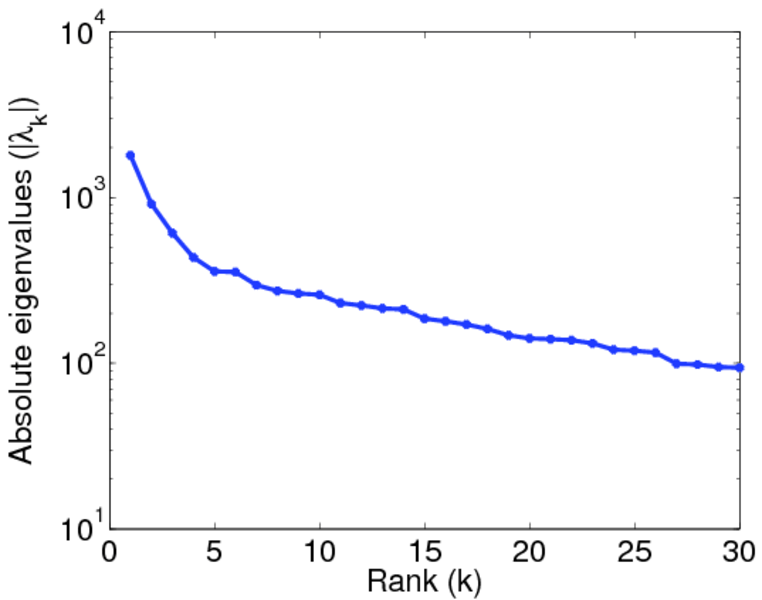
| Spectral norm | α = | 1,797.33
|
| Algebraic connectivity | a = | 0.028 121 0
|
| Controllability | C = | 136,799
|
| Relative controllability | Cr = | 0.954 800
|
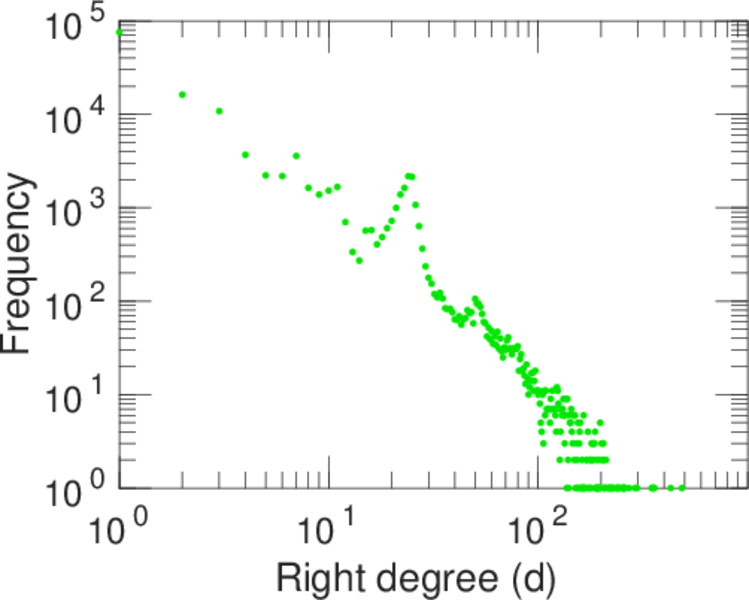
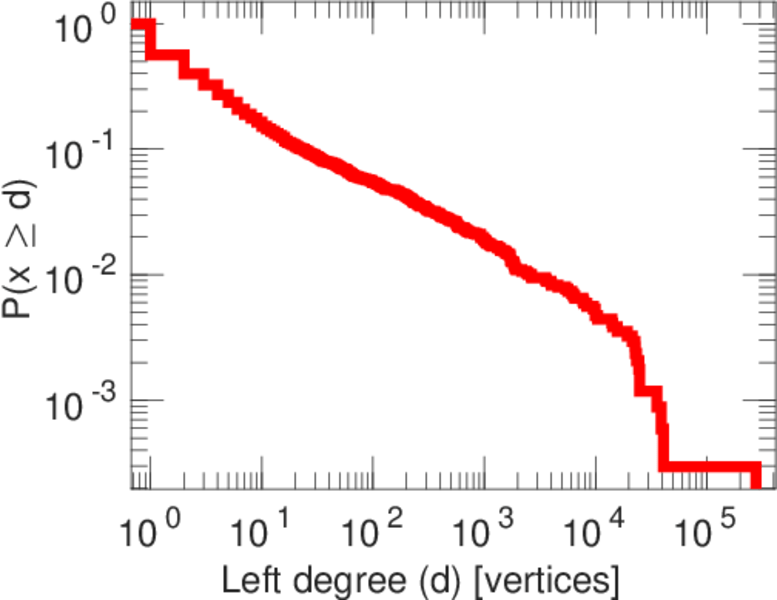
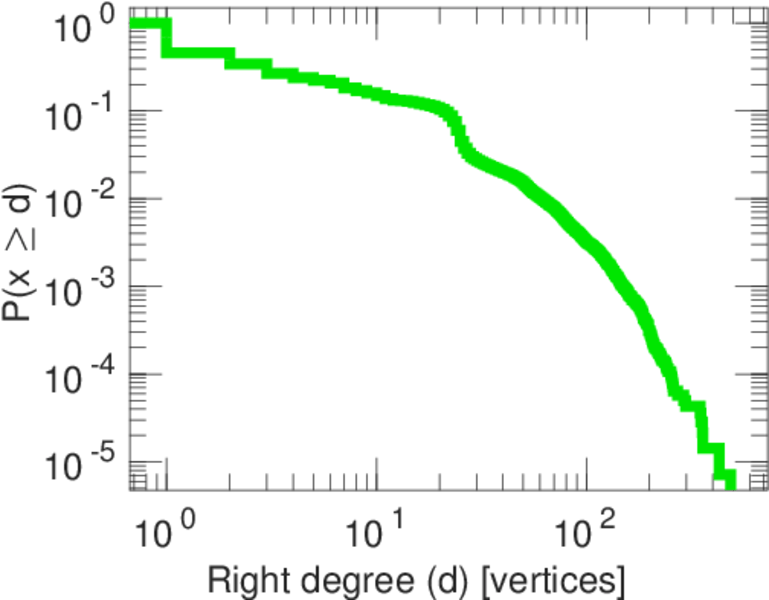
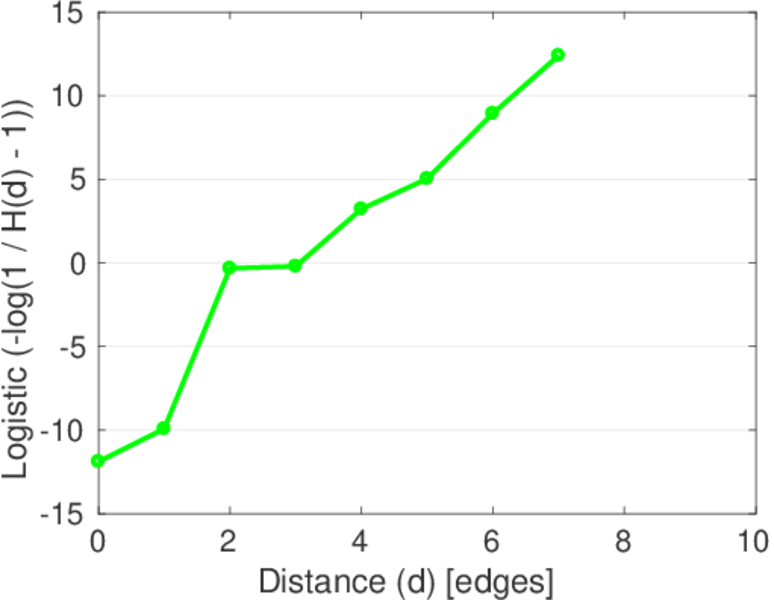
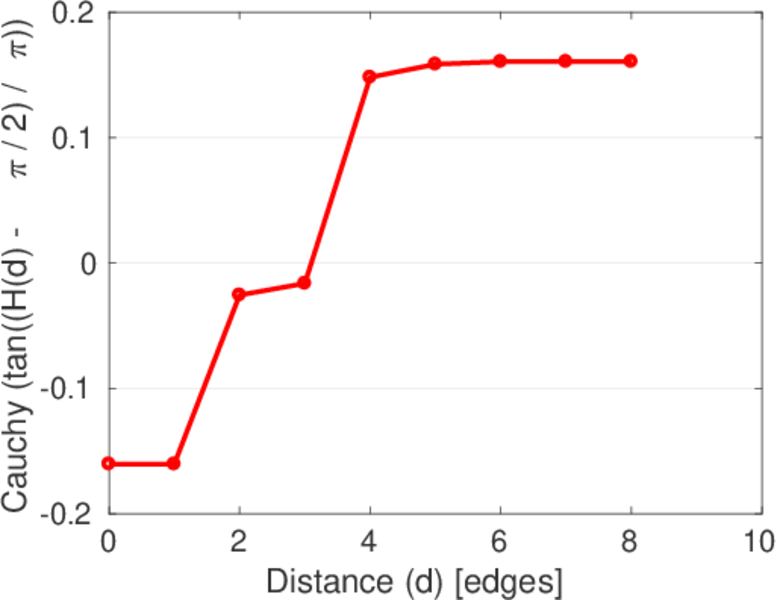
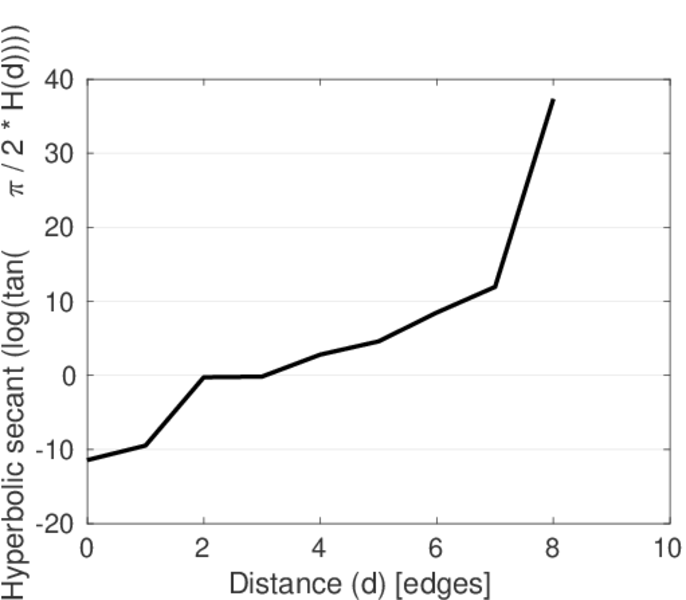
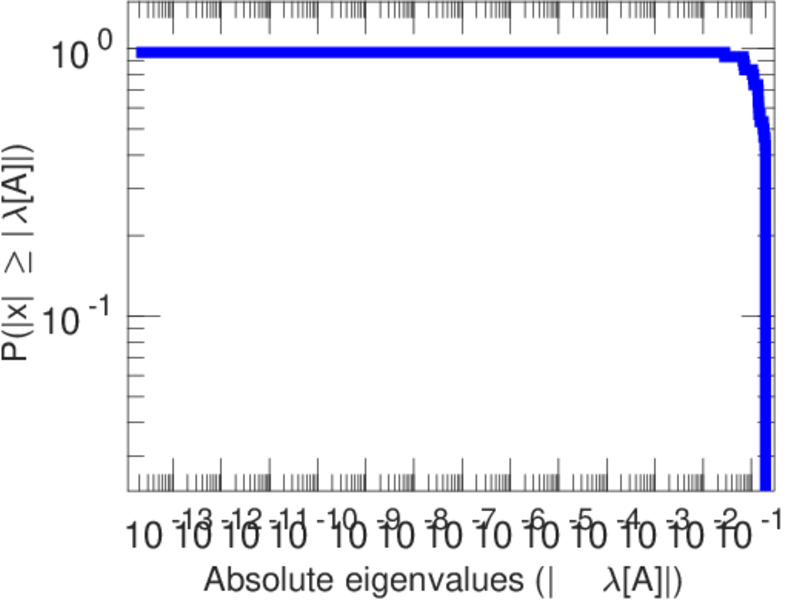
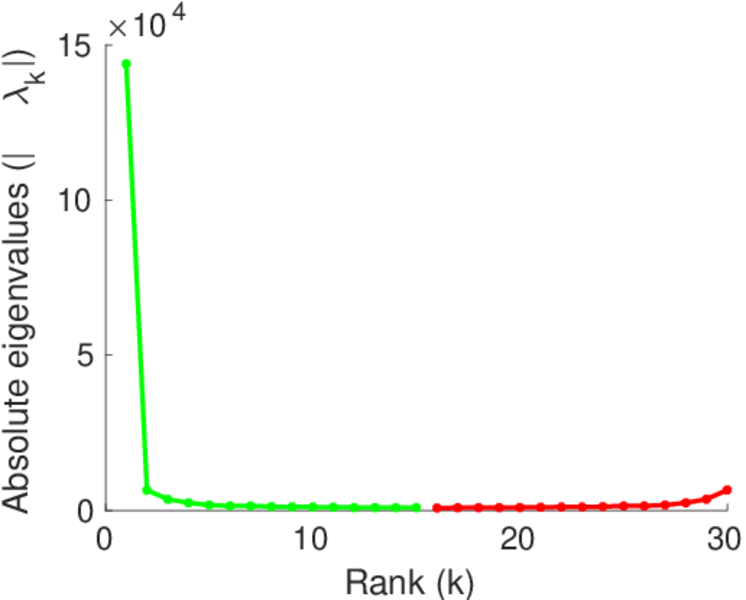
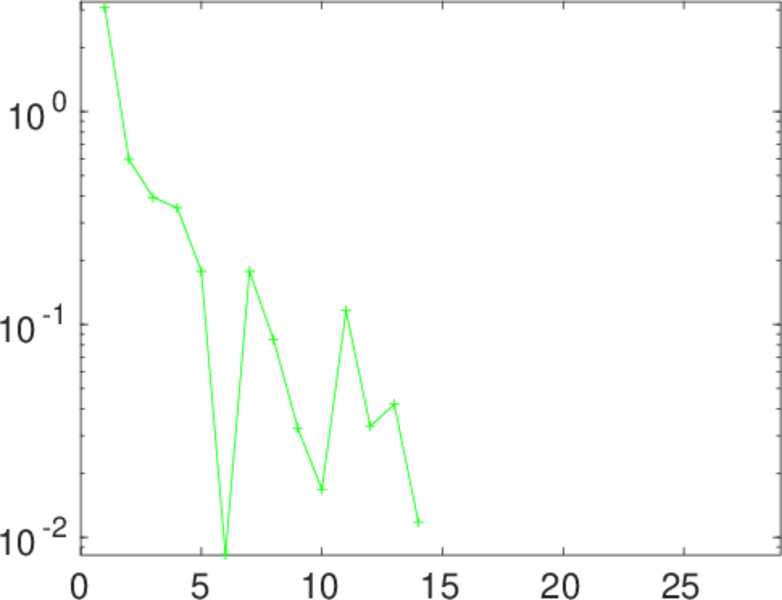
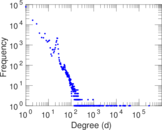
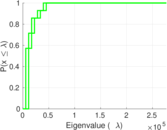
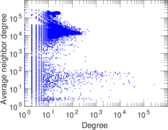
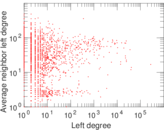
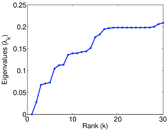
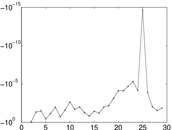
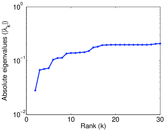
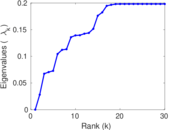
Plots


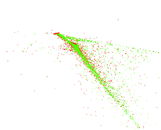


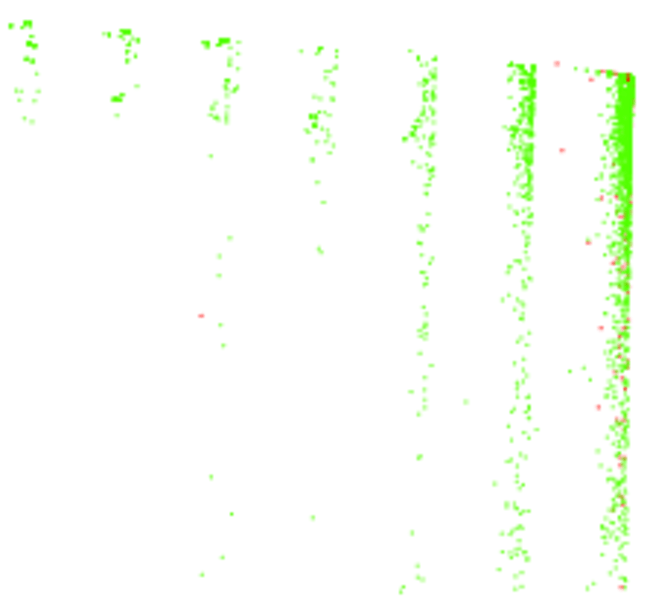
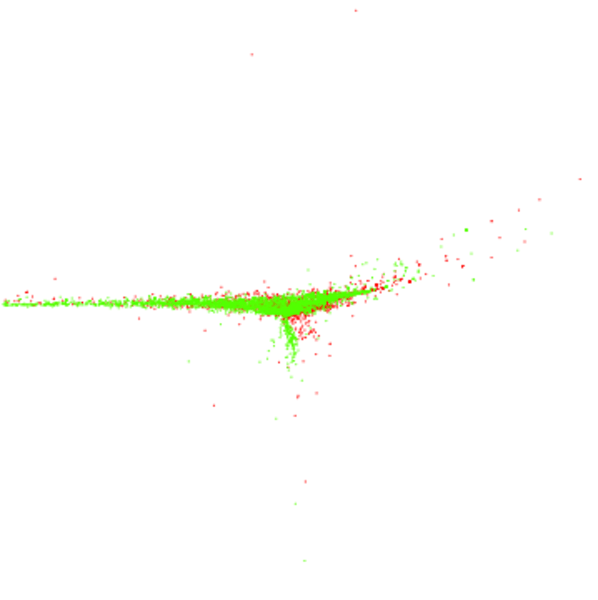
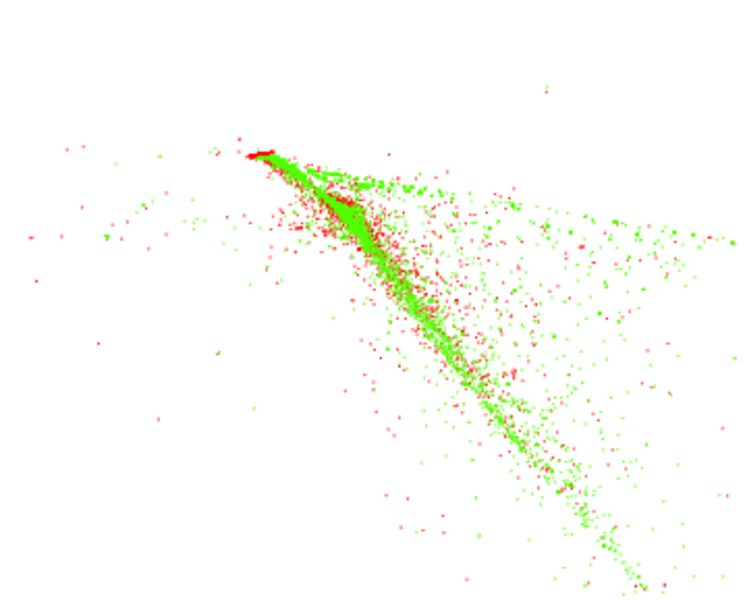
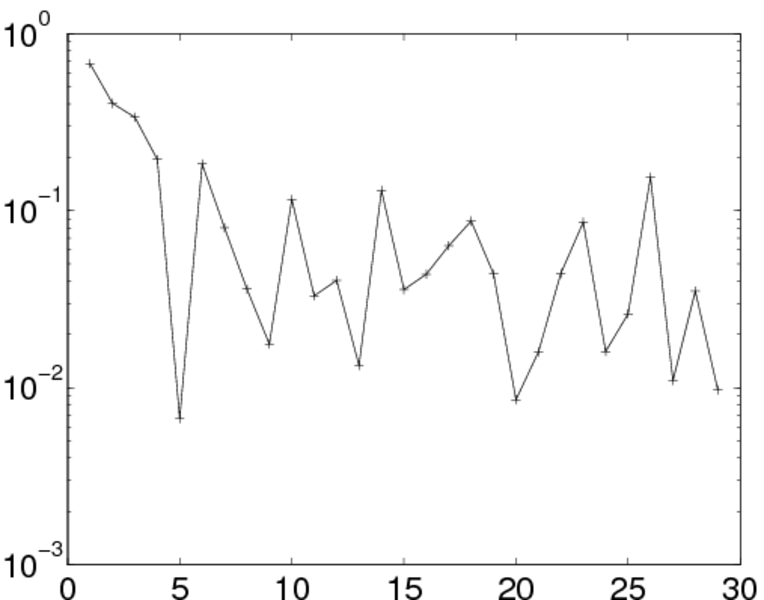
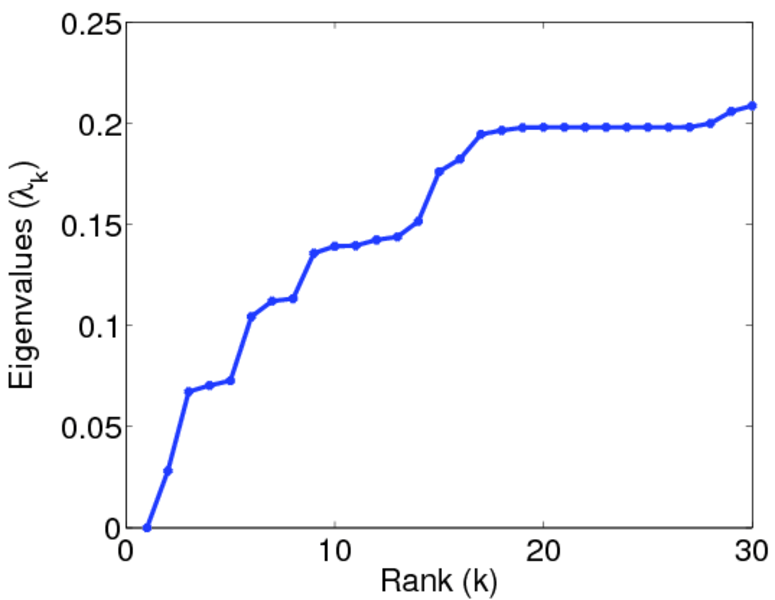
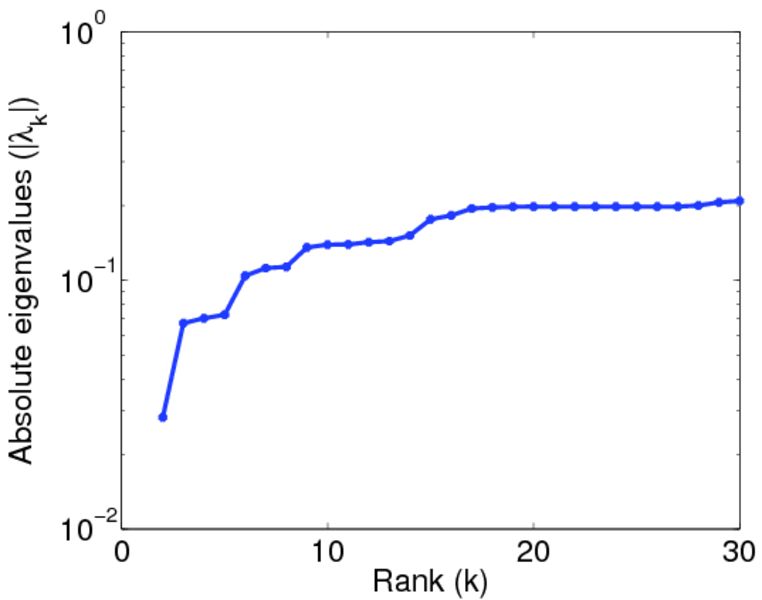
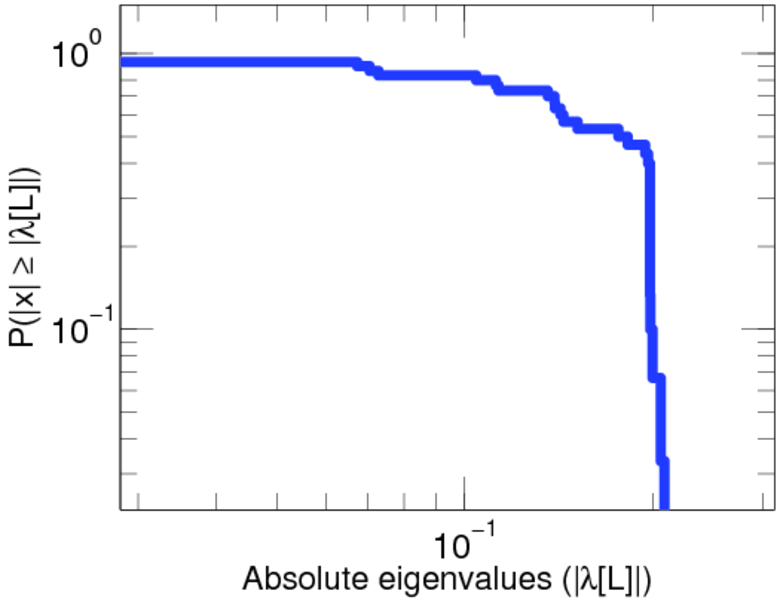
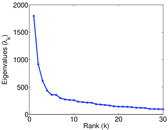
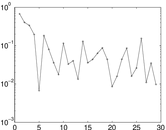
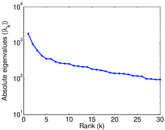
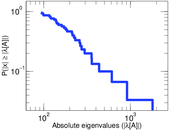
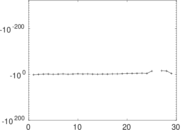
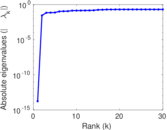
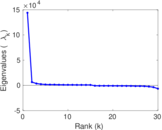
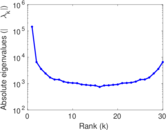
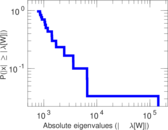
Matrix decompositions plots


Downloads
References
|
[1]
|
Jérôme Kunegis.
KONECT – The Koblenz Network Collection.
In Proc. Int. Conf. on World Wide Web Companion, pages
1343–1350, 2013.
[ http ]
|
|
[2]
|
Wikimedia Foundation.
Wikimedia downloads.
http://dumps.wikimedia.org/, January 2010.
|
 KONECT ‣ Networks ‣
Buy Me a Coffee
KONECT ‣ Networks ‣
Buy Me a Coffee