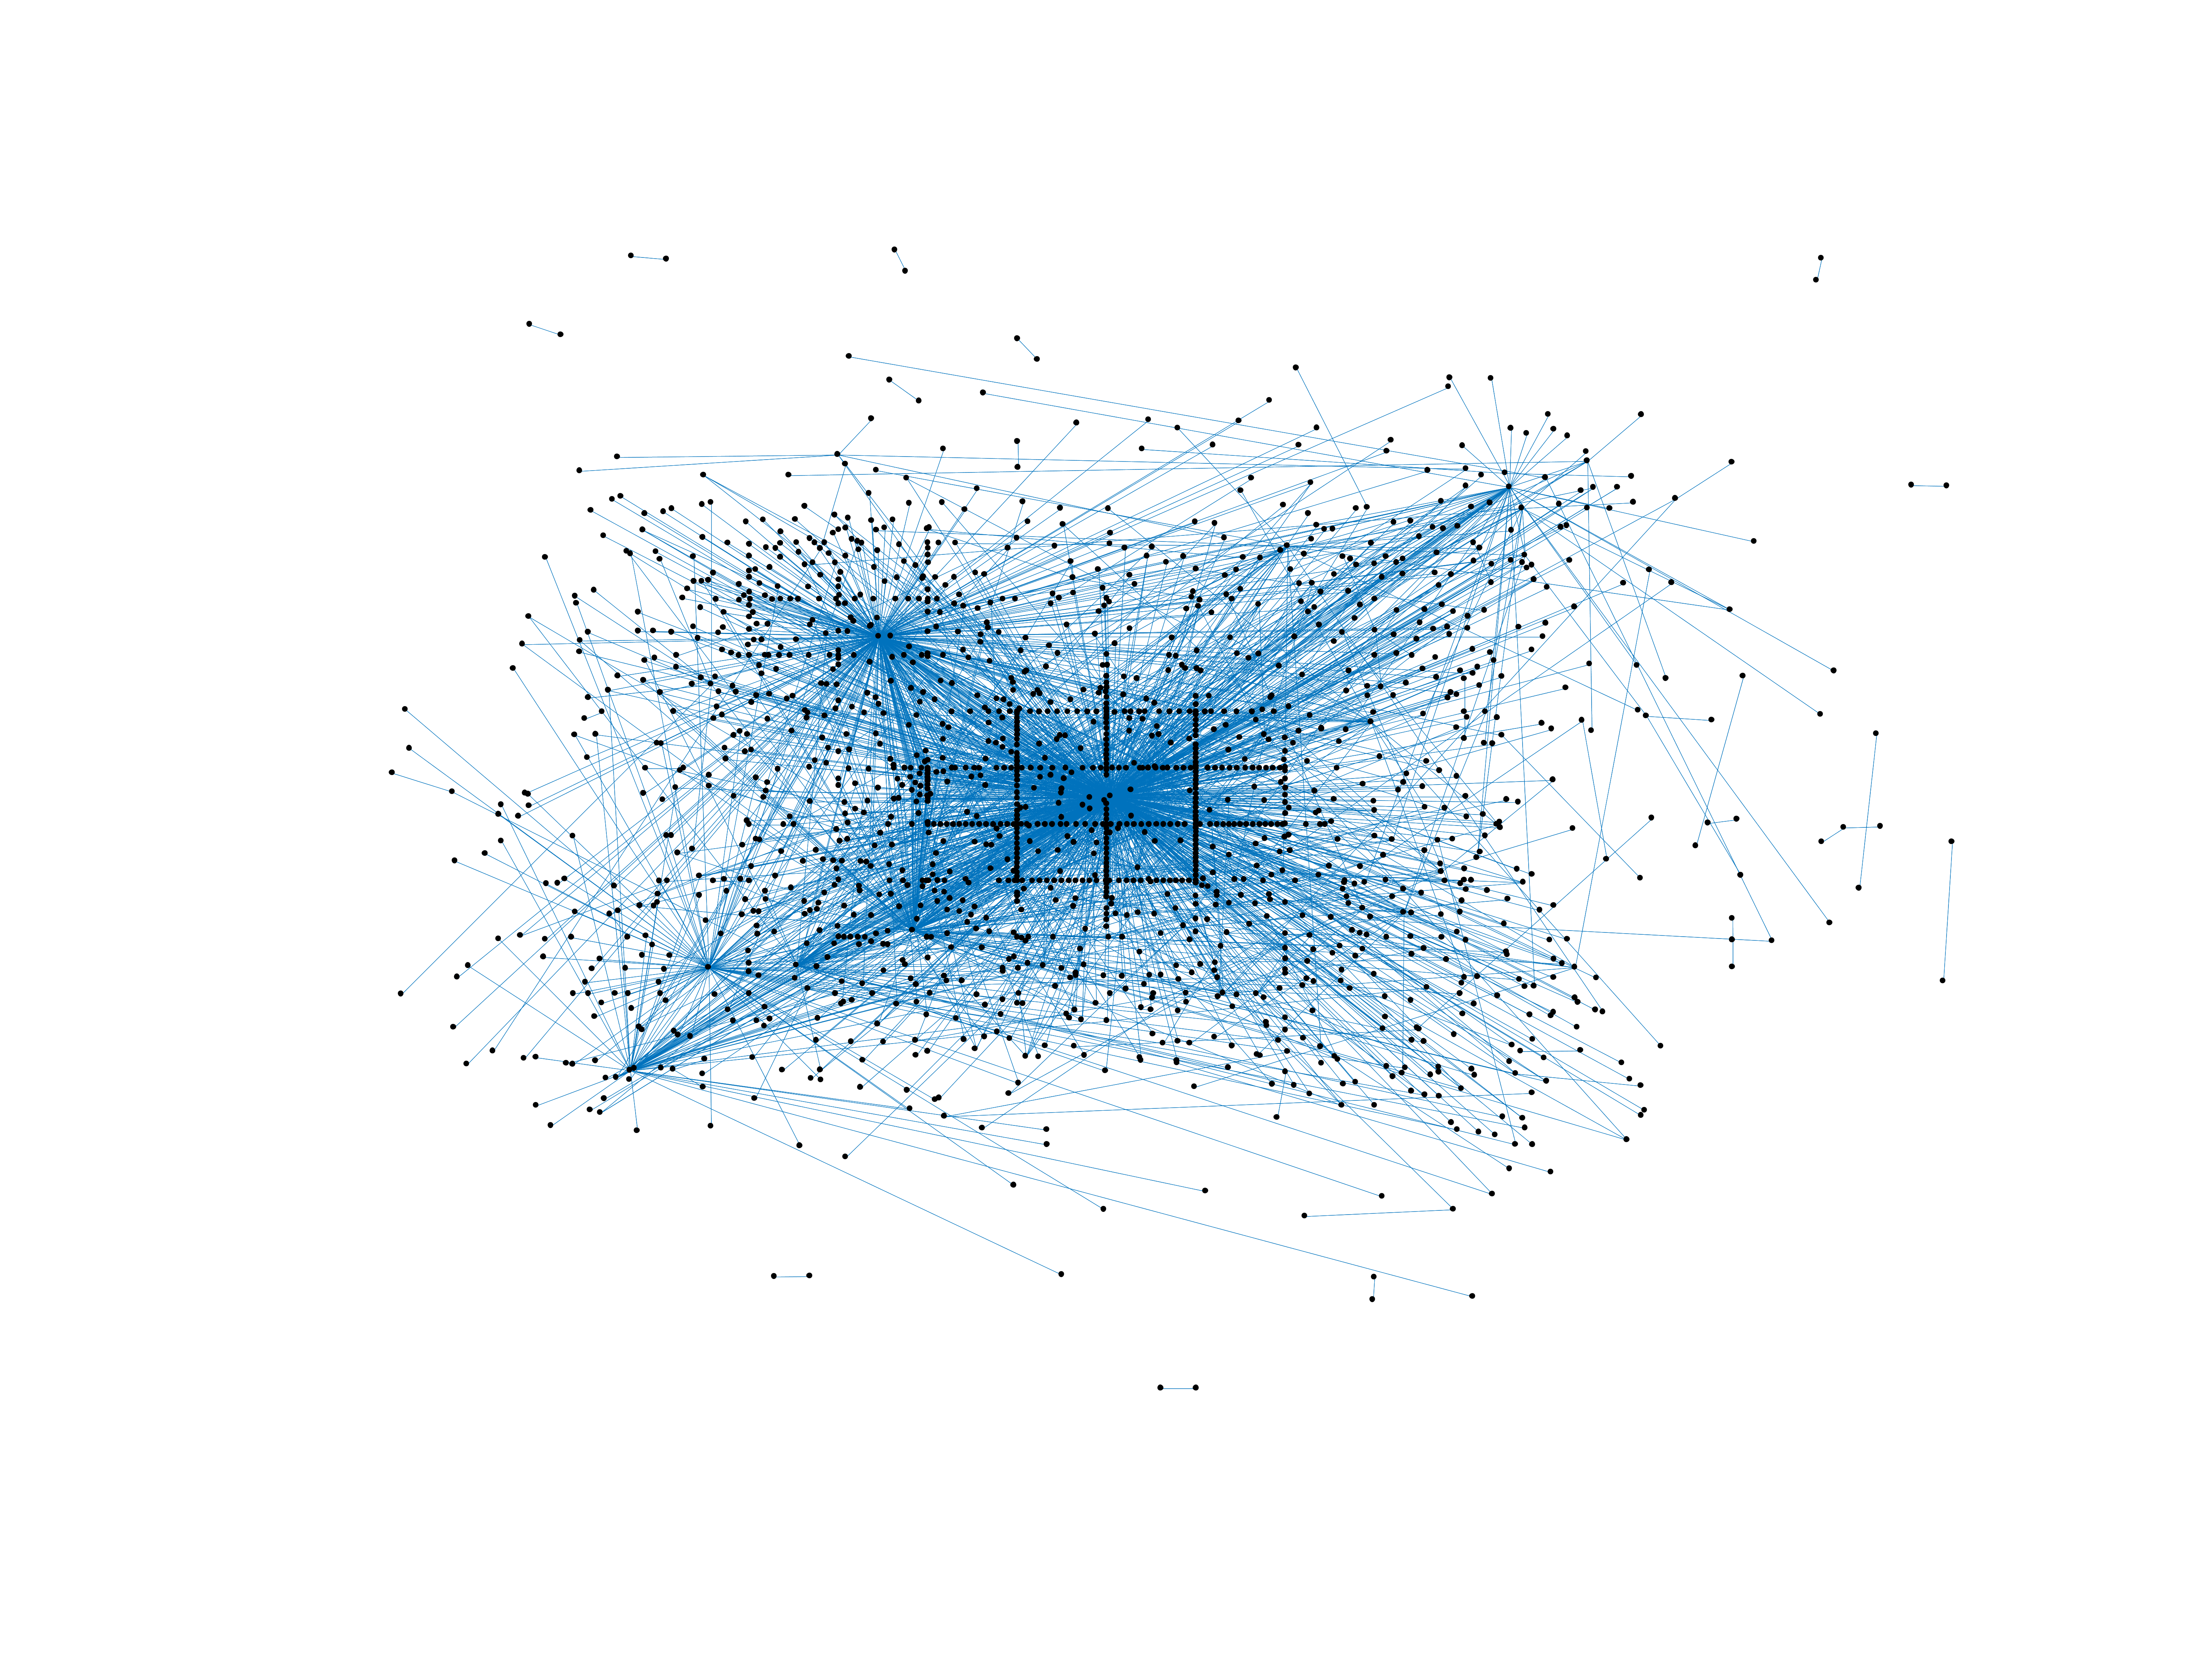
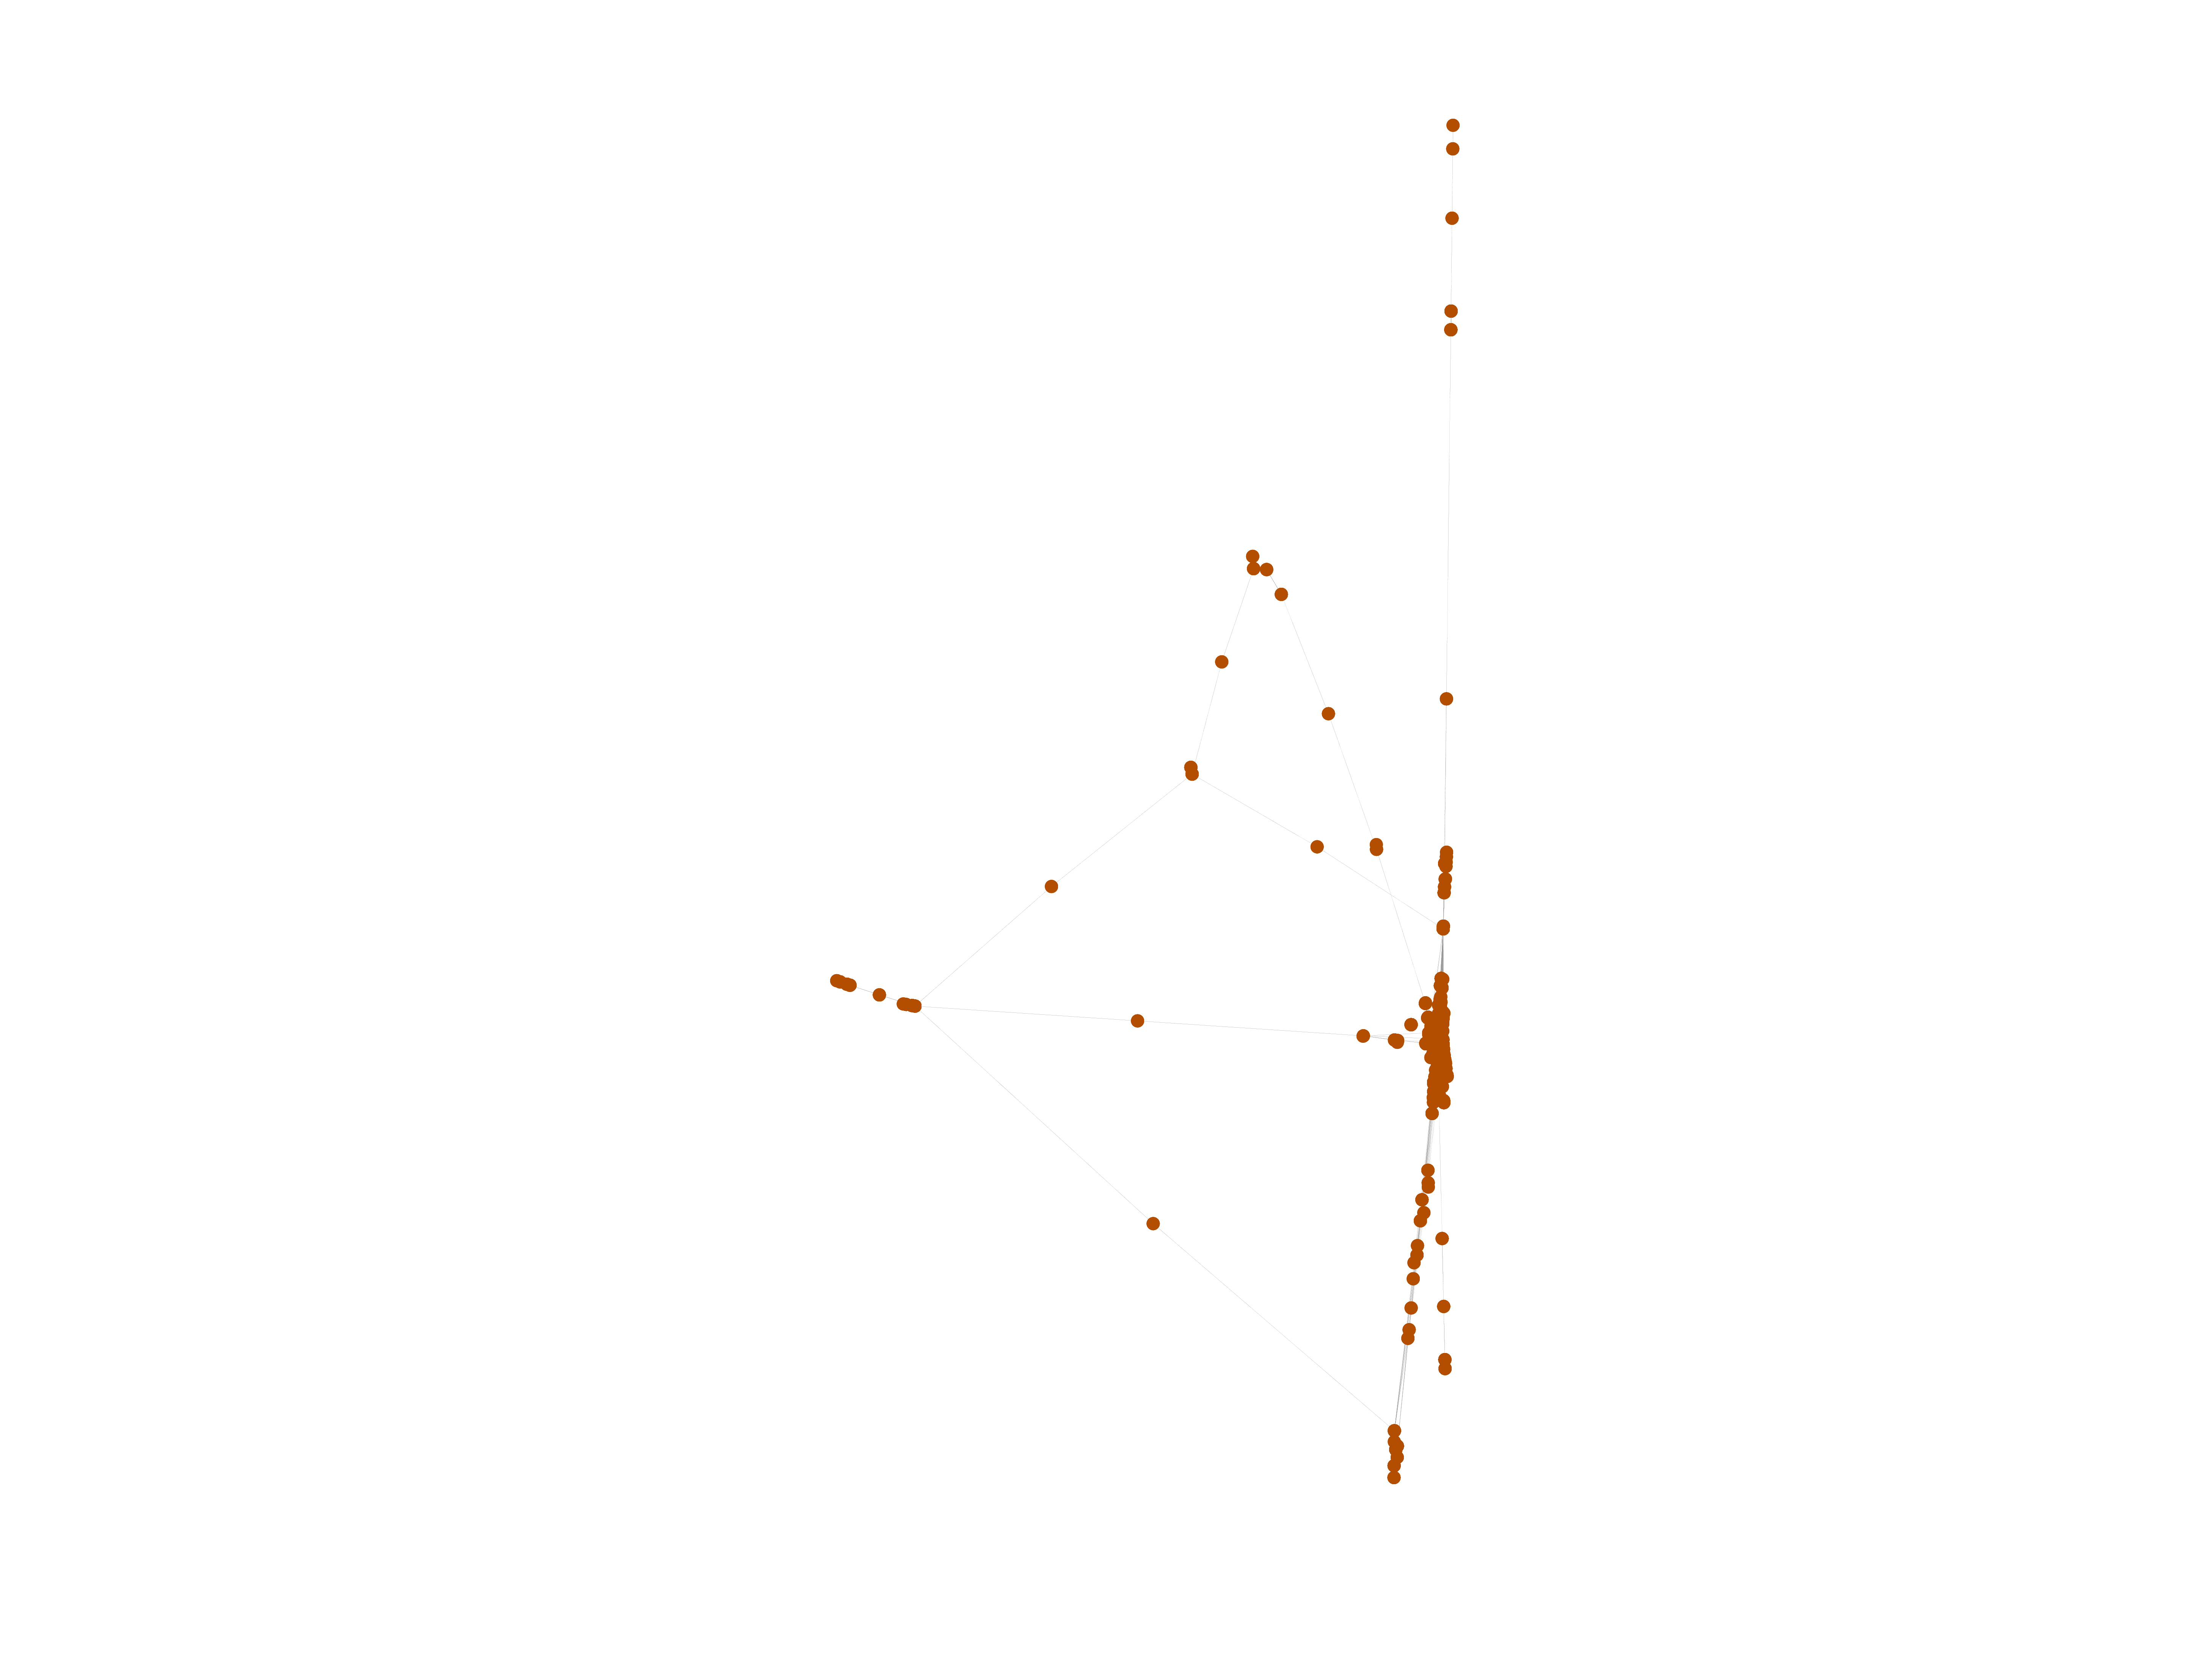
Wikinews edits (th)
This is the bipartite edit network of the Thai Wikinews. It contains users and
pages from the Thai Wikinews, connected by edit events. Each edge represents an
edit. The dataset includes the timestamp of each edit.
Metadata
Statistics
| Size | n = | 1,737
|
| Left size | n1 = | 142
|
| Right size | n2 = | 1,595
|
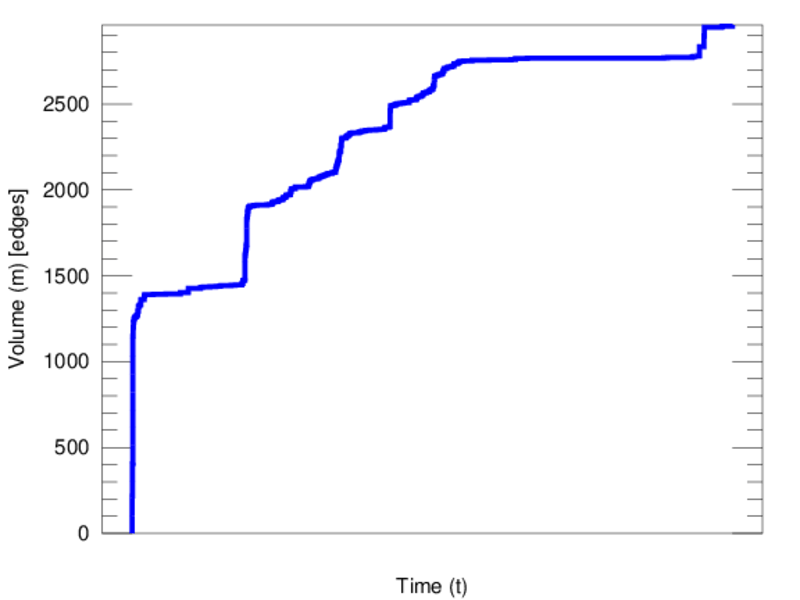
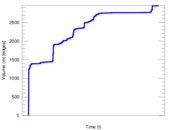
| Volume | m = | 2,960
|
| Unique edge count | m̿ = | 2,212
|
| Wedge count | s = | 344,269
|
| Claw count | z = | 66,066,050
|
| Cross count | x = | 10,831,037,346
|
| Square count | q = | 18,966
|
| 4-Tour count | T4 = | 1,536,468
|
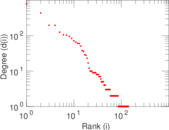
| Maximum degree | dmax = | 797
|
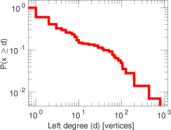
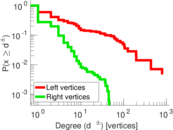
| Maximum left degree | d1max = | 797
|
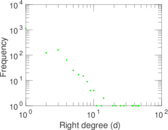
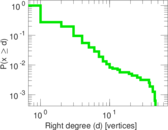
| Maximum right degree | d2max = | 46
|
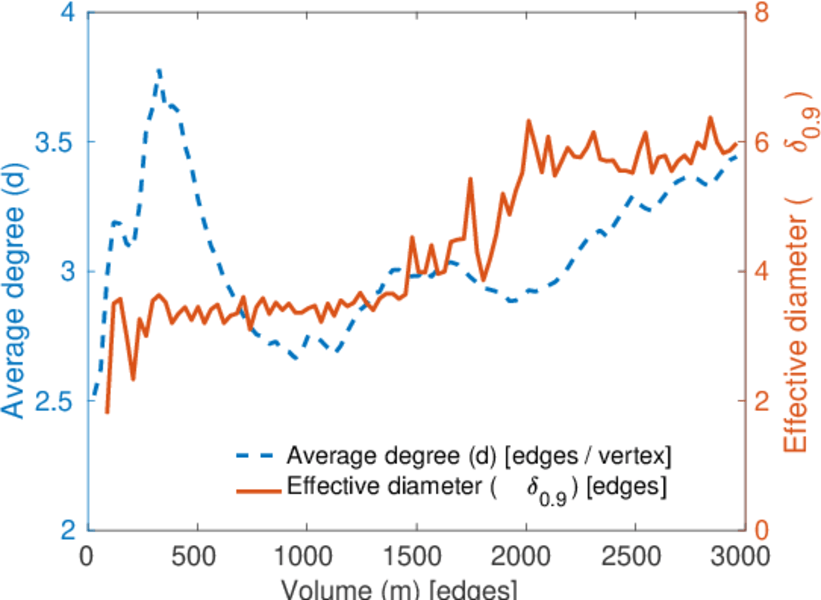
| Average degree | d = | 3.408 18
|
| Average left degree | d1 = | 20.845 1
|
| Average right degree | d2 = | 1.855 80
|
| Fill | p = | 0.009 766 44
|
| Average edge multiplicity | m̃ = | 1.338 16
|
| Size of LCC | N = | 1,544
|
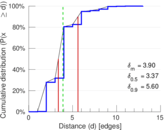
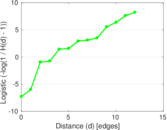
| Diameter | δ = | 13
|
| 50-Percentile effective diameter | δ0.5 = | 3.373 79
|
| 90-Percentile effective diameter | δ0.9 = | 5.603 22
|
| Median distance | δM = | 4
|
| Mean distance | δm = | 3.899 74
|
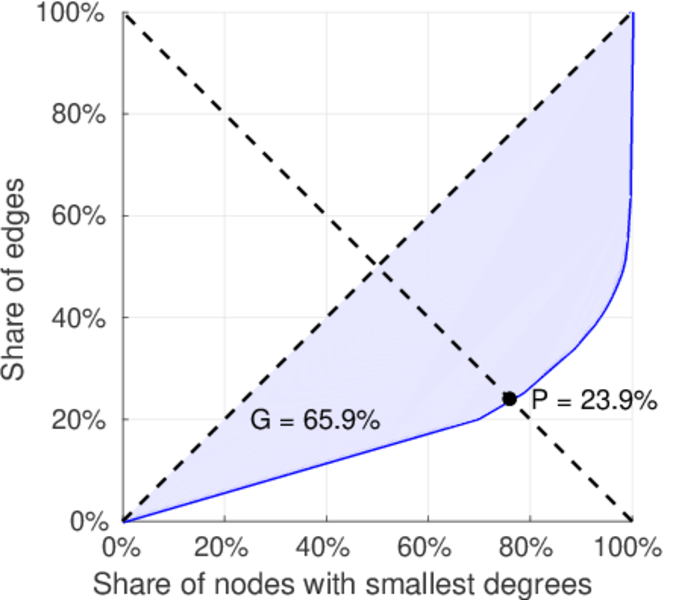
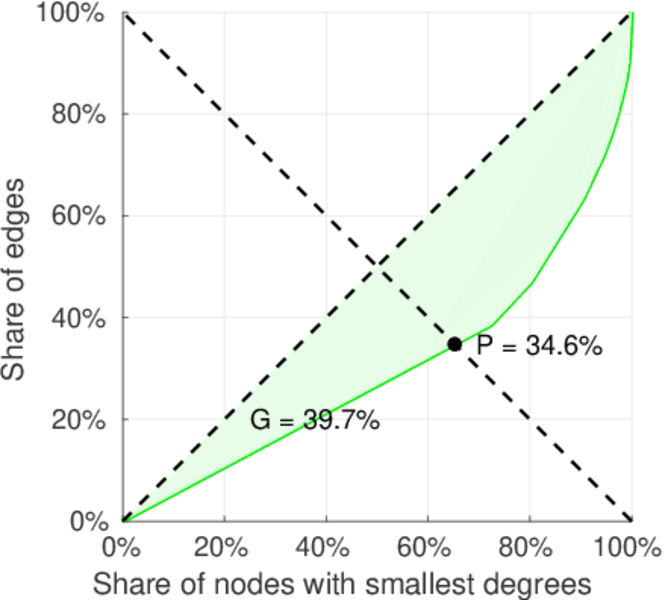
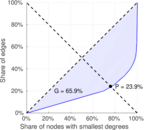
| Gini coefficient | G = | 0.680 217
|
| Balanced inequality ratio | P = | 0.228 209
|
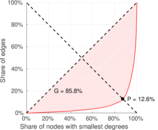
| Left balanced inequality ratio | P1 = | 0.126 351
|
| Right balanced inequality ratio | P2 = | 0.346 284
|
| Relative edge distribution entropy | Her = | 0.768 082
|
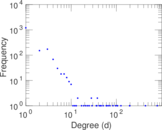
| Power law exponent | γ = | 4.660 09
|
| Tail power law exponent | γt = | 2.541 00
|
| Tail power law exponent with p | γ3 = | 2.541 00
|
| p-value | p = | 0.000 00
|
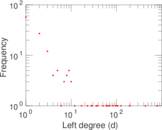
| Left tail power law exponent with p | γ3,1 = | 1.691 00
|
| Left p-value | p1 = | 0.873 000
|
| Right tail power law exponent with p | γ3,2 = | 2.781 00
|
| Right p-value | p2 = | 0.000 00
|
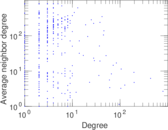
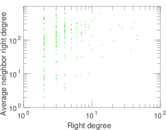
| Degree assortativity | ρ = | −0.354 200
|
| Degree assortativity p-value | pρ = | 2.222 30 × 10−66
|
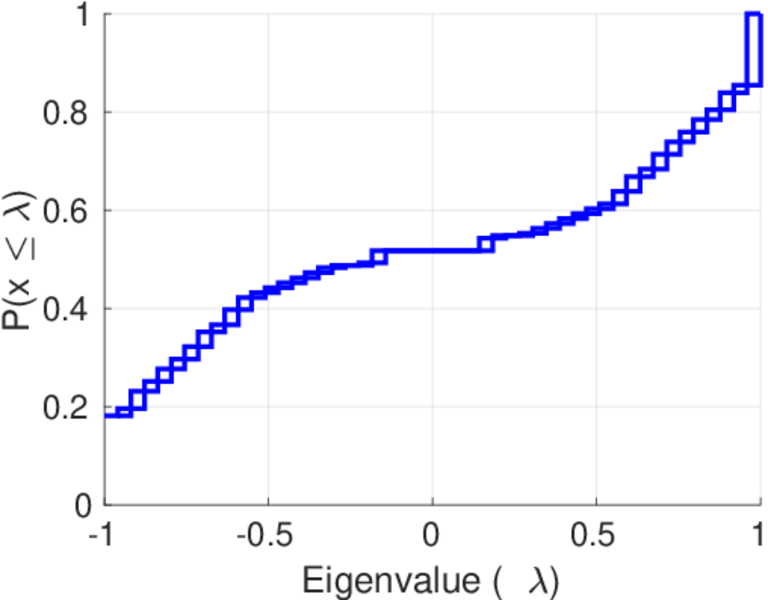
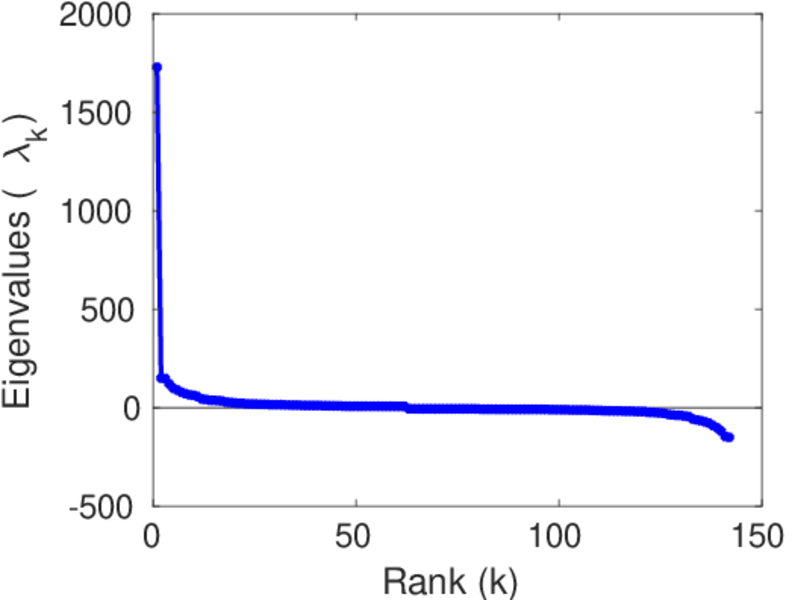
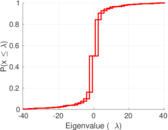
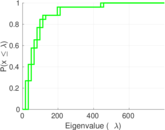
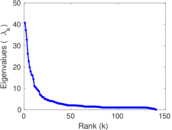
| Spectral norm | α = | 40.689 0
|
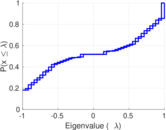
| Algebraic connectivity | a = | 0.012 355 6
|
| Spectral separation | |λ1[A] / λ2[A]| = | 1.091 76
|
| Controllability | C = | 1,440
|
| Relative controllability | Cr = | 0.837 209
|
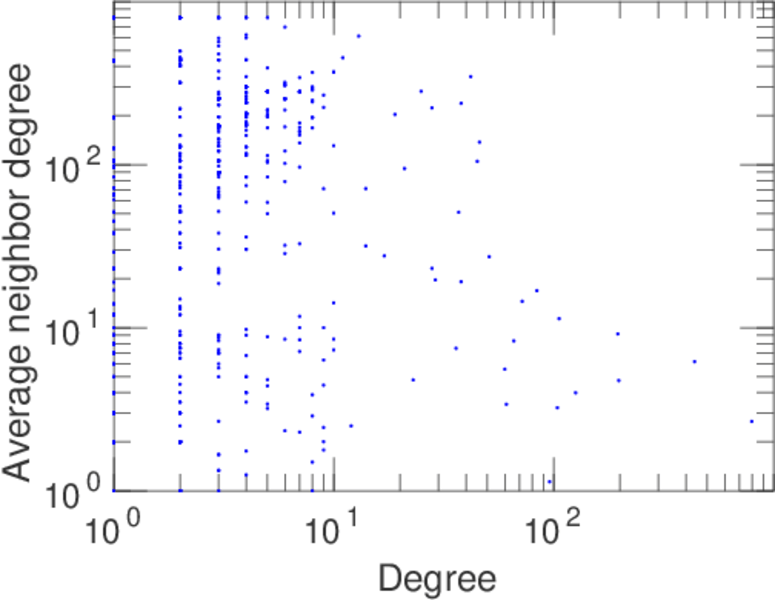
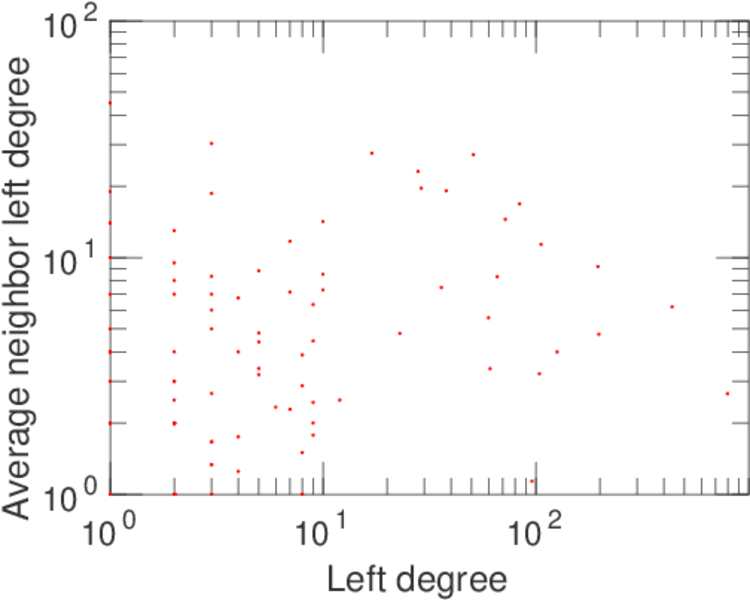
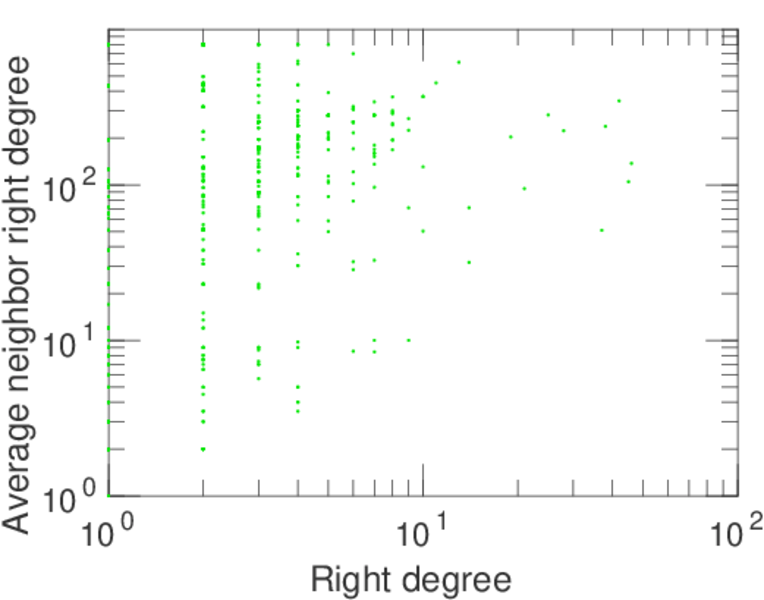
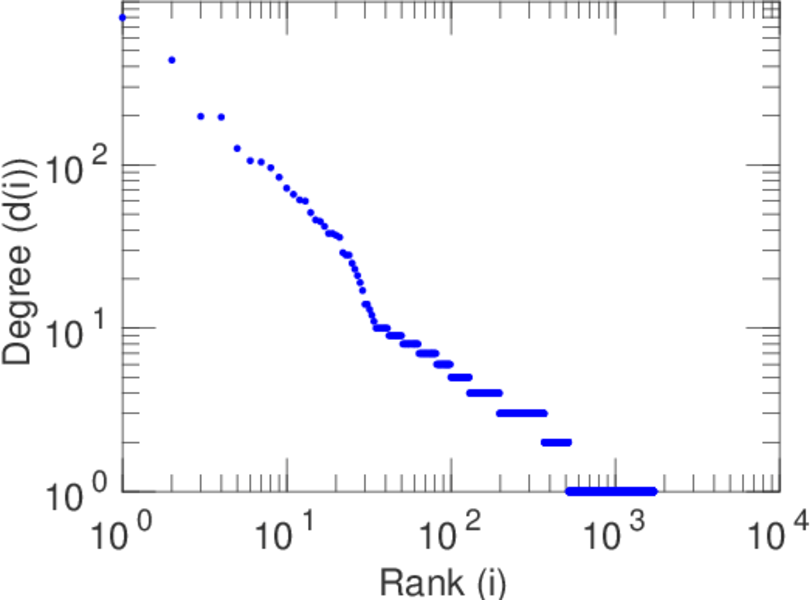
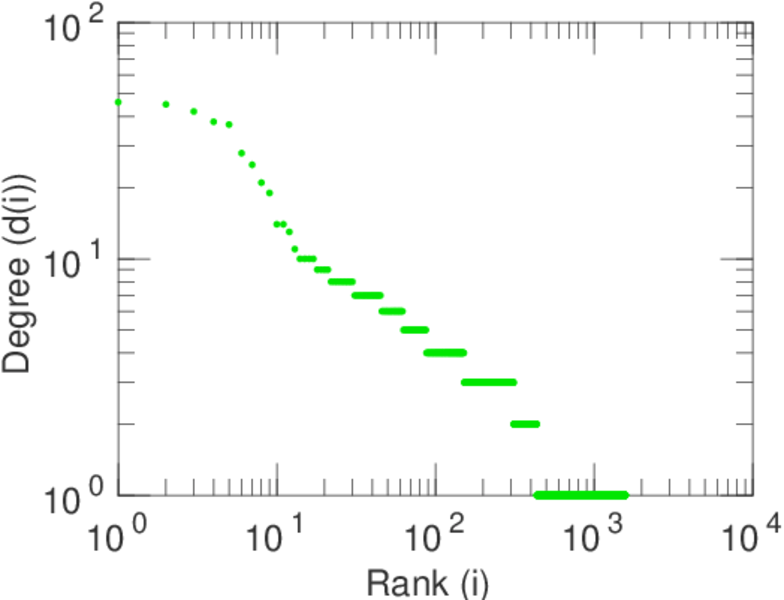
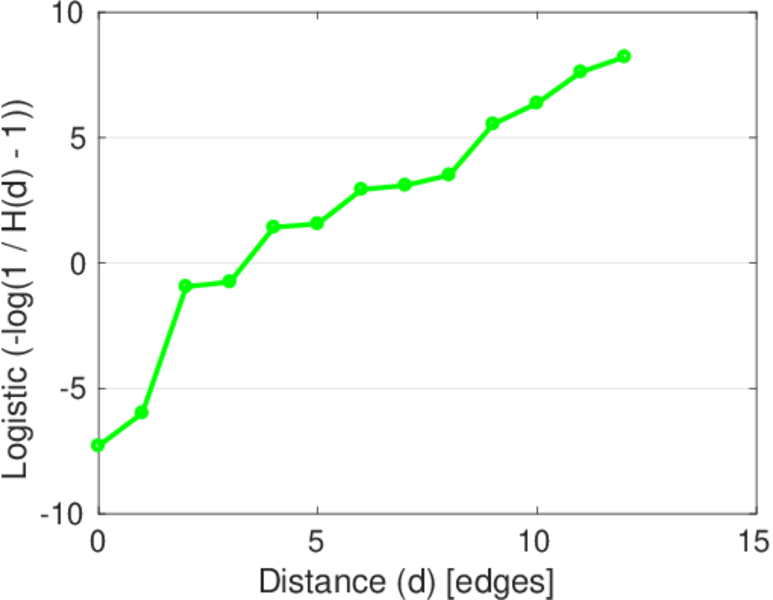
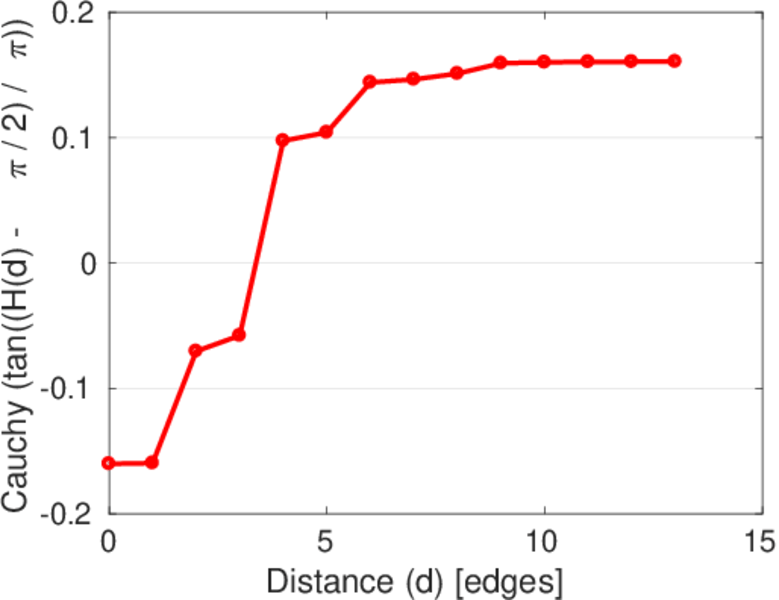
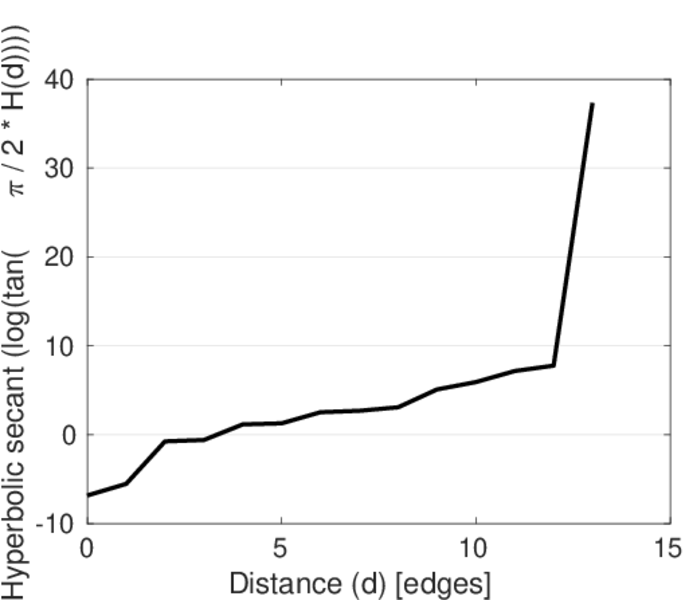
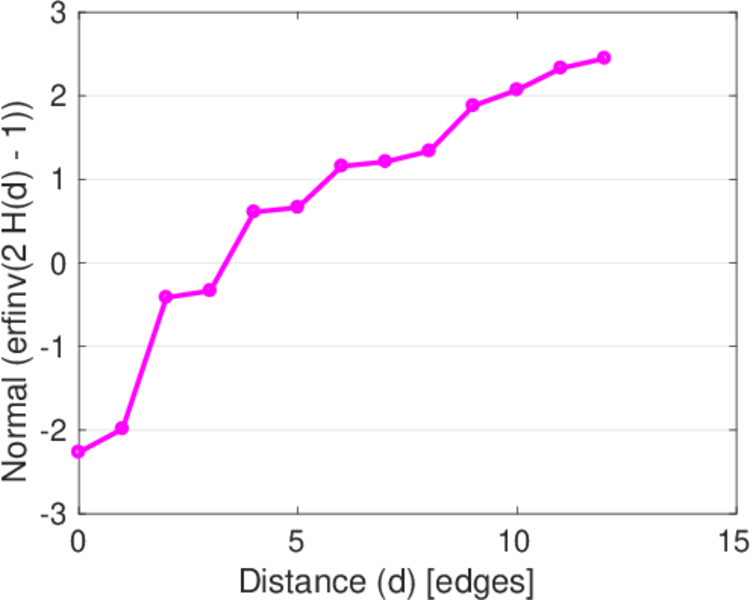
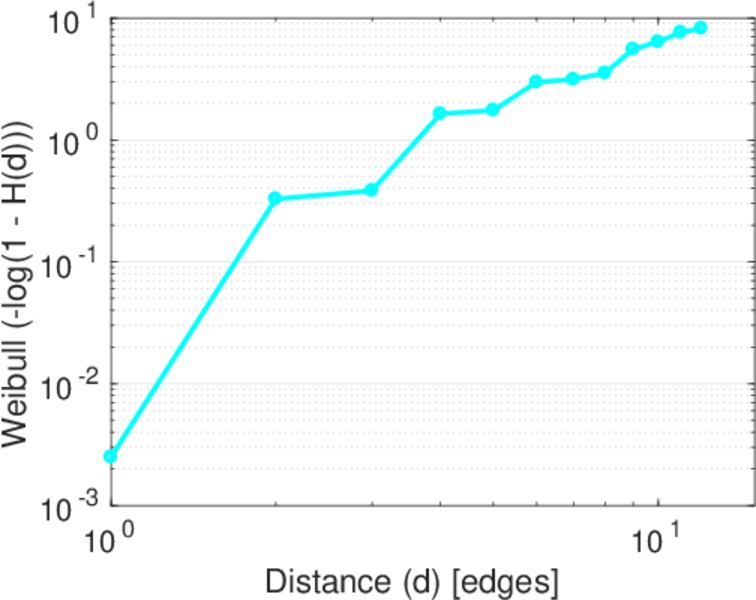
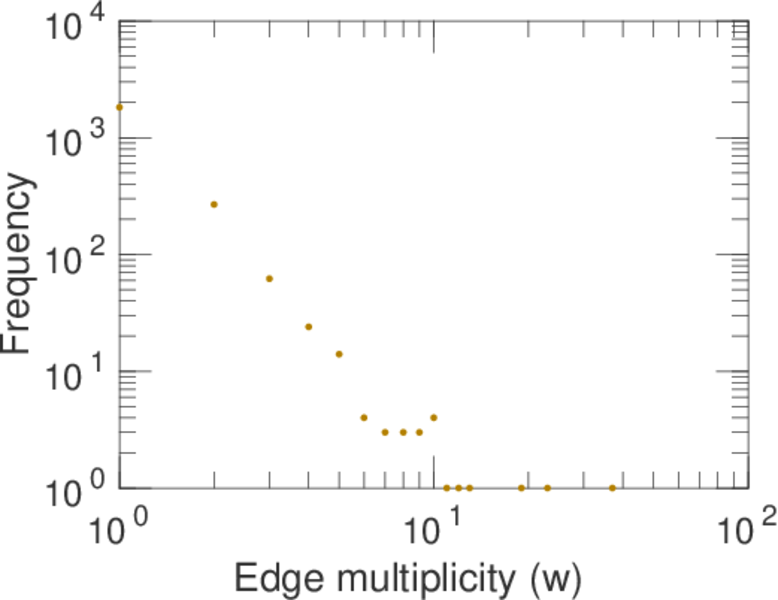
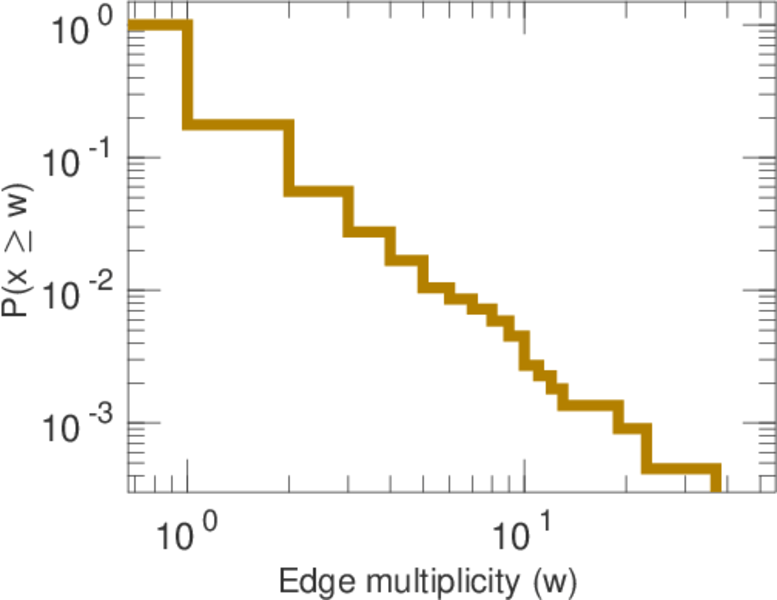
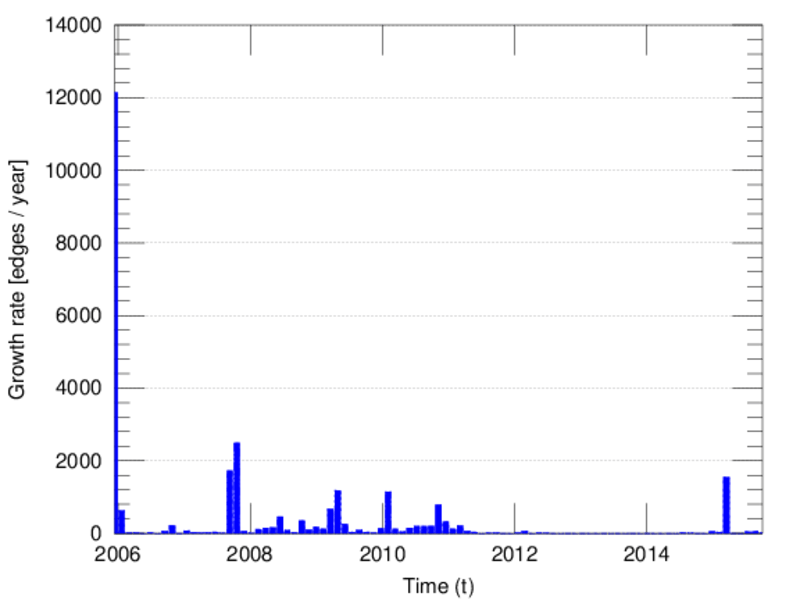
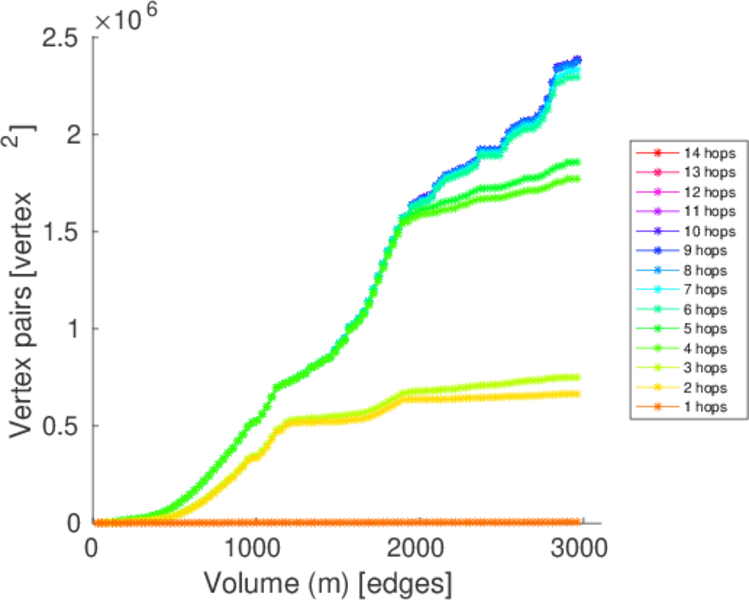
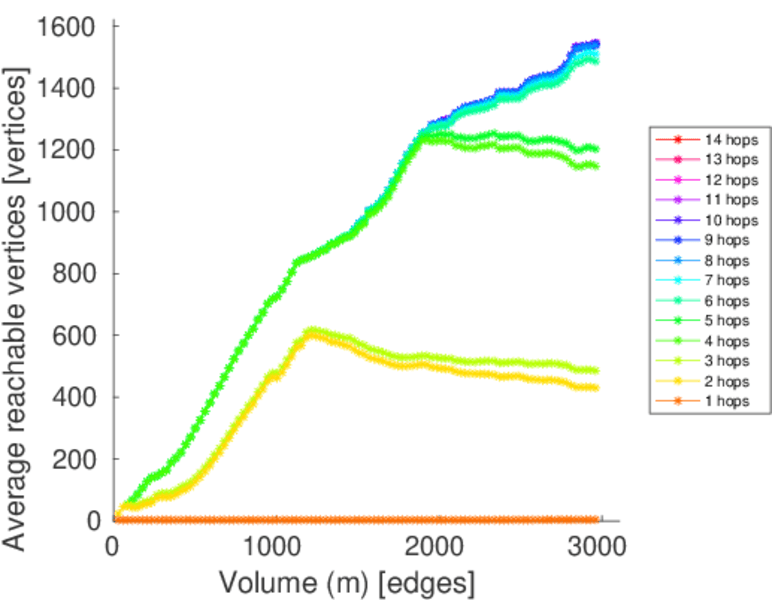
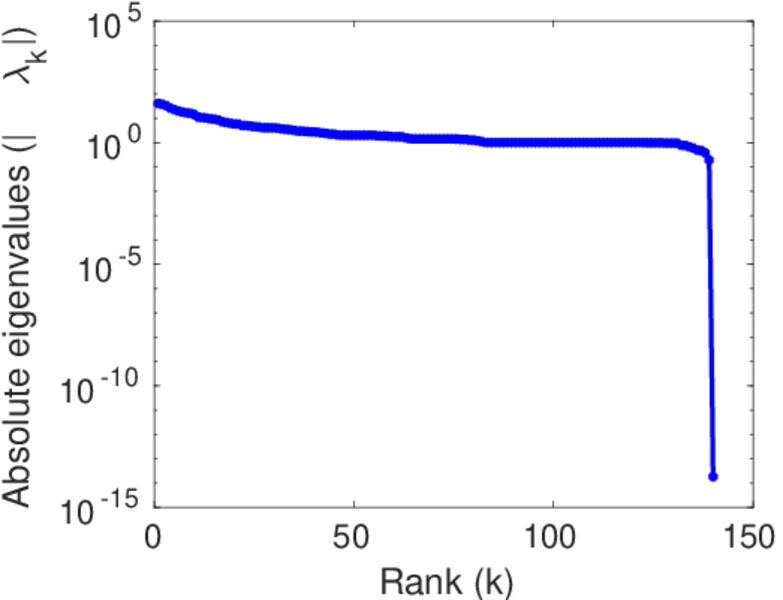
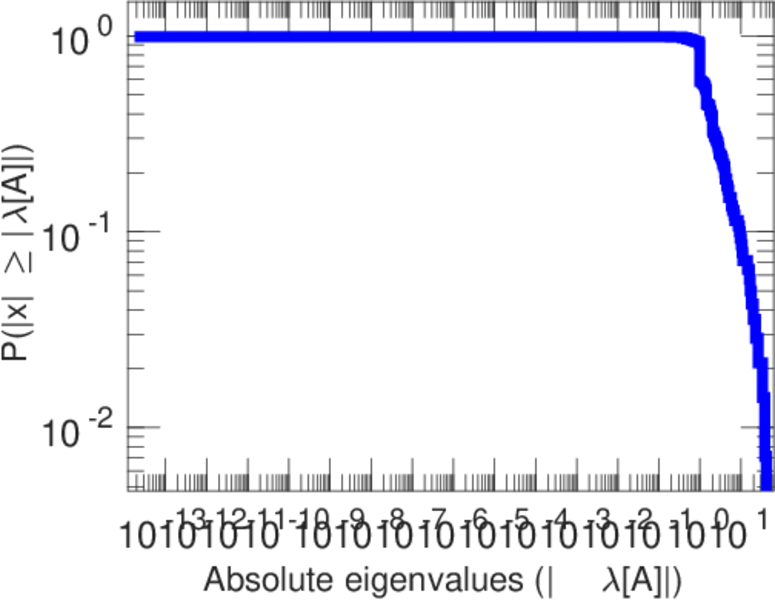
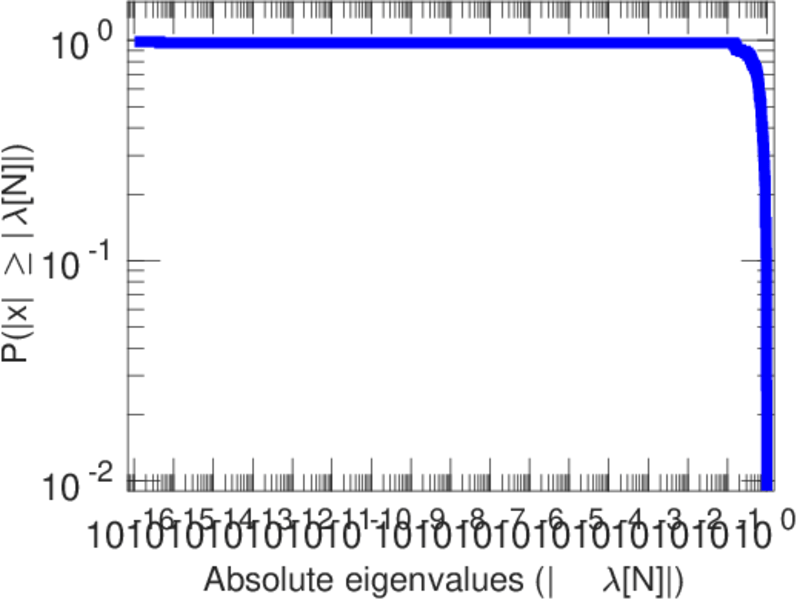
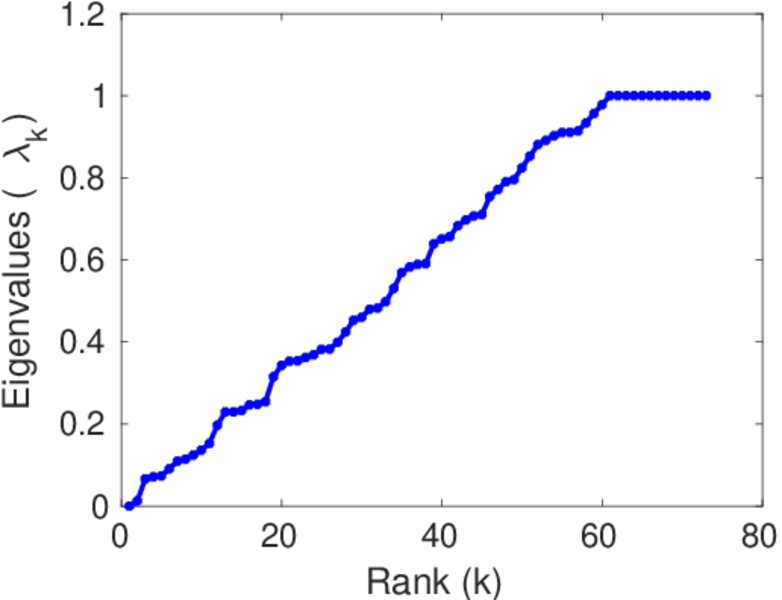
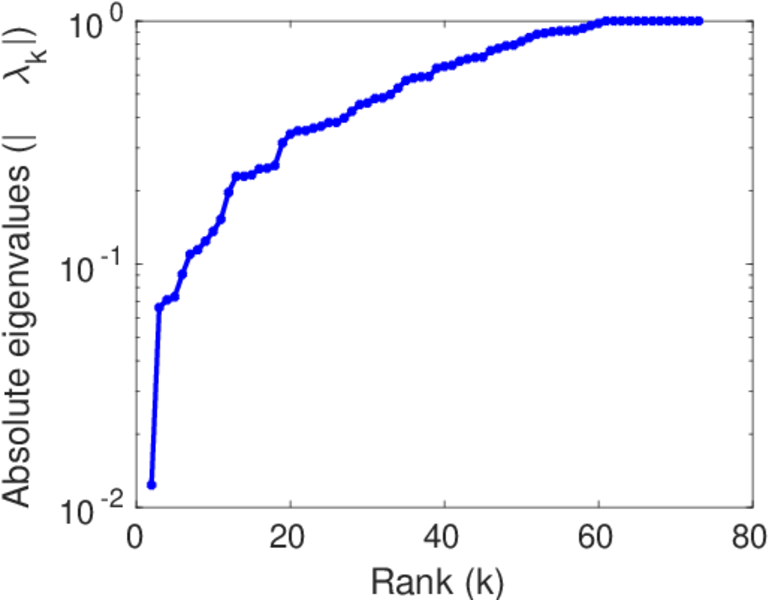
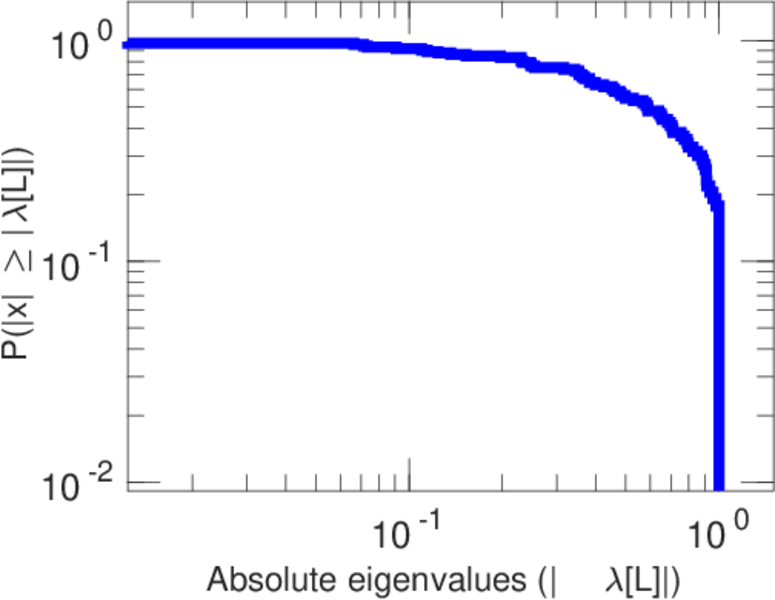
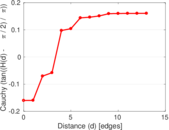
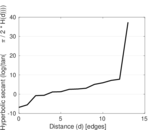
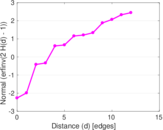
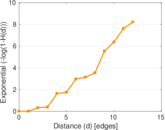
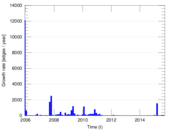
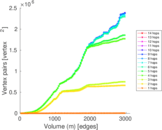
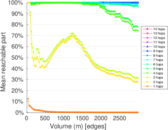
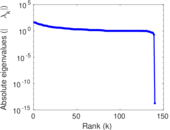
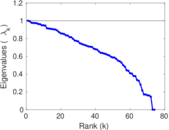
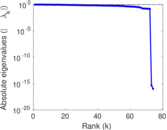
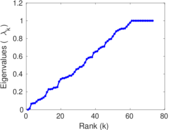
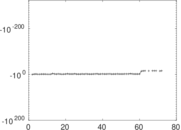
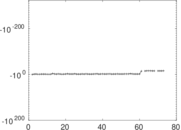
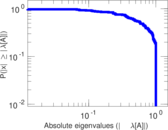
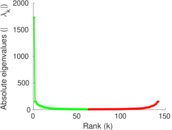
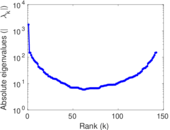
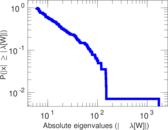
Plots


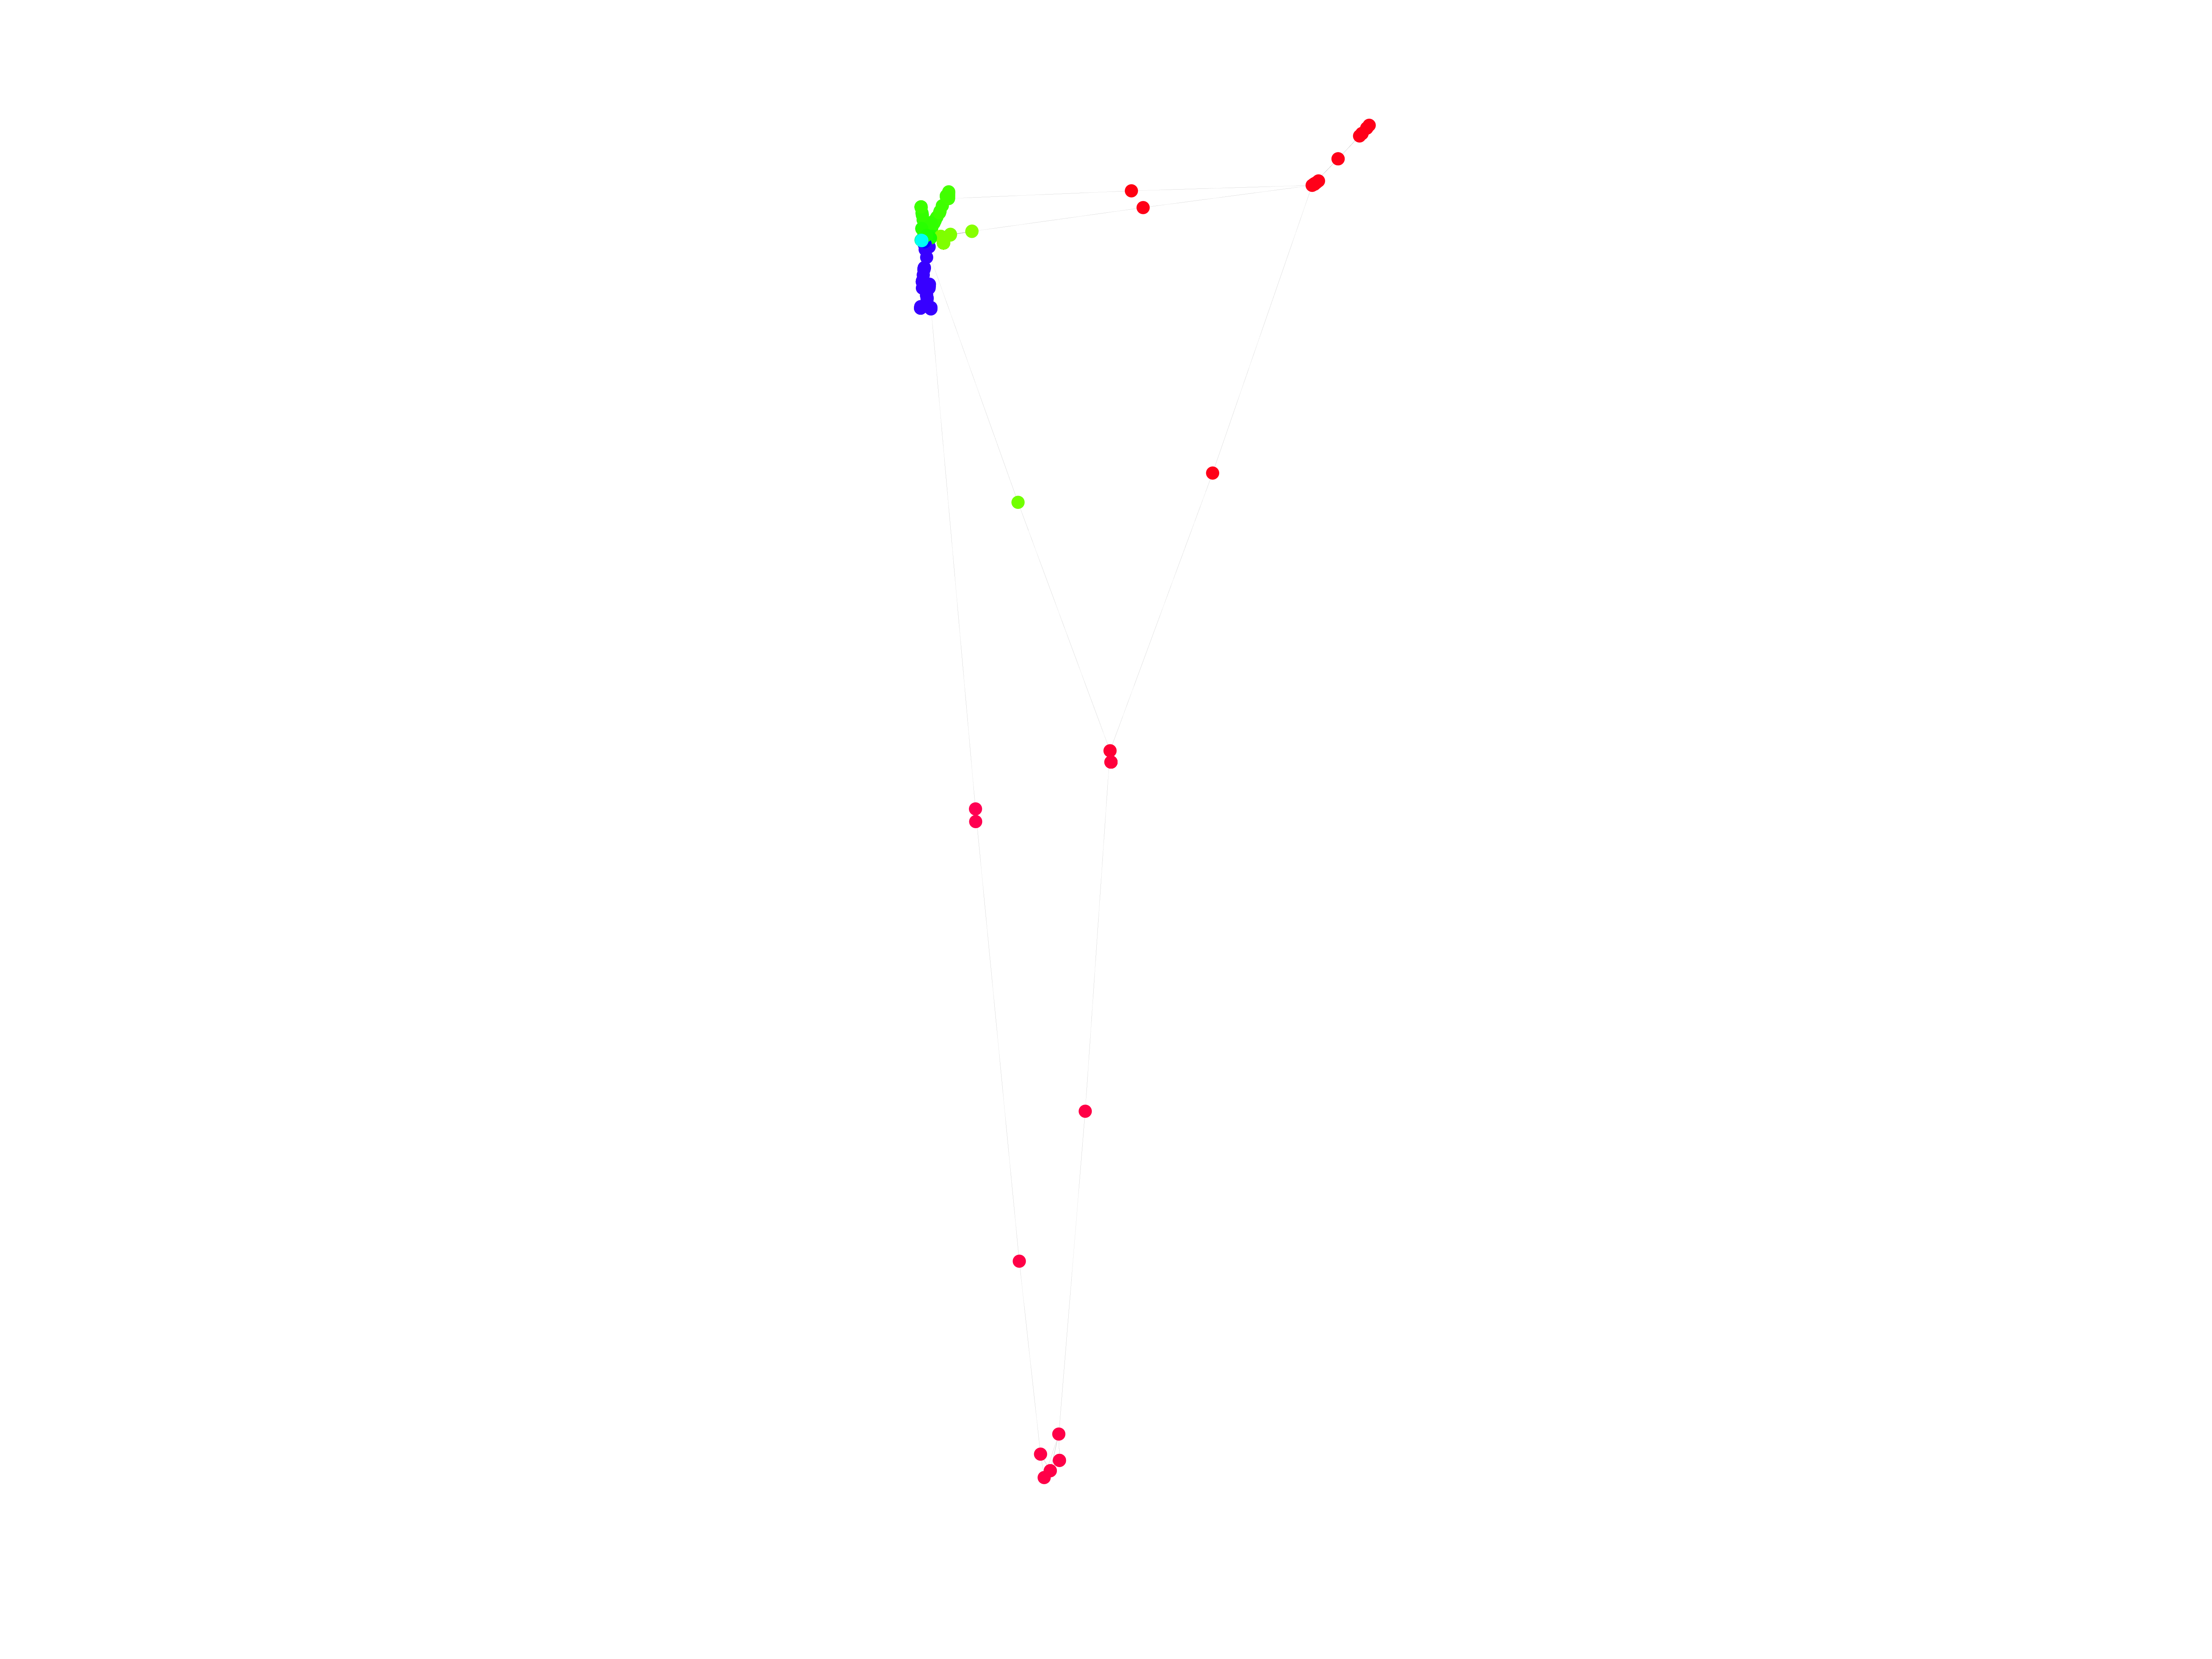
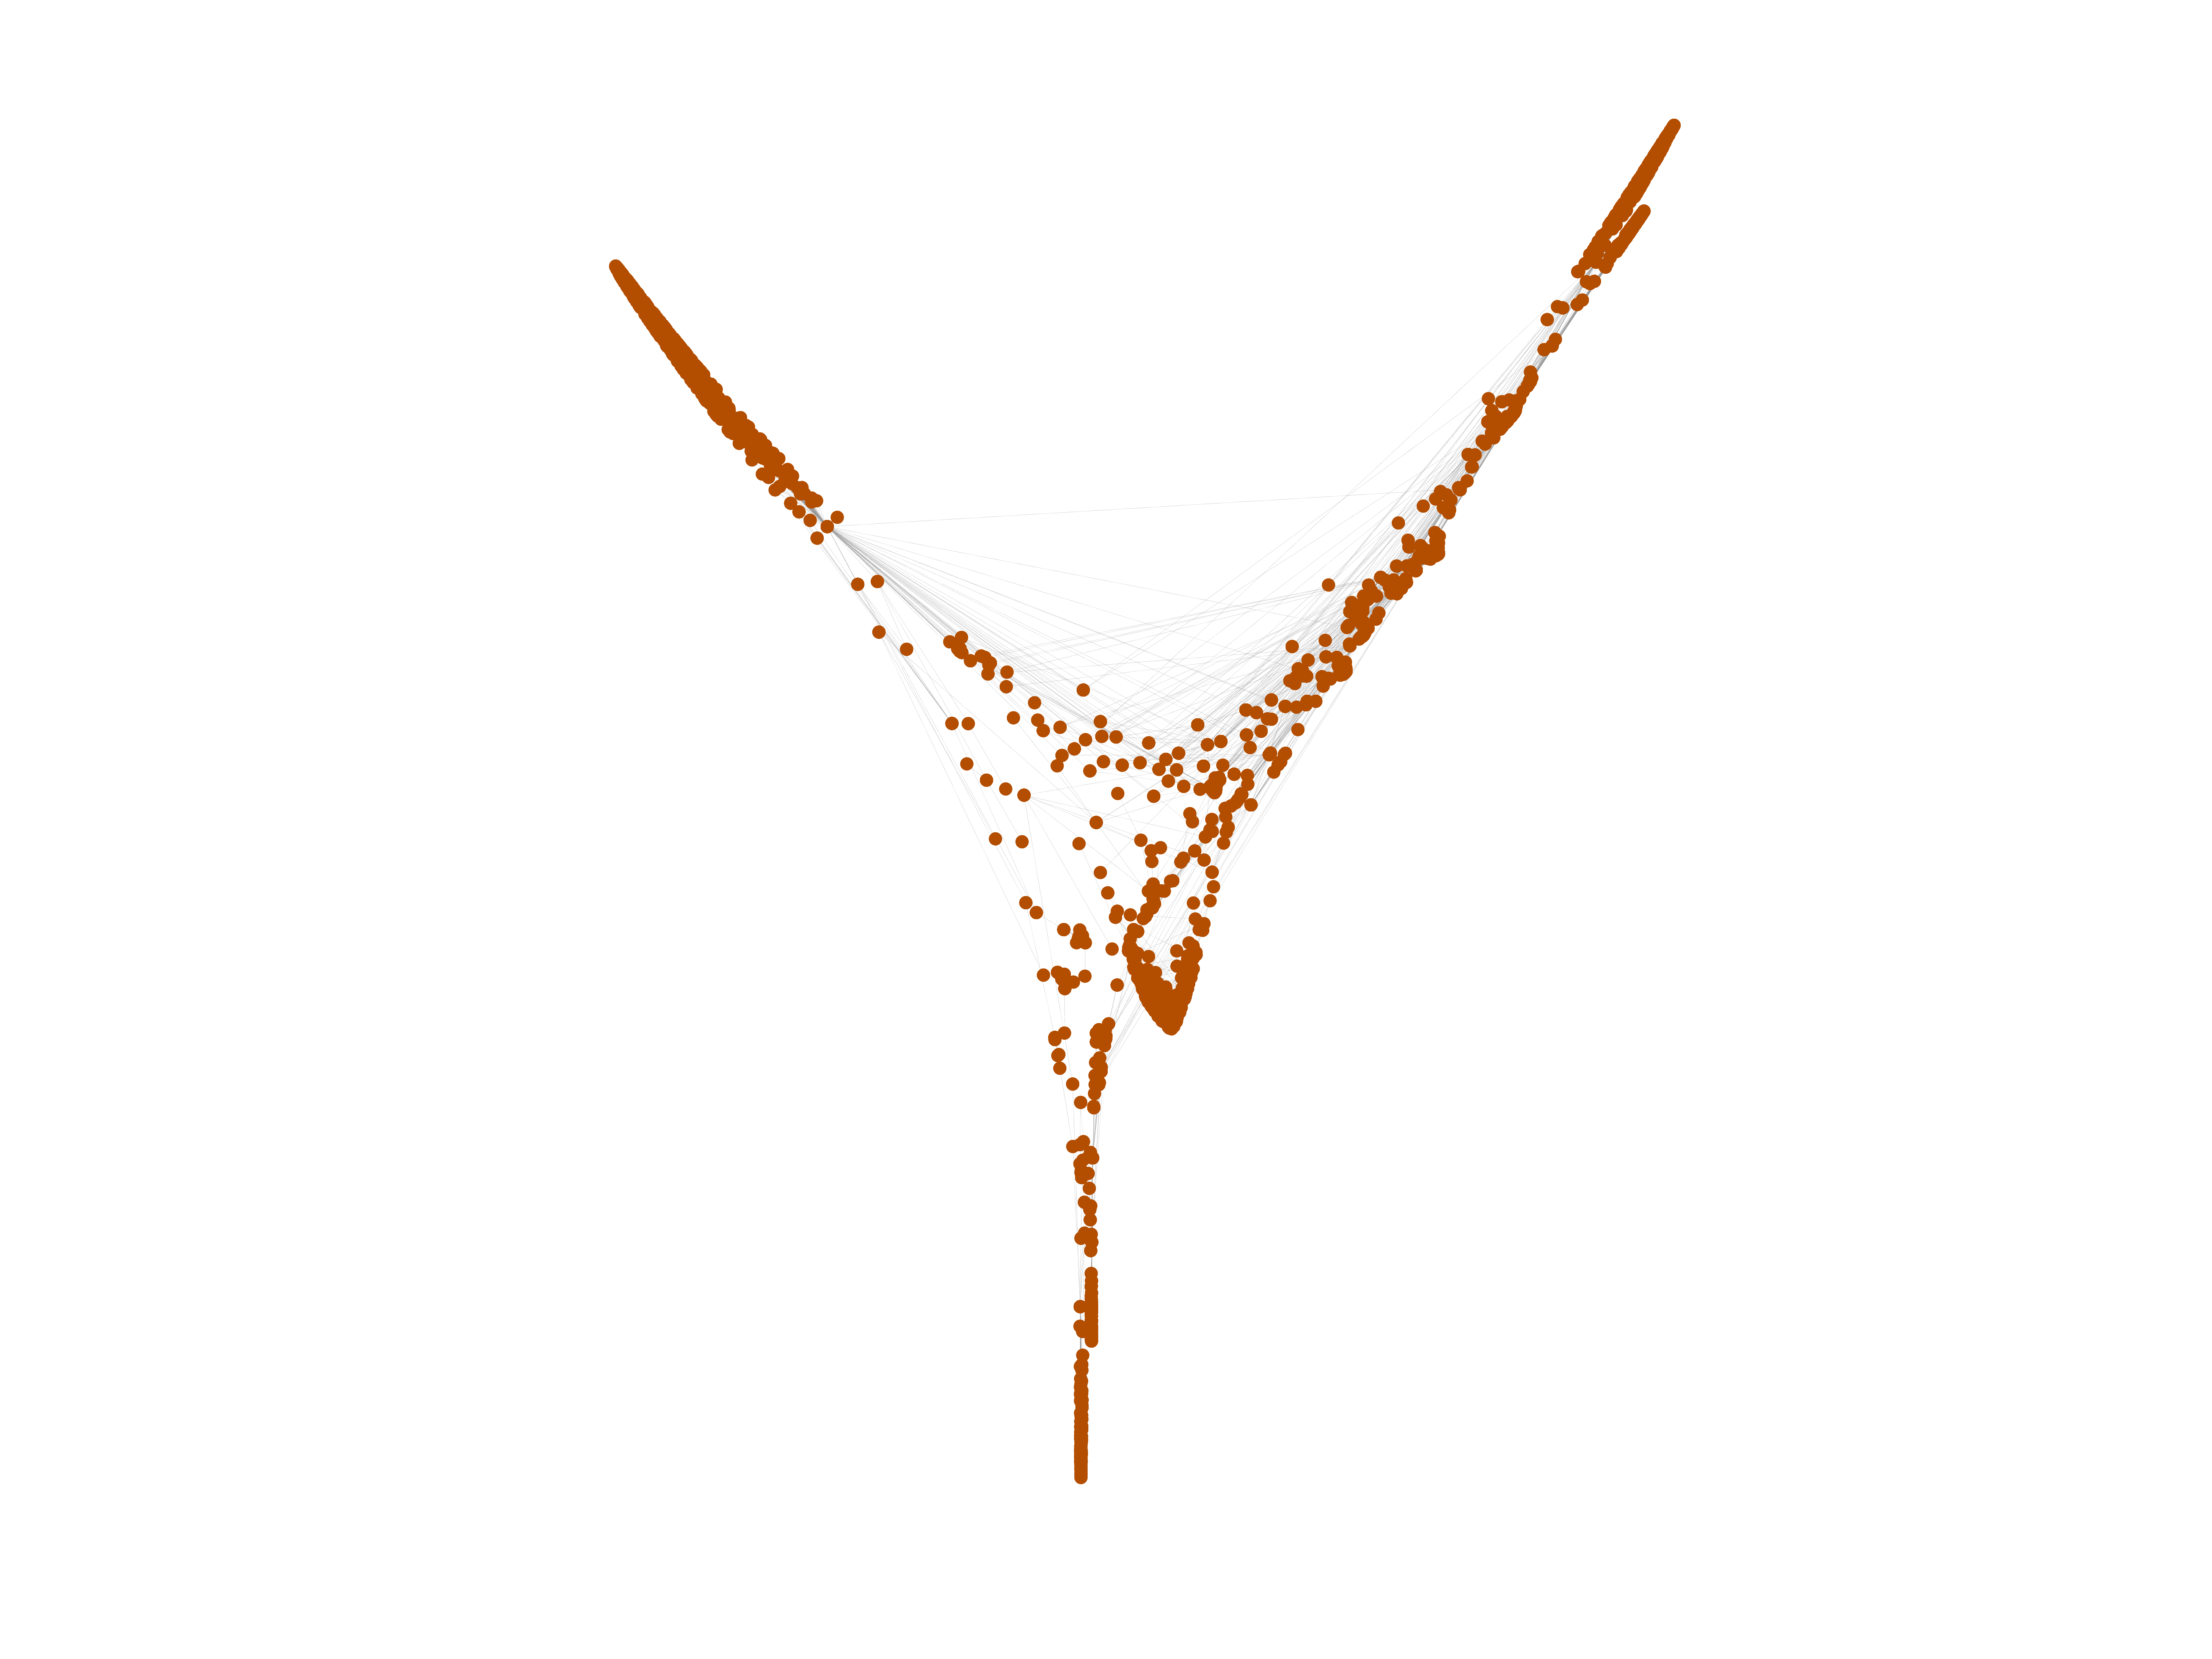
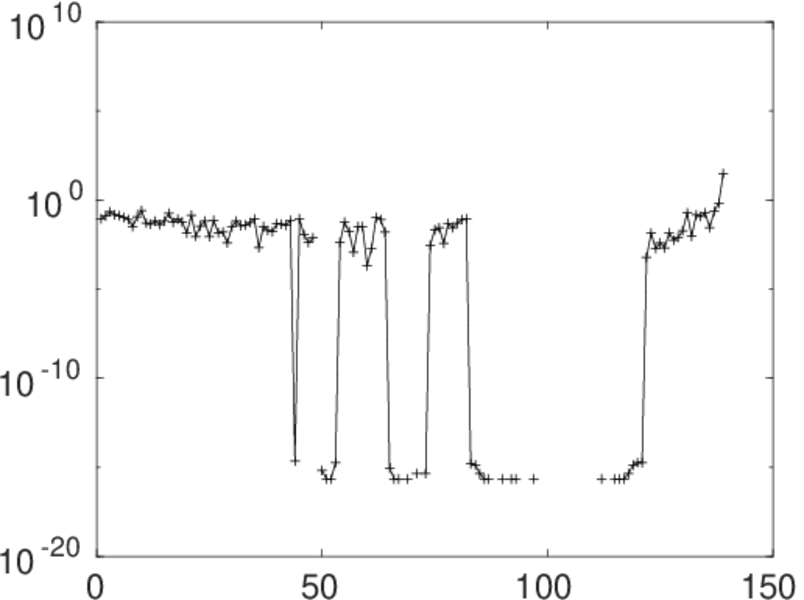
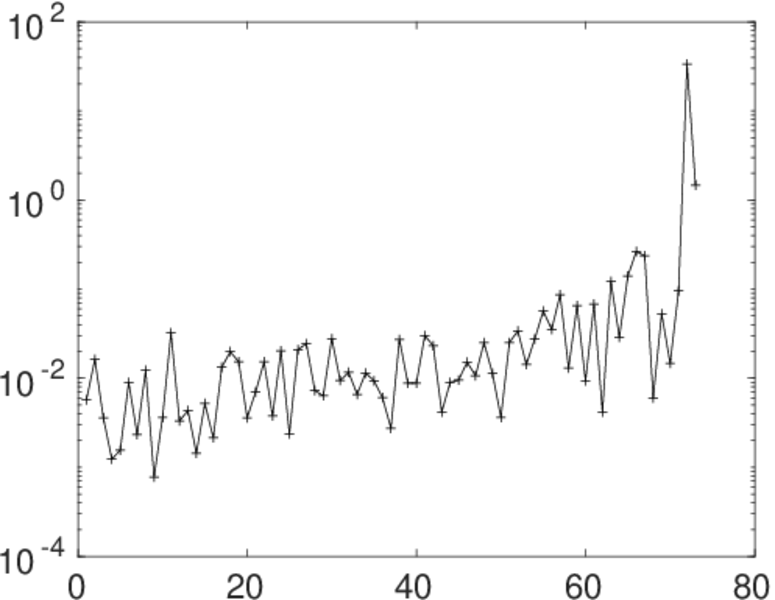
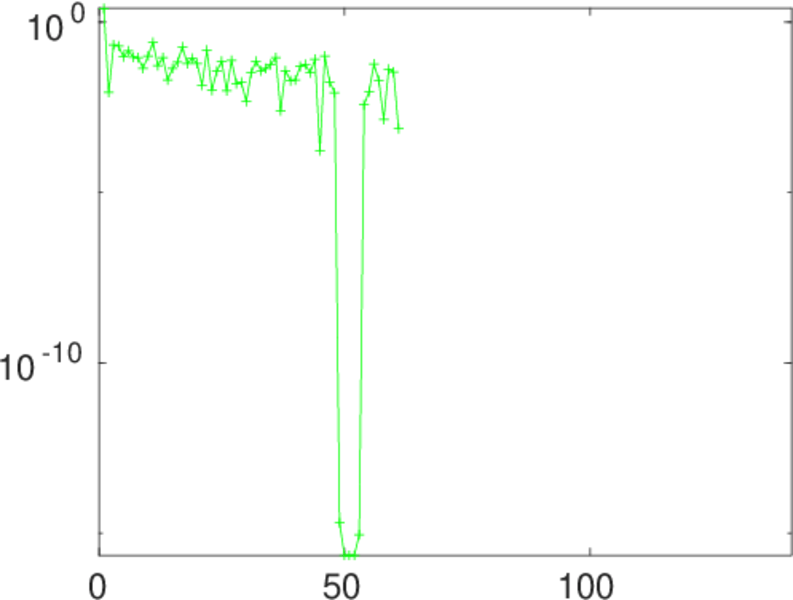
Matrix decompositions plots


Downloads
References
|
[1]
|
Jérôme Kunegis.
KONECT – The Koblenz Network Collection.
In Proc. Int. Conf. on World Wide Web Companion, pages
1343–1350, 2013.
[ http ]
|
|
[2]
|
Wikimedia Foundation.
Wikimedia downloads.
http://dumps.wikimedia.org/, January 2010.
|
 KONECT ‣ Networks ‣
Buy Me a Coffee
KONECT ‣ Networks ‣
Buy Me a Coffee