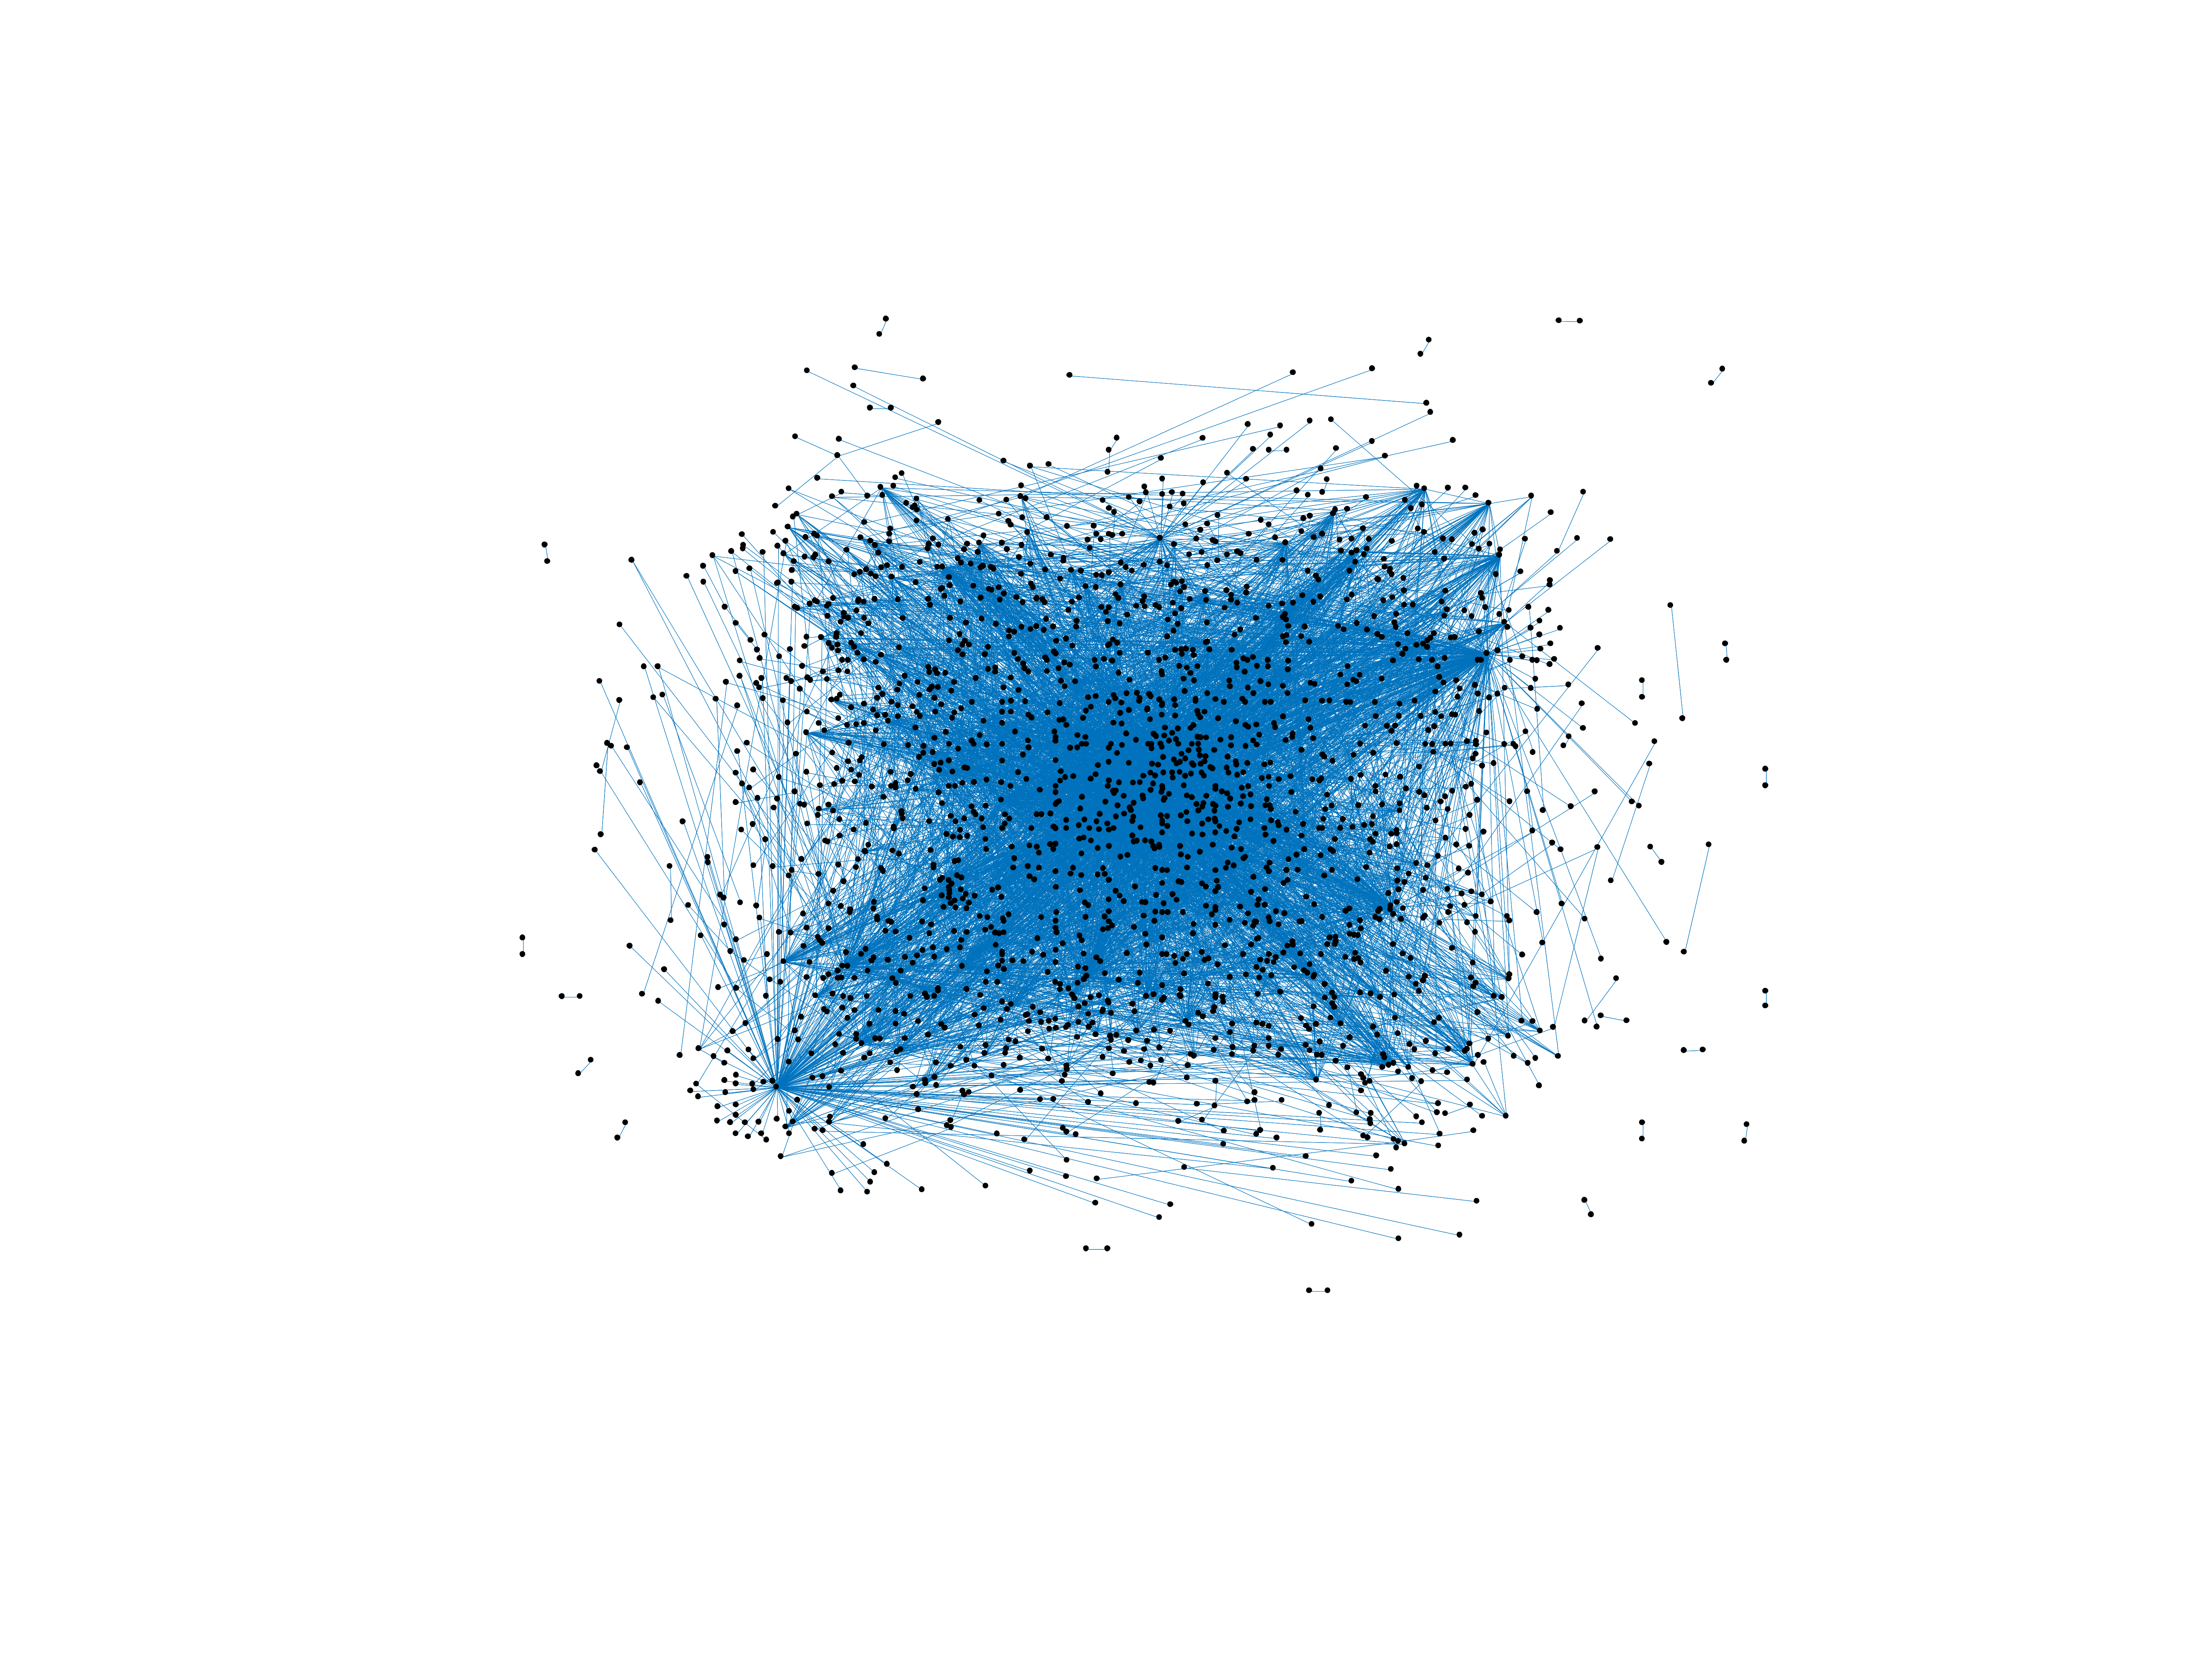
Wikipedia edits (ti)
This is the bipartite edit network of the Tigrinya Wikipedia. It contains users
and pages from the Tigrinya Wikipedia, connected by edit events. Each edge
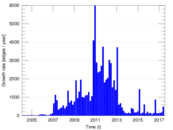
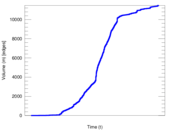
represents an edit. The dataset includes the timestamp of each edit.
Metadata
Statistics
| Size | n = | 2,174
|
| Left size | n1 = | 584
|
| Right size | n2 = | 1,590
|
| Volume | m = | 11,472
|
| Unique edge count | m̿ = | 5,549
|
| Wedge count | s = | 270,723
|
| Claw count | z = | 11,406,927
|
| Cross count | x = | 478,232,592
|
| Square count | q = | 677,213
|
| 4-Tour count | T4 = | 6,515,154
|
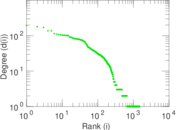
| Maximum degree | dmax = | 881
|
| Maximum left degree | d1max = | 881
|
| Maximum right degree | d2max = | 196
|
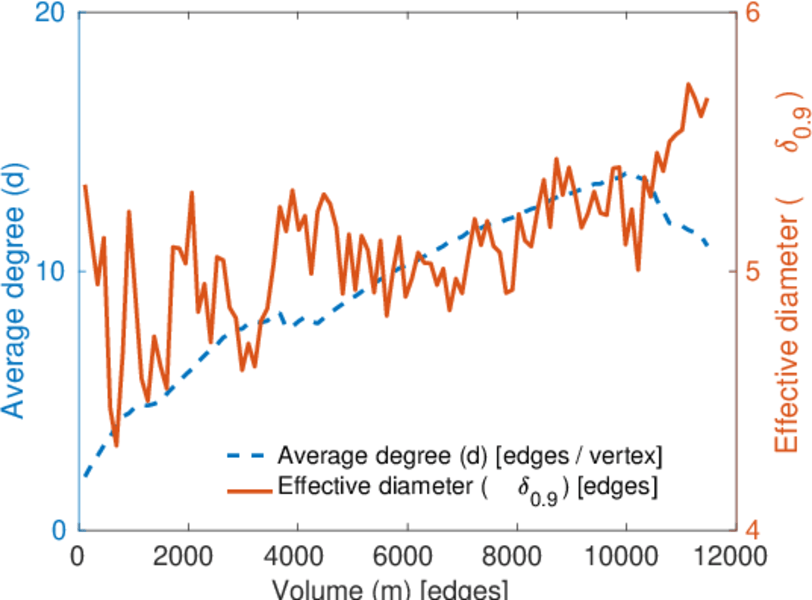
| Average degree | d = | 10.553 8
|
| Average left degree | d1 = | 19.643 8
|
| Average right degree | d2 = | 7.215 09
|
| Fill | p = | 0.005 975 92
|
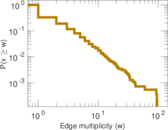
| Average edge multiplicity | m̃ = | 2.067 40
|
| Size of LCC | N = | 1,494
|
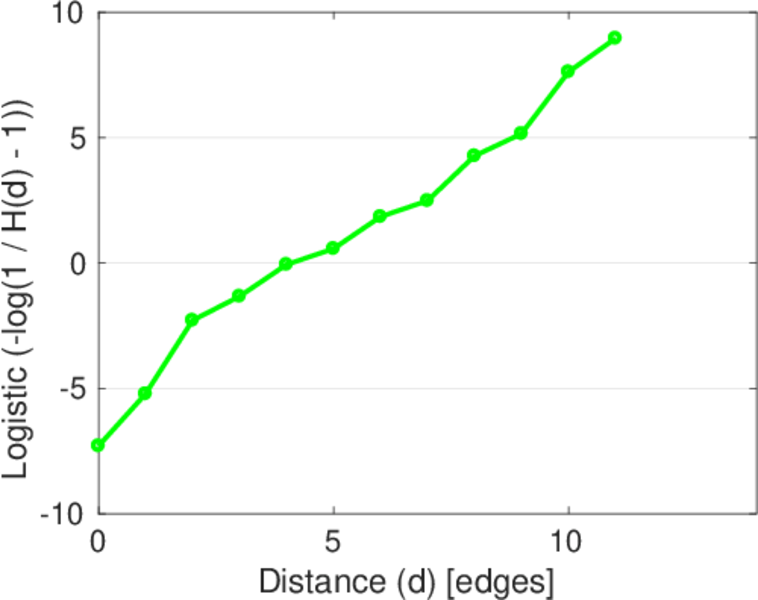
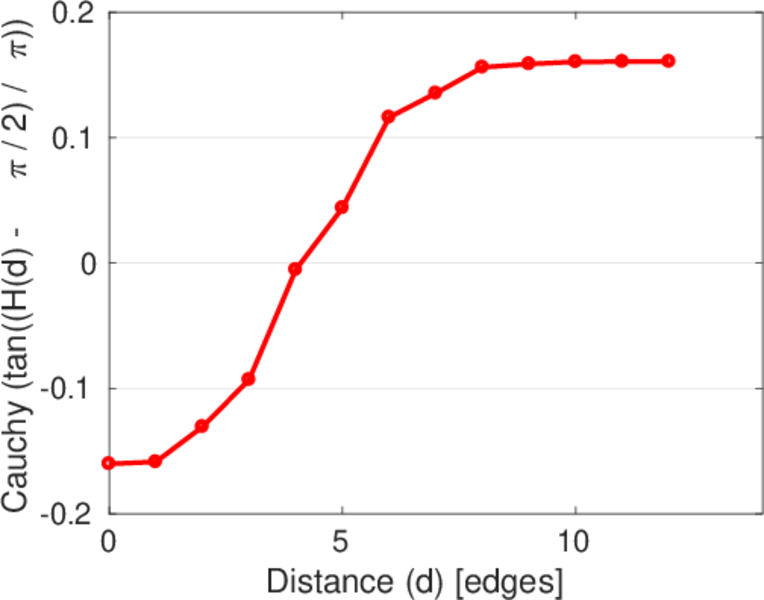
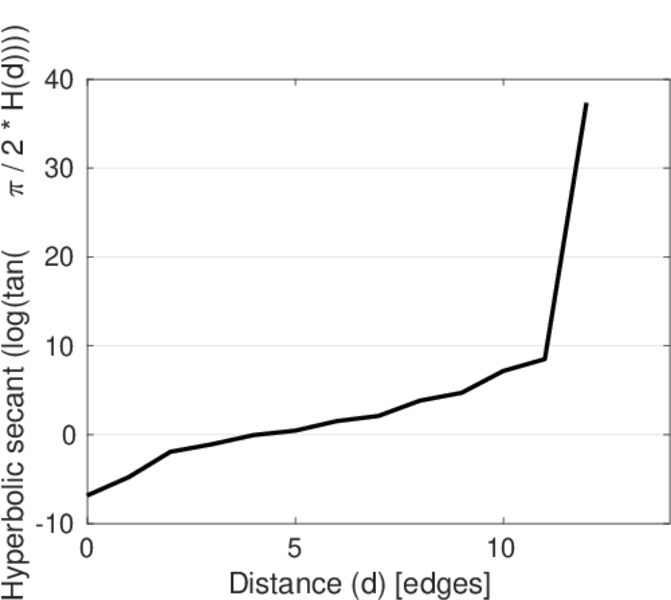
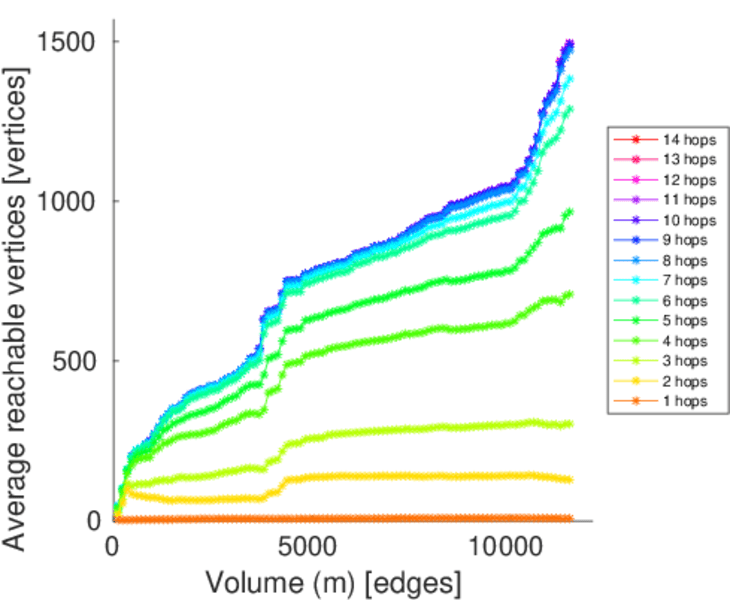
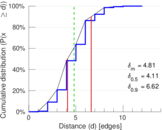
| Diameter | δ = | 13
|
| 50-Percentile effective diameter | δ0.5 = | 4.110 98
|
| 90-Percentile effective diameter | δ0.9 = | 6.622 07
|
| Median distance | δM = | 5
|
| Mean distance | δm = | 4.808 87
|
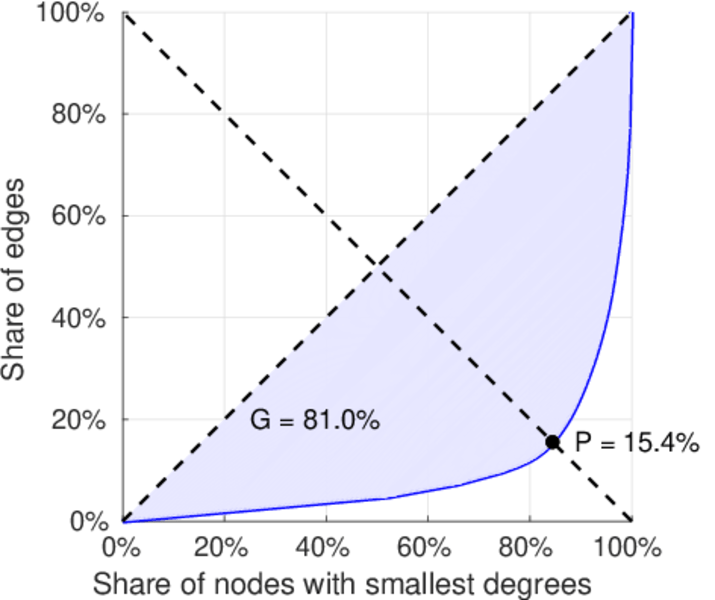
| Gini coefficient | G = | 0.803 913
|
| Balanced inequality ratio | P = | 0.163 616
|
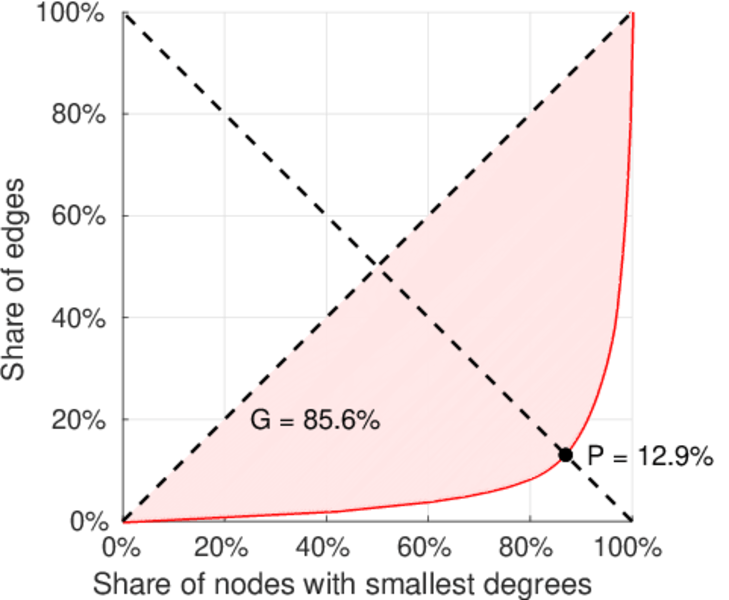
| Left balanced inequality ratio | P1 = | 0.128 661
|
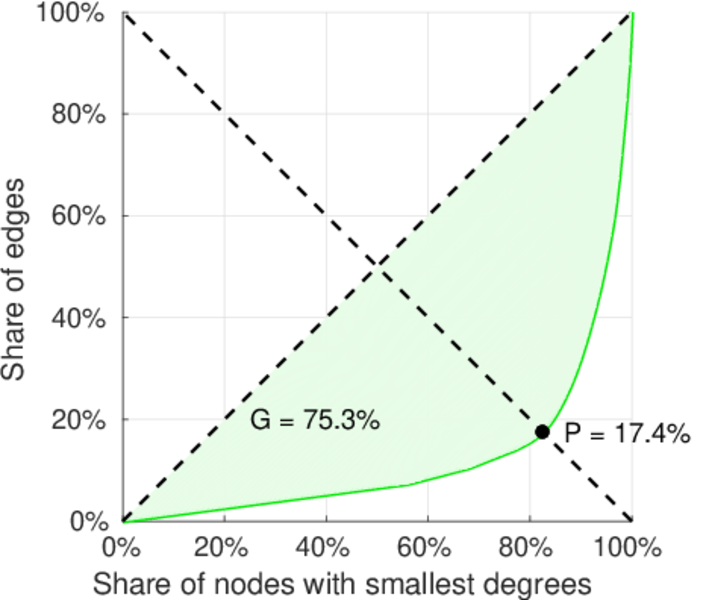
| Right balanced inequality ratio | P2 = | 0.173 989
|
| Relative edge distribution entropy | Her = | 0.831 039
|
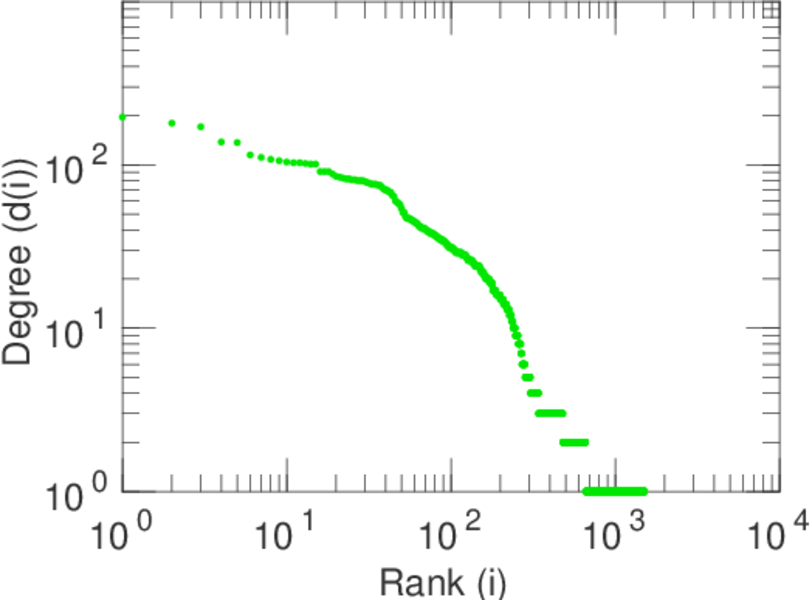
| Power law exponent | γ = | 2.504 90
|
| Tail power law exponent | γt = | 2.671 00
|
| Tail power law exponent with p | γ3 = | 2.671 00
|
| p-value | p = | 0.959 000
|
| Left tail power law exponent with p | γ3,1 = | 1.721 00
|
| Left p-value | p1 = | 0.023 000 0
|
| Right tail power law exponent with p | γ3,2 = | 7.191 00
|
| Right p-value | p2 = | 0.824 000
|
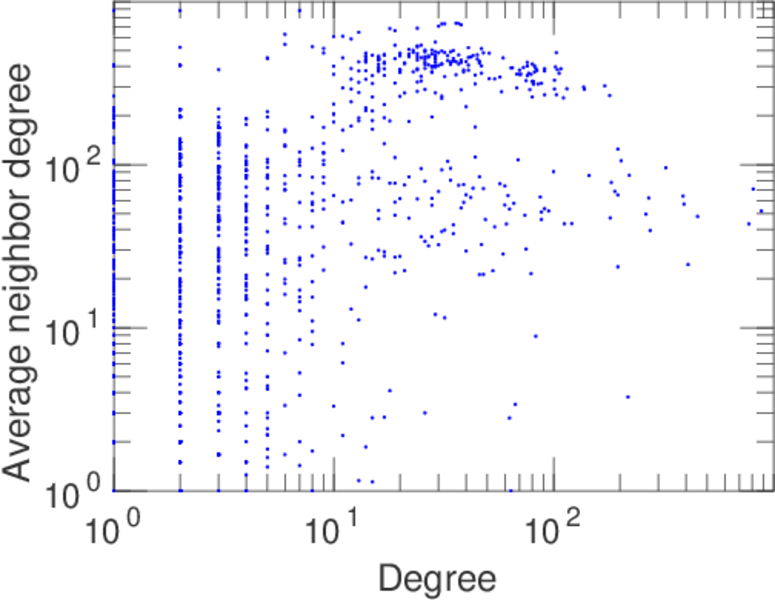
| Degree assortativity | ρ = | −0.039 277 2
|
| Degree assortativity p-value | pρ = | 0.003 430 26
|
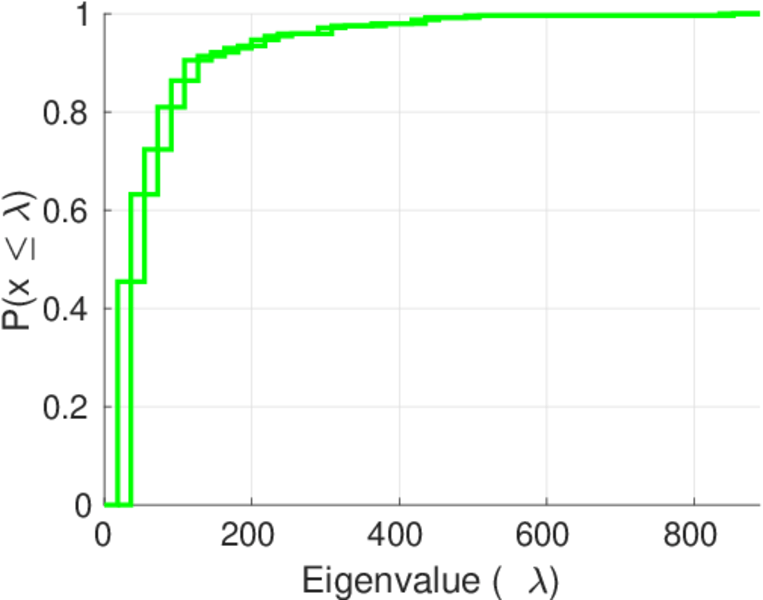
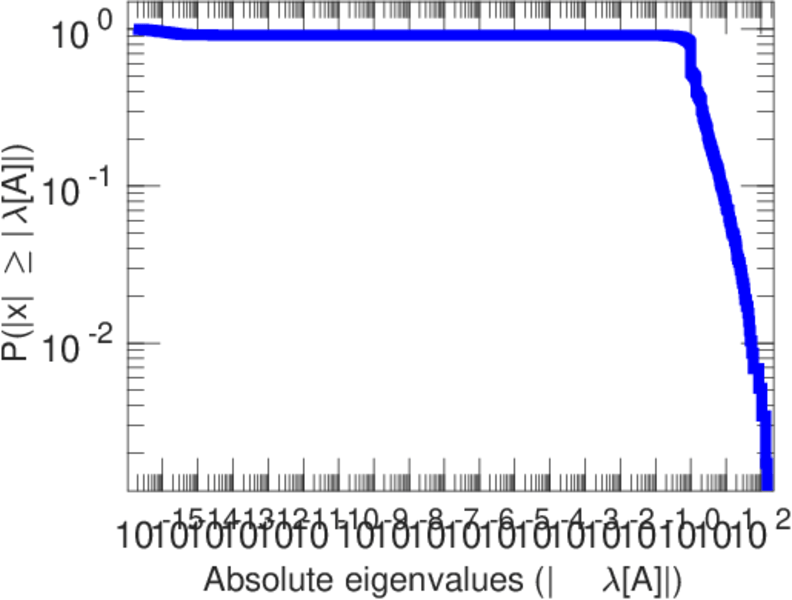
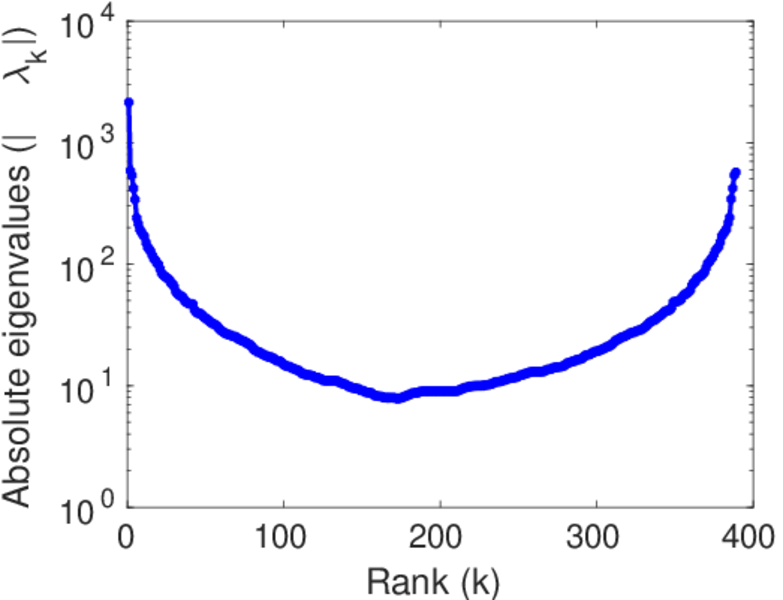
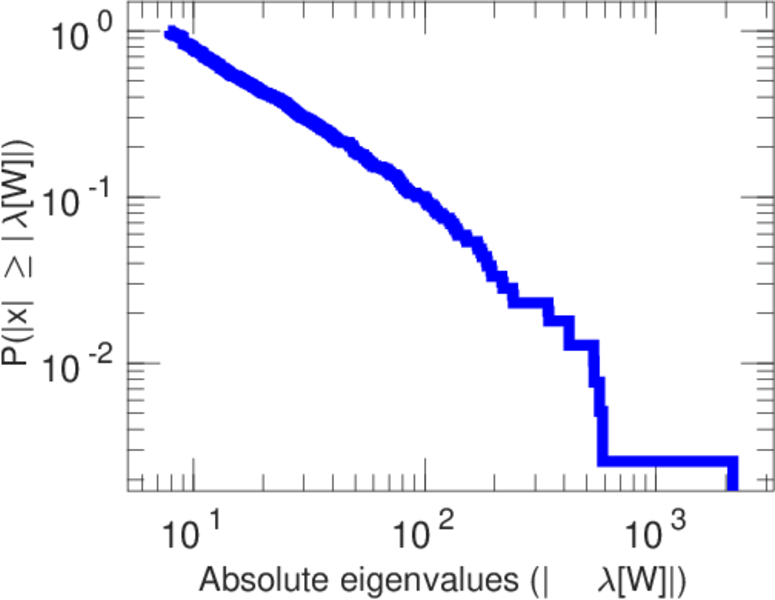
| Spectral norm | α = | 149.344
|
| Algebraic connectivity | a = | 0.026 928 6
|
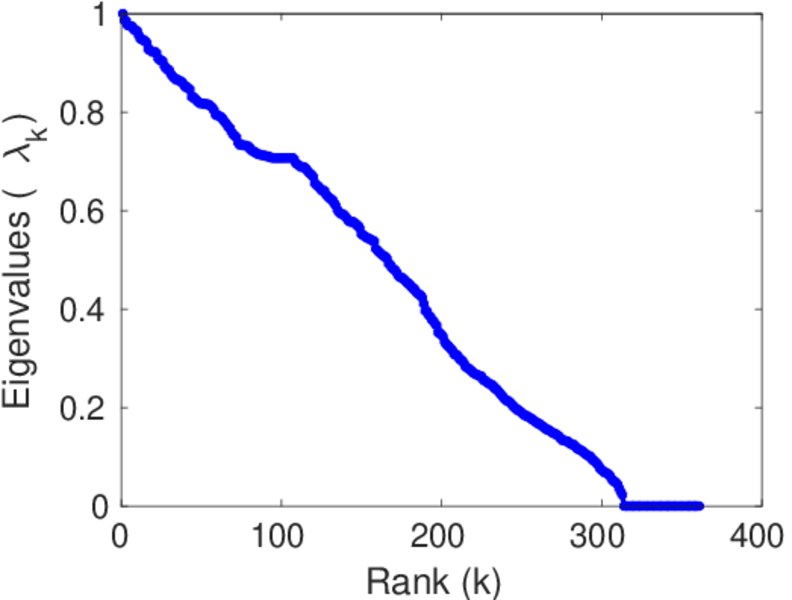
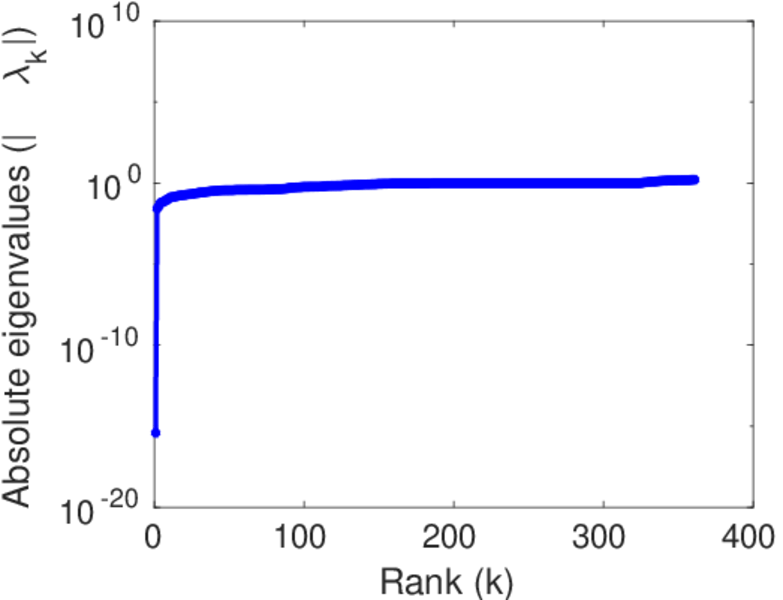
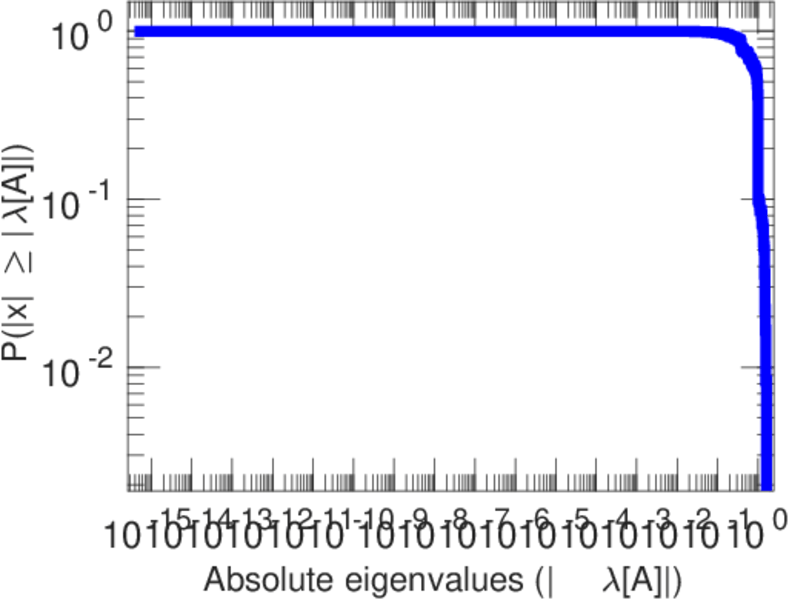
| Spectral separation | |λ1[A] / λ2[A]| = | 1.110 14
|
| Controllability | C = | 1,024
|
| Relative controllability | Cr = | 0.489 952
|
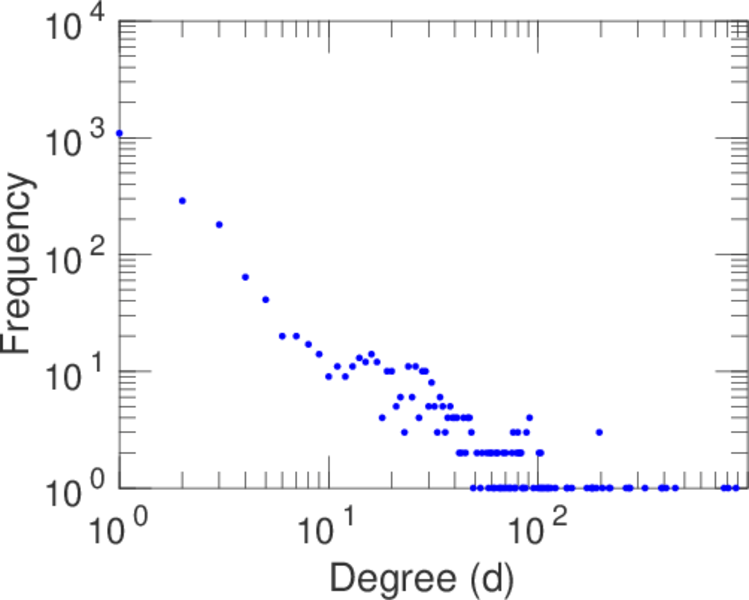
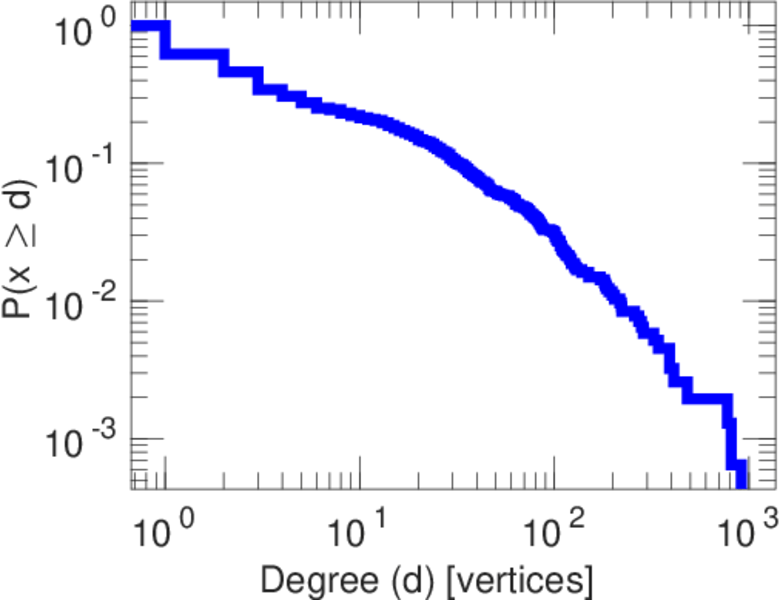
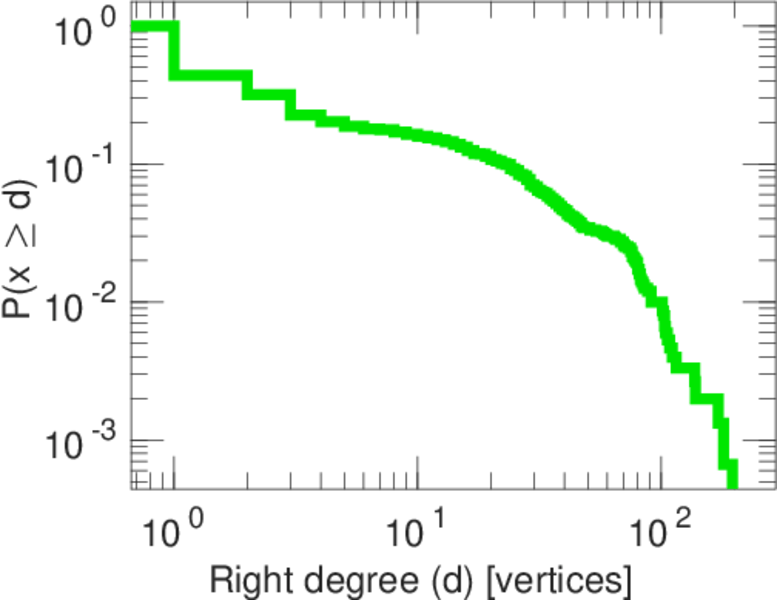
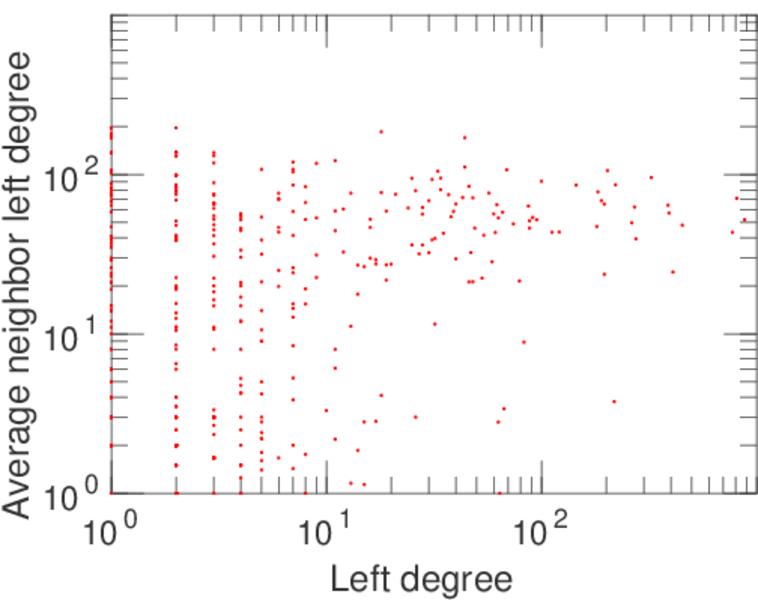
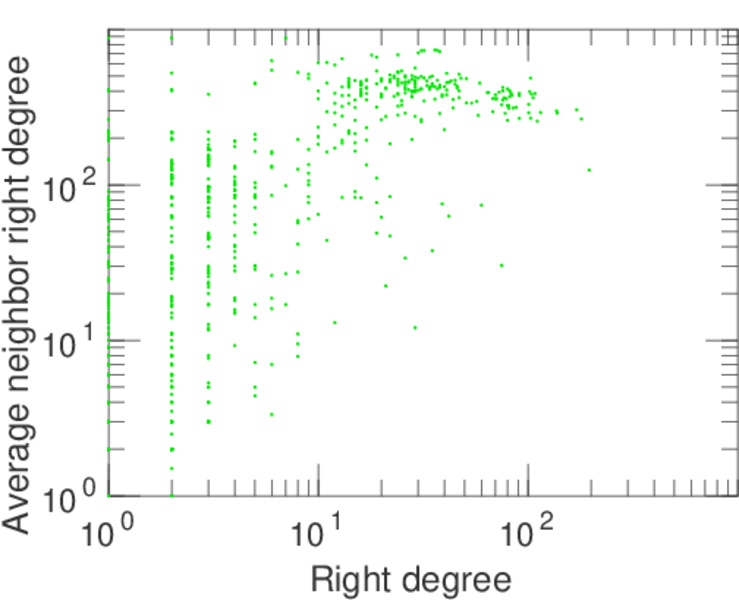
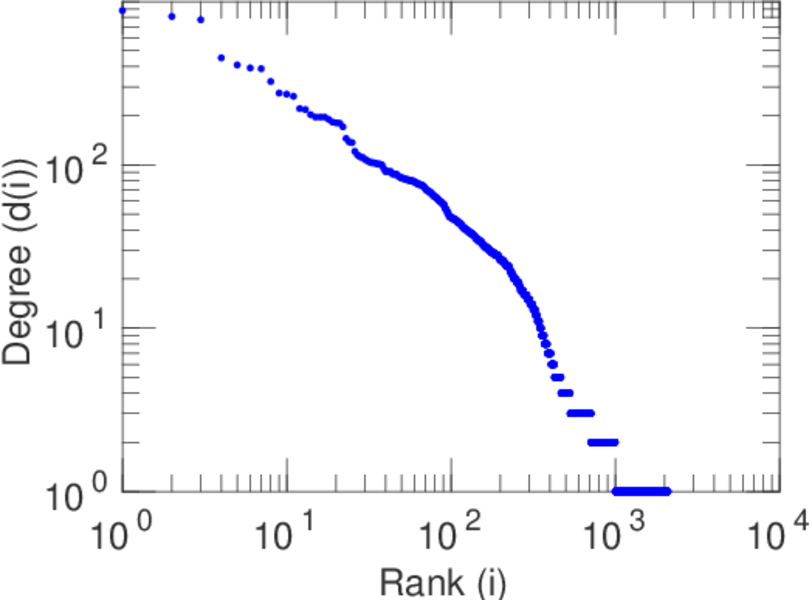
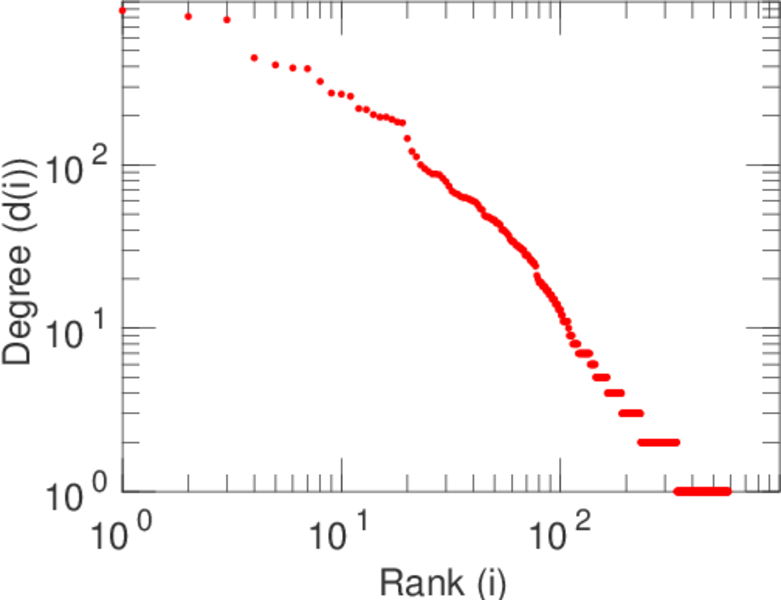
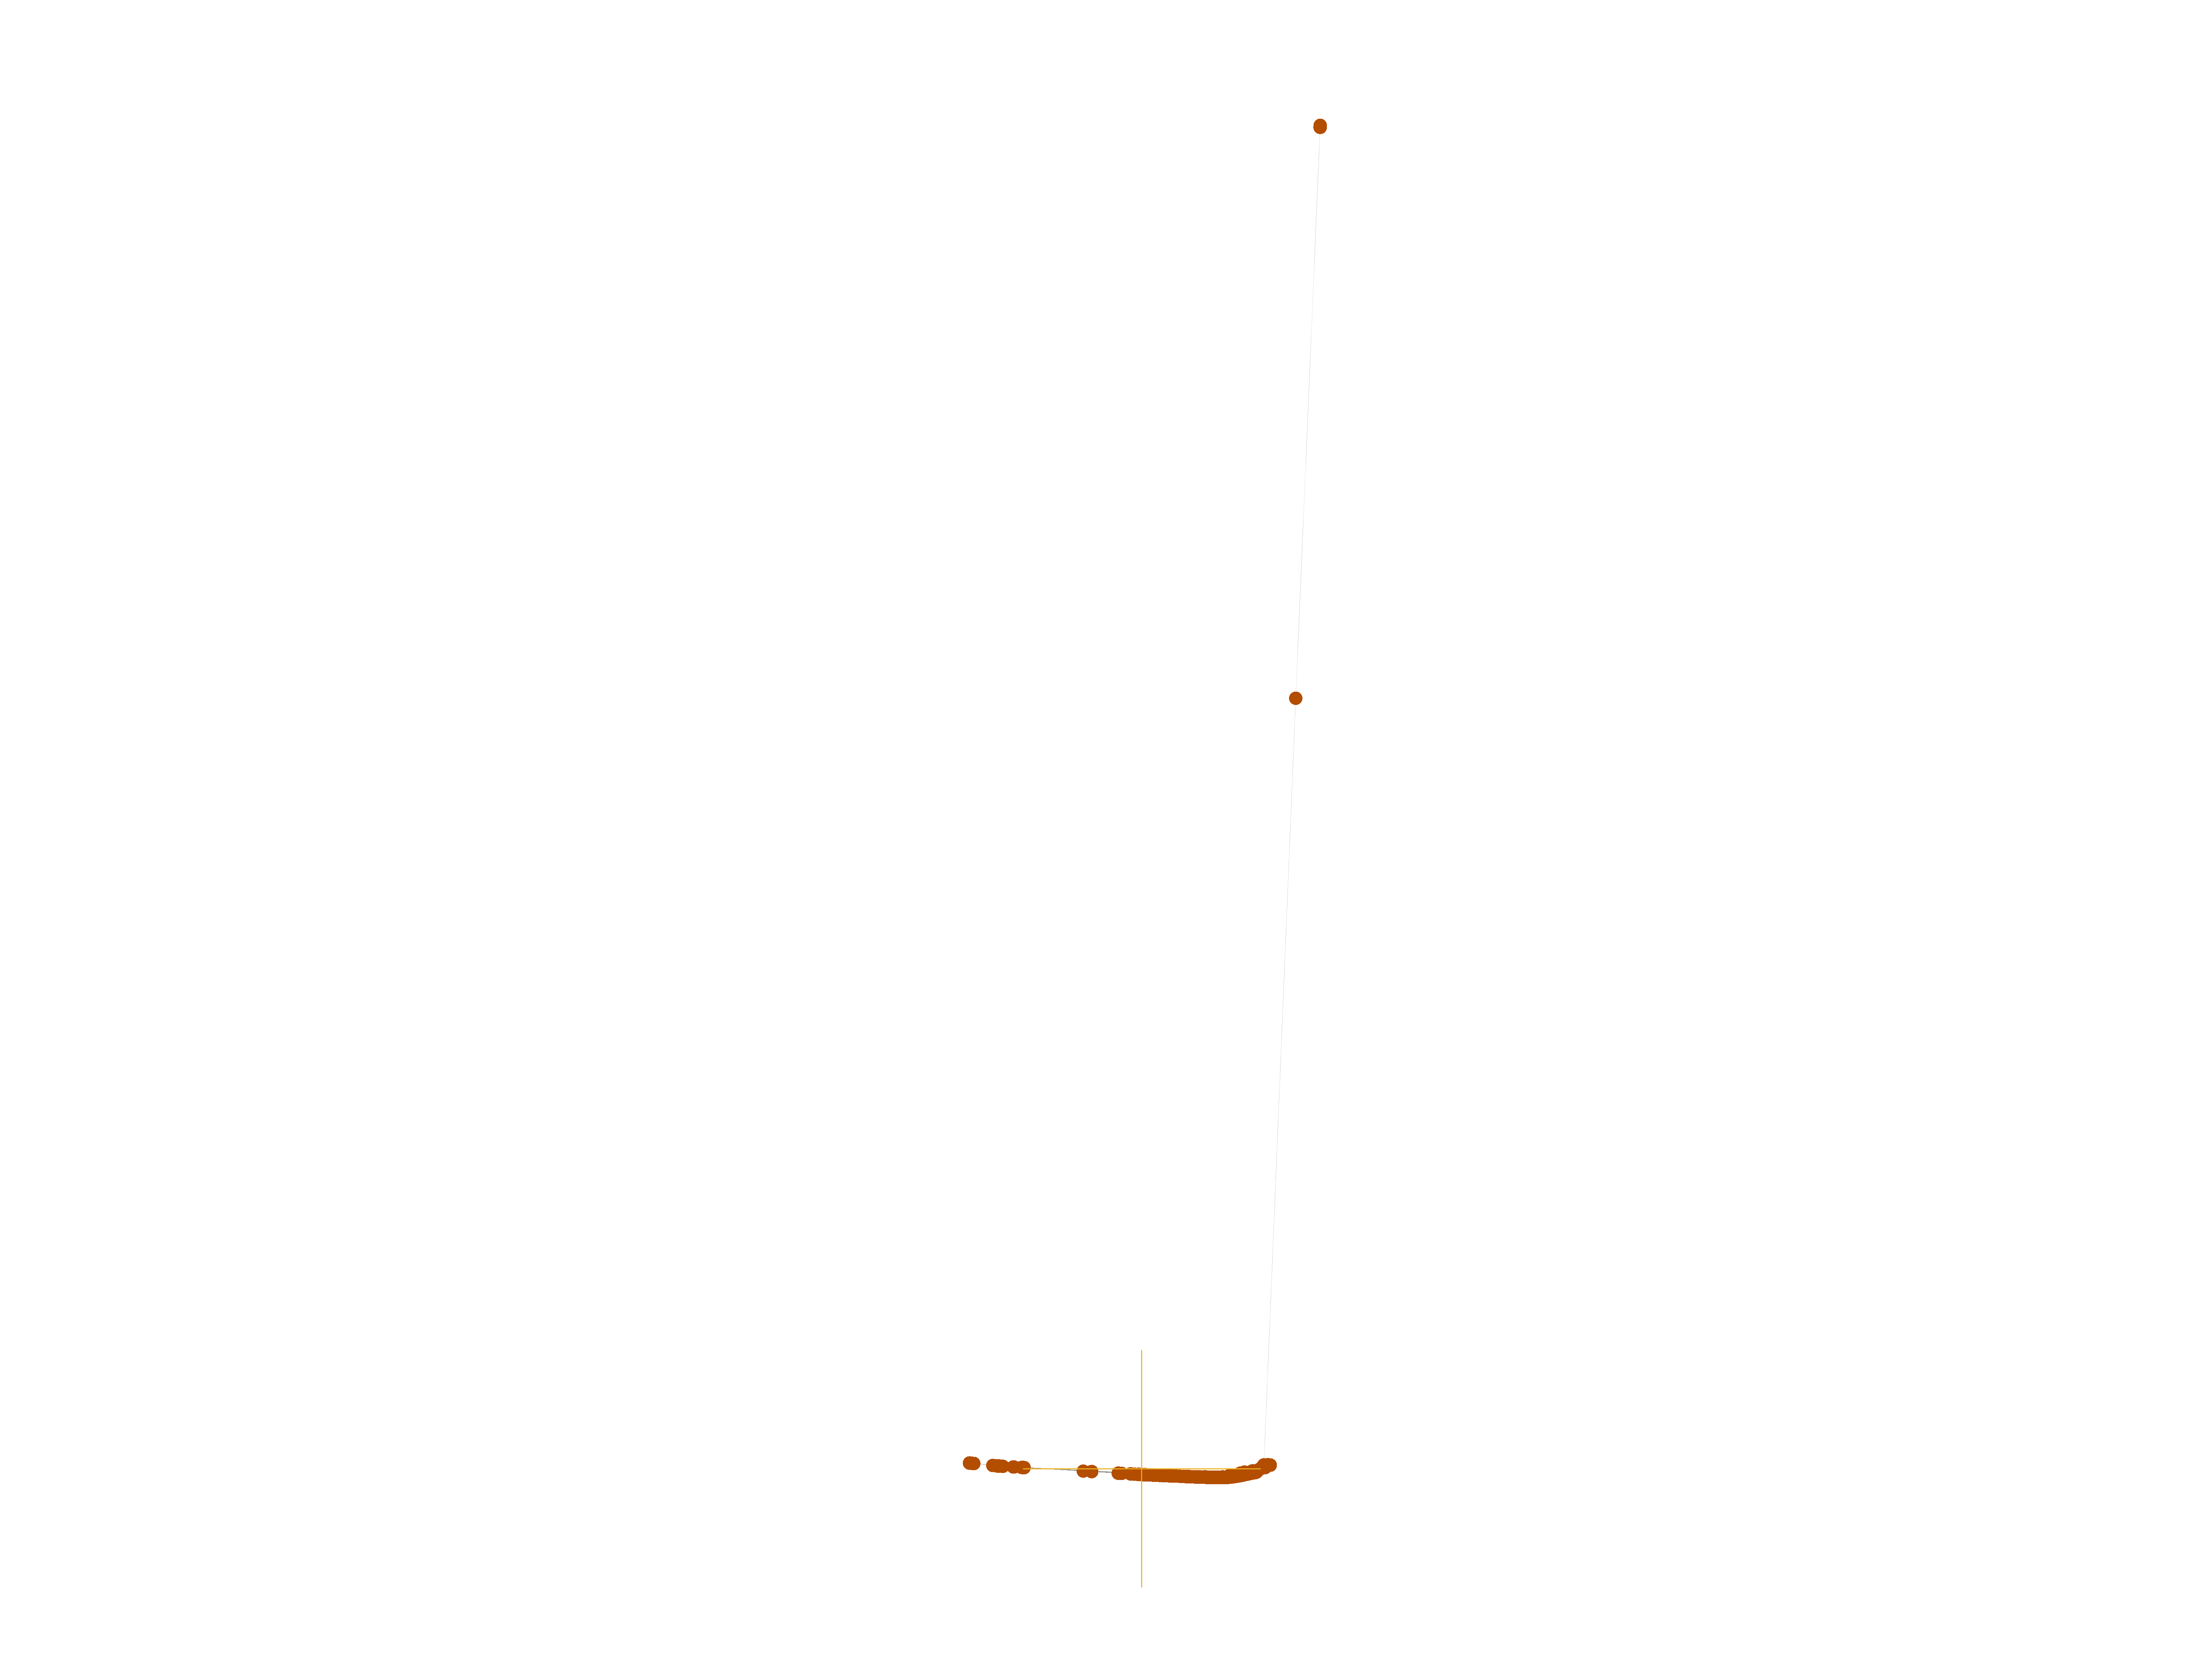
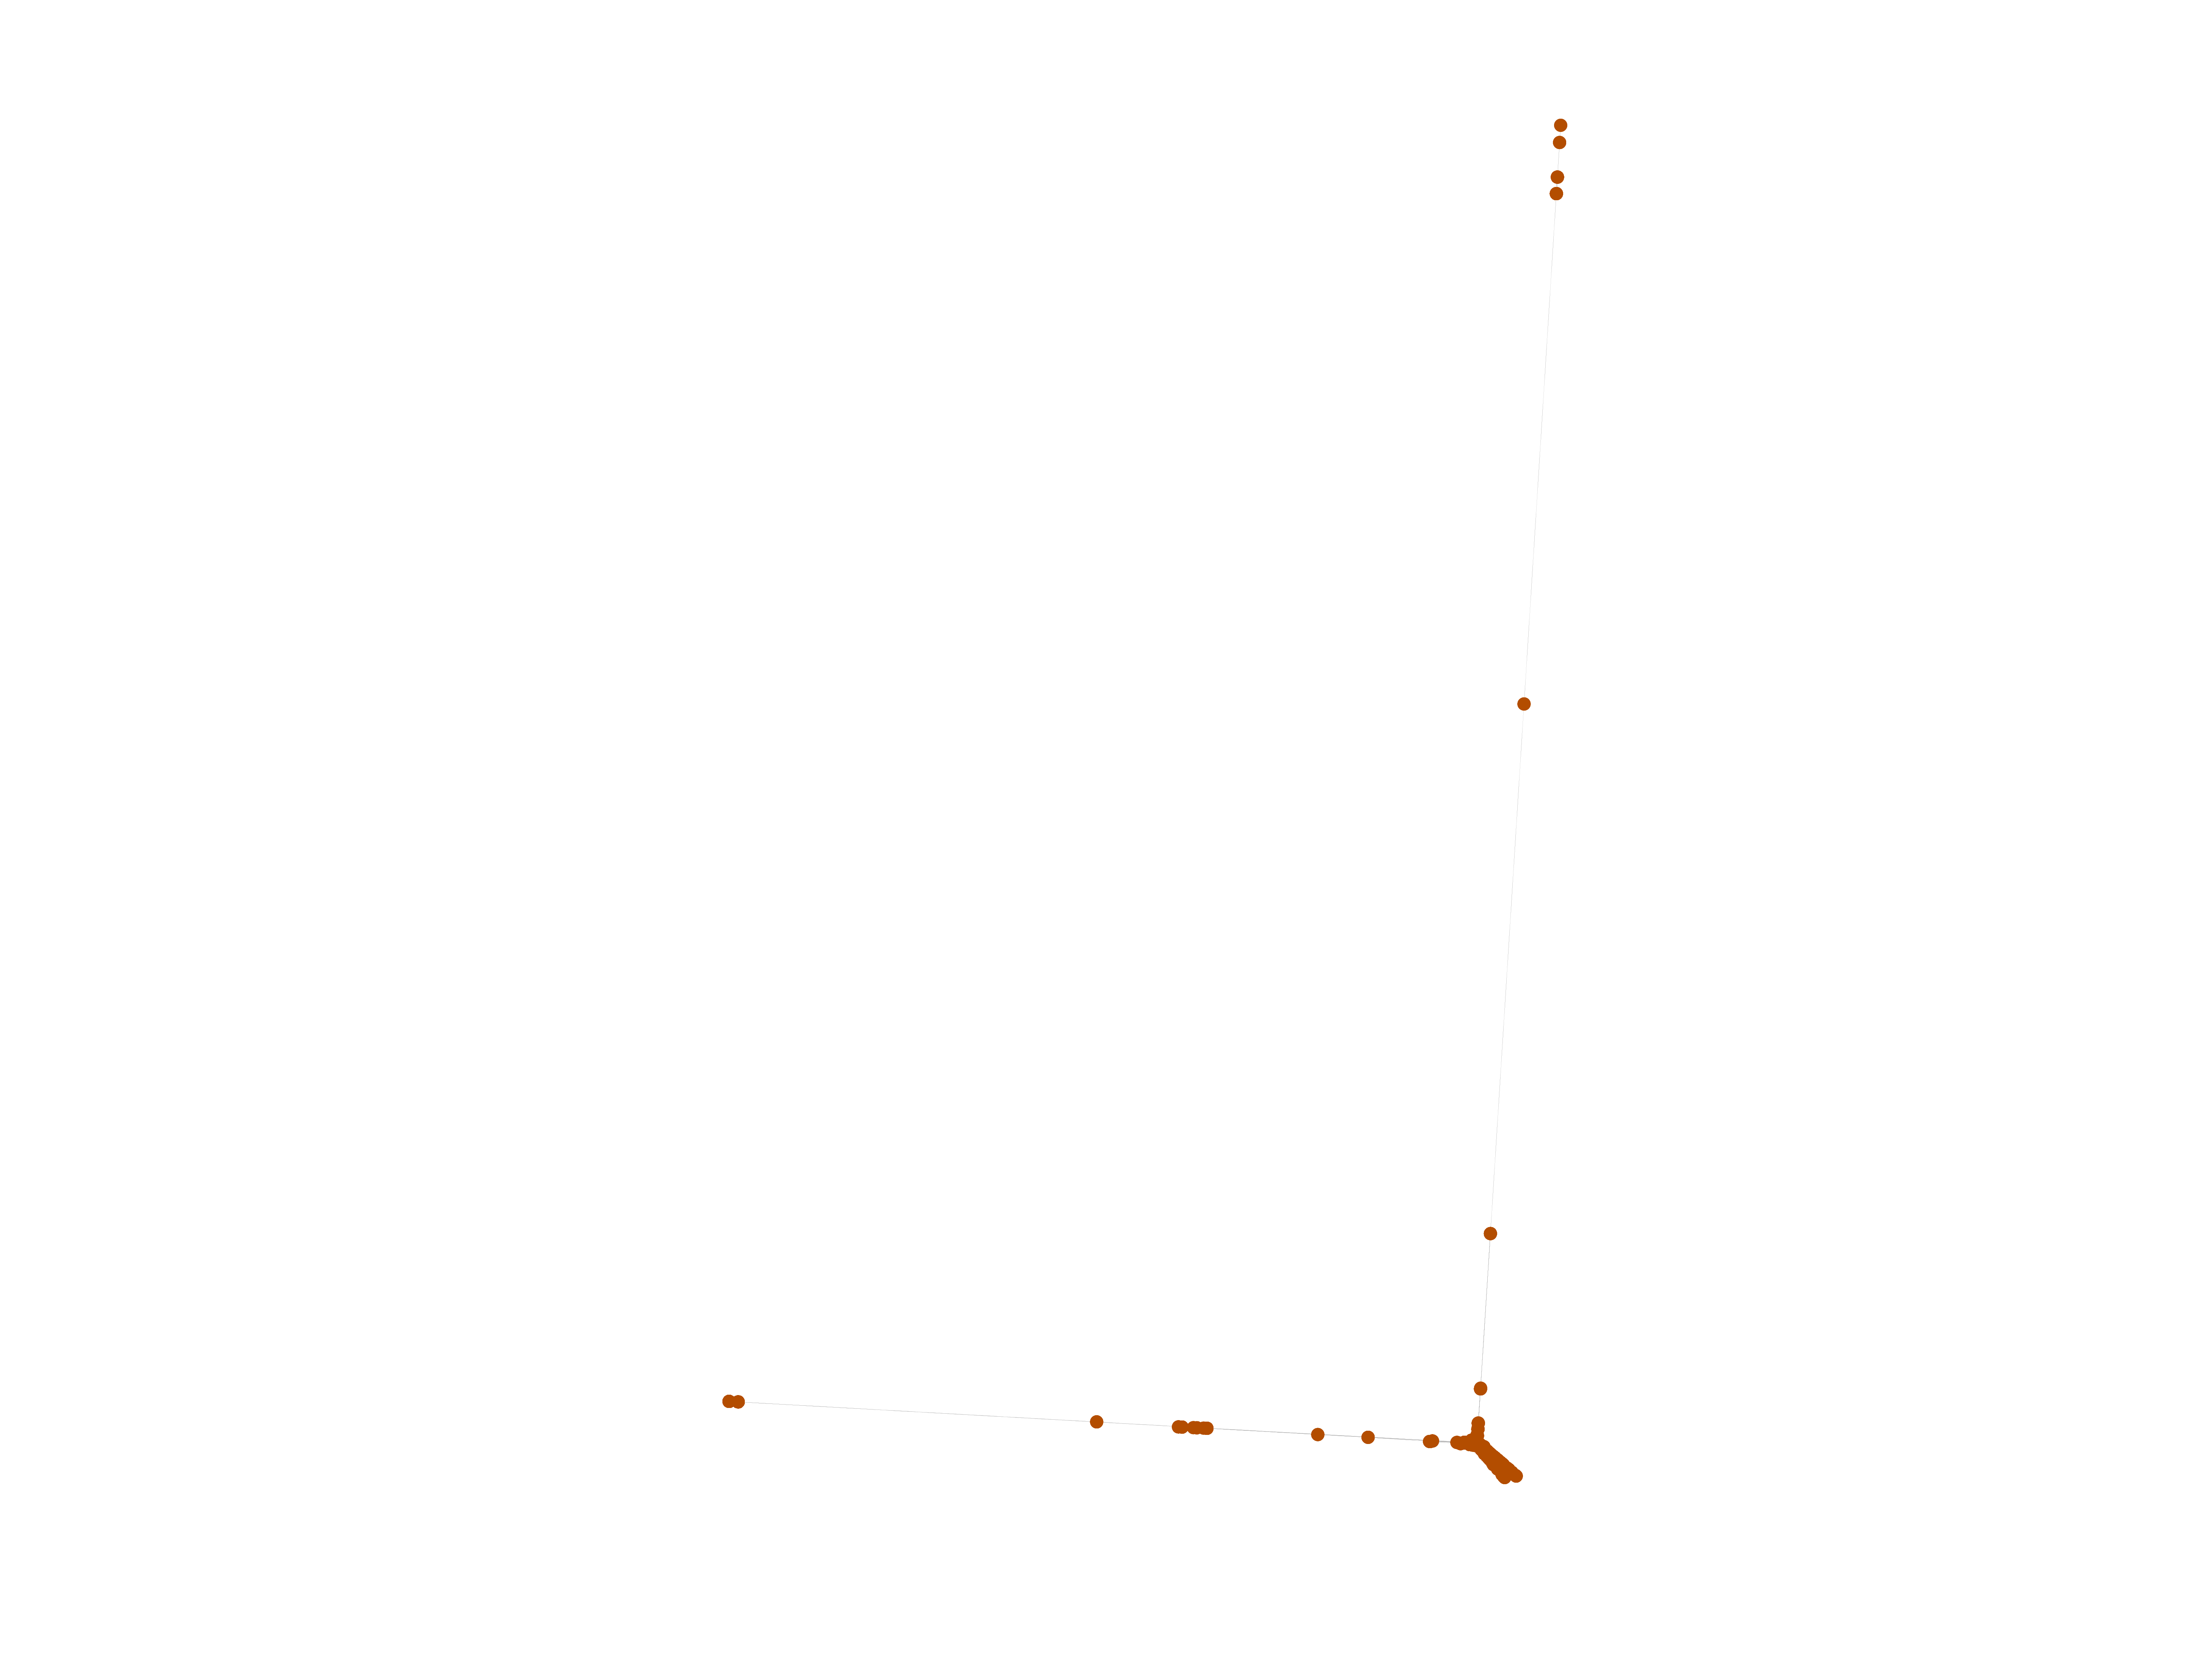
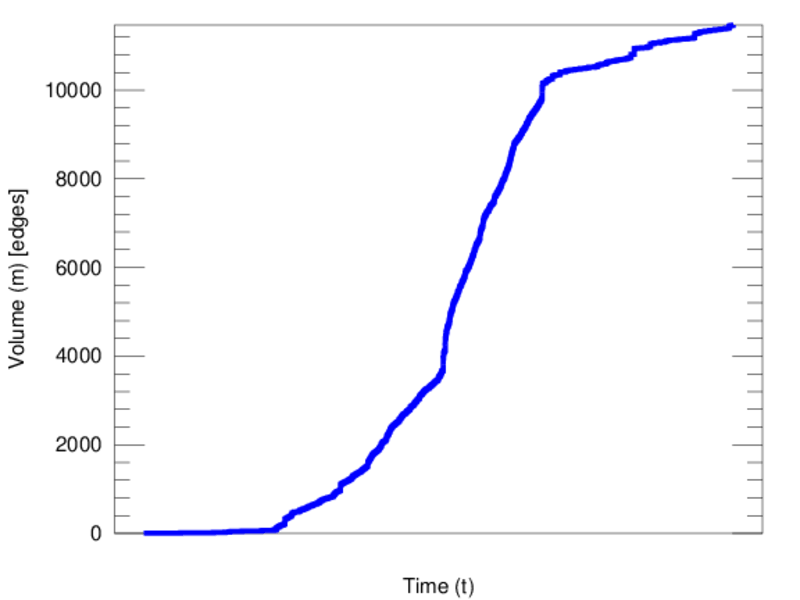
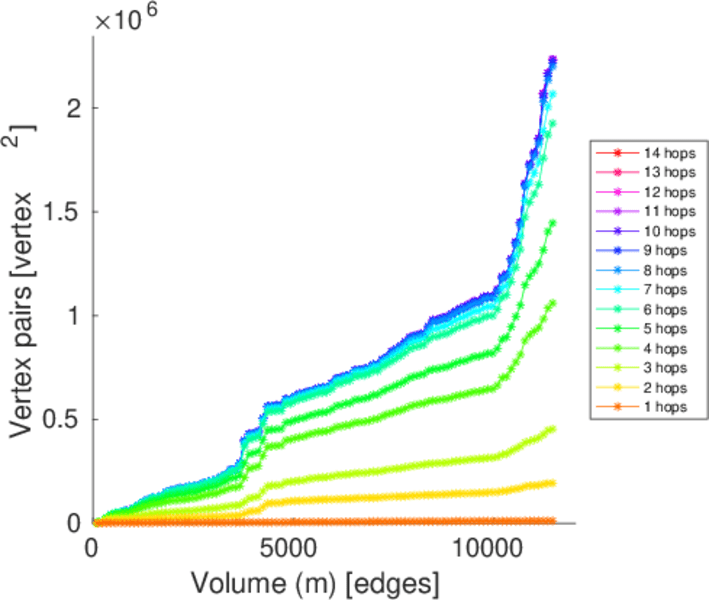
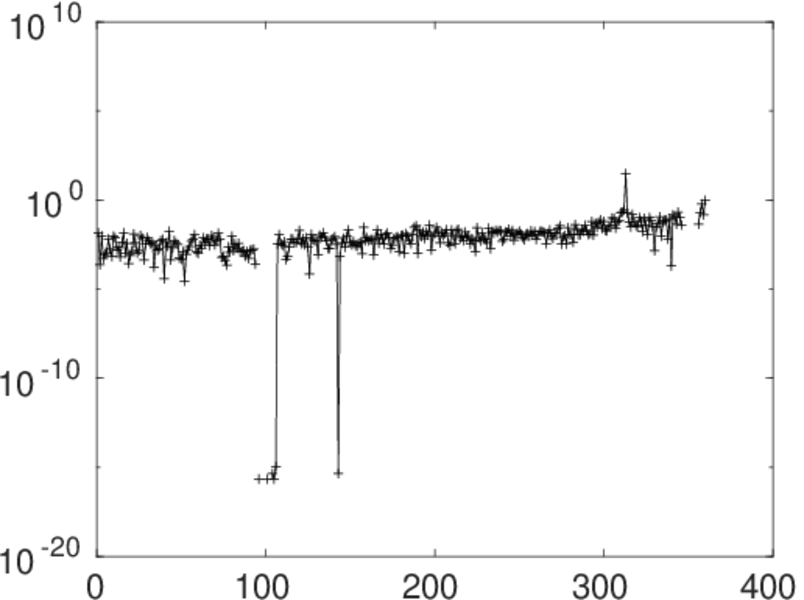
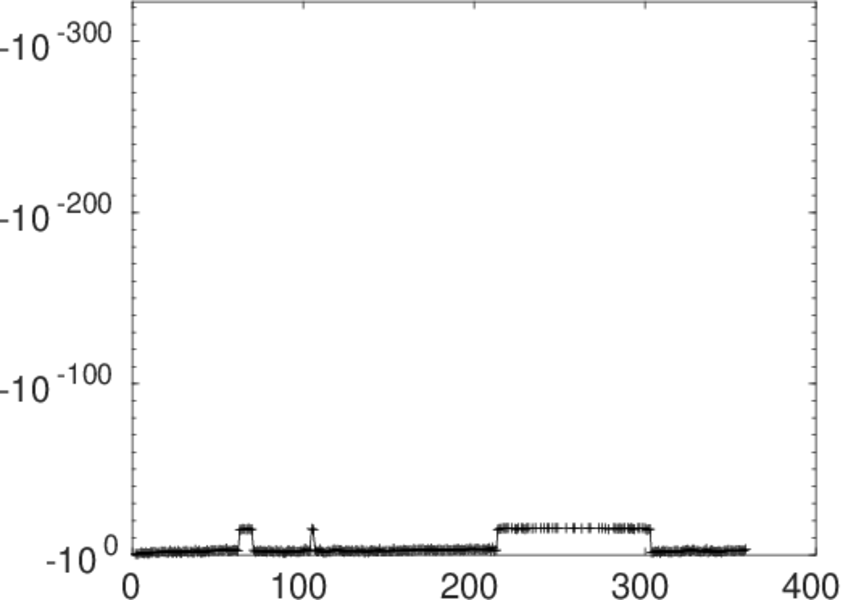
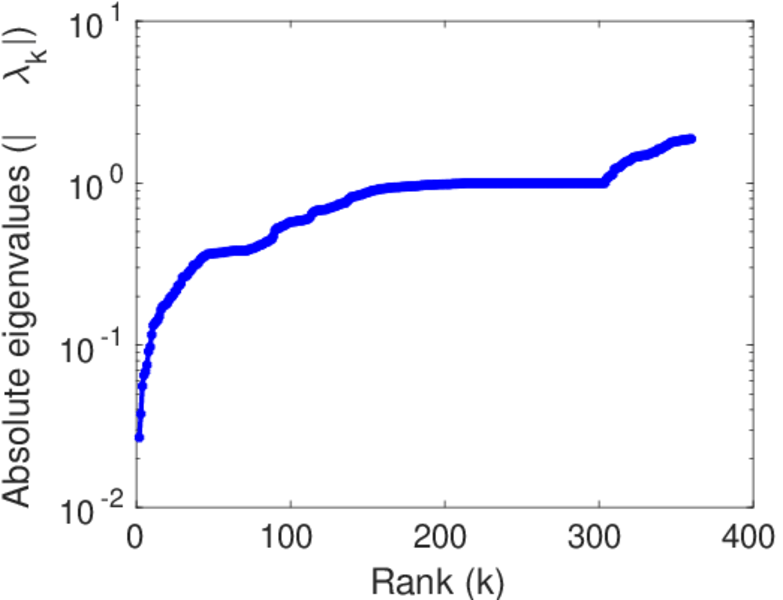
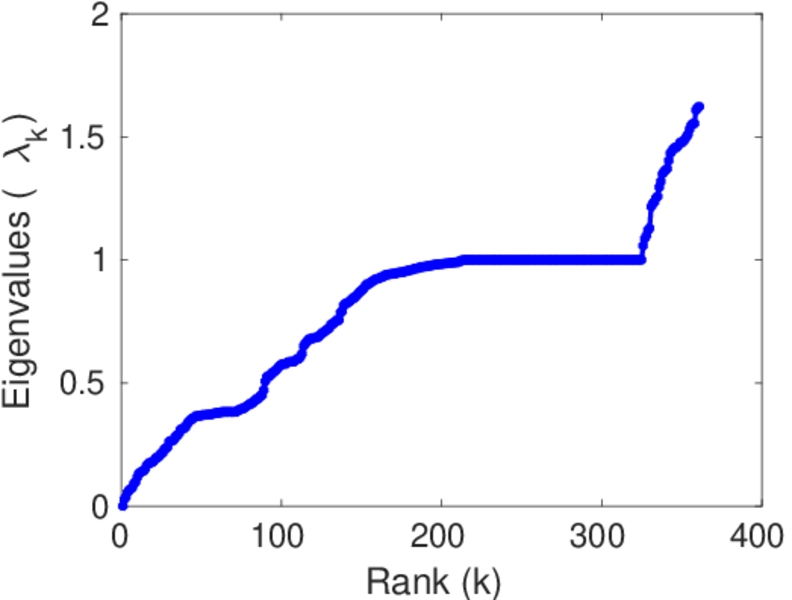
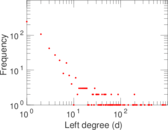
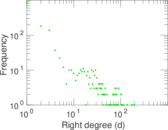
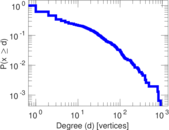
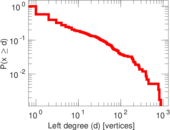
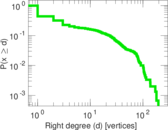
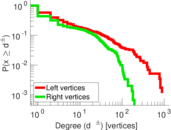
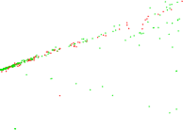
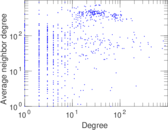
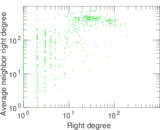
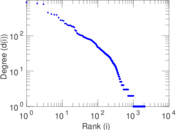
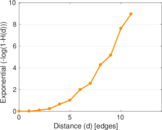
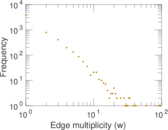
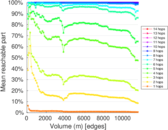
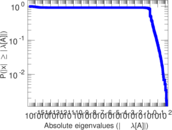
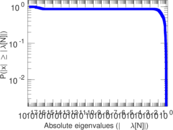
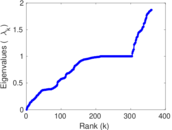
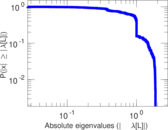
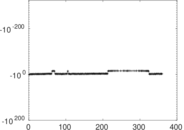
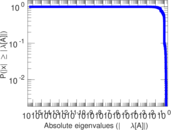
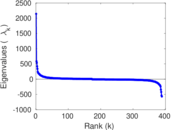
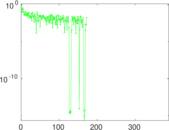
Plots


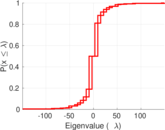


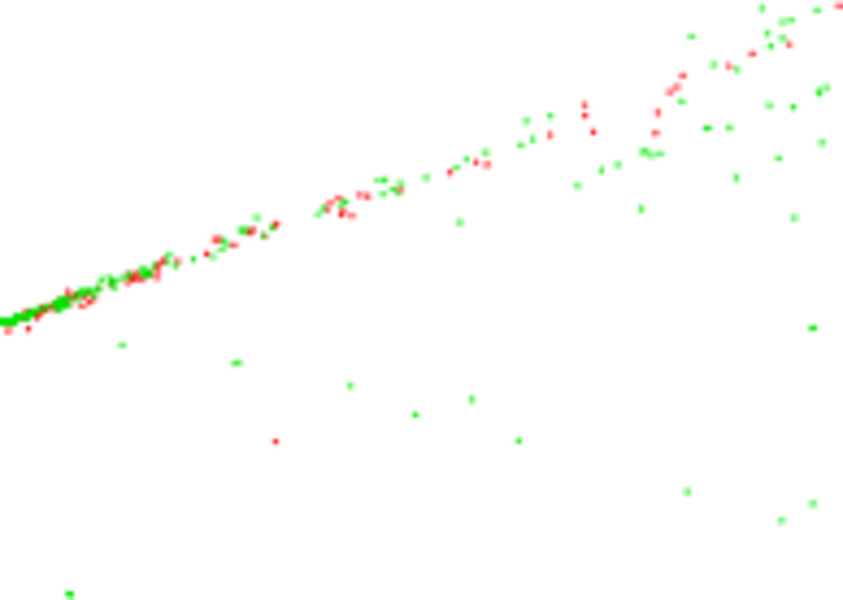
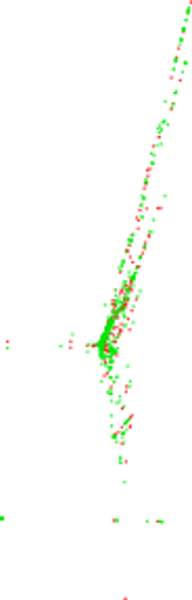
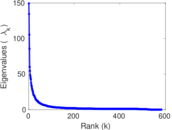
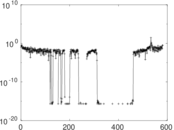
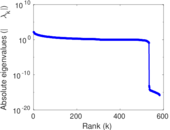
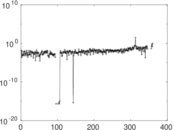
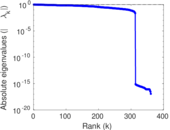
Matrix decompositions plots


Downloads
References
|
[1]
|
Jérôme Kunegis.
KONECT – The Koblenz Network Collection.
In Proc. Int. Conf. on World Wide Web Companion, pages
1343–1350, 2013.
[ http ]
|
|
[2]
|
Wikimedia Foundation.
Wikimedia downloads.
http://dumps.wikimedia.org/, January 2010.
|
 KONECT ‣ Networks ‣
Buy Me a Coffee
KONECT ‣ Networks ‣
Buy Me a Coffee