Wiktionary edits (ti)
This is the bipartite edit network of the Tigrinya Wiktionary. It contains
users and pages from the Tigrinya Wiktionary, connected by edit events. Each
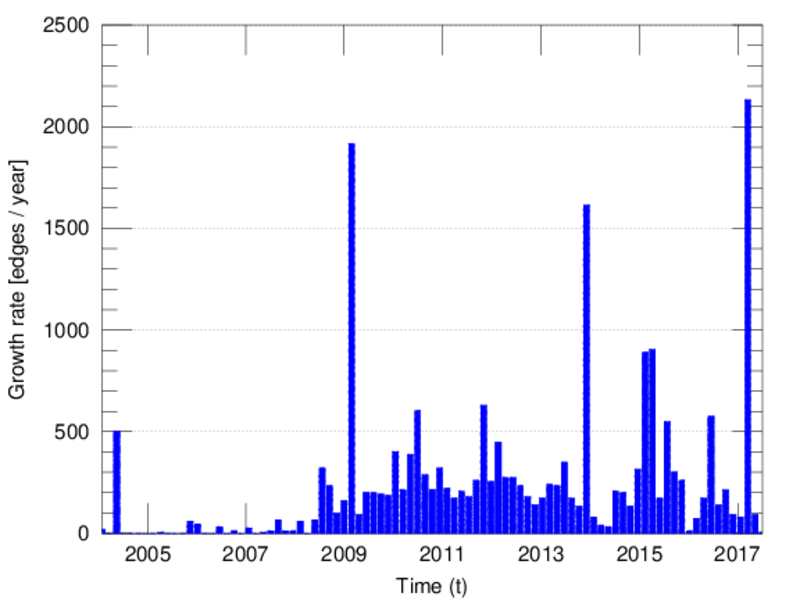
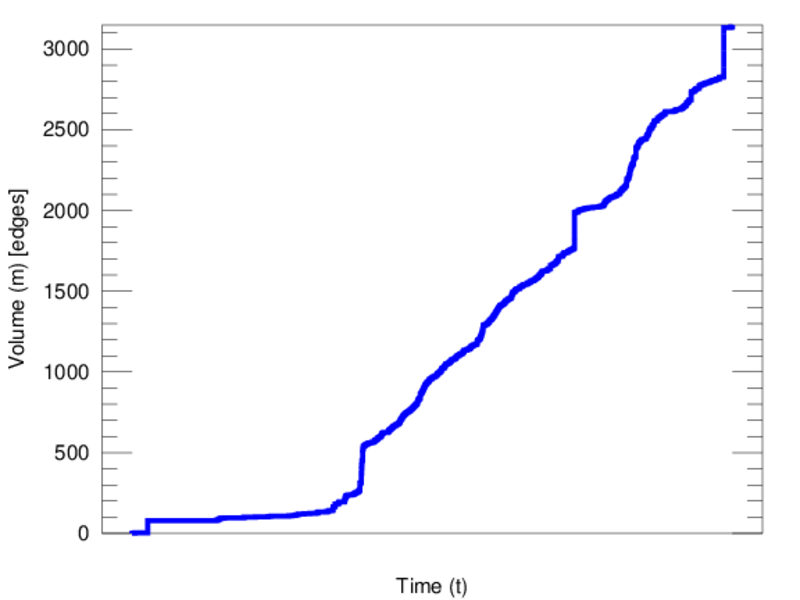
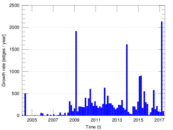
edge represents an edit. The dataset includes the timestamp of each edit.
Metadata
Statistics
| Size | n = | 1,282
|
| Left size | n1 = | 164
|
| Right size | n2 = | 1,118
|
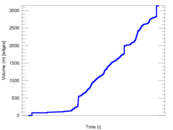
| Volume | m = | 3,148
|
| Unique edge count | m̿ = | 1,864
|
| Wedge count | s = | 149,277
|
| Claw count | z = | 12,467,295
|
| Cross count | x = | 860,094,700
|
| Square count | q = | 109,504
|
| 4-Tour count | T4 = | 1,477,176
|
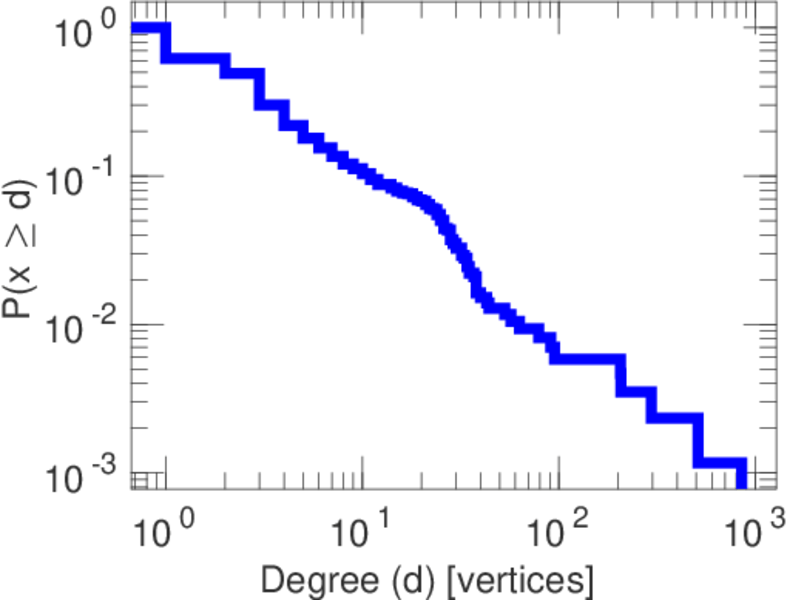
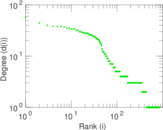
| Maximum degree | dmax = | 849
|
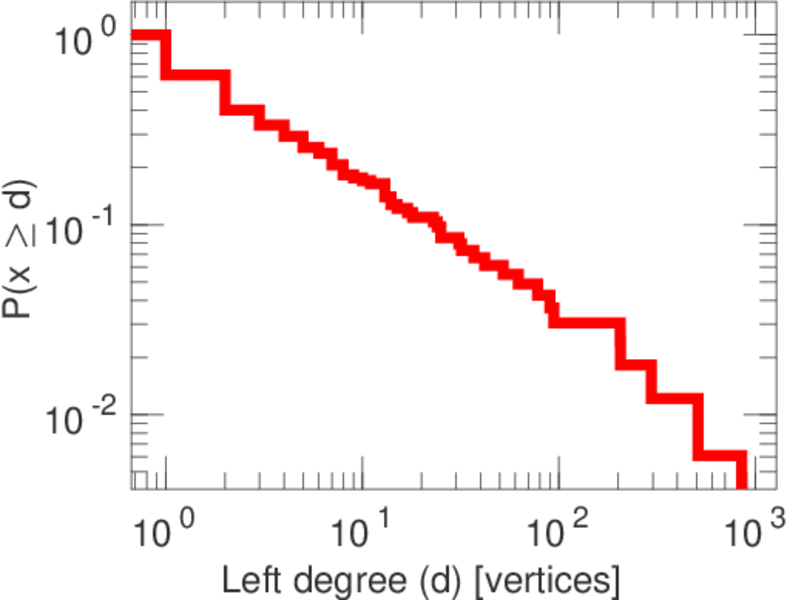
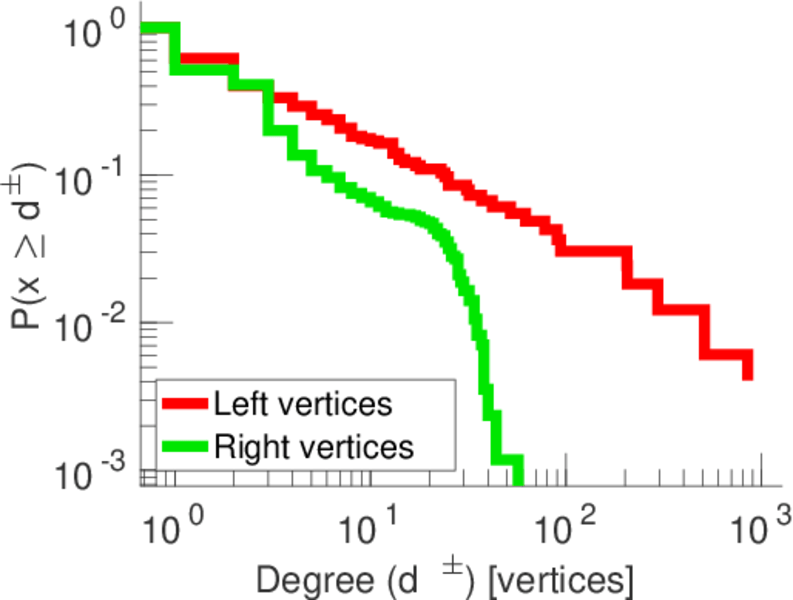
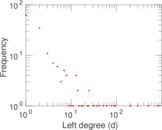
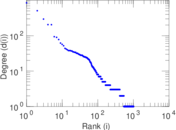
| Maximum left degree | d1max = | 849
|
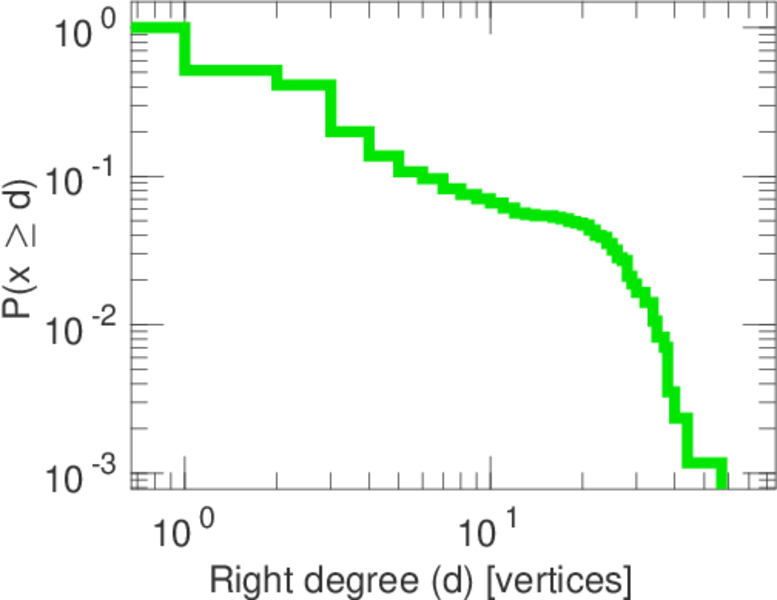
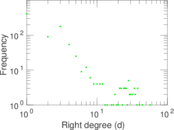
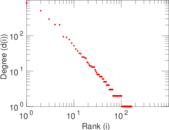
| Maximum right degree | d2max = | 57
|
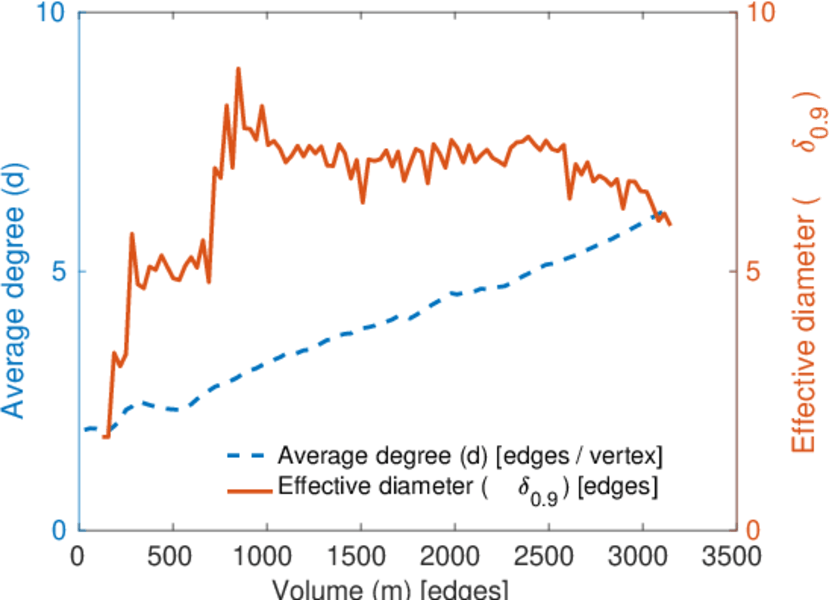
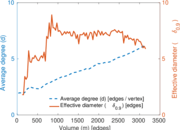
| Average degree | d = | 4.911 08
|
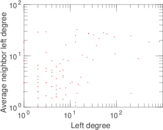
| Average left degree | d1 = | 19.195 1
|
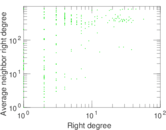
| Average right degree | d2 = | 2.815 74
|
| Fill | p = | 0.010 166 2
|
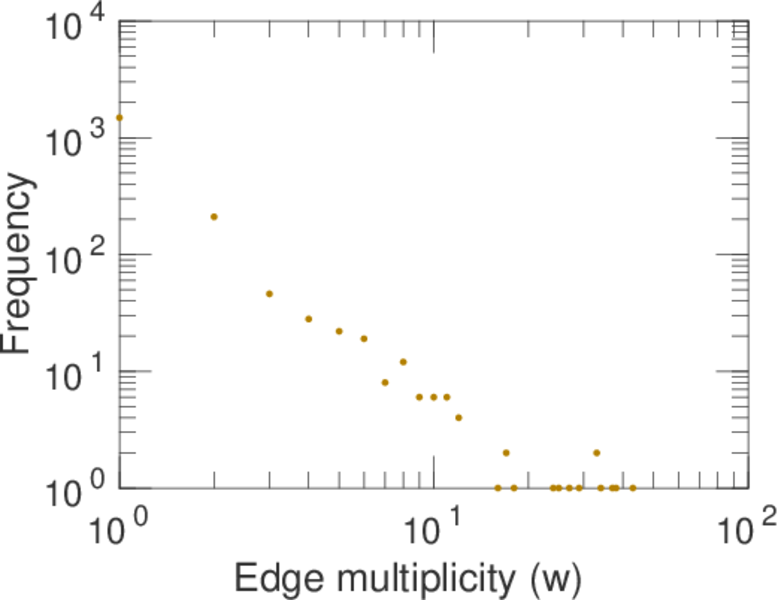
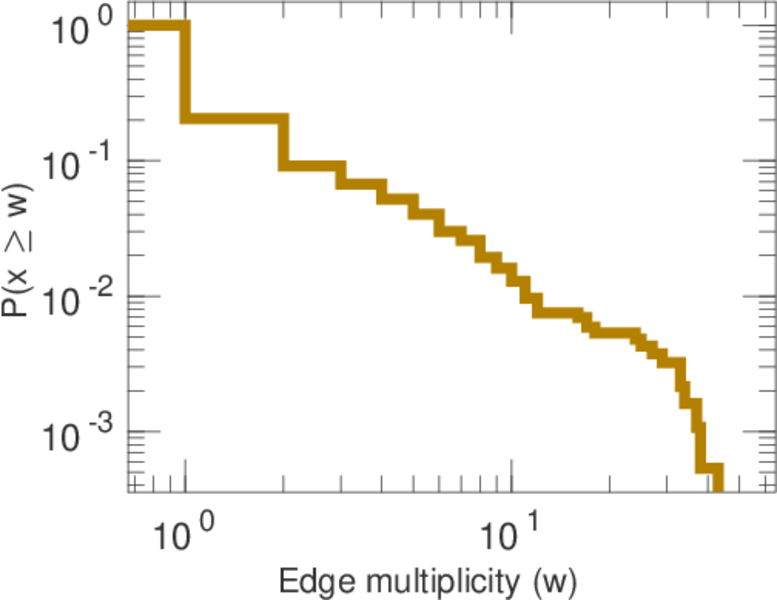
| Average edge multiplicity | m̃ = | 1.688 84
|
| Size of LCC | N = | 714
|
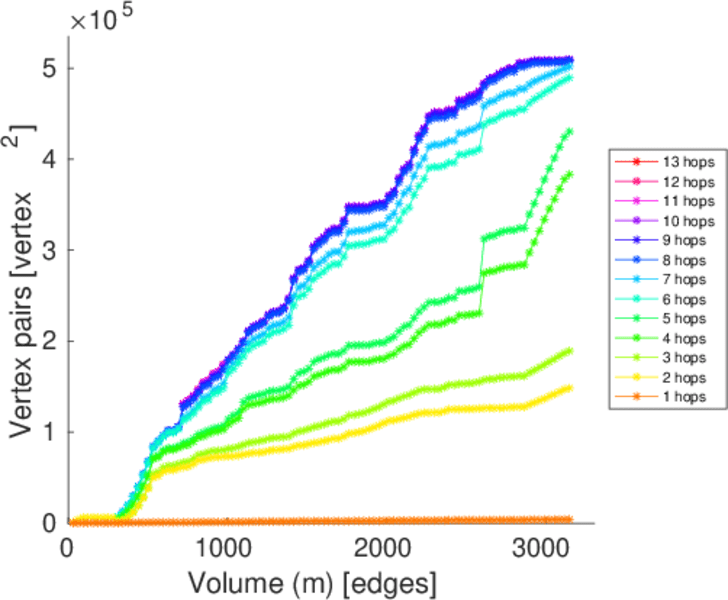
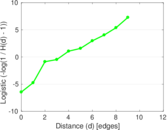
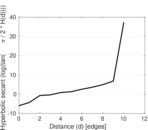
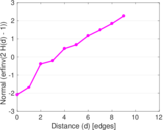
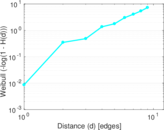
| Diameter | δ = | 11
|
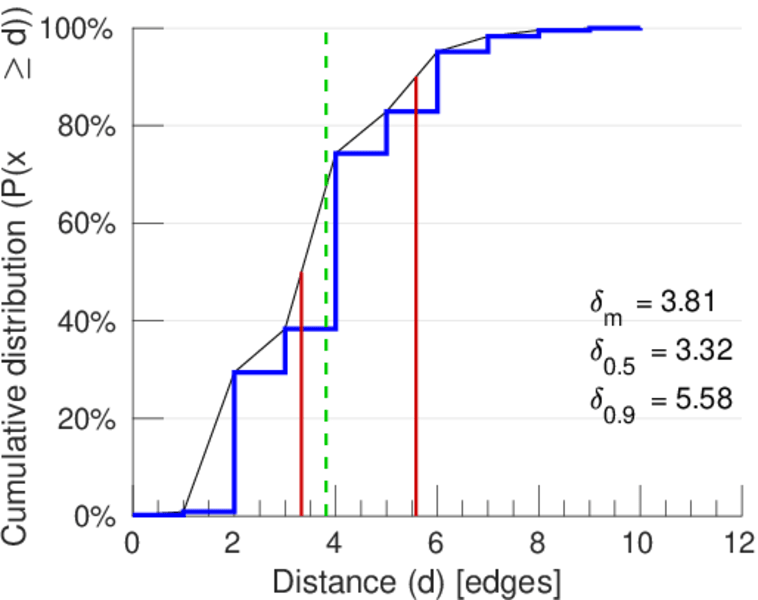
| 50-Percentile effective diameter | δ0.5 = | 3.324 90
|
| 90-Percentile effective diameter | δ0.9 = | 5.582 61
|
| Median distance | δM = | 4
|
| Mean distance | δm = | 3.812 54
|
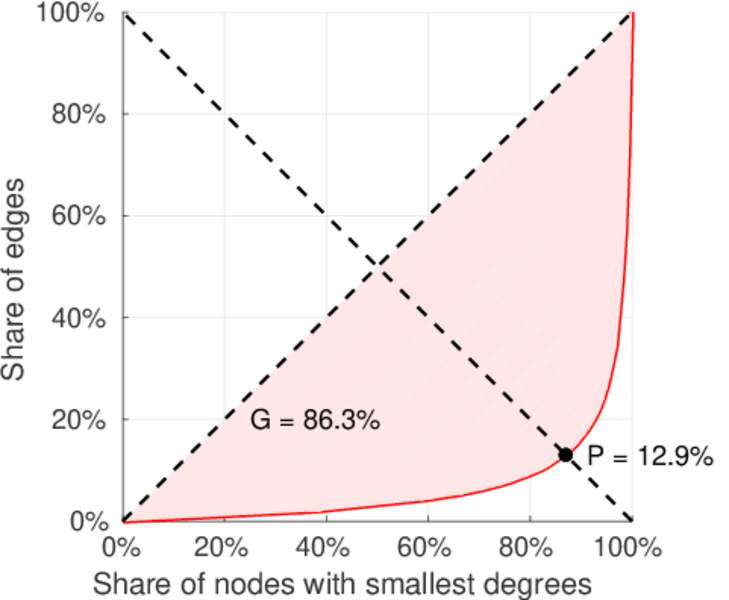
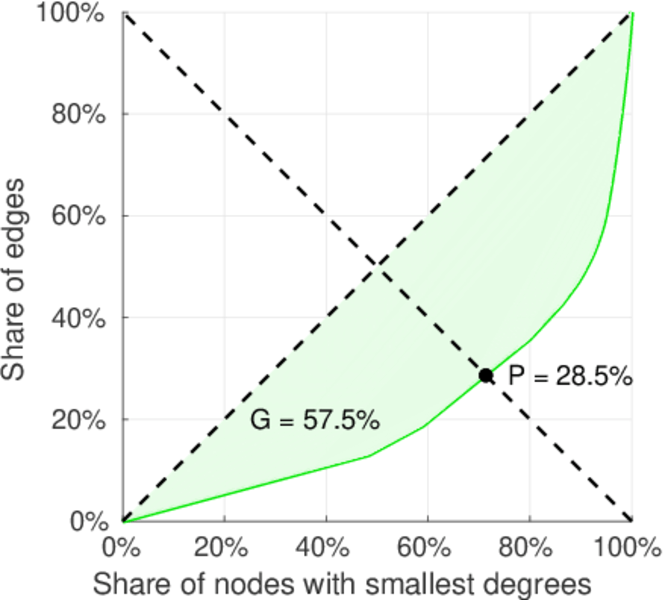
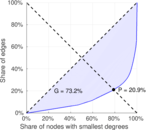
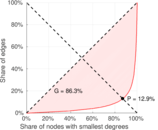
| Gini coefficient | G = | 0.730 025
|
| Balanced inequality ratio | P = | 0.211 404
|
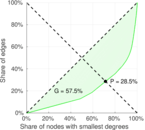
| Left balanced inequality ratio | P1 = | 0.128 653
|
| Right balanced inequality ratio | P2 = | 0.284 943
|
| Relative edge distribution entropy | Her = | 0.804 829
|
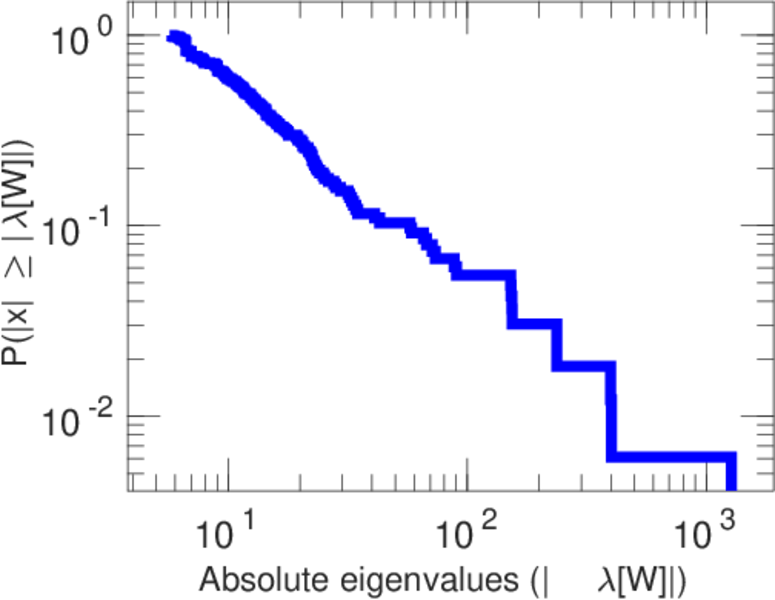
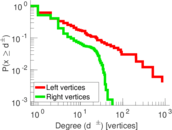
| Power law exponent | γ = | 2.656 55
|
| Tail power law exponent | γt = | 2.361 00
|
| Tail power law exponent with p | γ3 = | 2.361 00
|
| p-value | p = | 0.047 000 0
|
| Left tail power law exponent with p | γ3,1 = | 1.711 00
|
| Left p-value | p1 = | 0.253 000
|
| Right tail power law exponent with p | γ3,2 = | 3.581 00
|
| Right p-value | p2 = | 0.008 000 00
|
| Degree assortativity | ρ = | −0.031 195 2
|
| Degree assortativity p-value | pρ = | 0.178 222
|
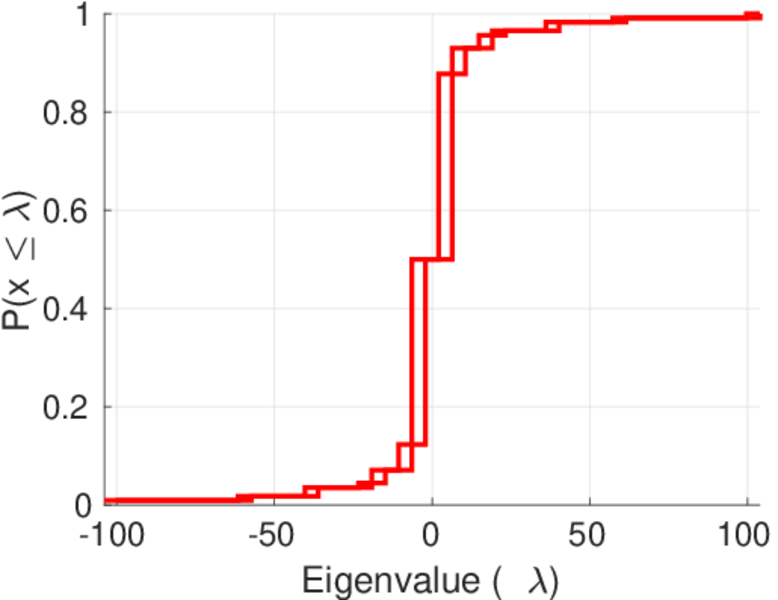
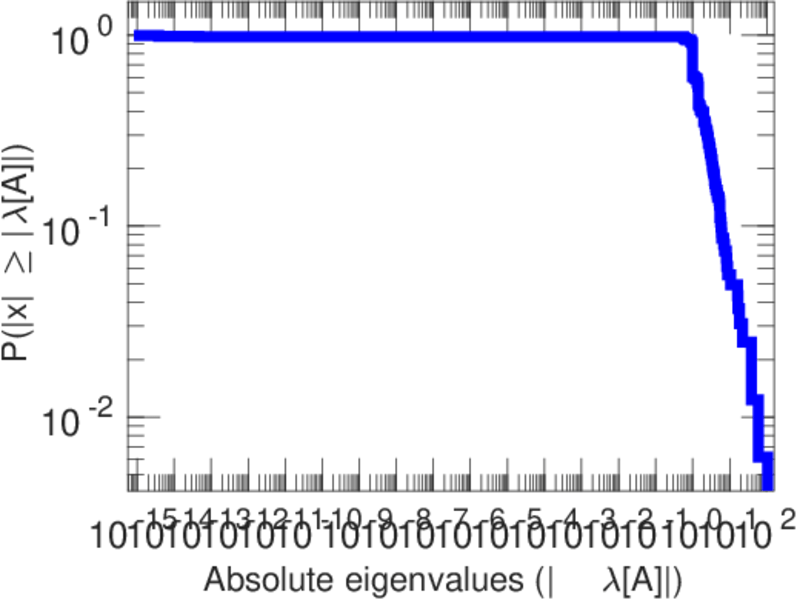
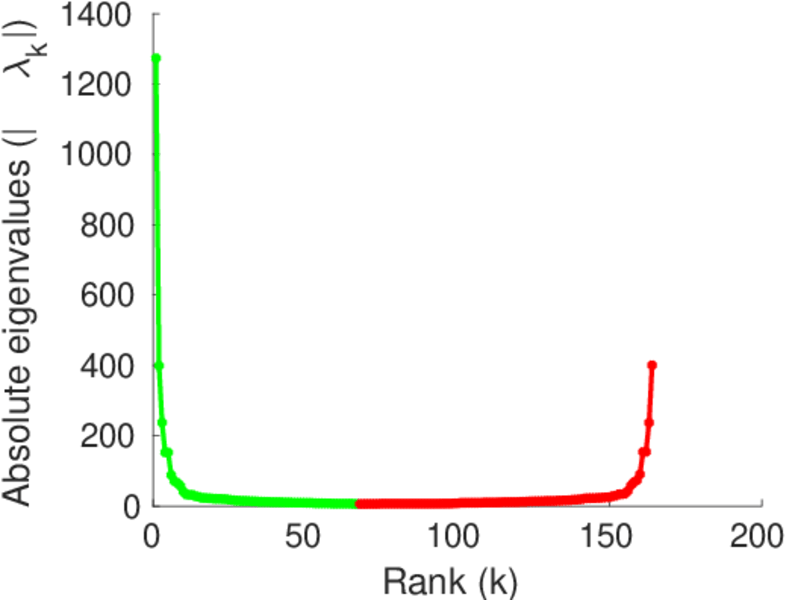
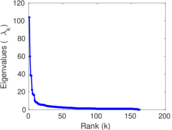
| Spectral norm | α = | 103.866
|
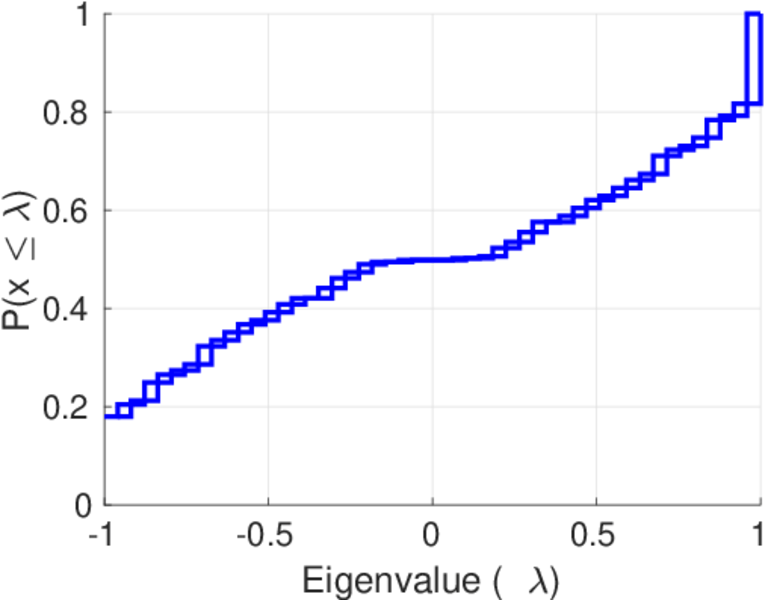
| Algebraic connectivity | a = | 0.018 912 0
|
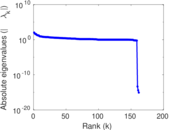
| Spectral separation | |λ1[A] / λ2[A]| = | 1.735 56
|
| Controllability | C = | 696
|
| Relative controllability | Cr = | 0.686 391
|
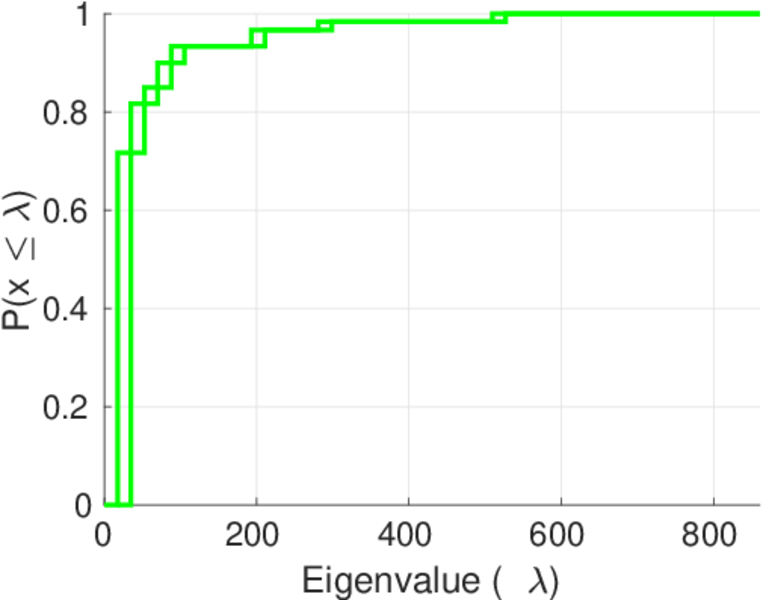
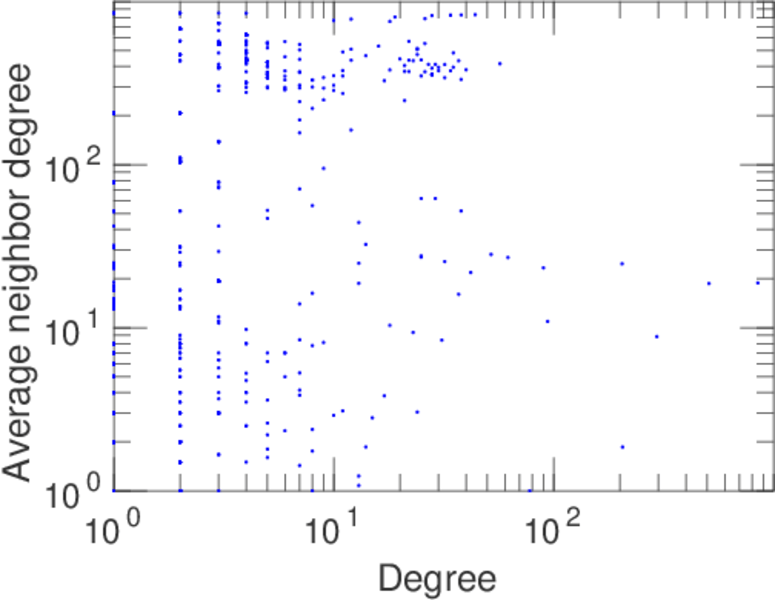
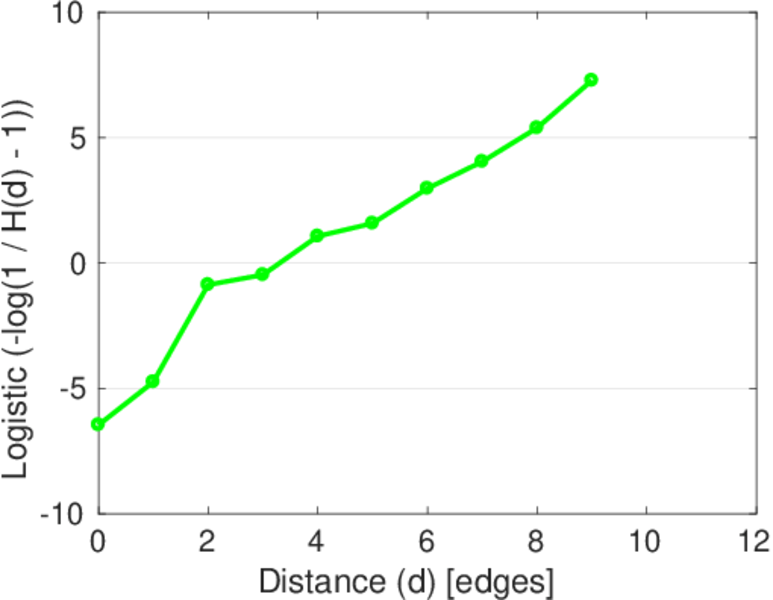
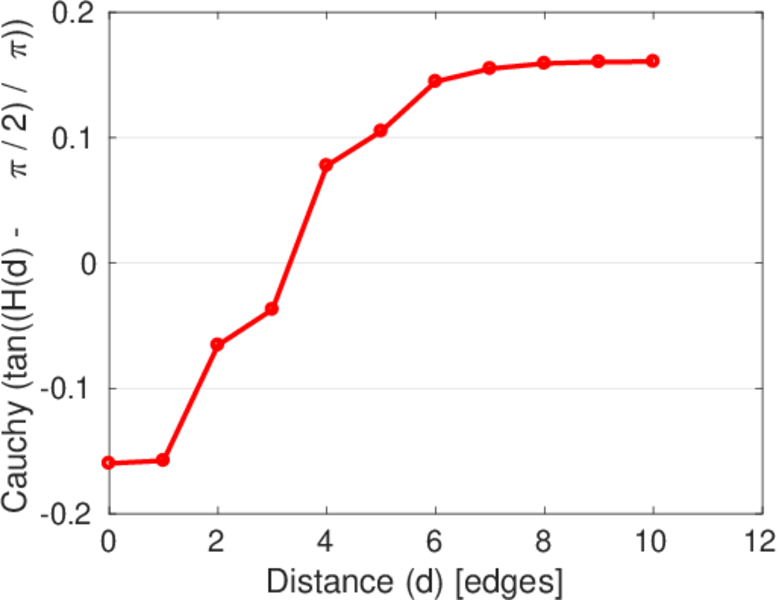
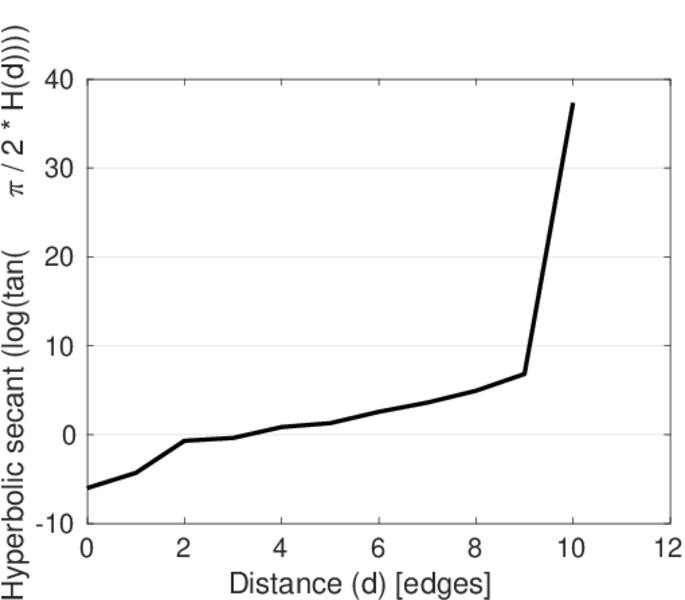
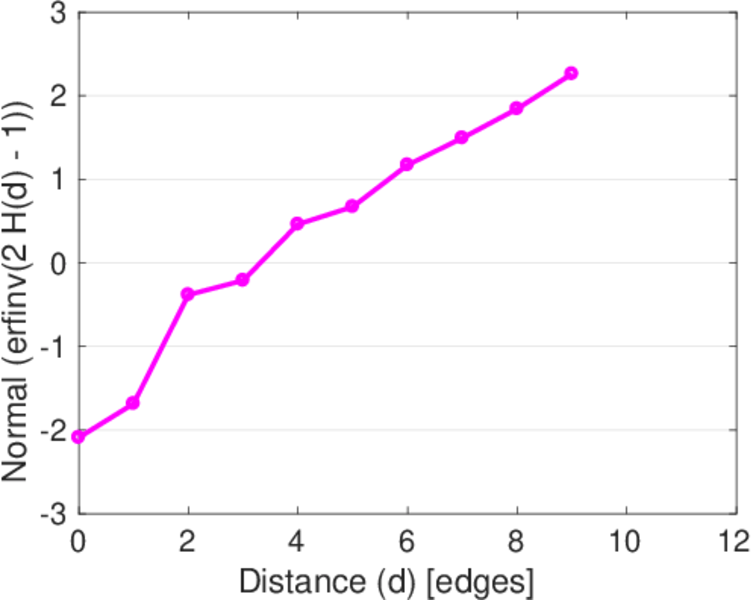
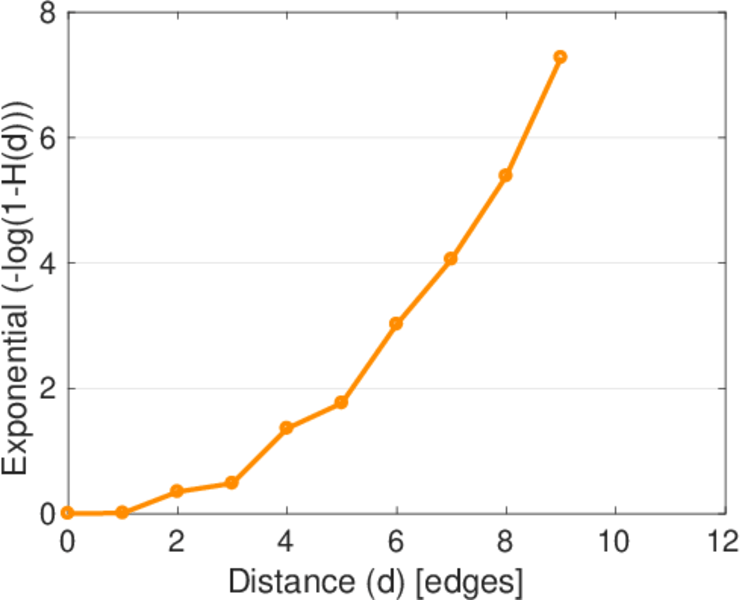
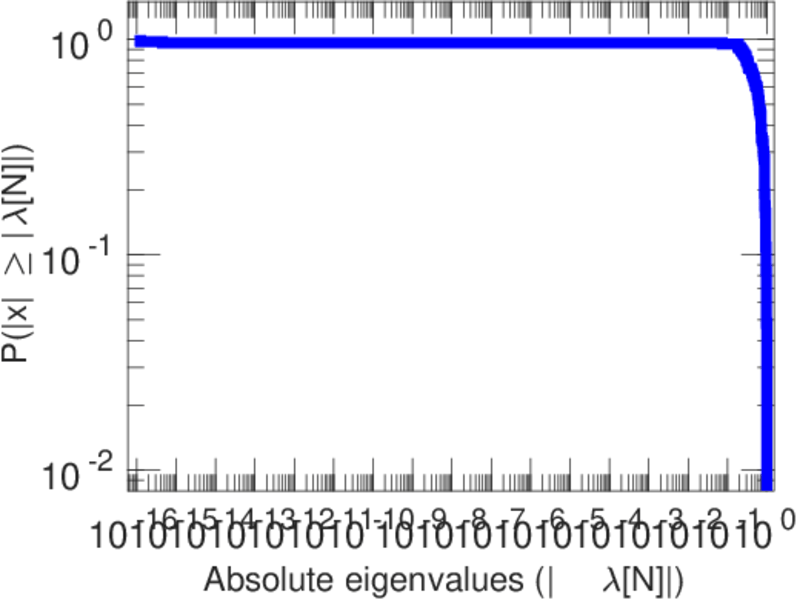
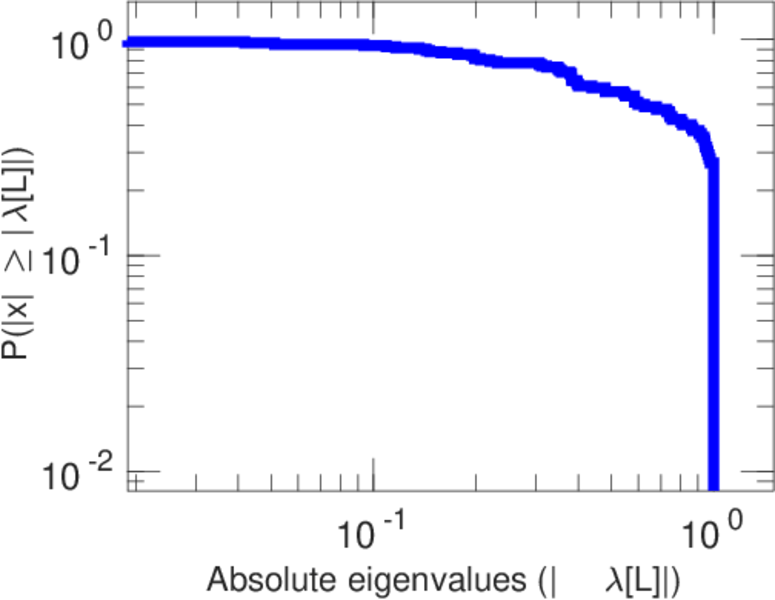
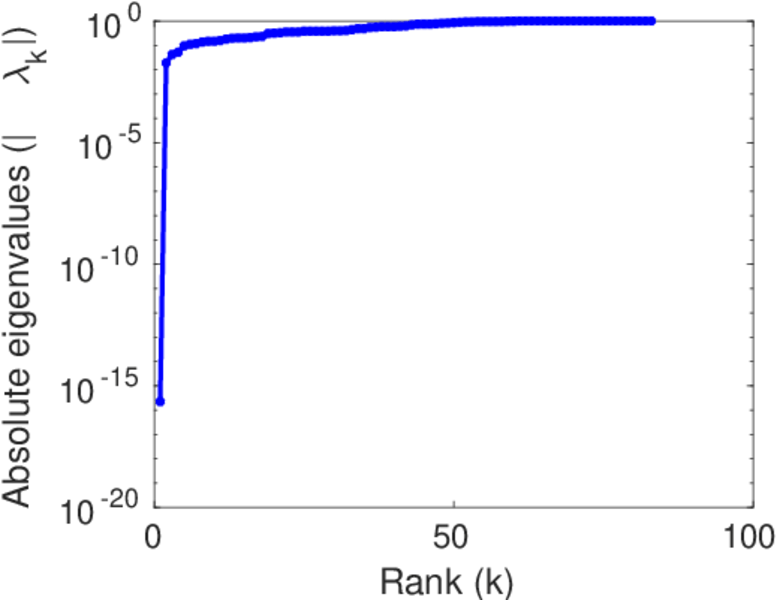
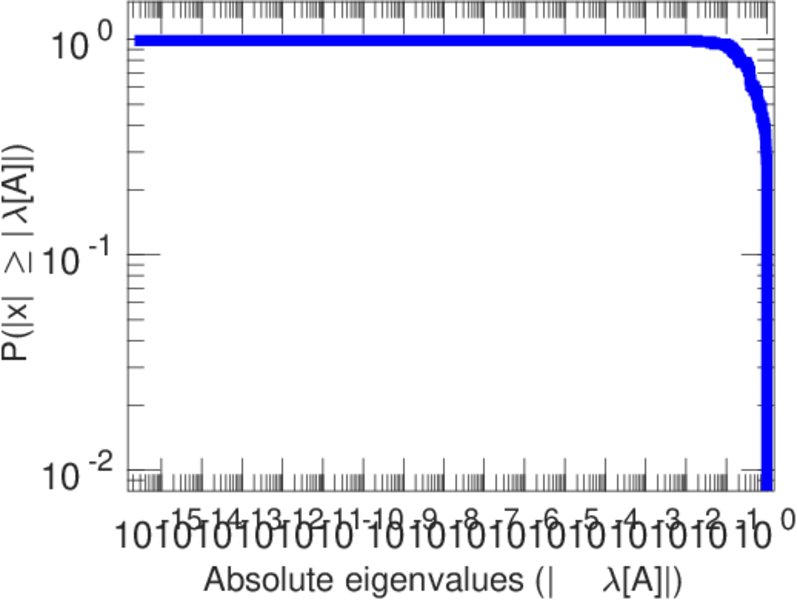
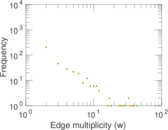
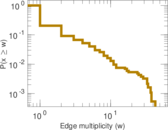
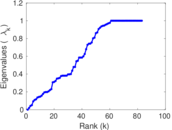
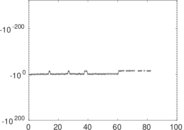
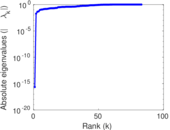
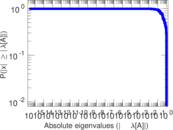
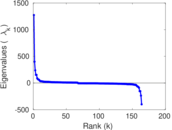
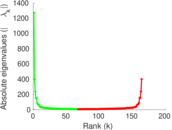
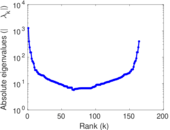
Plots


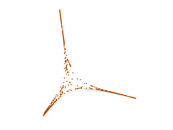

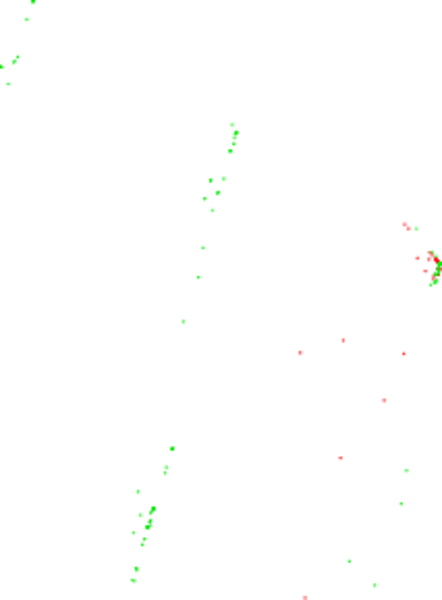
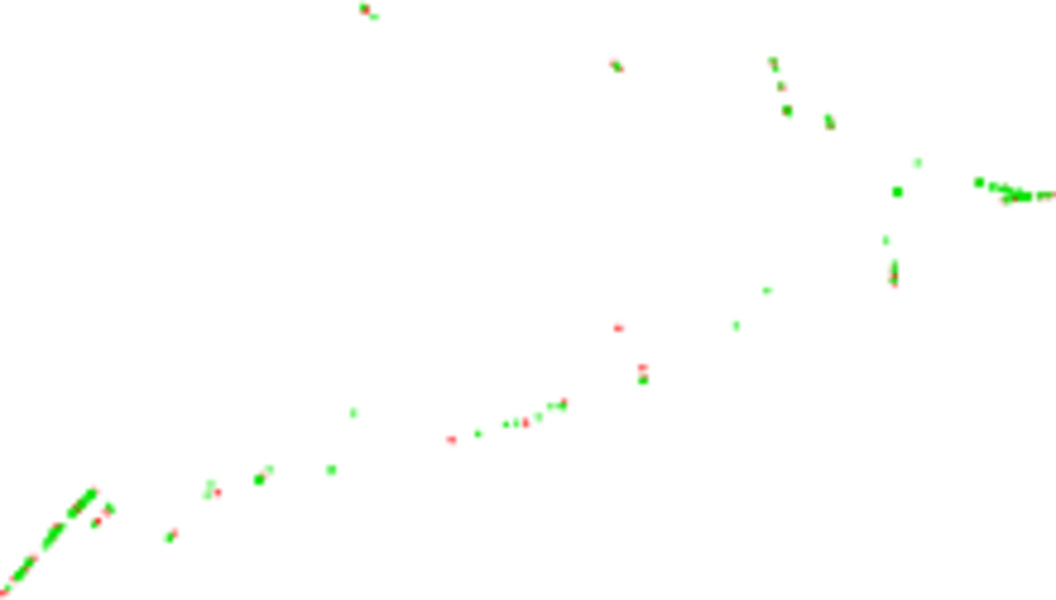
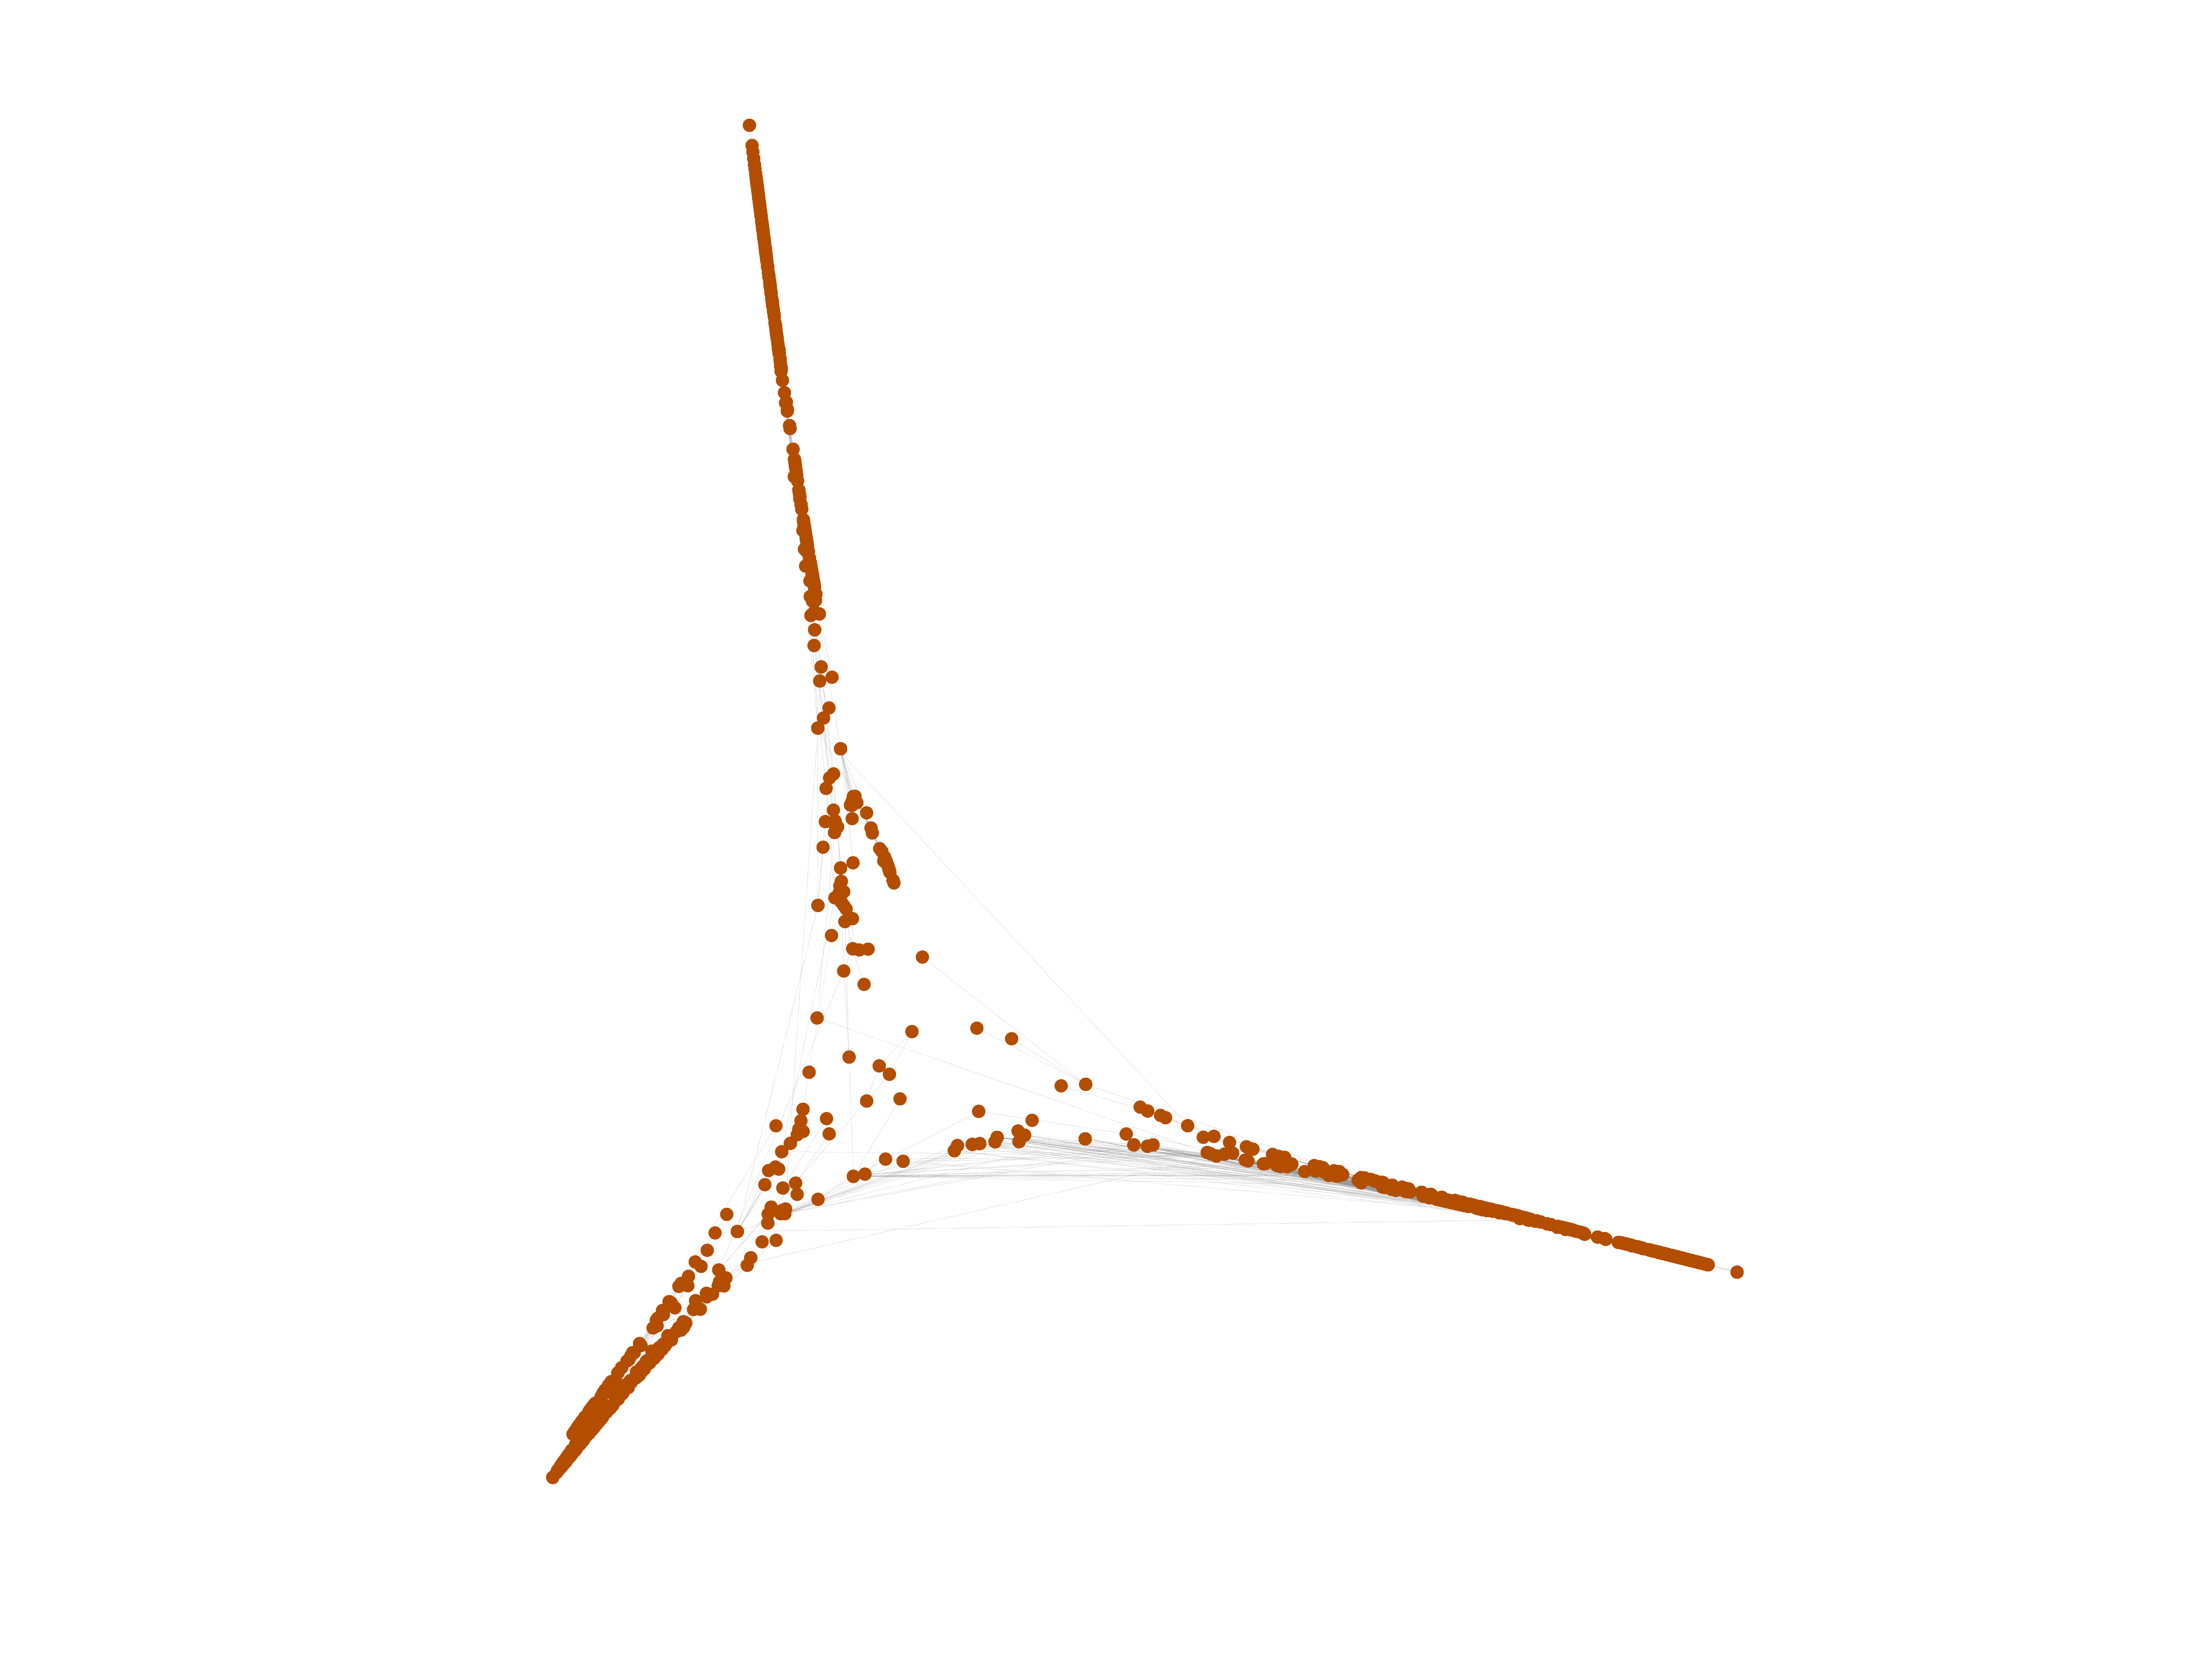
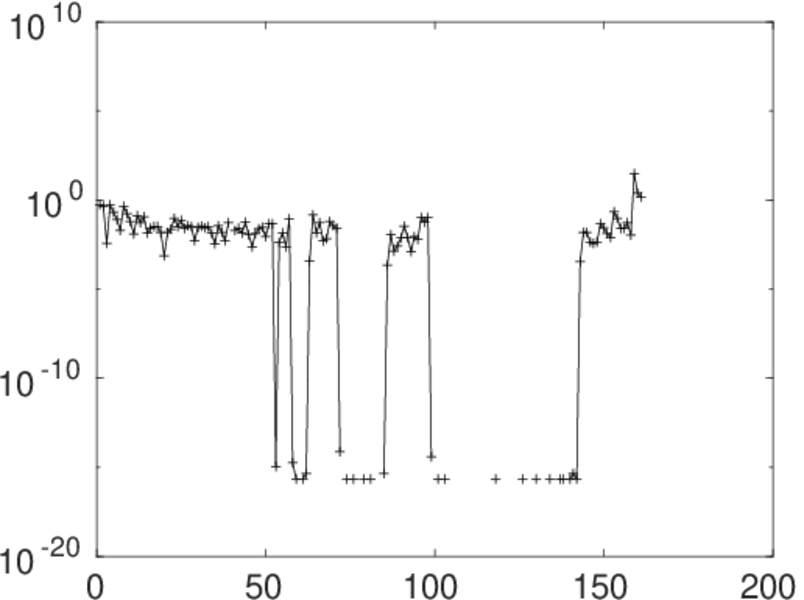
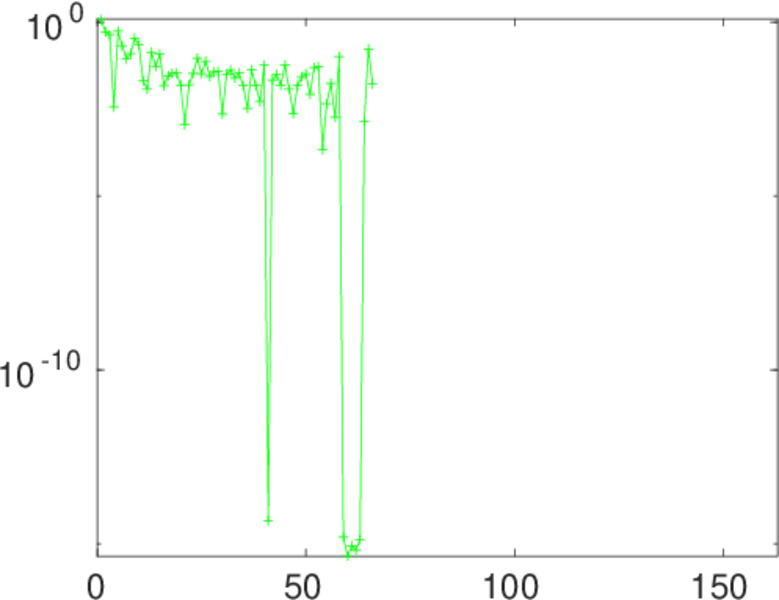
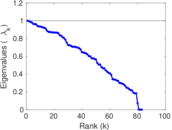
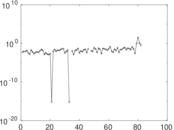
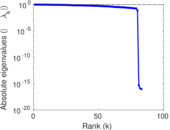
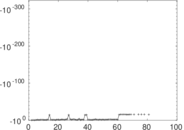
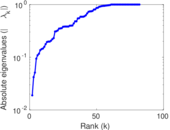
Matrix decompositions plots


Downloads
References
|
[1]
|
Jérôme Kunegis.
KONECT – The Koblenz Network Collection.
In Proc. Int. Conf. on World Wide Web Companion, pages
1343–1350, 2013.
[ http ]
|
|
[2]
|
Wikimedia Foundation.
Wikimedia downloads.
http://dumps.wikimedia.org/, January 2010.
|
 KONECT ‣ Networks ‣
Buy Me a Coffee
KONECT ‣ Networks ‣
Buy Me a Coffee