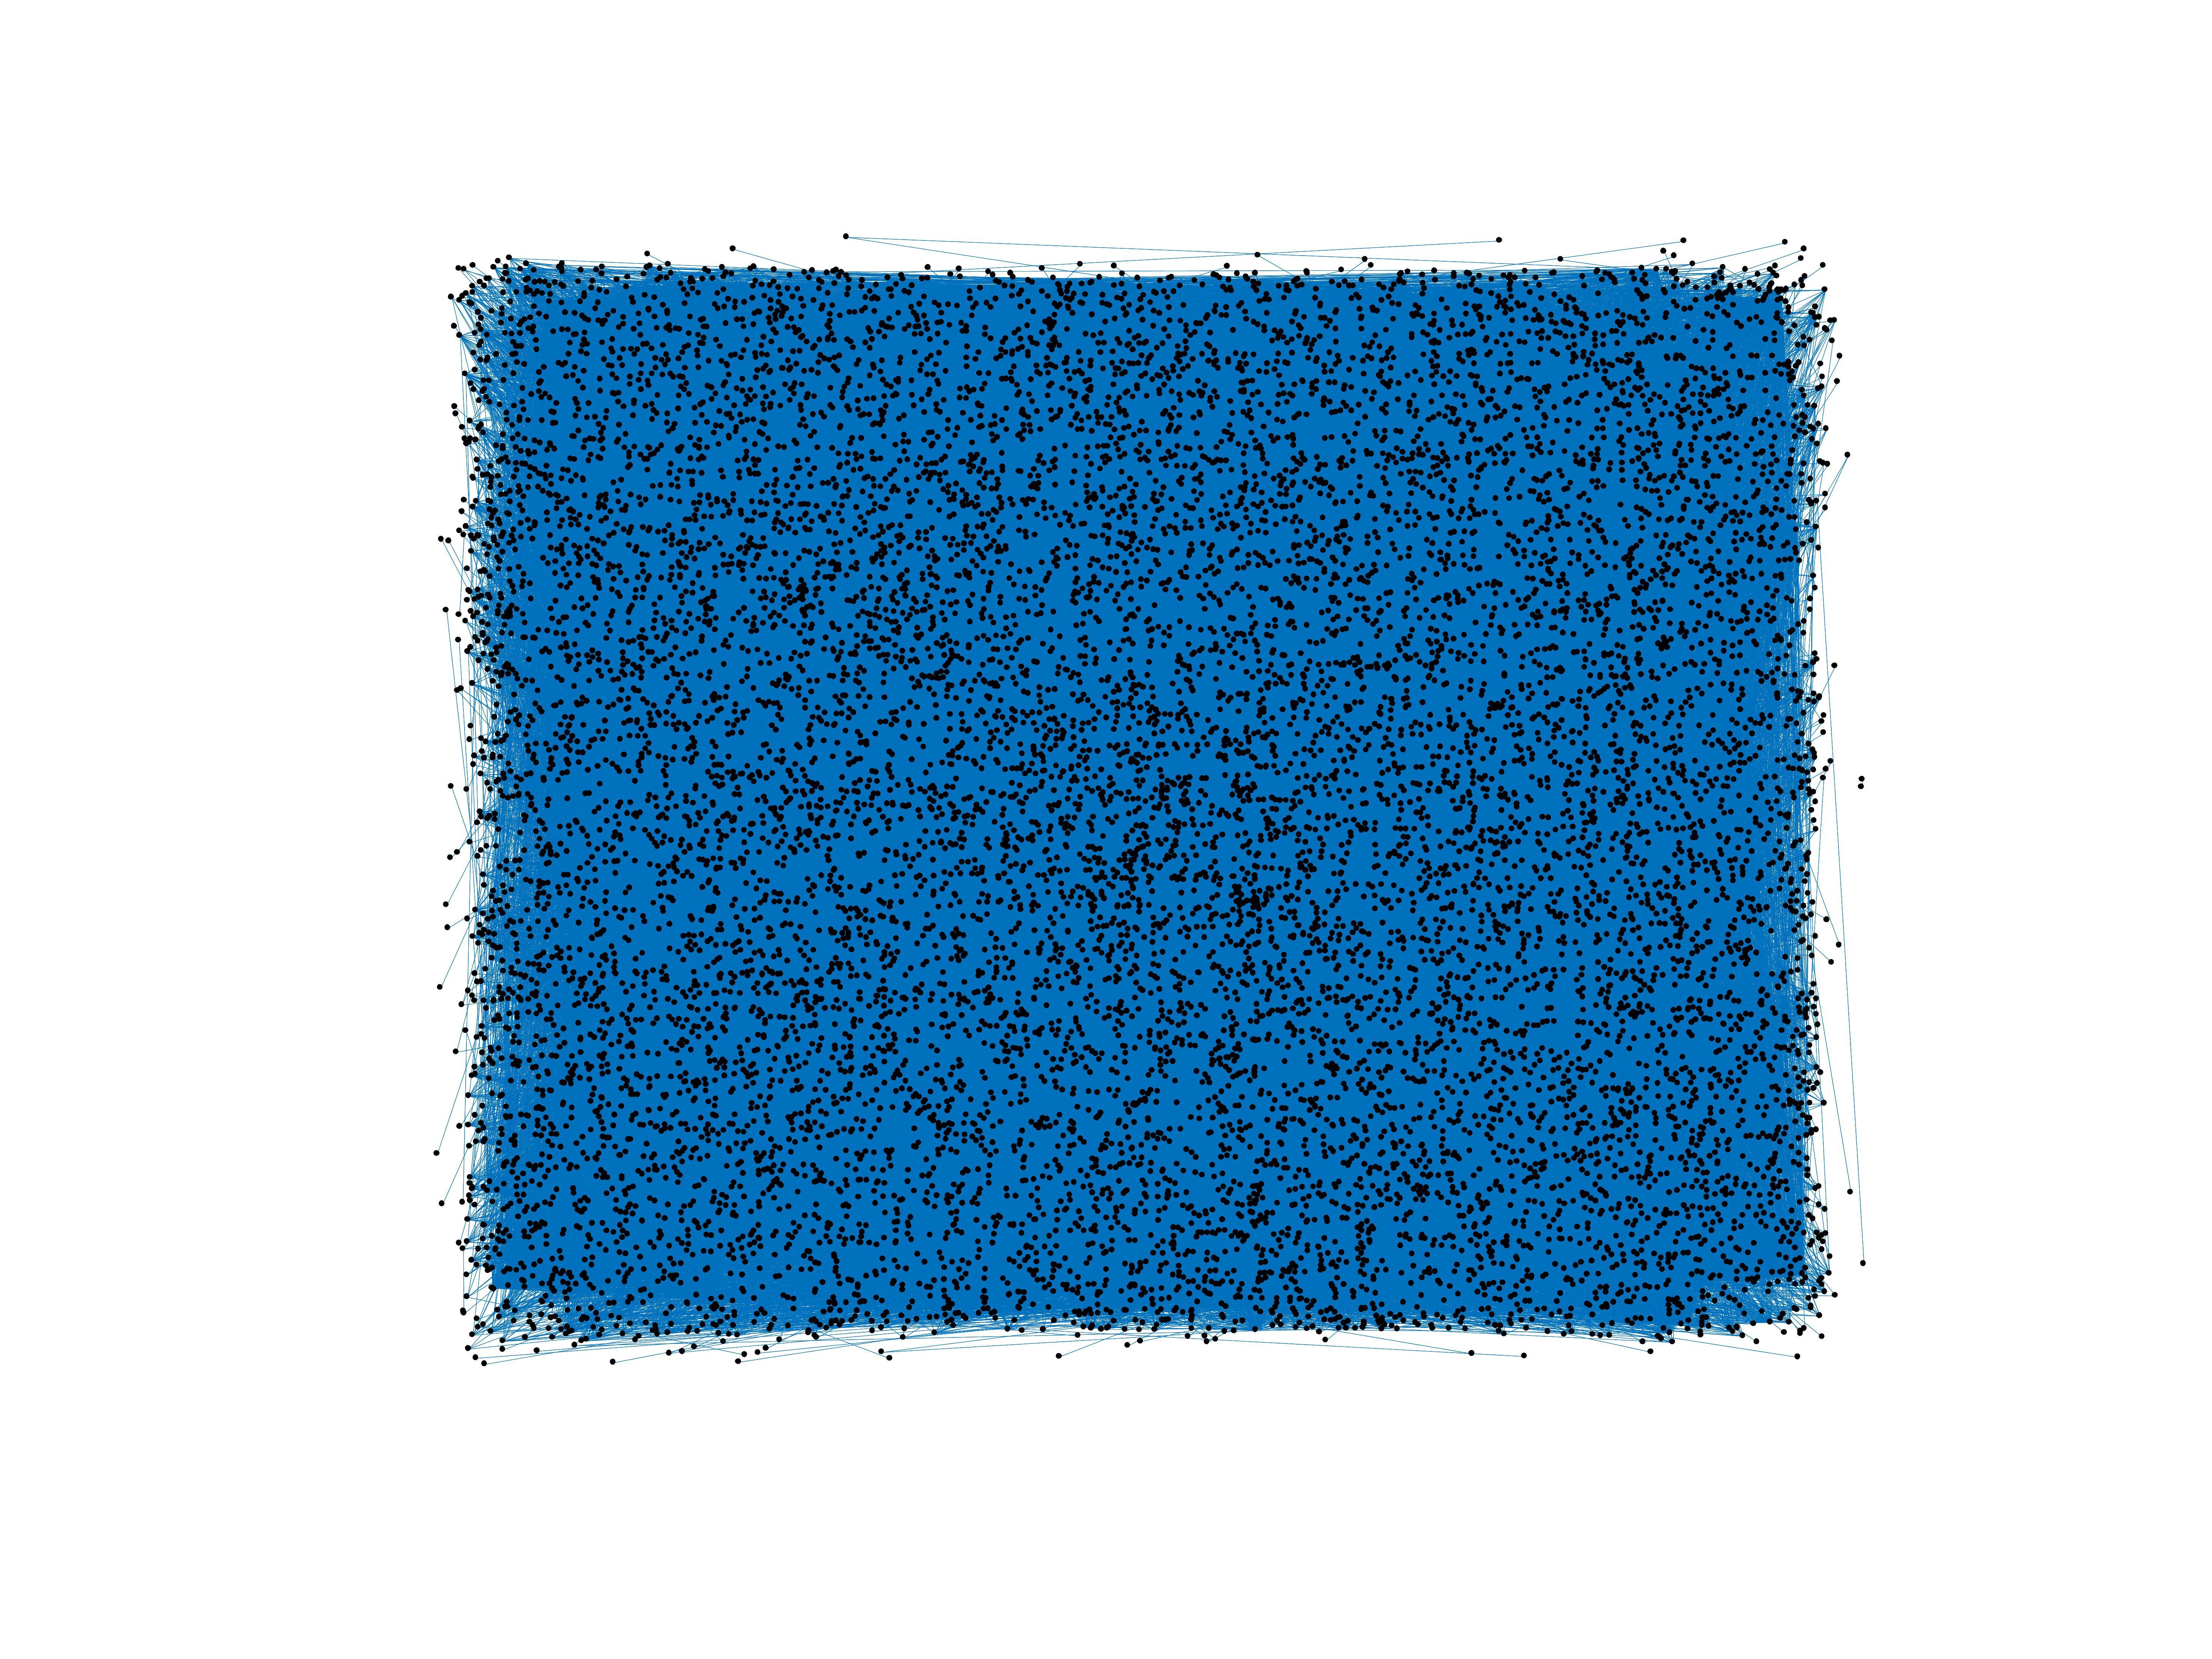
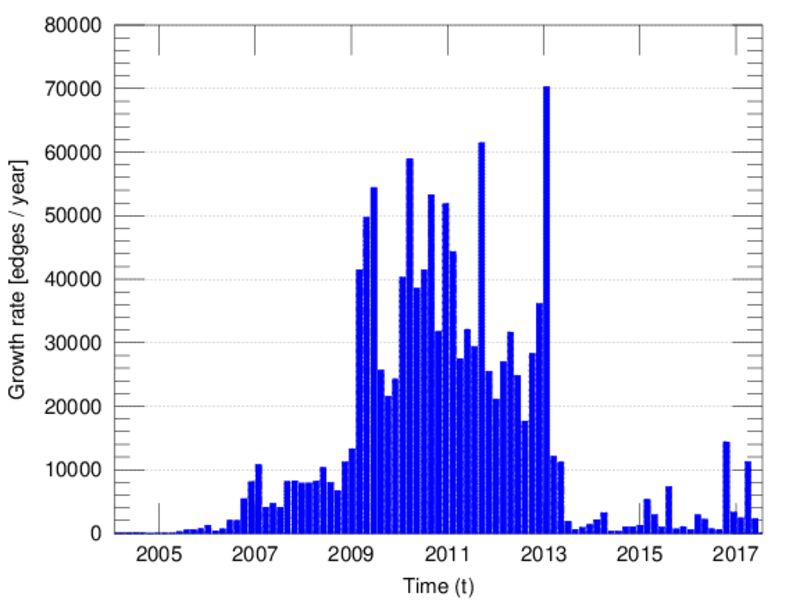
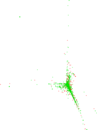
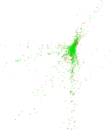
Wikipedia edits (tk)
This is the bipartite edit network of the Turkmen Wikipedia. It contains users
and pages from the Turkmen Wikipedia, connected by edit events. Each edge
represents an edit. The dataset includes the timestamp of each edit.
Metadata
Statistics
| Size | n = | 13,512
|
| Left size | n1 = | 1,425
|
| Right size | n2 = | 12,087
|
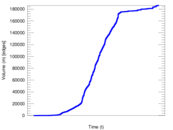
| Volume | m = | 186,243
|
| Unique edge count | m̿ = | 95,494
|
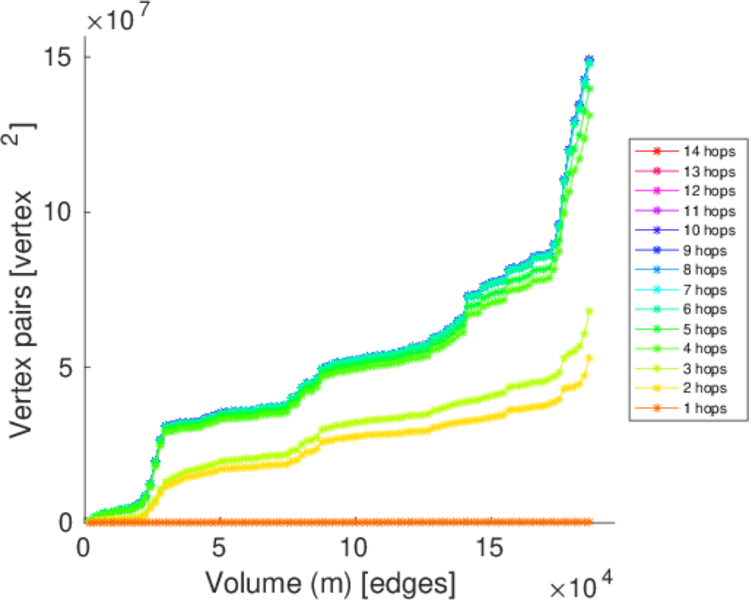
| Wedge count | s = | 114,039,558
|
| Claw count | z = | 136,728,886,645
|
| Cross count | x = | 138,762,561,059,867
|
| Square count | q = | 397,783,717
|
| 4-Tour count | T4 = | 3,638,705,840
|
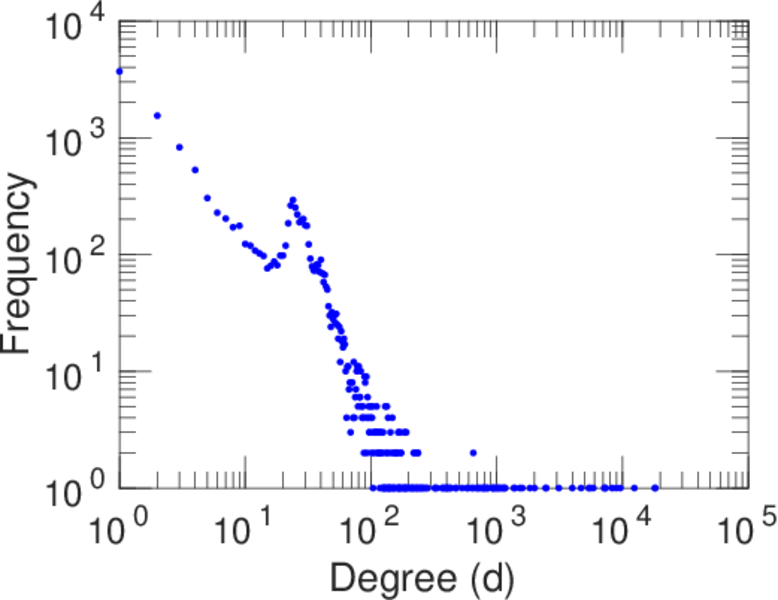
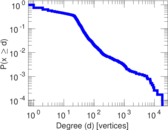
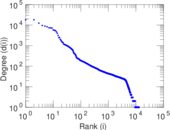
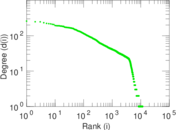
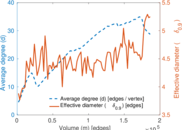
| Maximum degree | dmax = | 18,207
|
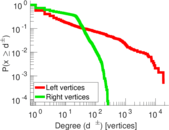
| Maximum left degree | d1max = | 18,207
|
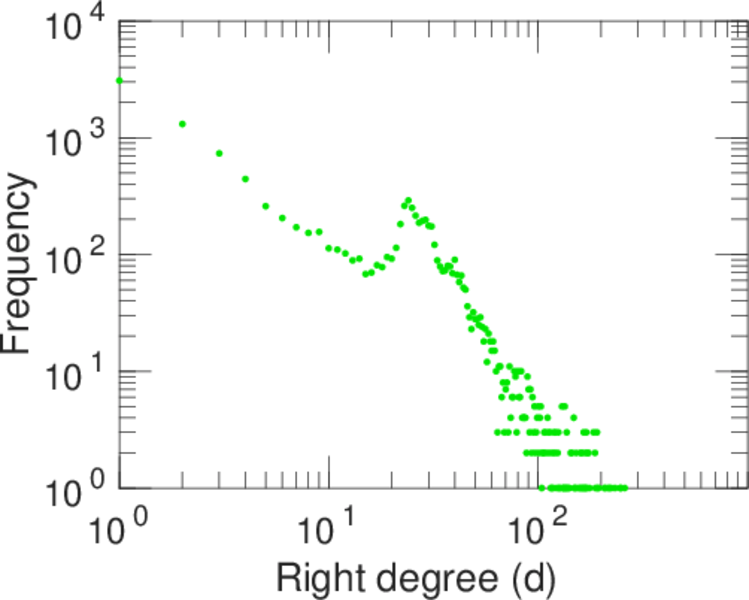
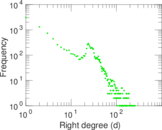
| Maximum right degree | d2max = | 259
|
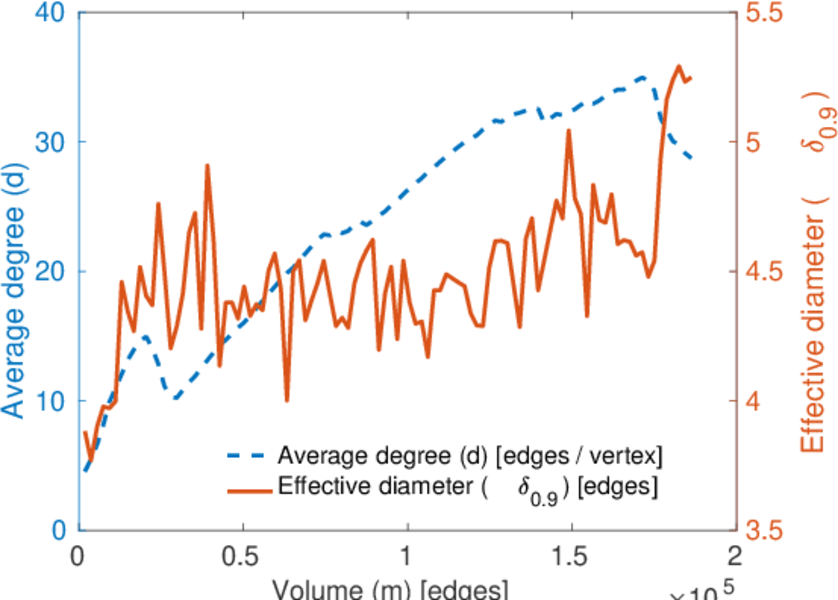
| Average degree | d = | 27.567 1
|
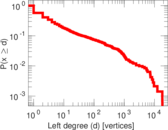
| Average left degree | d1 = | 130.697
|
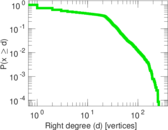
| Average right degree | d2 = | 15.408 5
|
| Fill | p = | 0.005 544 25
|
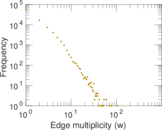
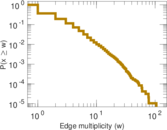
| Average edge multiplicity | m̃ = | 1.950 31
|
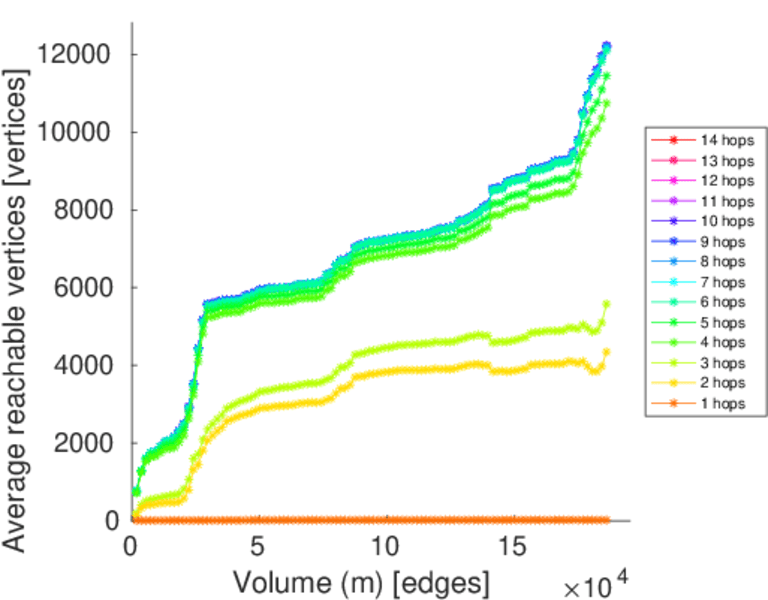
| Size of LCC | N = | 12,213
|
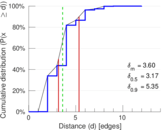
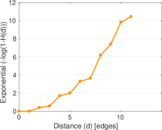
| Diameter | δ = | 14
|
| 50-Percentile effective diameter | δ0.5 = | 3.165 69
|
| 90-Percentile effective diameter | δ0.9 = | 5.351 81
|
| Median distance | δM = | 4
|
| Mean distance | δm = | 3.603 12
|
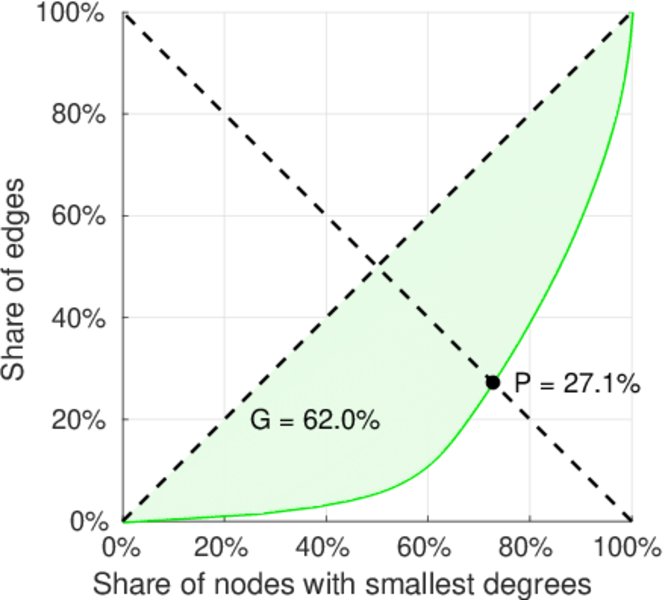
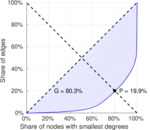
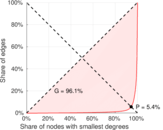
| Gini coefficient | G = | 0.795 729
|
| Balanced inequality ratio | P = | 0.204 612
|
| Left balanced inequality ratio | P1 = | 0.054 181 9
|
| Right balanced inequality ratio | P2 = | 0.270 920
|
| Relative edge distribution entropy | Her = | 0.766 136
|
| Power law exponent | γ = | 1.729 63
|
| Tail power law exponent | γt = | 3.301 00
|
| Tail power law exponent with p | γ3 = | 3.301 00
|
| p-value | p = | 0.000 00
|
| Left tail power law exponent with p | γ3,1 = | 1.501 00
|
| Left p-value | p1 = | 0.000 00
|
| Right tail power law exponent with p | γ3,2 = | 5.771 00
|
| Right p-value | p2 = | 0.003 000 00
|
| Degree assortativity | ρ = | −0.108 095
|
| Degree assortativity p-value | pρ = | 4.613 62 × 10−246
|
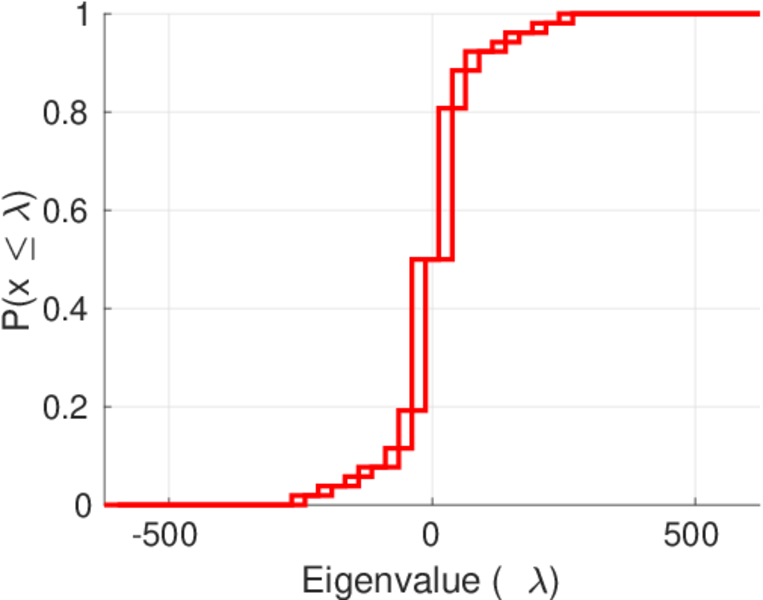
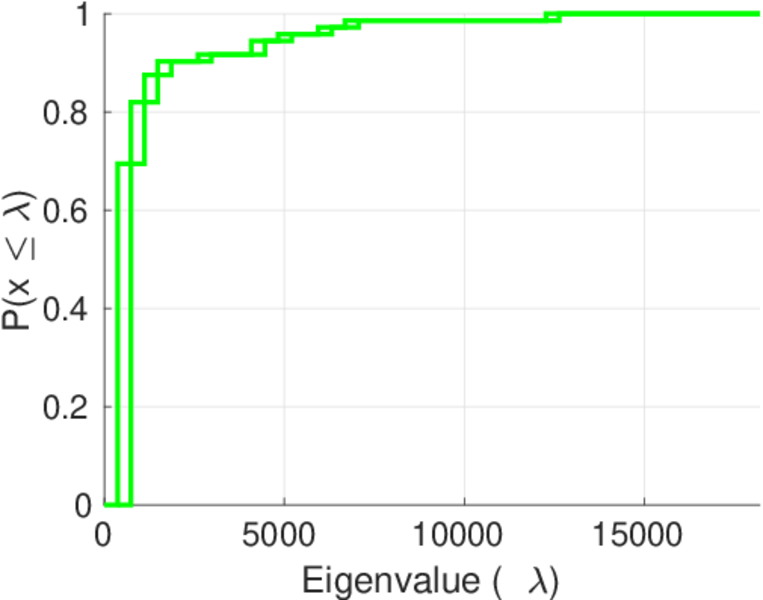
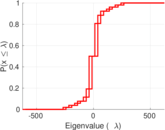
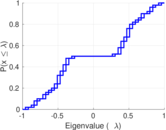
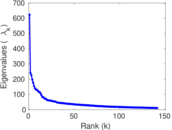
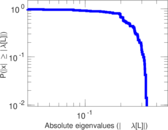
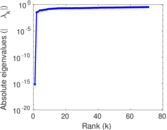
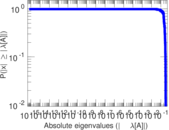
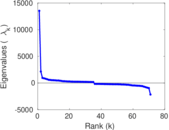
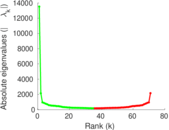
| Spectral norm | α = | 623.067
|
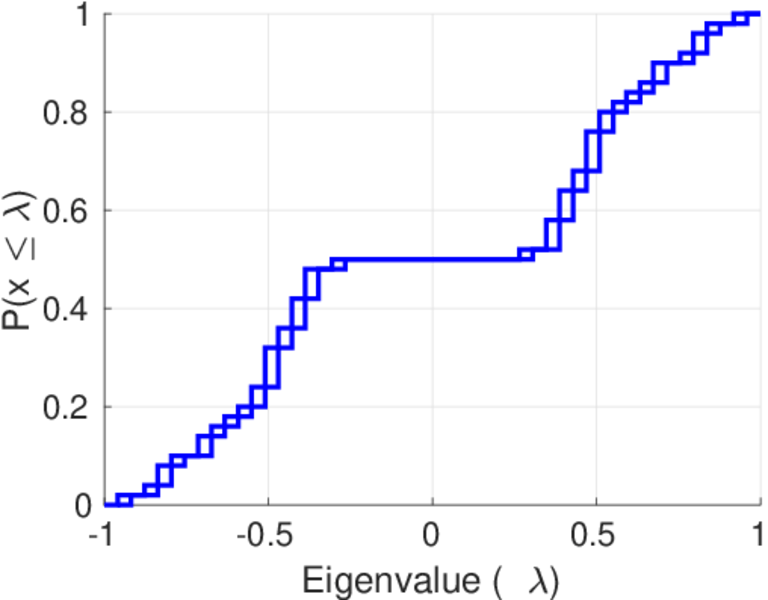
| Algebraic connectivity | a = | 0.032 783 9
|
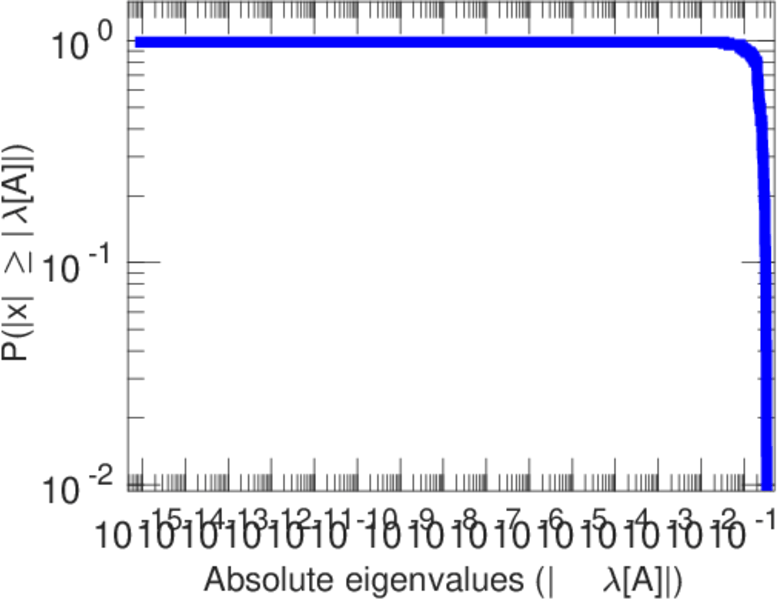
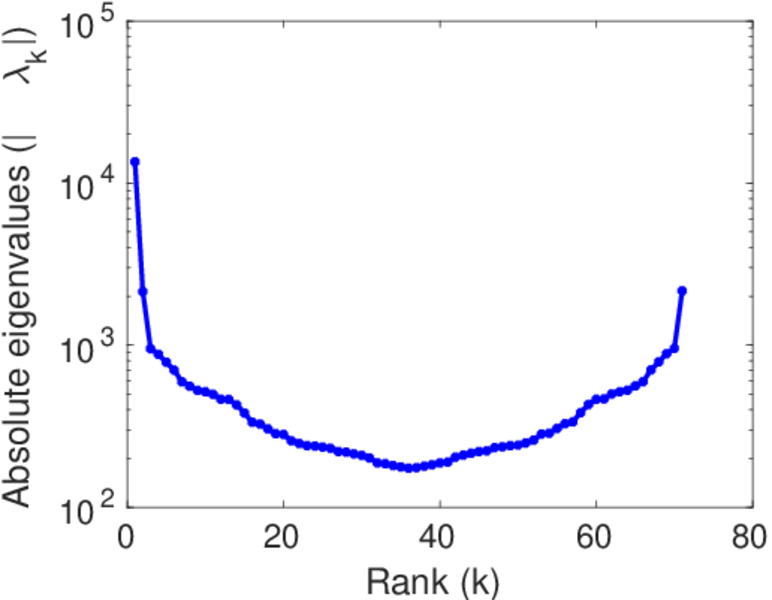
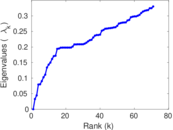
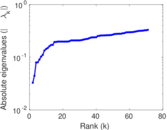
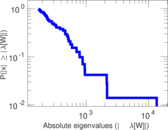
| Spectral separation | |λ1[A] / λ2[A]| = | 2.589 42
|
| Controllability | C = | 10,346
|
| Relative controllability | Cr = | 0.797 810
|
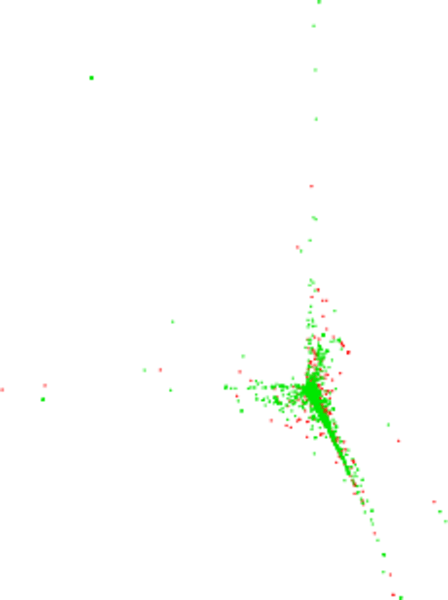
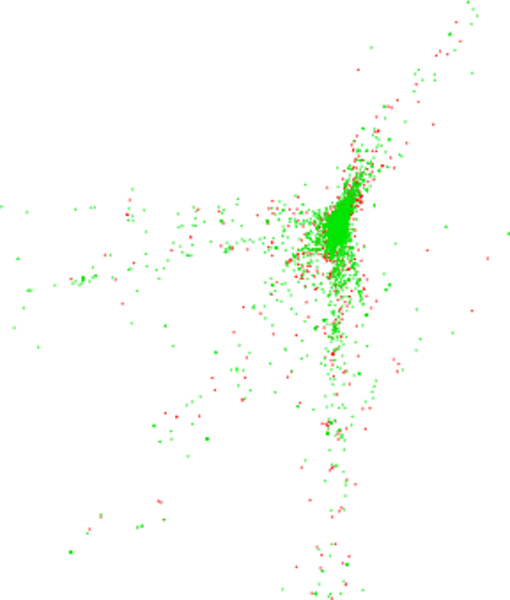
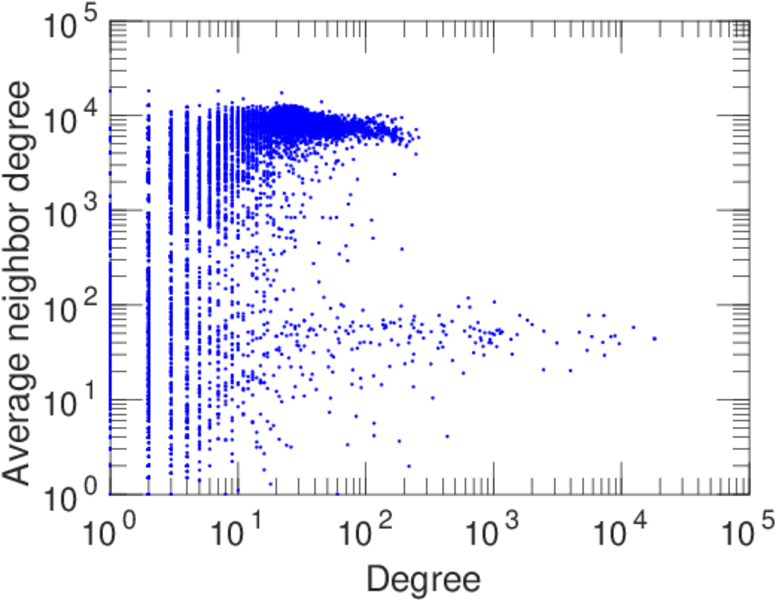
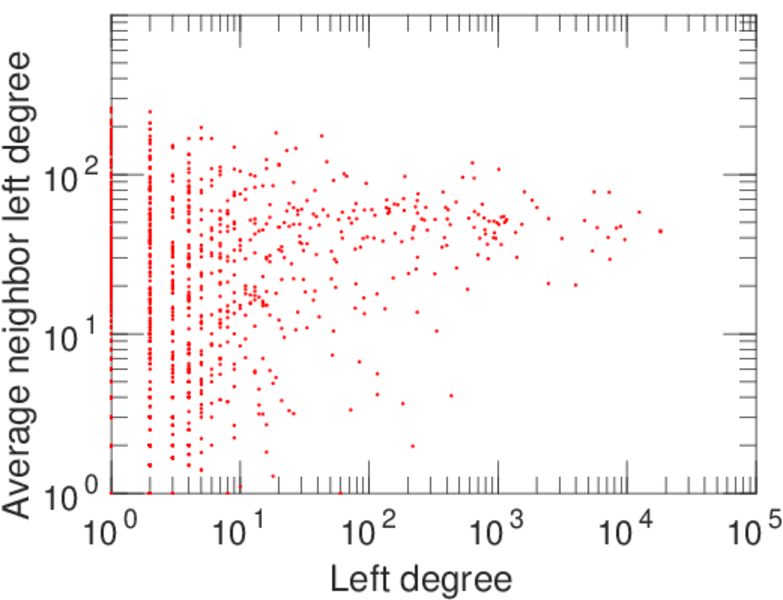
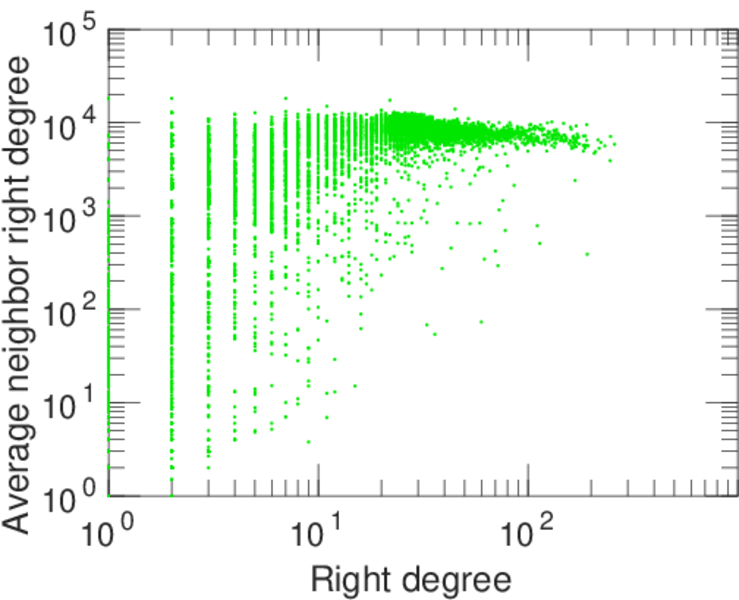
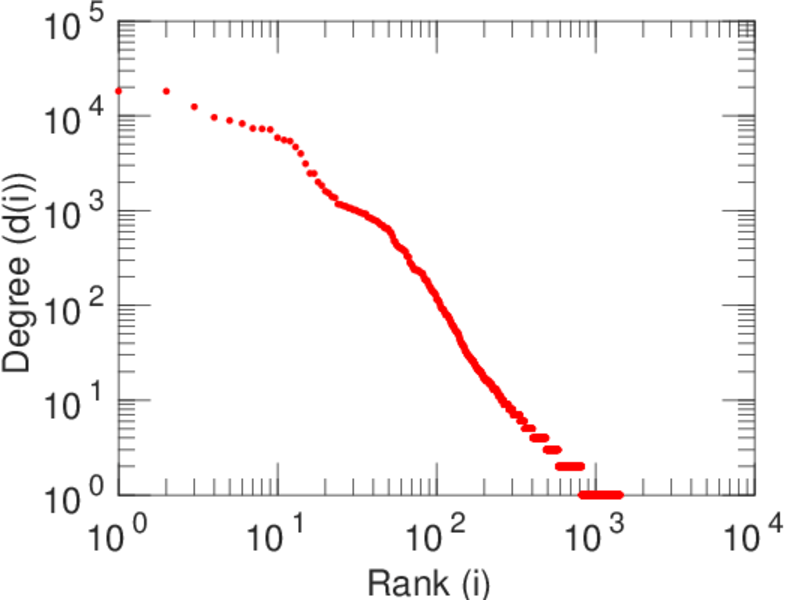
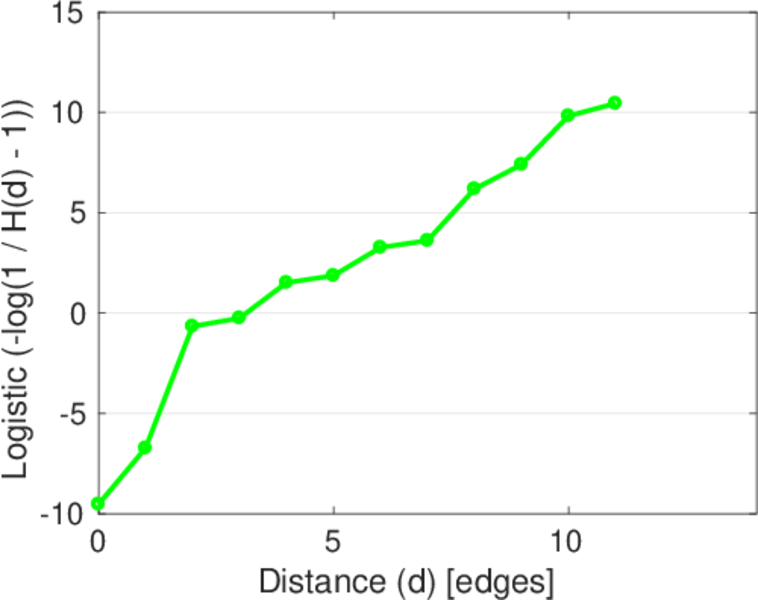
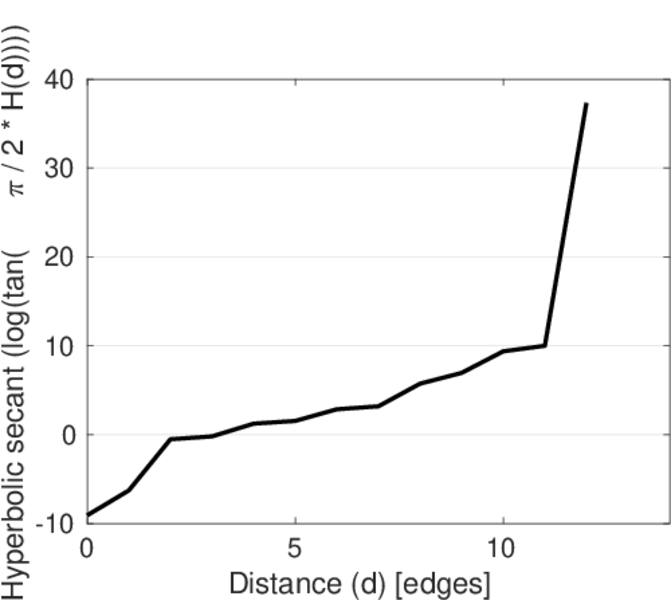
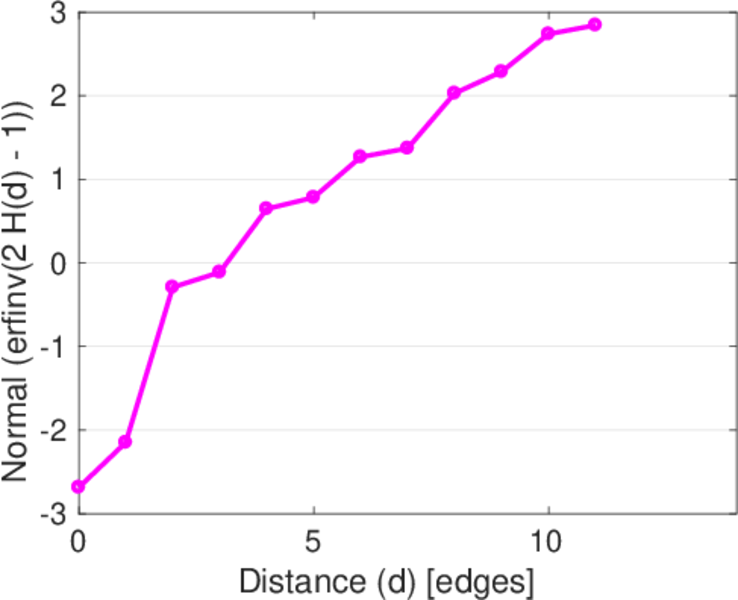
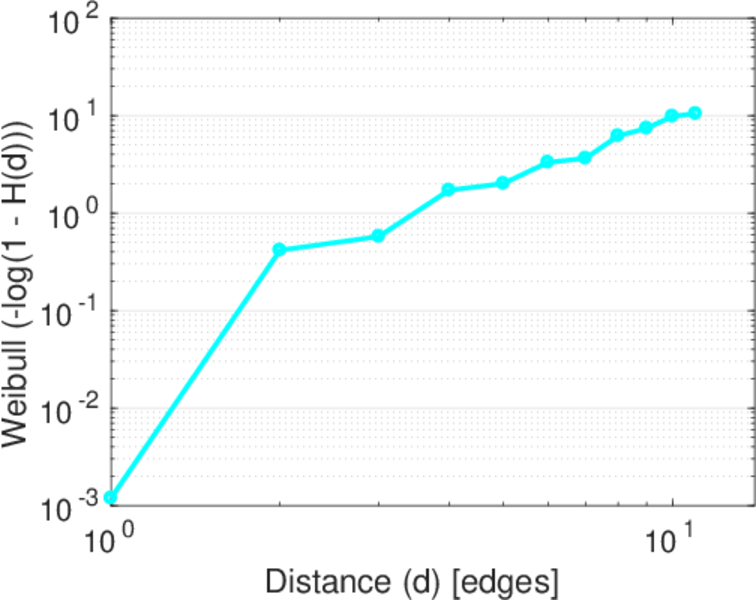
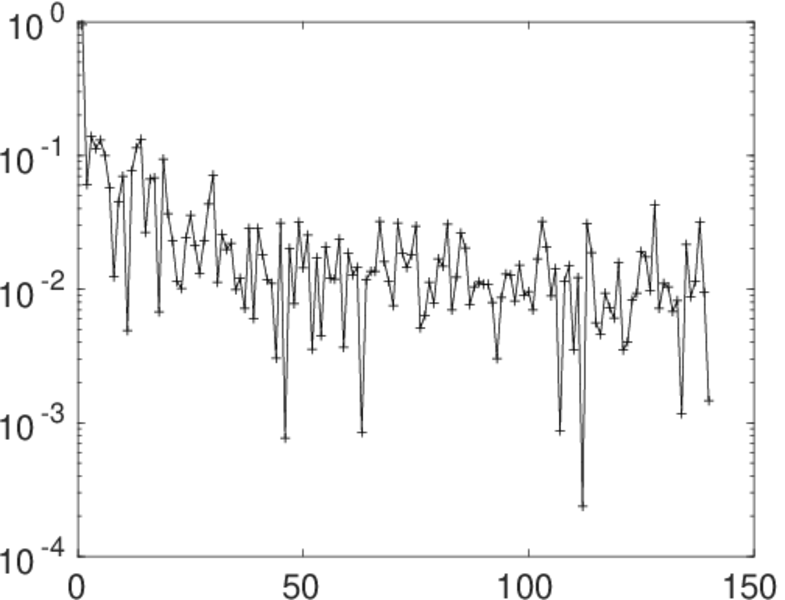
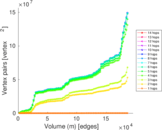
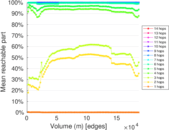
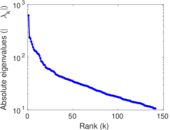
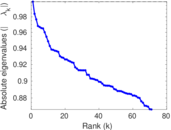
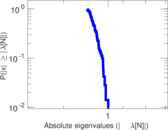
Plots


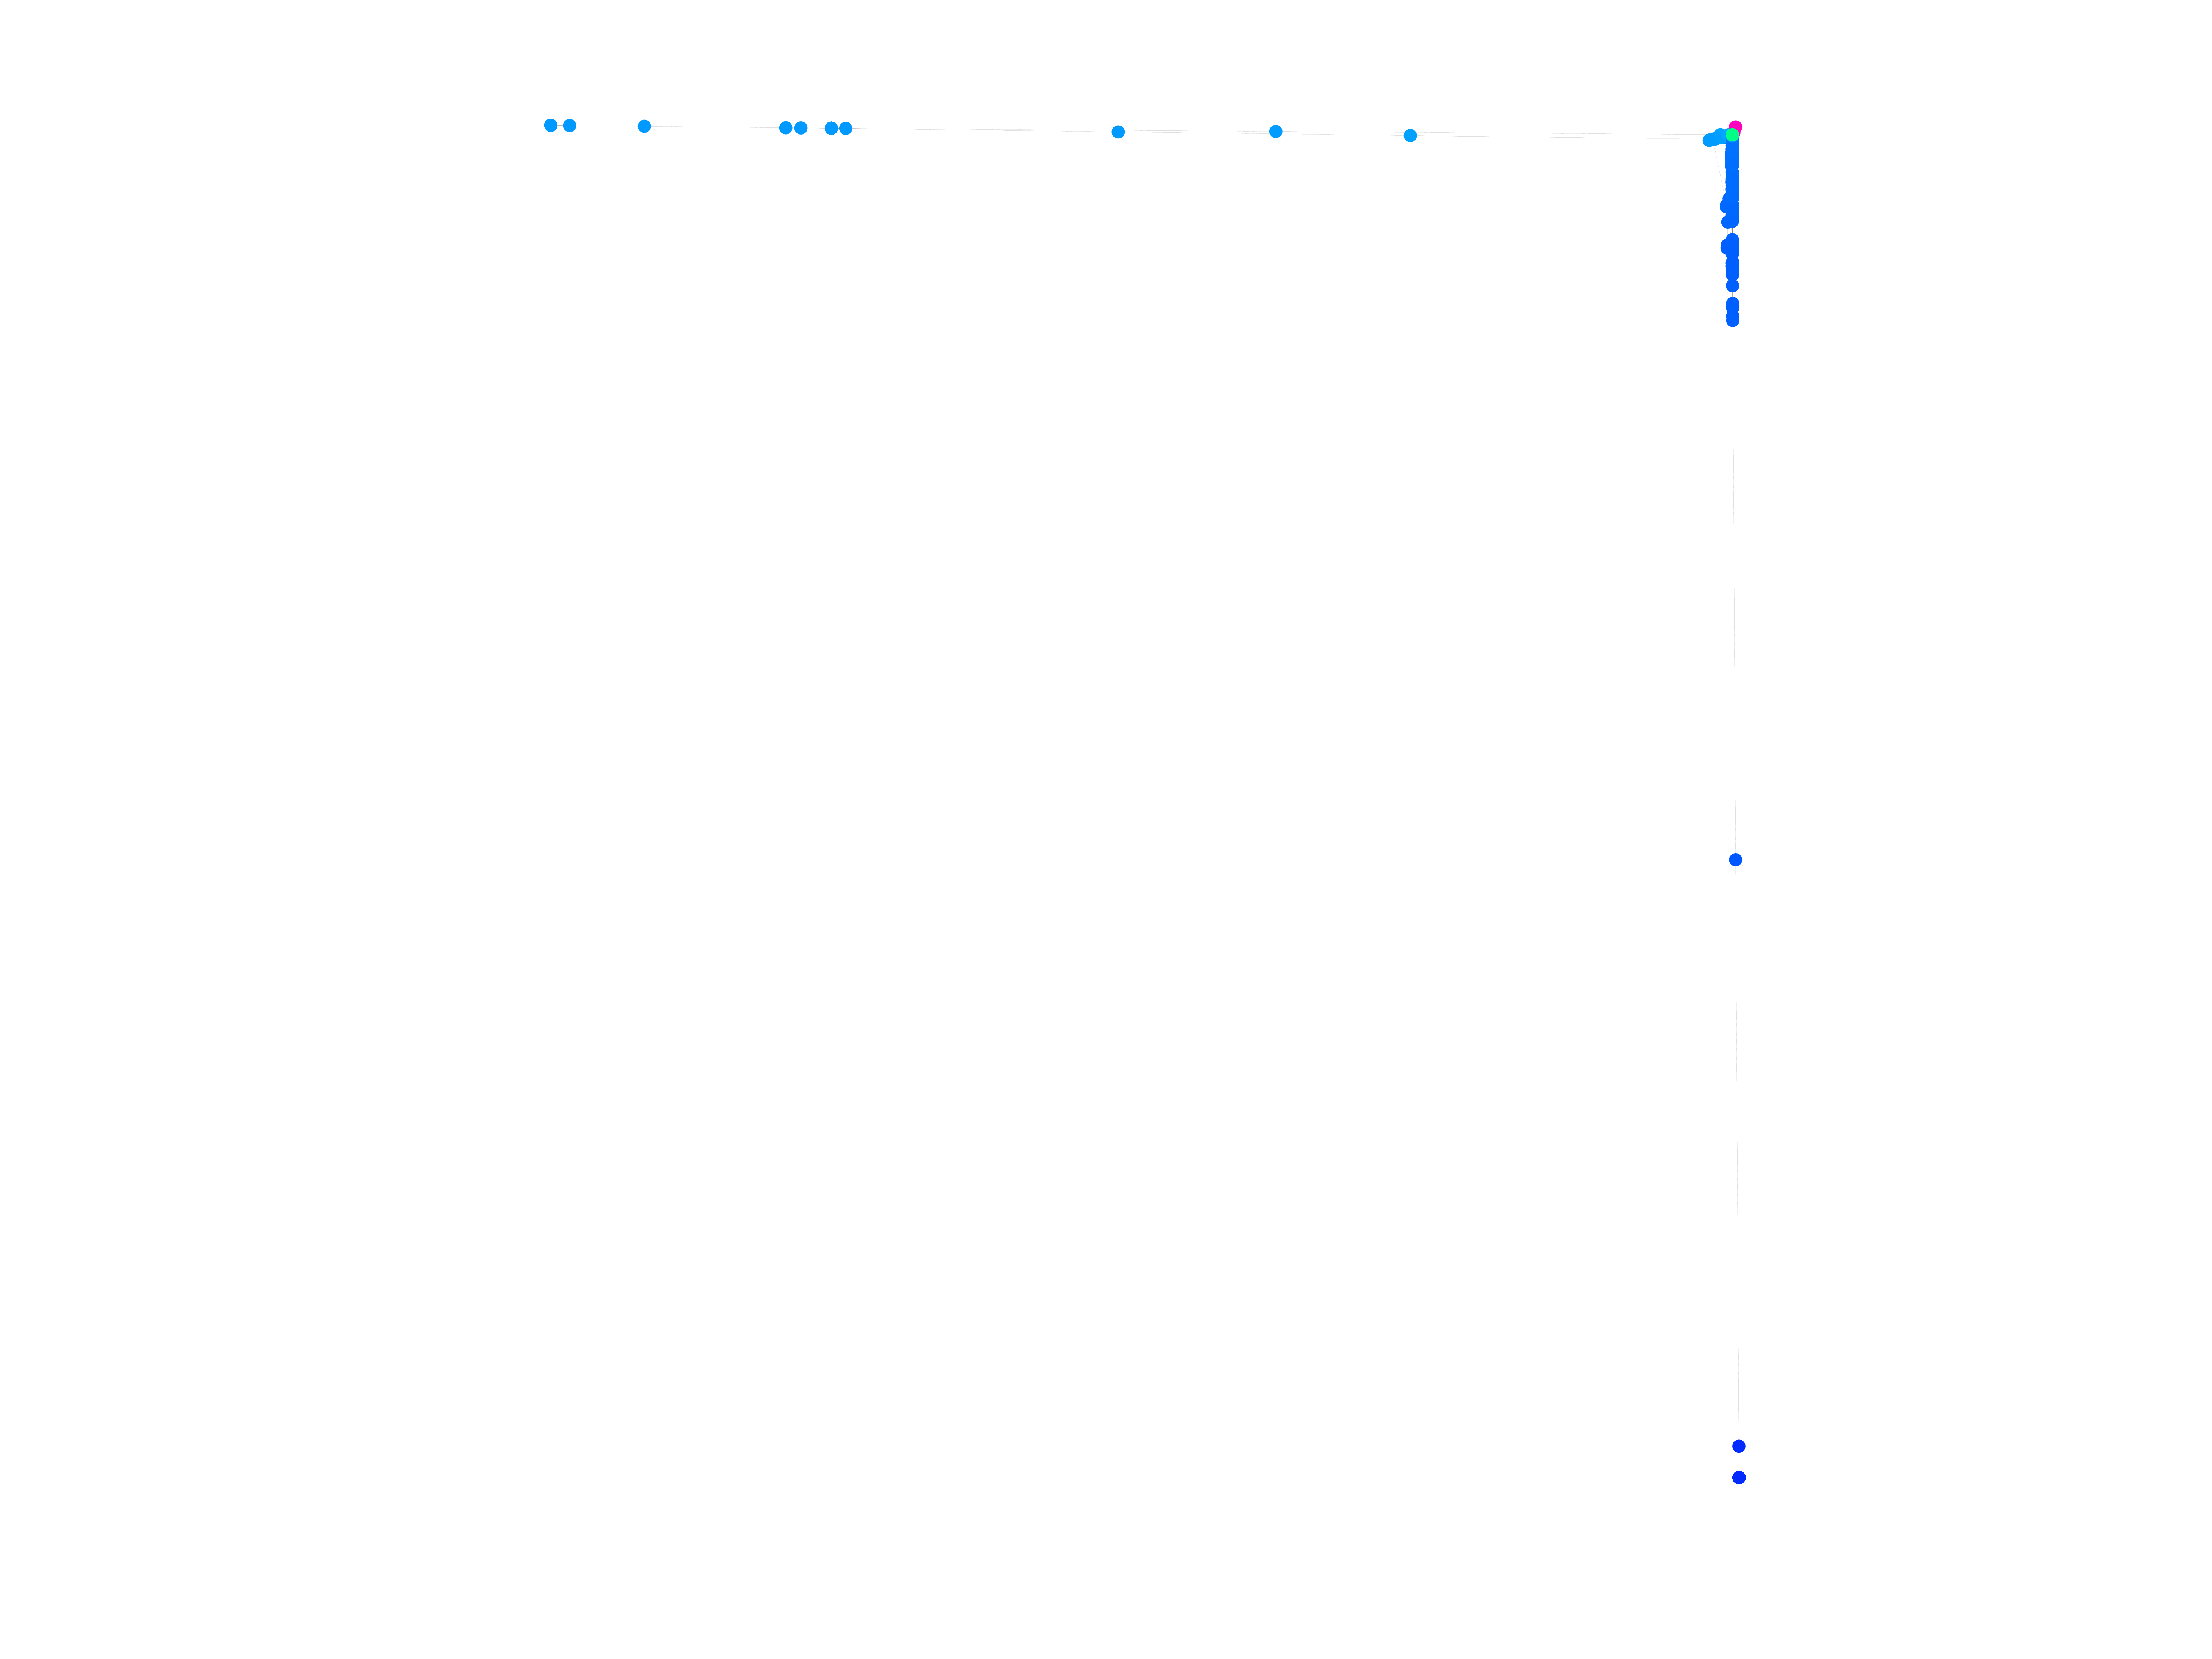
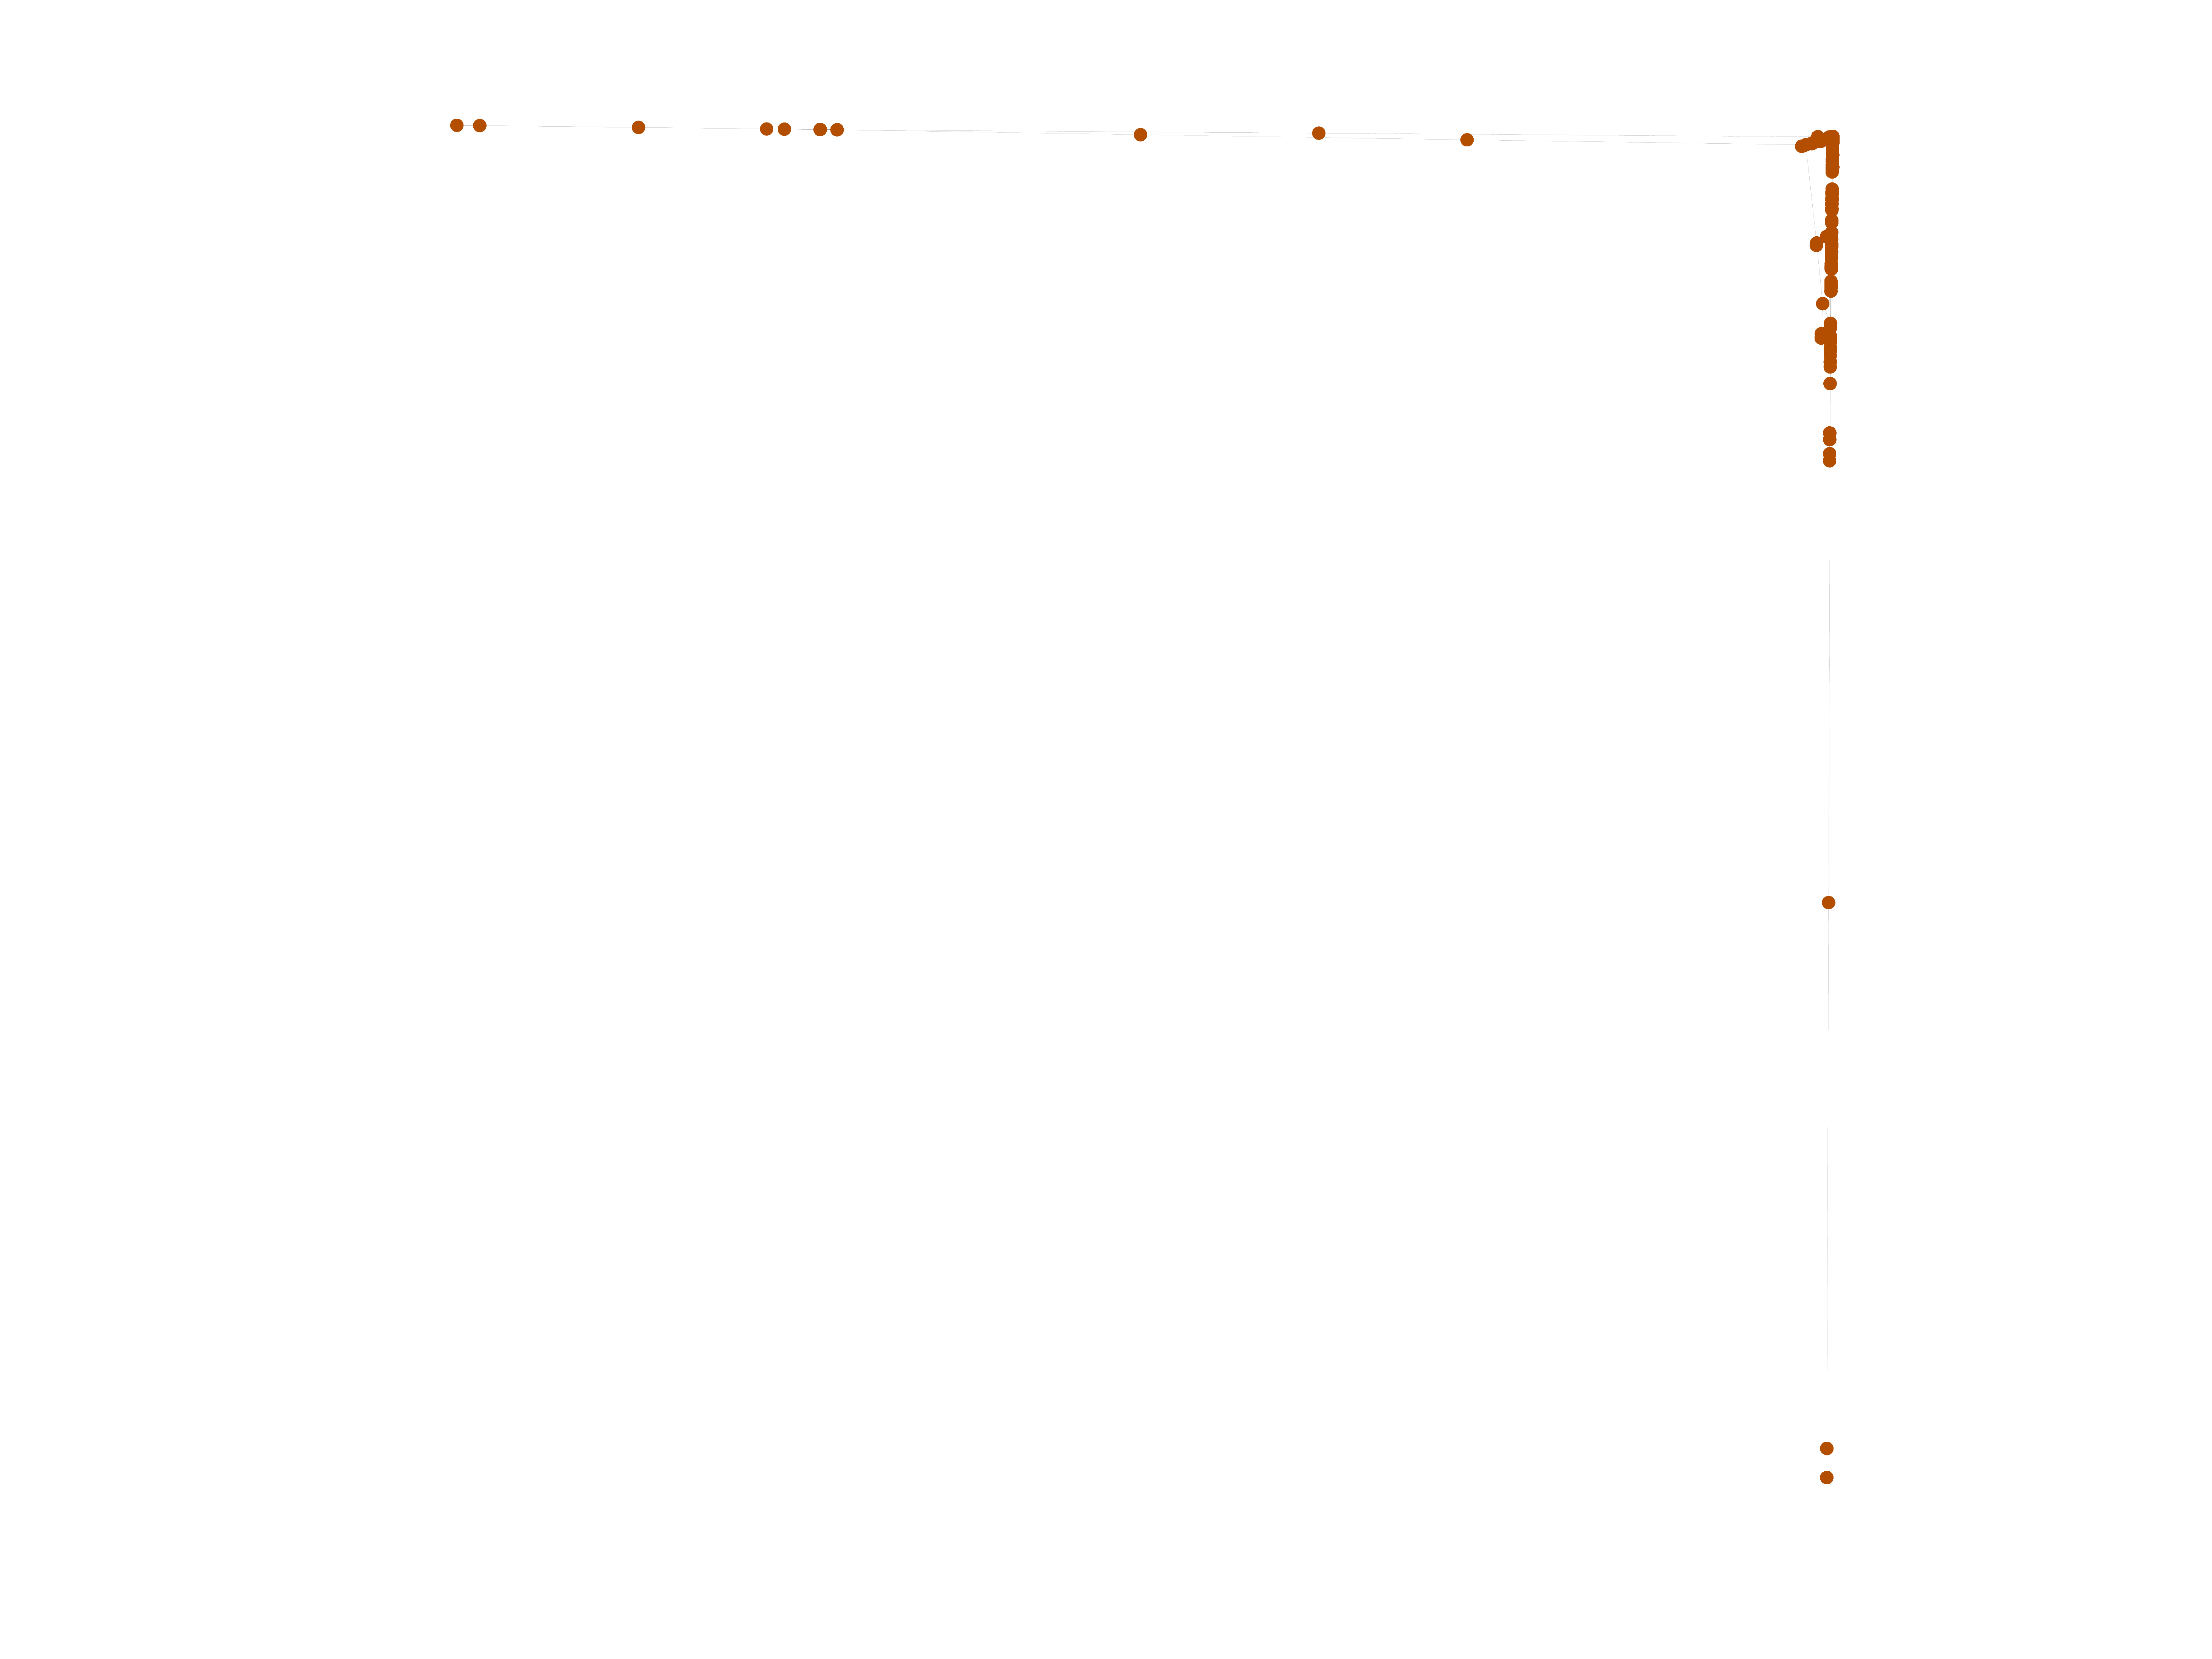
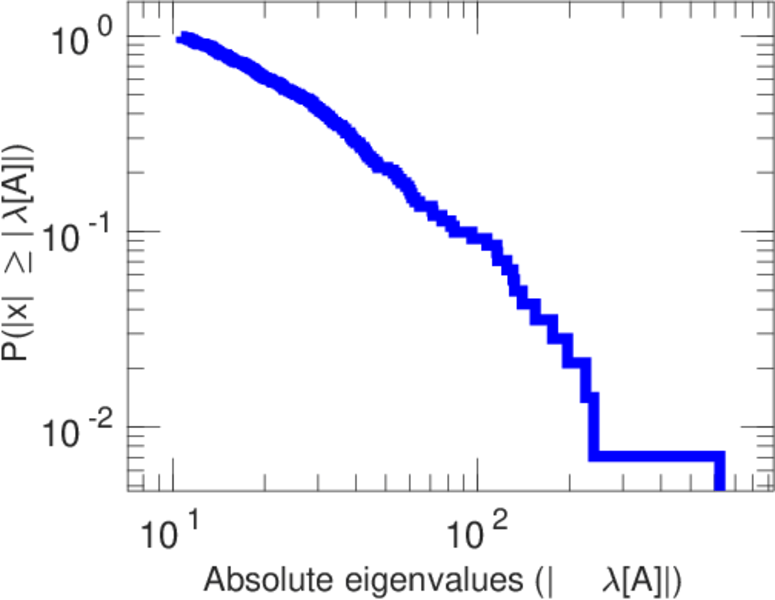
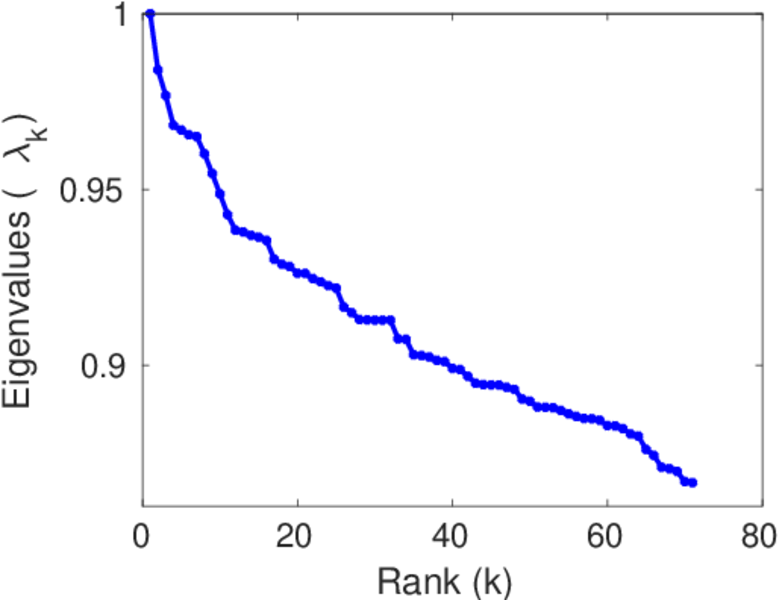
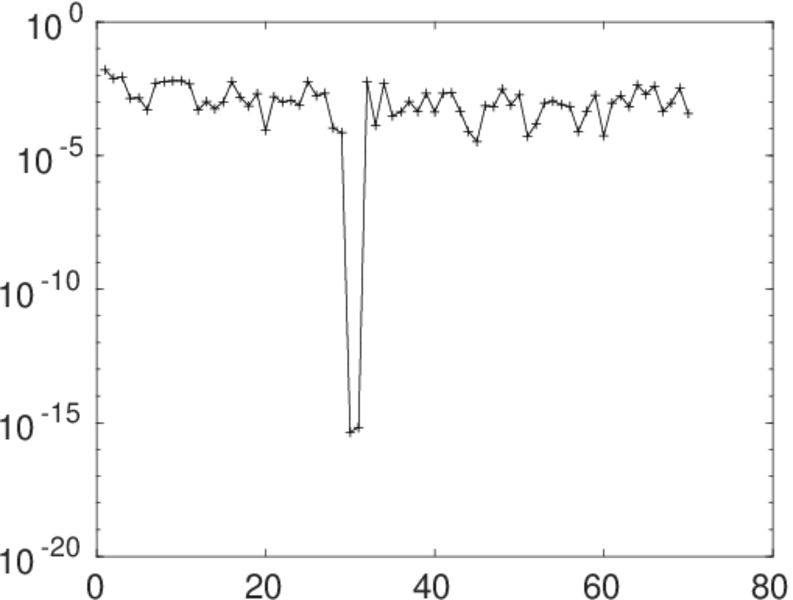
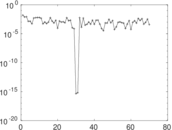
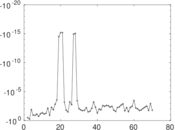
Matrix decompositions plots


Downloads
References
|
[1]
|
Jérôme Kunegis.
KONECT – The Koblenz Network Collection.
In Proc. Int. Conf. on World Wide Web Companion, pages
1343–1350, 2013.
[ http ]
|
|
[2]
|
Wikimedia Foundation.
Wikimedia downloads.
http://dumps.wikimedia.org/, January 2010.
|
 KONECT ‣ Networks ‣
Buy Me a Coffee
KONECT ‣ Networks ‣
Buy Me a Coffee