Wikipedia edits (tl)
This is the bipartite edit network of the Tagalog Wikipedia. It contains users
and pages from the Tagalog Wikipedia, connected by edit events. Each edge
represents an edit. The dataset includes the timestamp of each edit.
Metadata
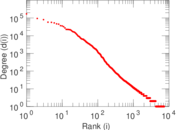
Statistics
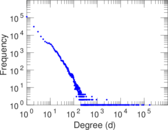
| Size | n = | 227,374
|
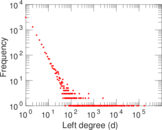
| Left size | n1 = | 7,351
|
| Right size | n2 = | 220,023
|
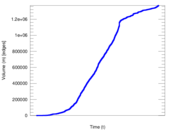
| Volume | m = | 1,372,133
|
| Unique edge count | m̿ = | 762,724
|
| Wedge count | s = | 10,715,382,386
|
| Claw count | z = | 237,121,209,606,196
|
| Cross count | x = | 5,259,426,075,451,676,672
|
| Square count | q = | 7,631,676,397
|
| 4-Tour count | T4 = | 103,916,486,088
|
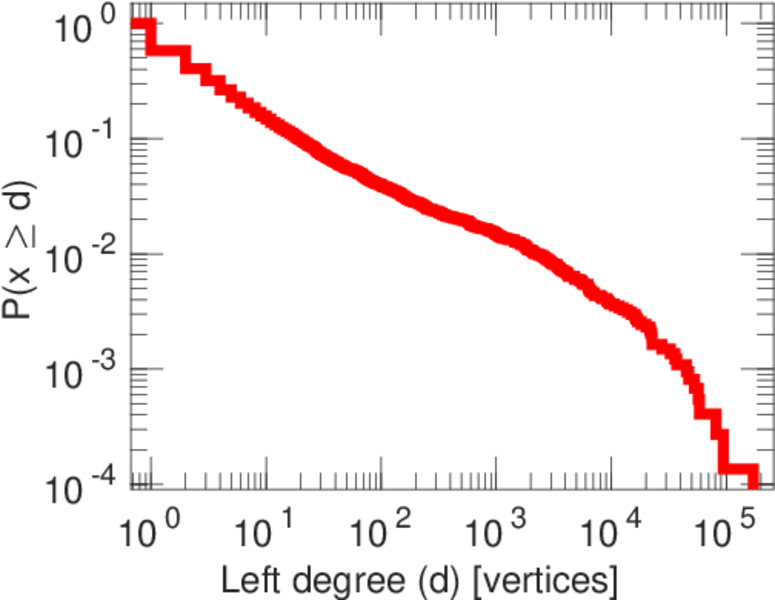
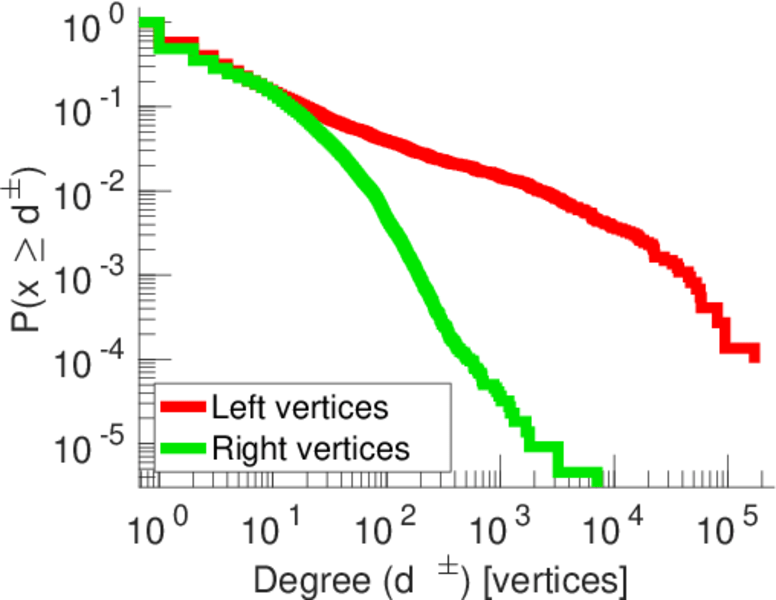
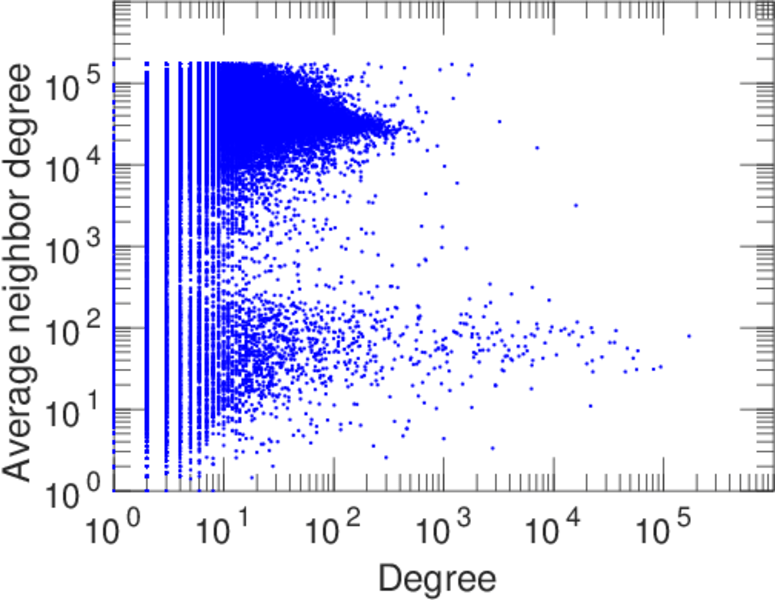
| Maximum degree | dmax = | 171,129
|
| Maximum left degree | d1max = | 171,129
|
| Maximum right degree | d2max = | 7,097
|
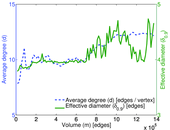
| Average degree | d = | 12.069 4
|
| Average left degree | d1 = | 186.659
|
| Average right degree | d2 = | 6.236 32
|
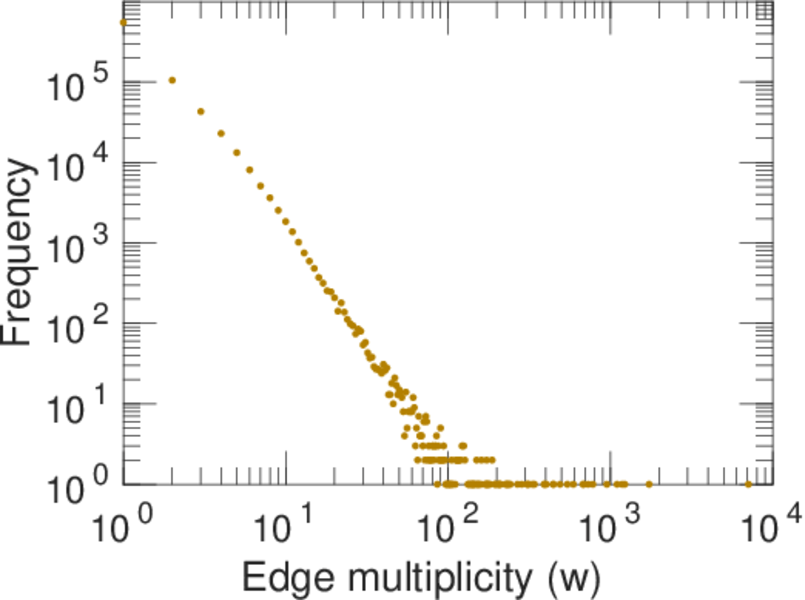
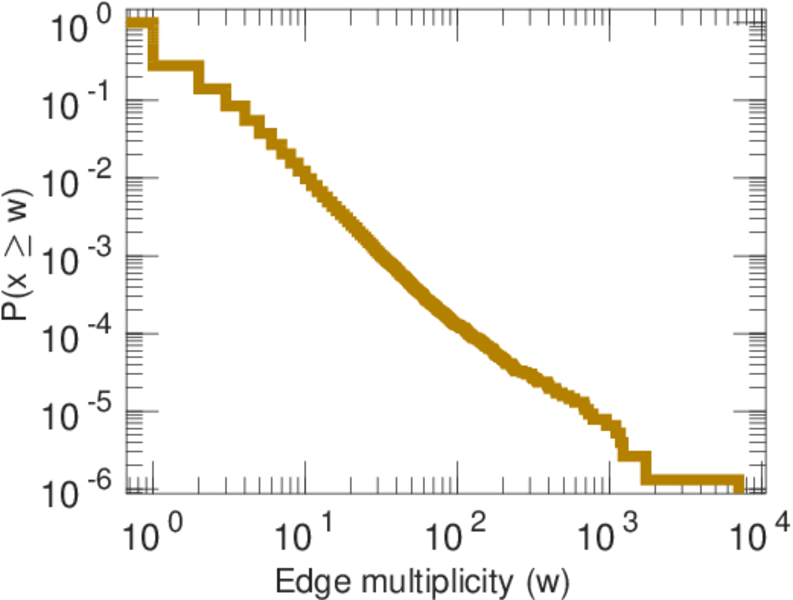
| Average edge multiplicity | m̃ = | 1.798 99
|
| Size of LCC | N = | 224,381
|
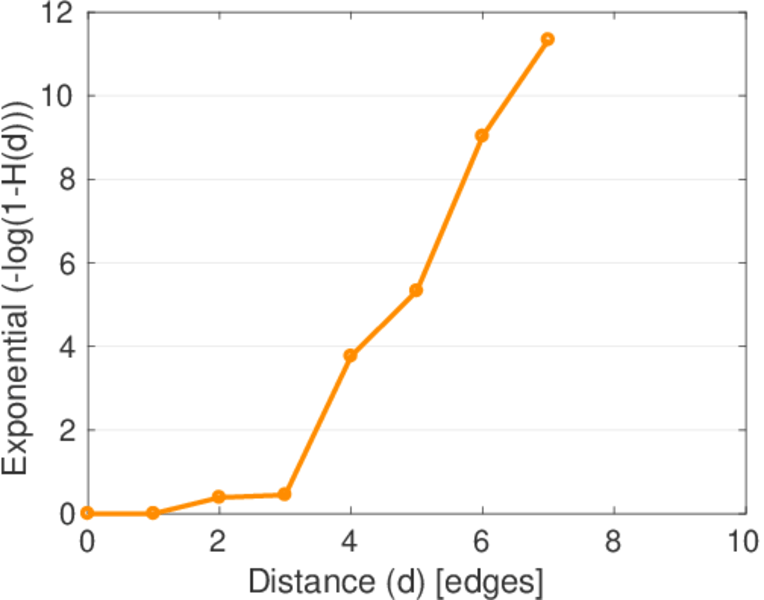
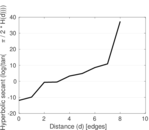
| Diameter | δ = | 11
|
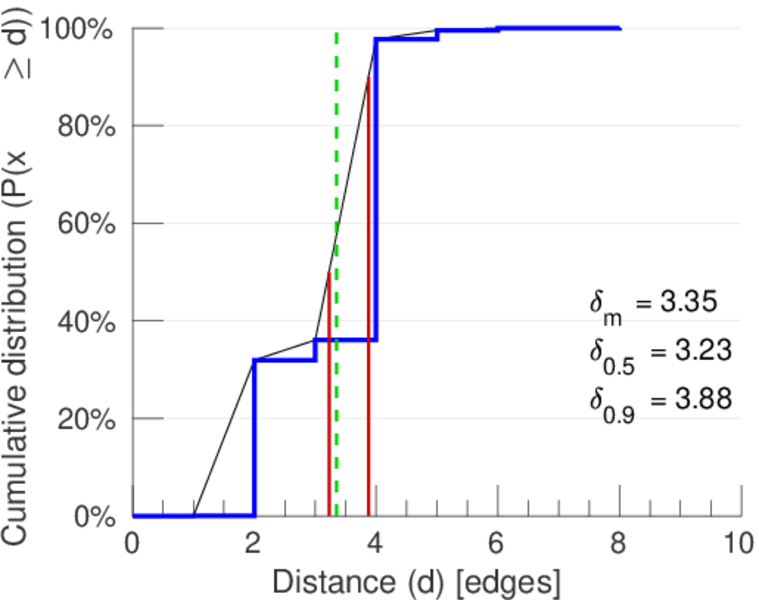
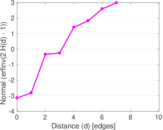
| 50-Percentile effective diameter | δ0.5 = | 3.226 42
|
| 90-Percentile effective diameter | δ0.9 = | 3.875 33
|
| Median distance | δM = | 4
|
| Mean distance | δm = | 3.348 30
|
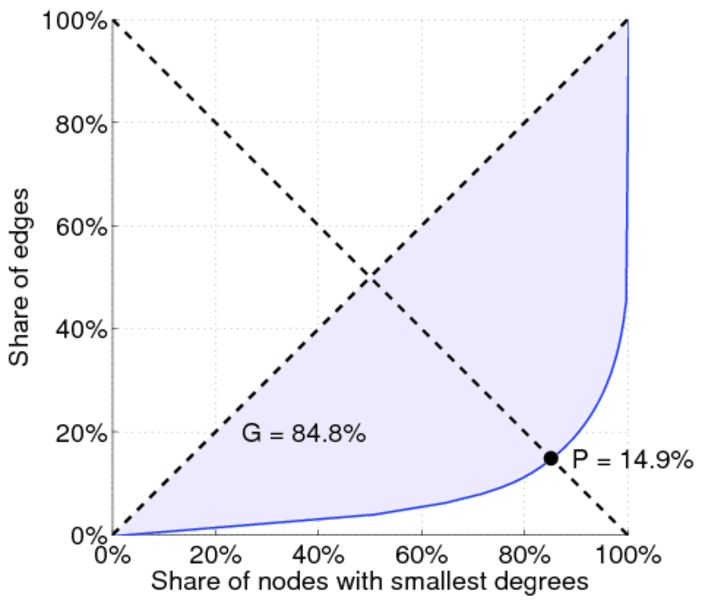
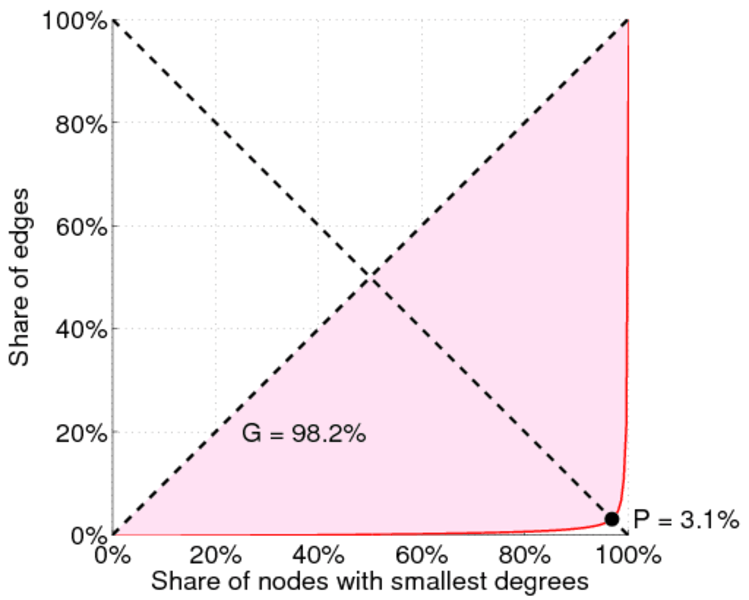
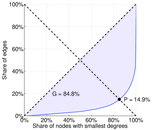
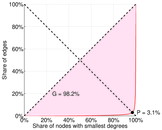
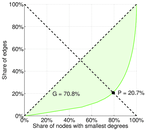
| Gini coefficient | G = | 0.850 553
|
| Balanced inequality ratio | P = | 0.147 437
|
| Left balanced inequality ratio | P1 = | 0.030 559 0
|
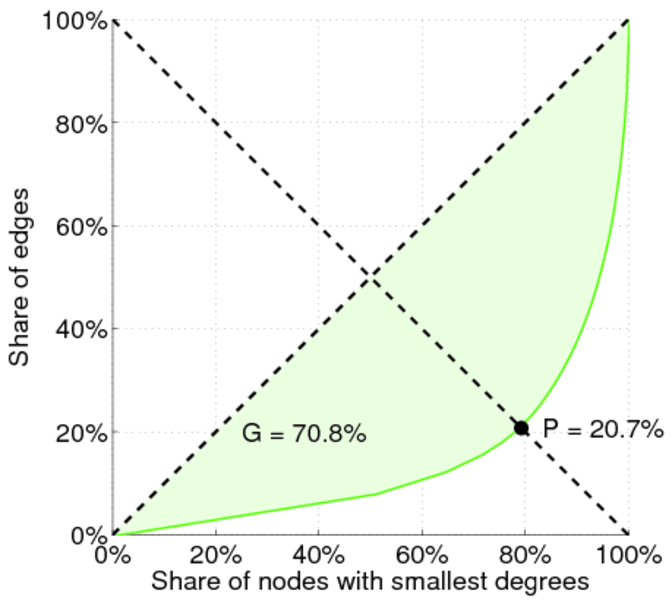
| Right balanced inequality ratio | P2 = | 0.207 297
|
| Relative edge distribution entropy | Her = | 0.701 281
|
| Power law exponent | γ = | 2.493 57
|
| Tail power law exponent with p | γ3 = | 1.901 00
|
| p-value | p = | 0.000 00
|
| Left tail power law exponent with p | γ3,1 = | 1.531 00
|
| Left p-value | p1 = | 0.000 00
|
| Right tail power law exponent with p | γ3,2 = | 5.531 00
|
| Right p-value | p2 = | 0.012 000 0
|
| Degree assortativity | ρ = | −0.349 472
|
| Degree assortativity p-value | pρ = | 0.000 00
|
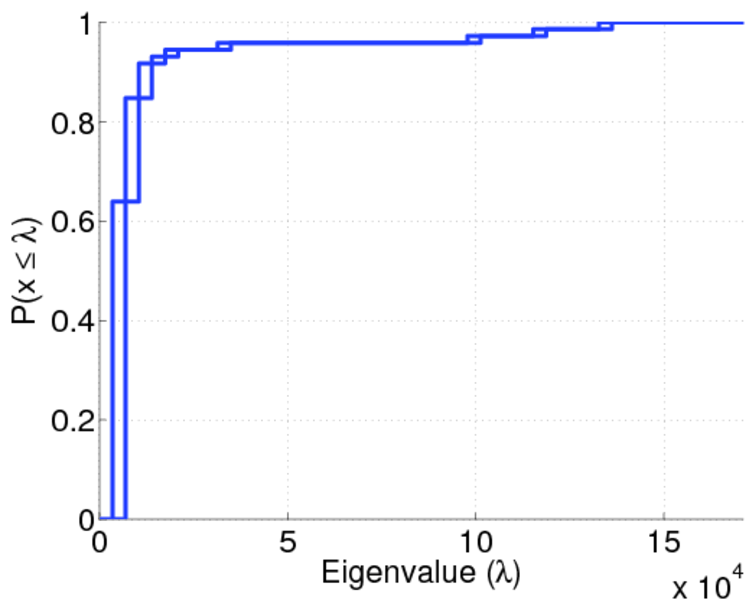
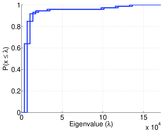
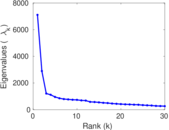
| Spectral norm | α = | 7,106.56
|
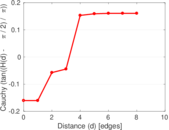
| Algebraic connectivity | a = | 0.082 783 7
|
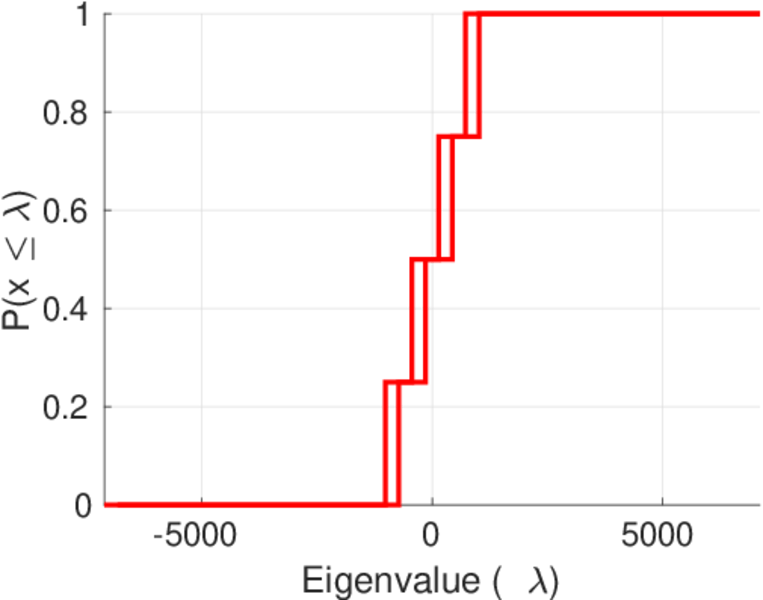
| Spectral separation | |λ1[A] / λ2[A]| = | 2.453 06
|
| Controllability | C = | 212,917
|
| Relative controllability | Cr = | 0.943 016
|
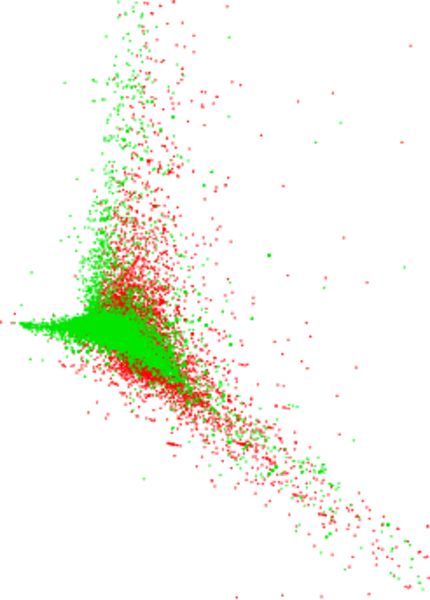
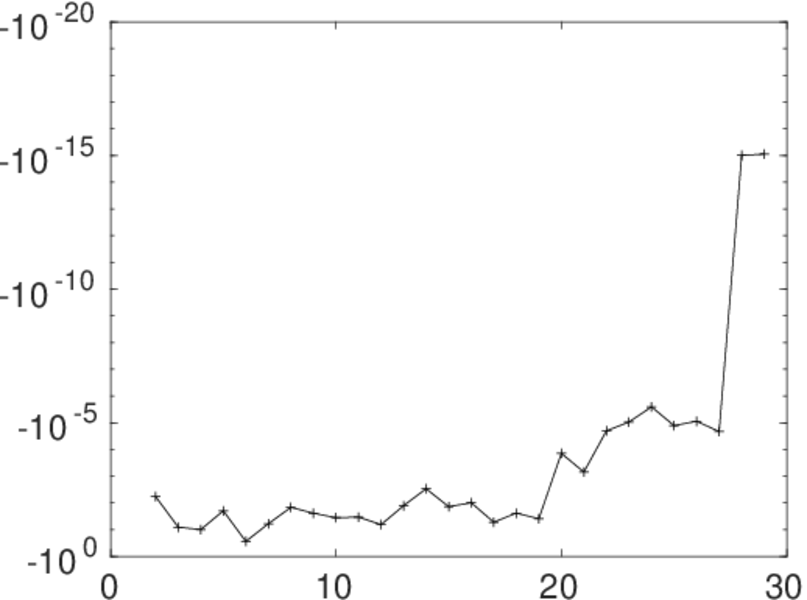
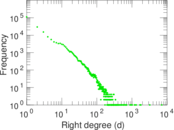
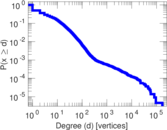
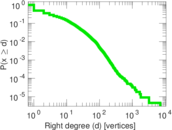
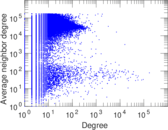
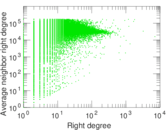
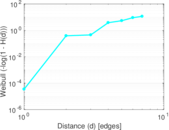
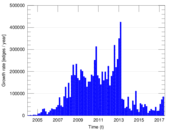
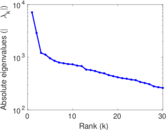
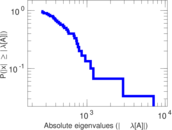
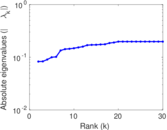
Plots


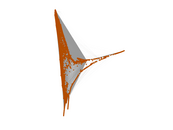


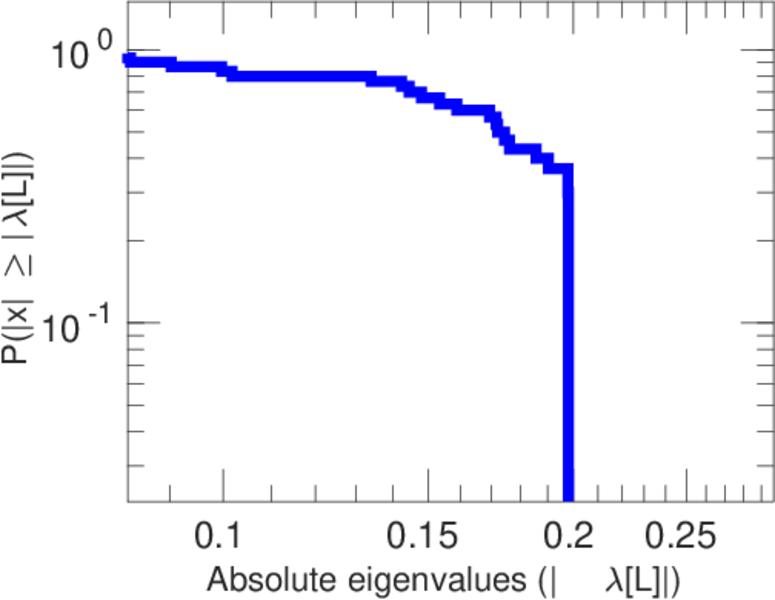
Matrix decompositions plots


Downloads
References
|
[1]
|
Jérôme Kunegis.
KONECT – The Koblenz Network Collection.
In Proc. Int. Conf. on World Wide Web Companion, pages
1343–1350, 2013.
[ http ]
|
|
[2]
|
Wikimedia Foundation.
Wikimedia downloads.
http://dumps.wikimedia.org/, January 2010.
|
 KONECT ‣ Networks ‣
Buy Me a Coffee
KONECT ‣ Networks ‣
Buy Me a Coffee