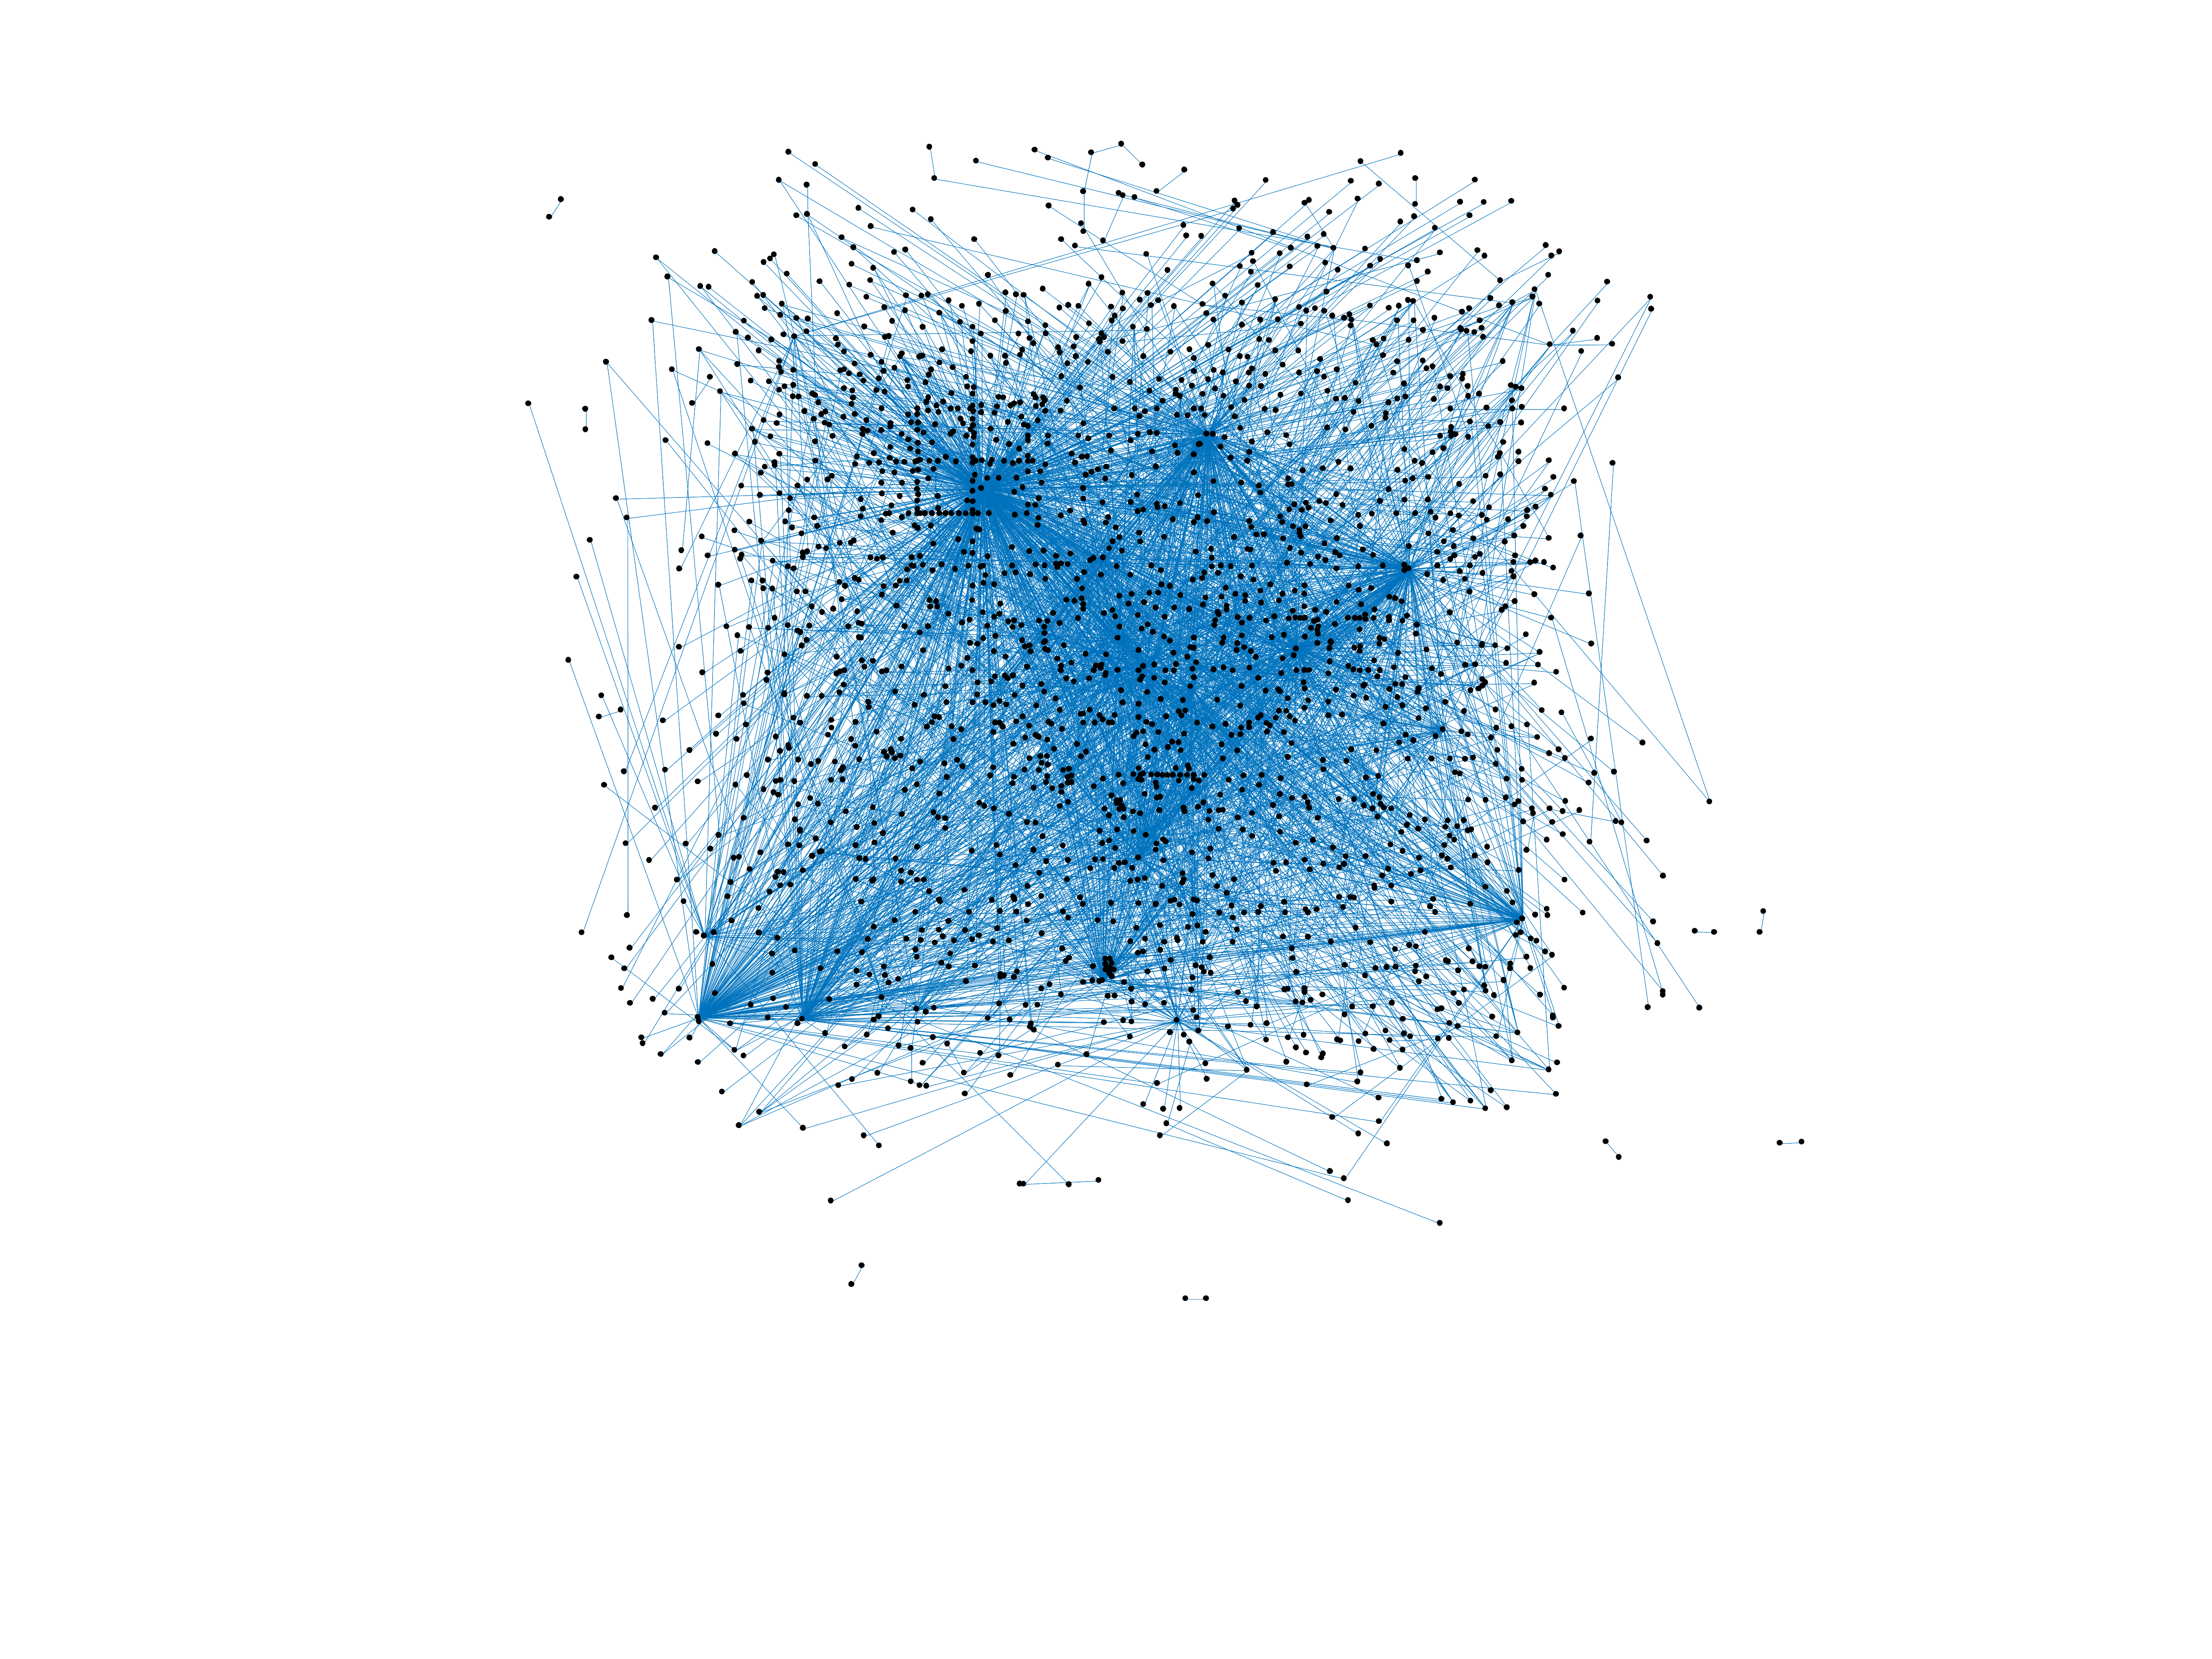
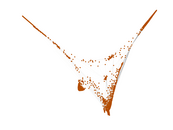
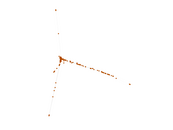
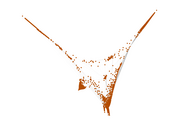
Wikibooks edits (tl)
This is the bipartite edit network of the Tagalog Wikibooks. It contains users
and pages from the Tagalog Wikibooks, connected by edit events. Each edge
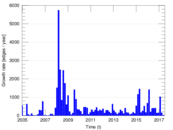
represents an edit. The dataset includes the timestamp of each edit.
Metadata
Statistics
| Size | n = | 2,341
|
| Left size | n1 = | 302
|
| Right size | n2 = | 2,039
|
| Volume | m = | 5,767
|
| Unique edge count | m̿ = | 3,224
|
| Wedge count | s = | 320,325
|
| Claw count | z = | 45,869,085
|
| Cross count | x = | 6,262,846,249
|
| Square count | q = | 27,487
|
| 4-Tour count | T4 = | 1,509,644
|
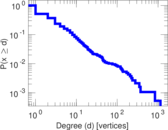
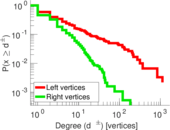
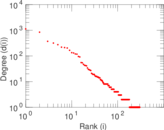
| Maximum degree | dmax = | 1,125
|
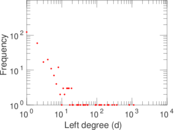
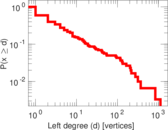
| Maximum left degree | d1max = | 1,125
|
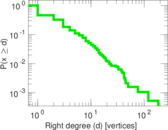
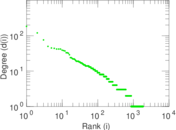
| Maximum right degree | d2max = | 184
|
| Average degree | d = | 4.926 95
|
| Average left degree | d1 = | 19.096 0
|
| Average right degree | d2 = | 2.828 35
|
| Fill | p = | 0.005 235 65
|
| Average edge multiplicity | m̃ = | 1.788 77
|
| Size of LCC | N = | 1,951
|
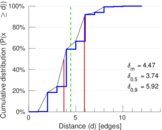
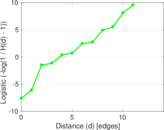
| Diameter | δ = | 14
|
| 50-Percentile effective diameter | δ0.5 = | 3.740 12
|
| 90-Percentile effective diameter | δ0.9 = | 5.918 83
|
| Median distance | δM = | 4
|
| Mean distance | δm = | 4.467 41
|
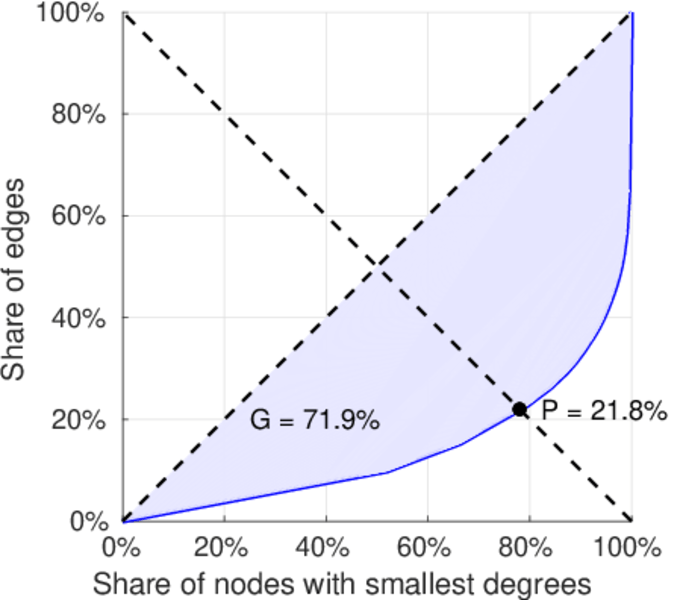
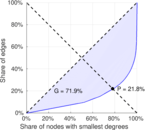
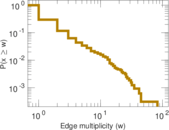
| Gini coefficient | G = | 0.737 002
|
| Balanced inequality ratio | P = | 0.208 167
|
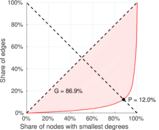
| Left balanced inequality ratio | P1 = | 0.119 993
|
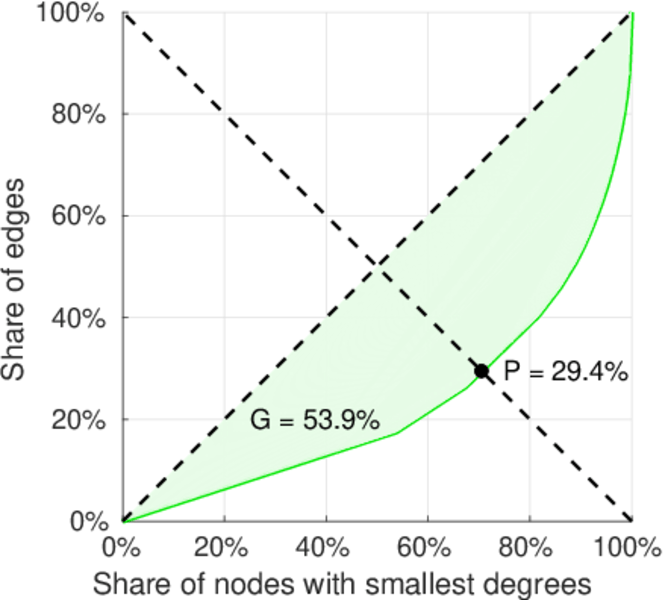
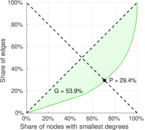
| Right balanced inequality ratio | P2 = | 0.293 567
|
| Relative edge distribution entropy | Her = | 0.809 101
|
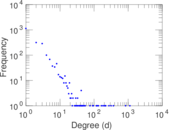
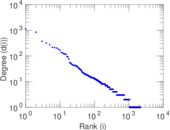
| Power law exponent | γ = | 3.432 90
|
| Tail power law exponent | γt = | 2.511 00
|
| Tail power law exponent with p | γ3 = | 2.511 00
|
| p-value | p = | 0.000 00
|
| Left tail power law exponent with p | γ3,1 = | 1.751 00
|
| Left p-value | p1 = | 0.753 000
|
| Right tail power law exponent with p | γ3,2 = | 2.961 00
|
| Right p-value | p2 = | 0.061 000 0
|
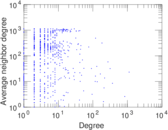
| Degree assortativity | ρ = | −0.268 462
|
| Degree assortativity p-value | pρ = | 2.413 65 × 10−54
|
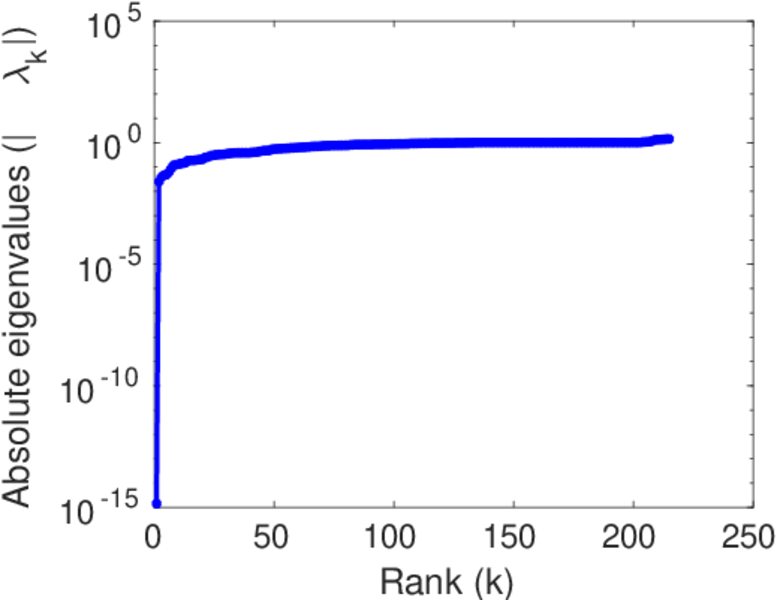
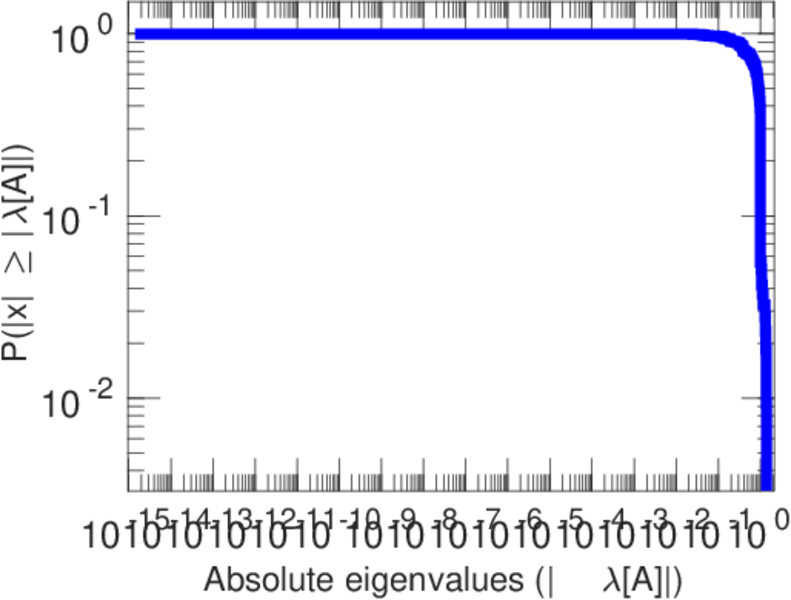
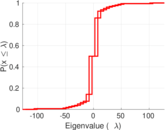
| Spectral norm | α = | 127.356
|
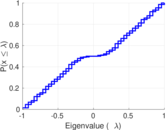
| Algebraic connectivity | a = | 0.024 568 8
|
| Spectral separation | |λ1[A] / λ2[A]| = | 1.414 24
|
| Controllability | C = | 1,628
|
| Relative controllability | Cr = | 0.746 789
|
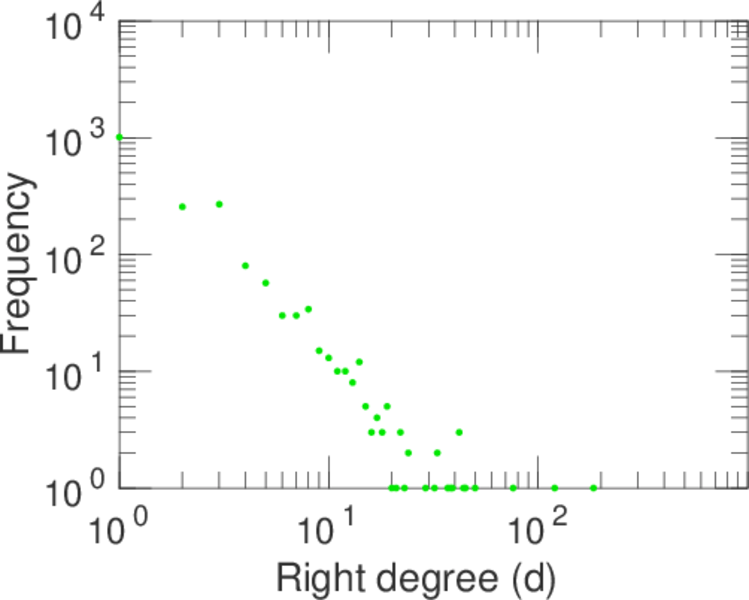
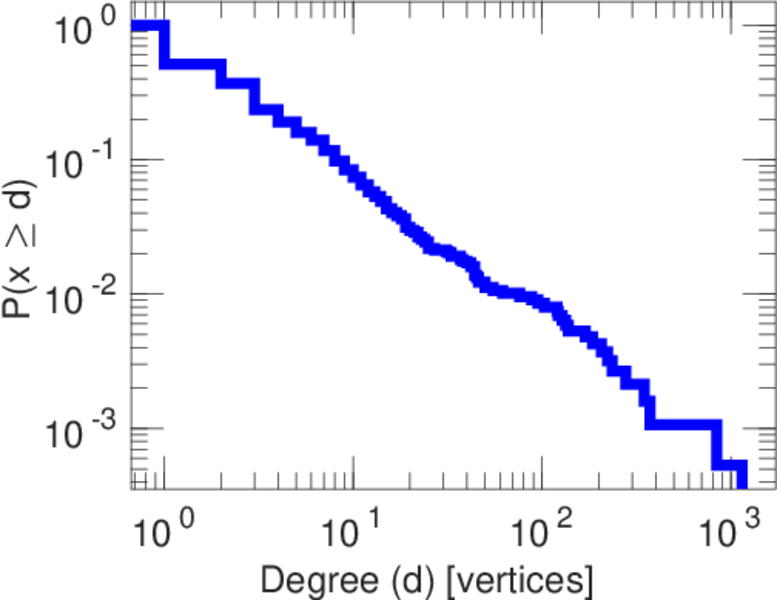
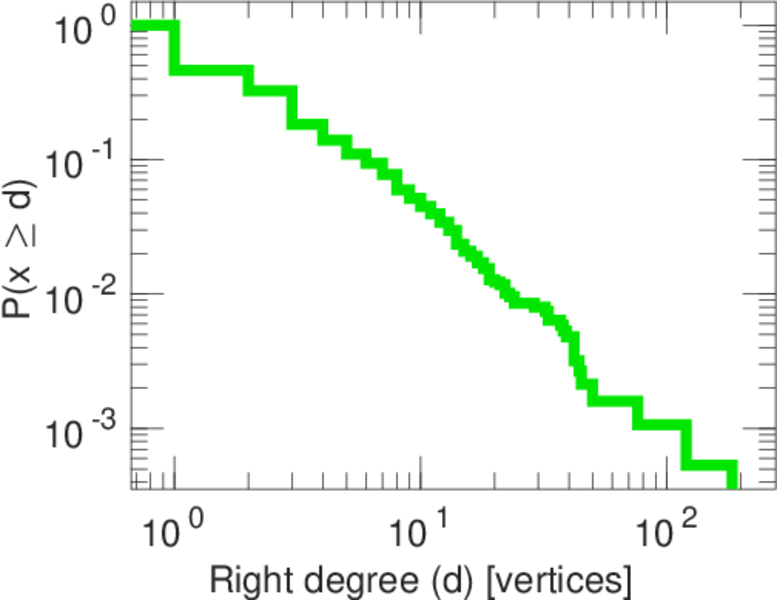
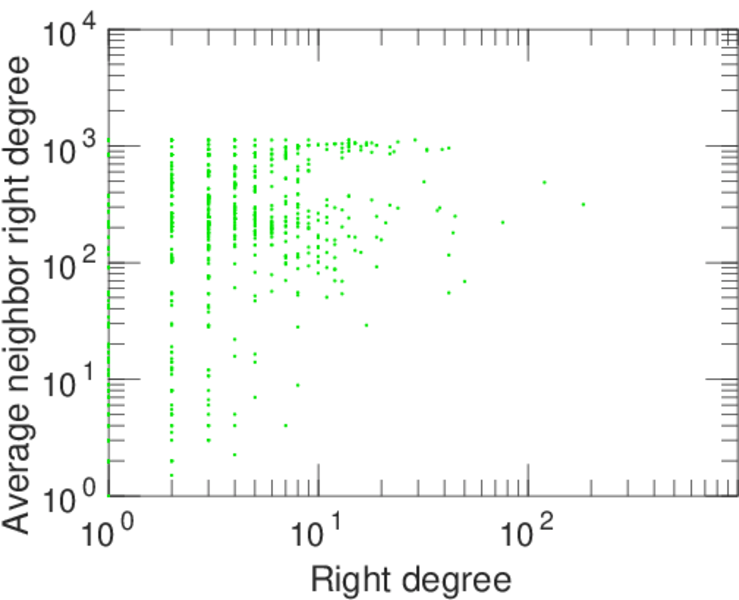
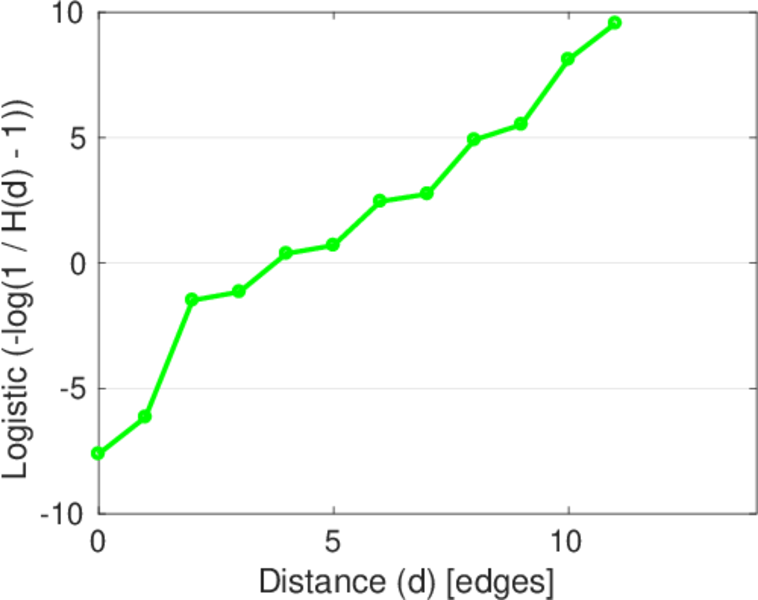
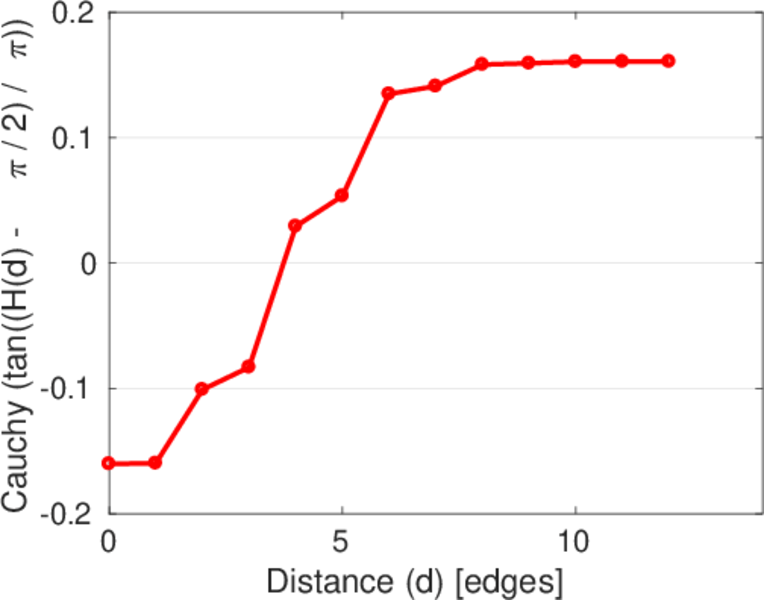
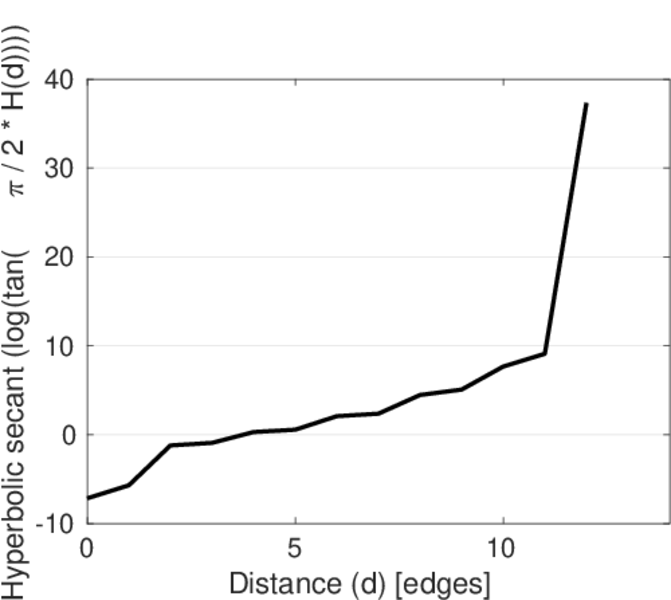
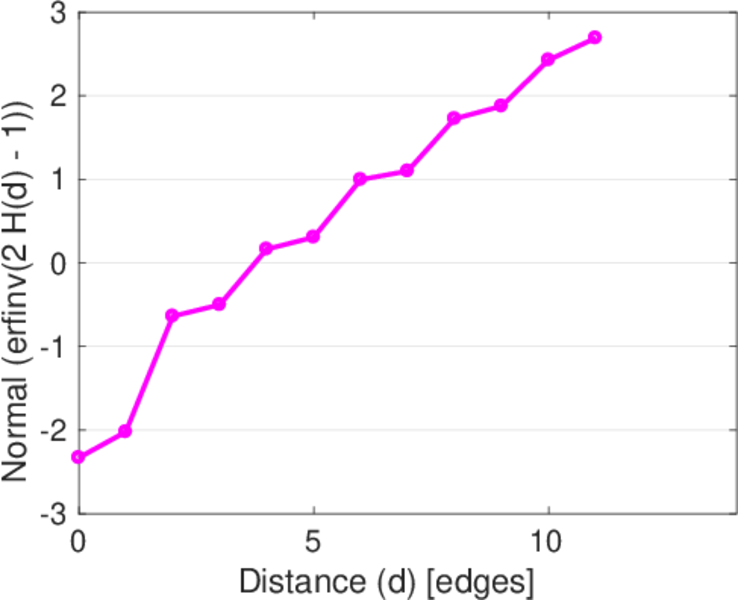
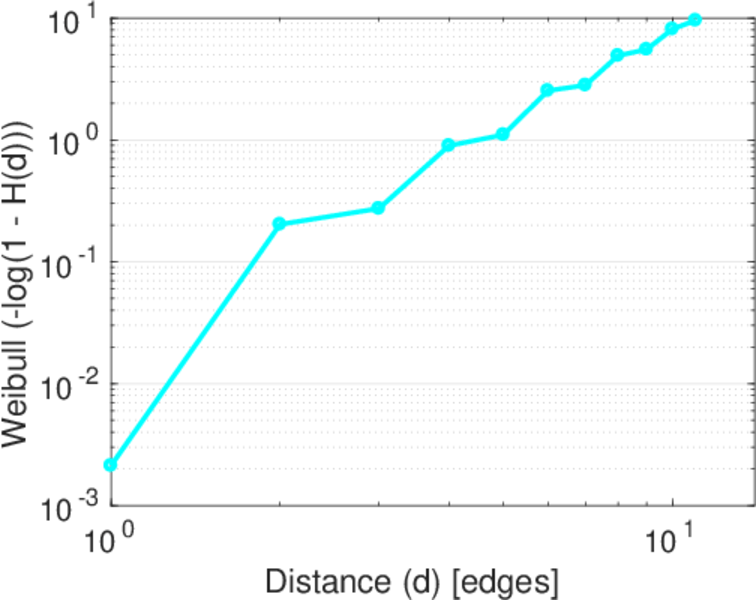
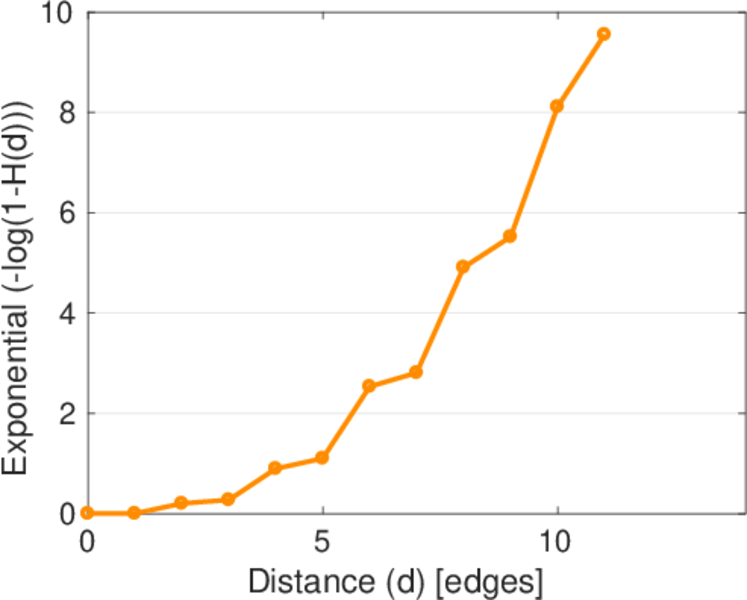
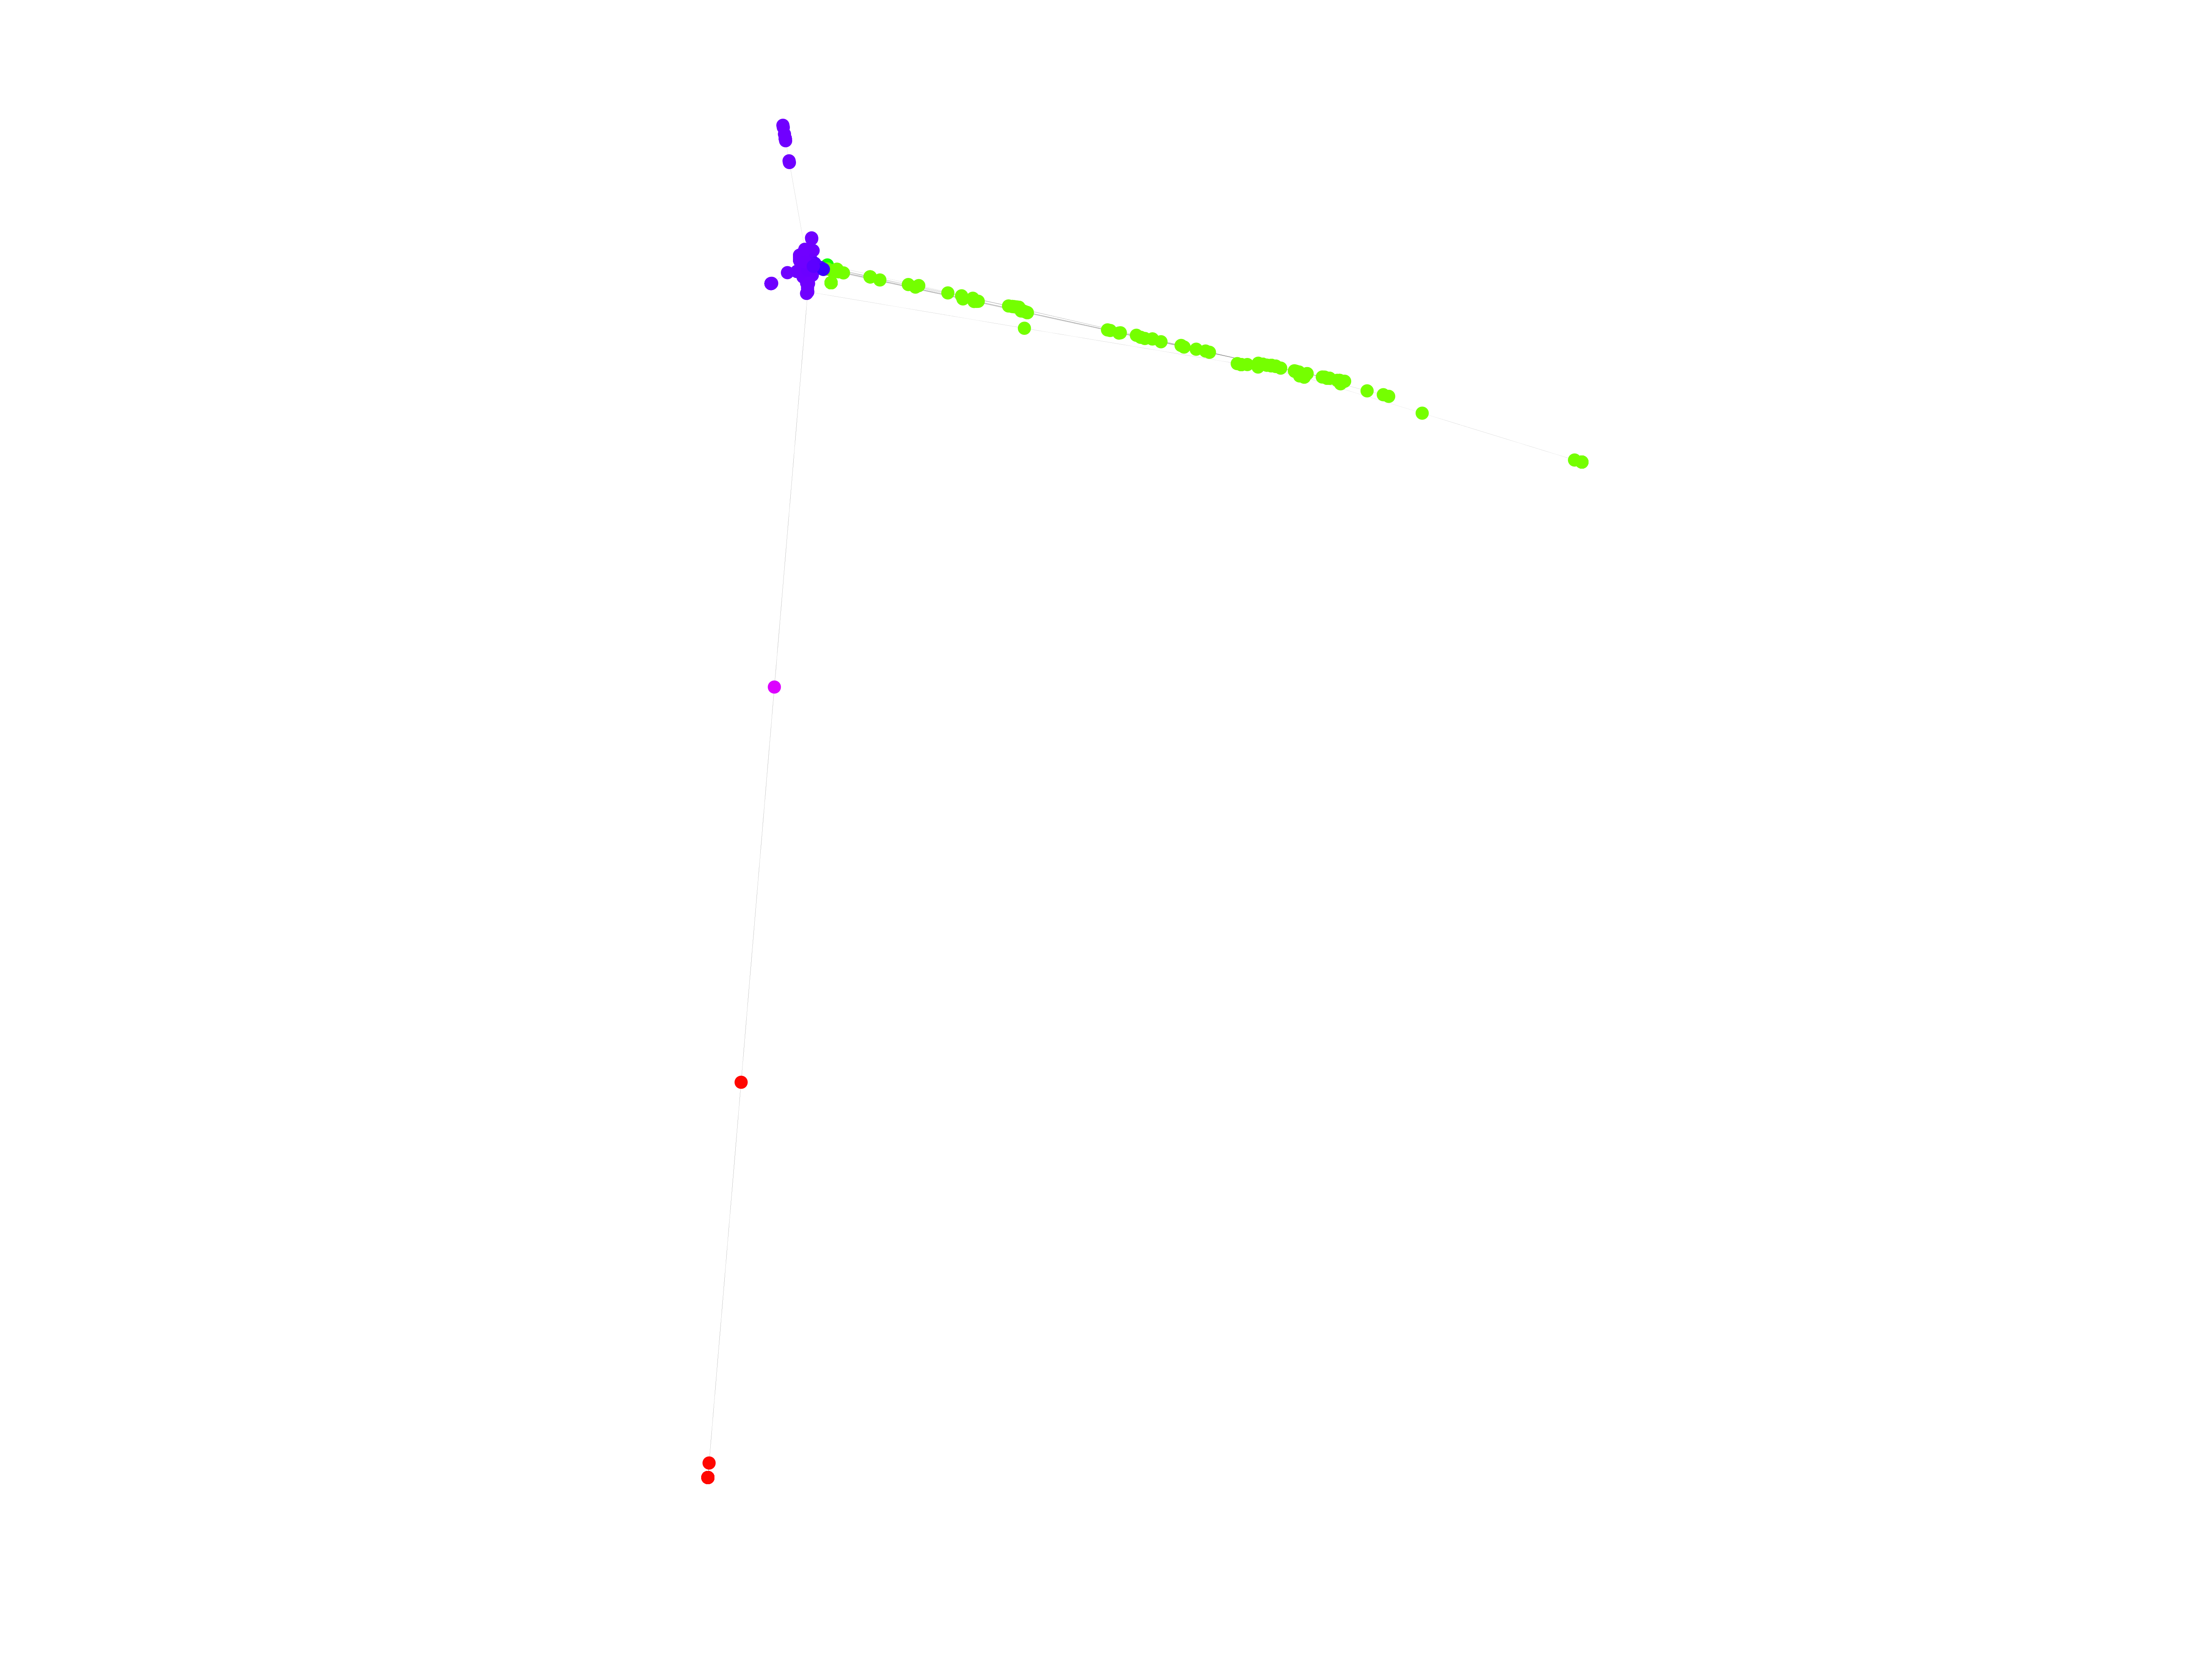
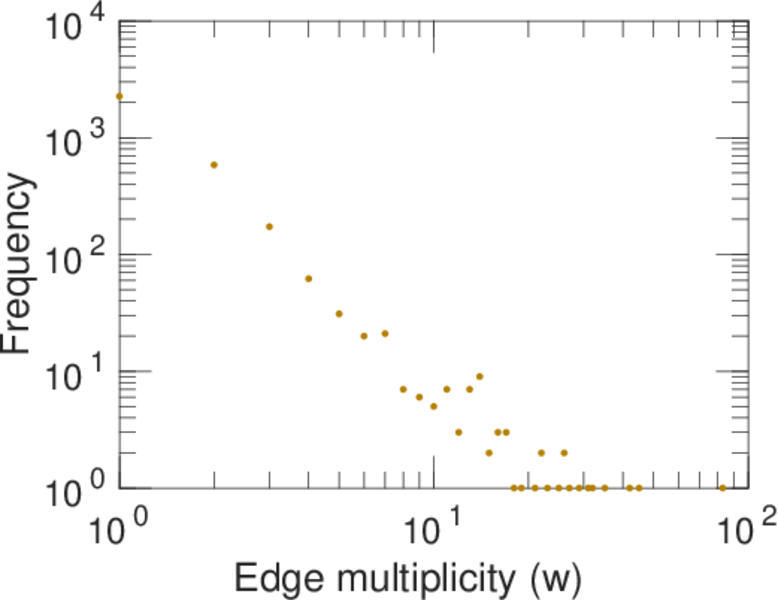
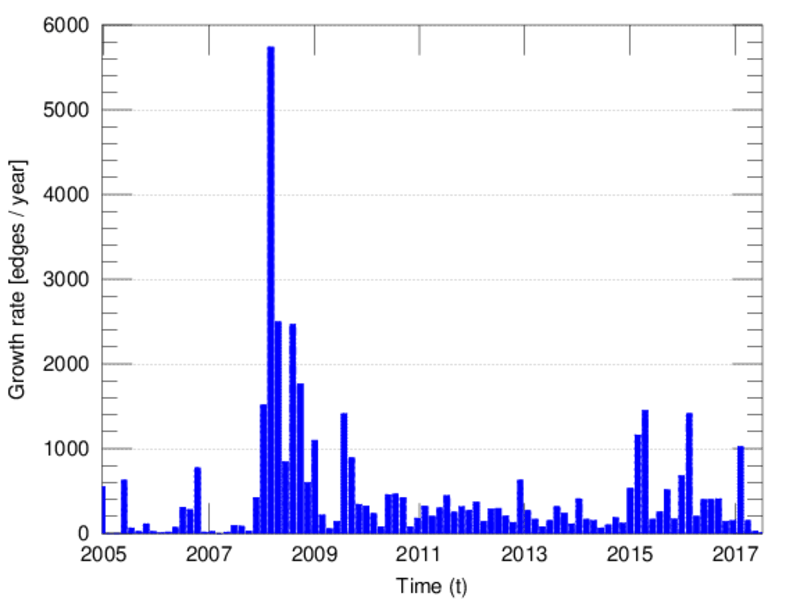
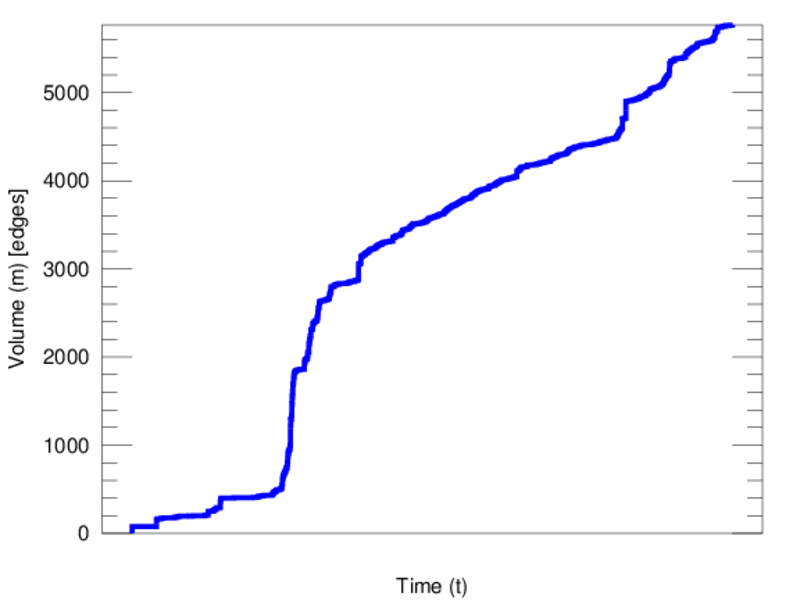
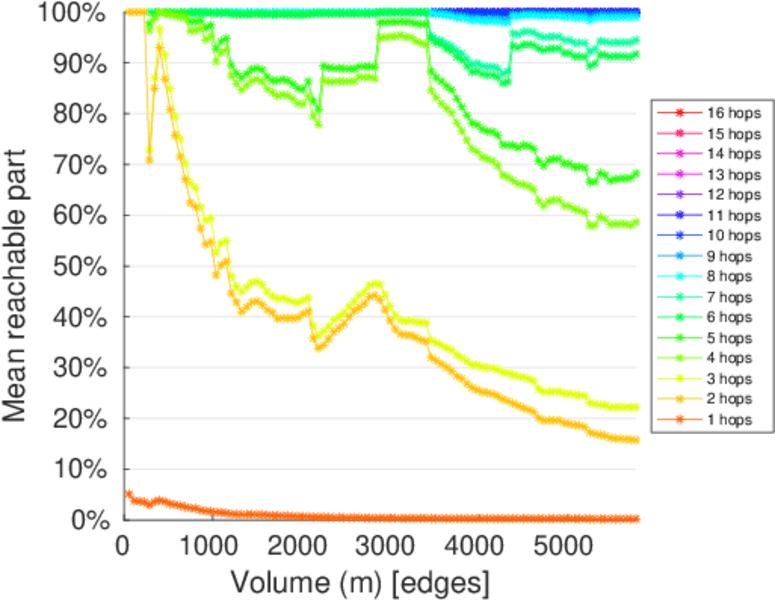
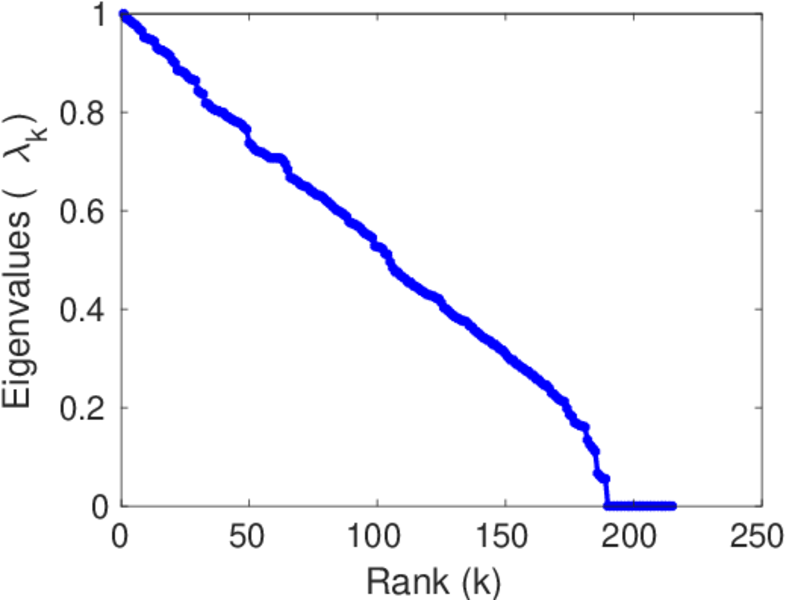
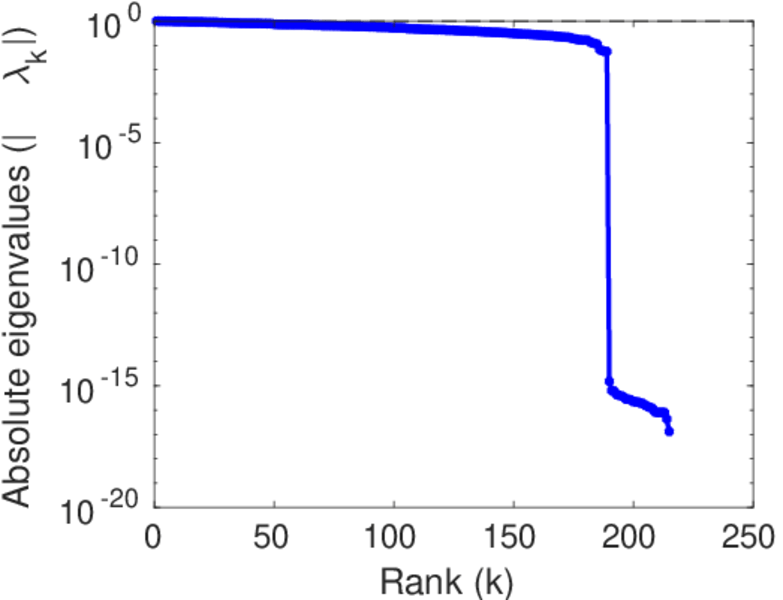
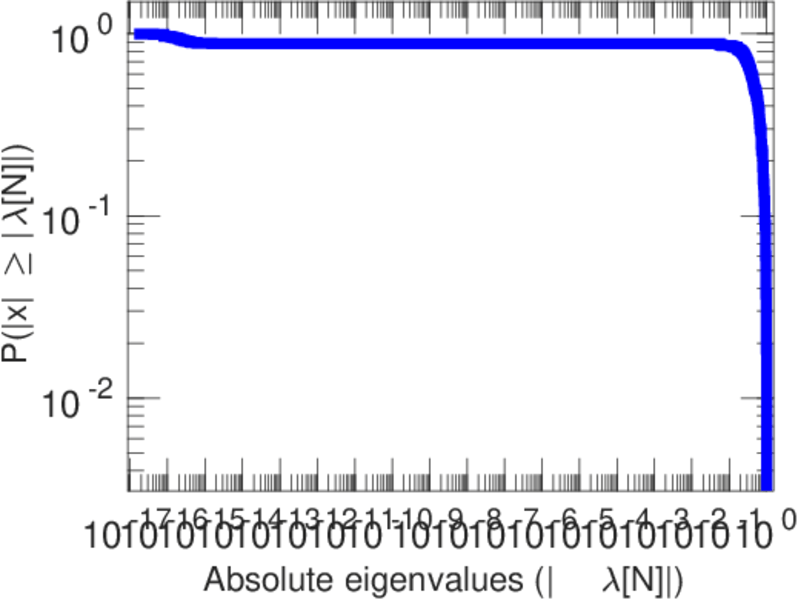
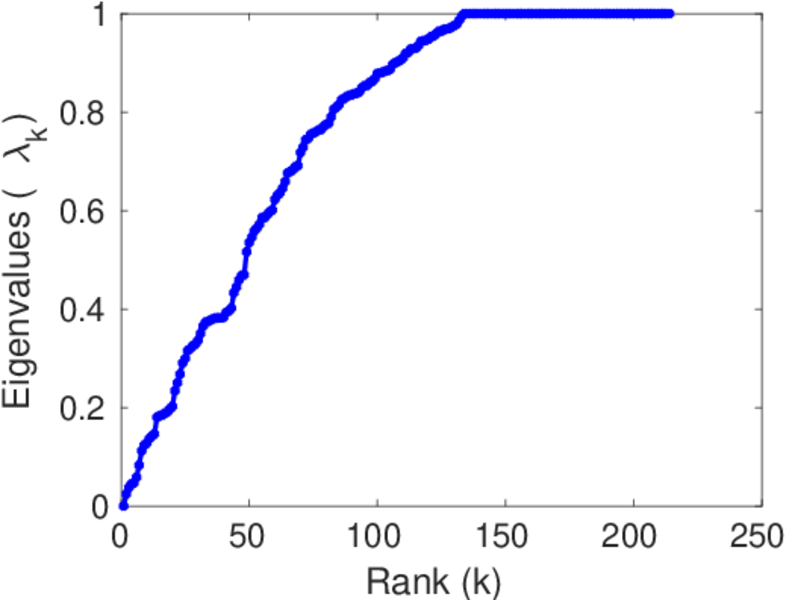
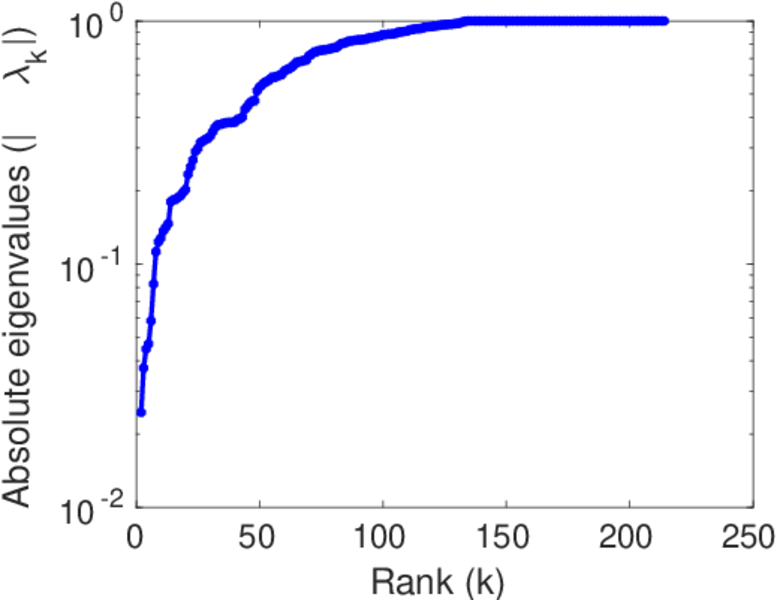
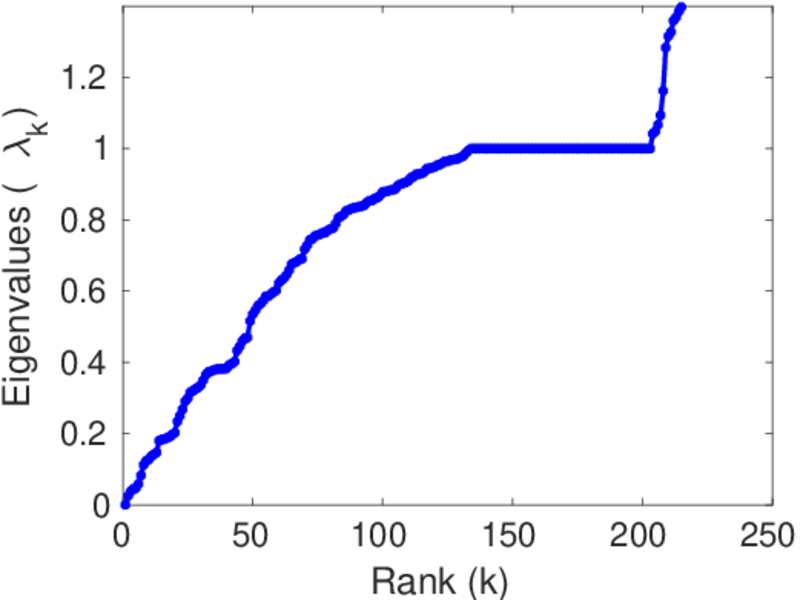
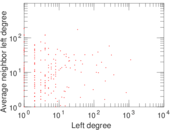
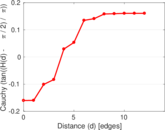
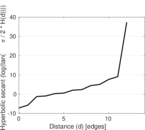
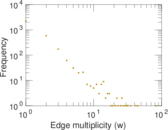
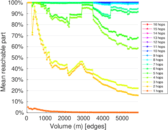
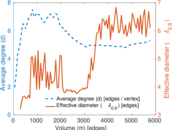
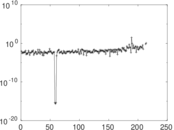
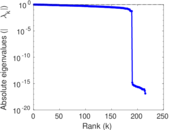
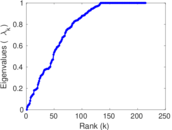
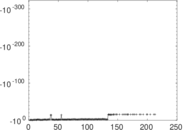
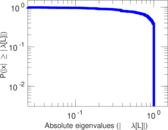
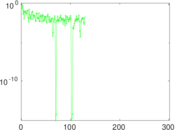
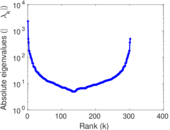
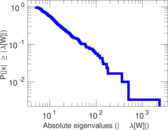
Plots


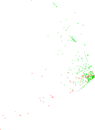
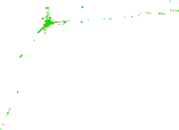


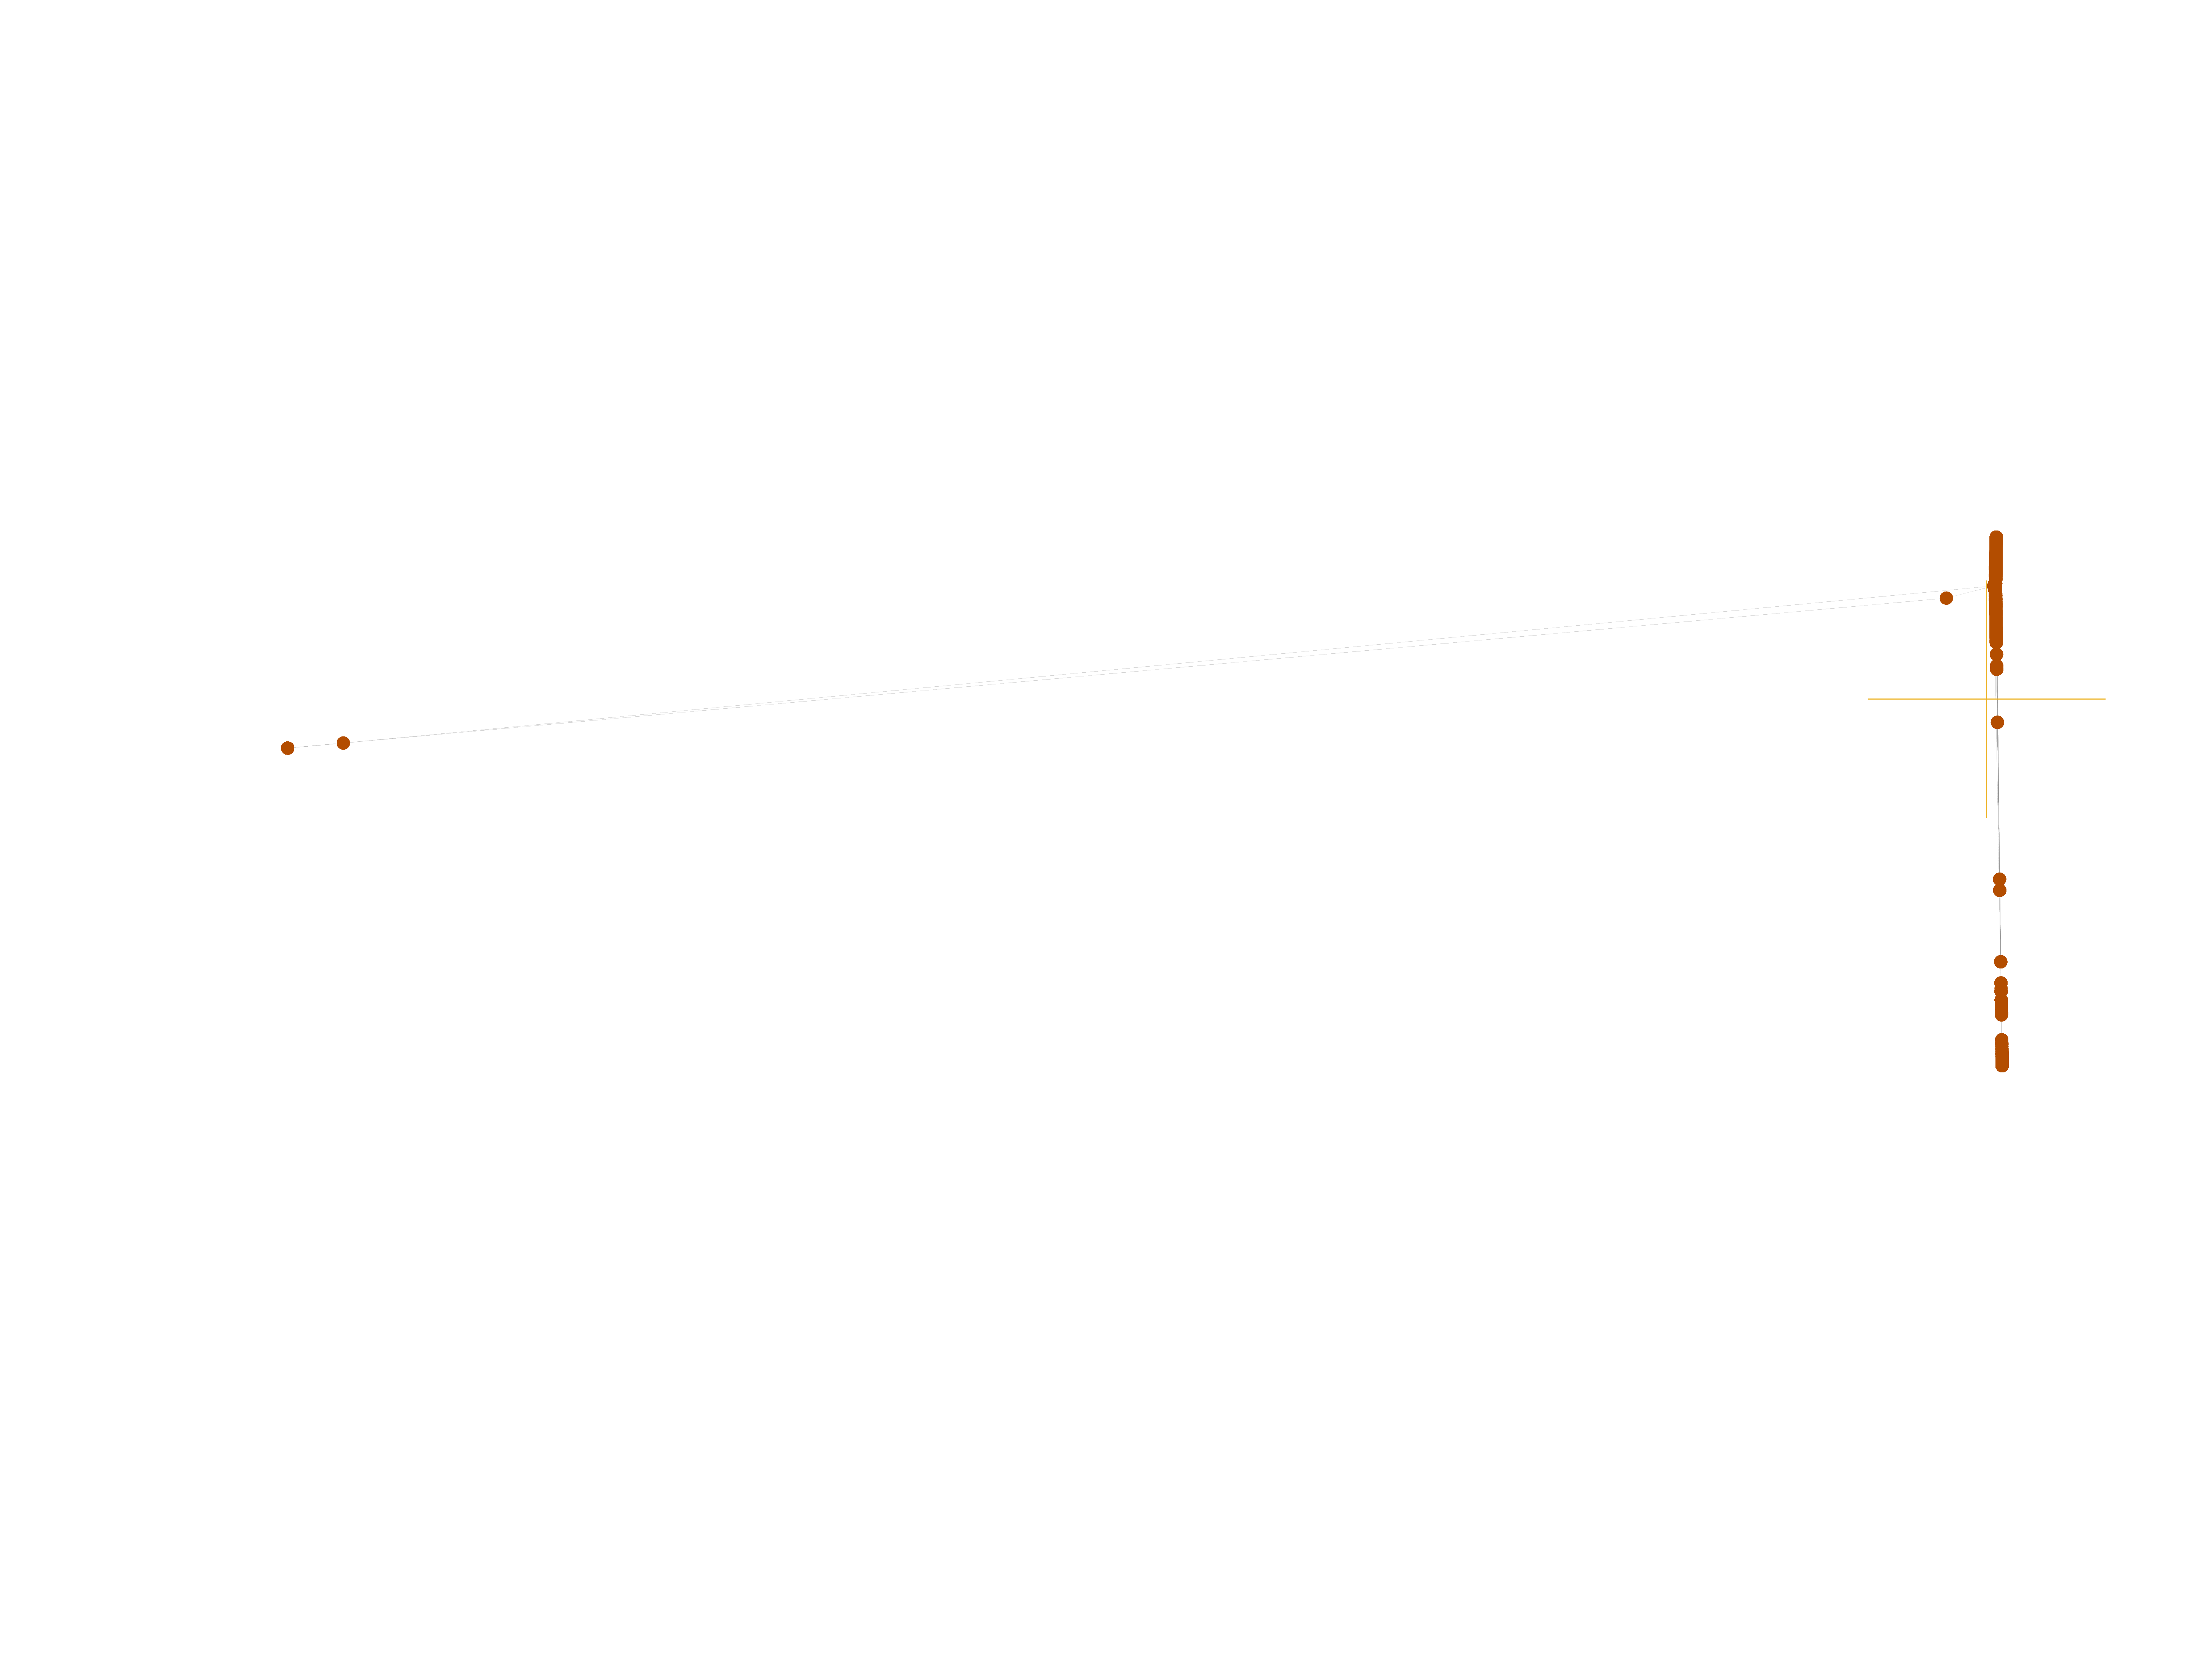
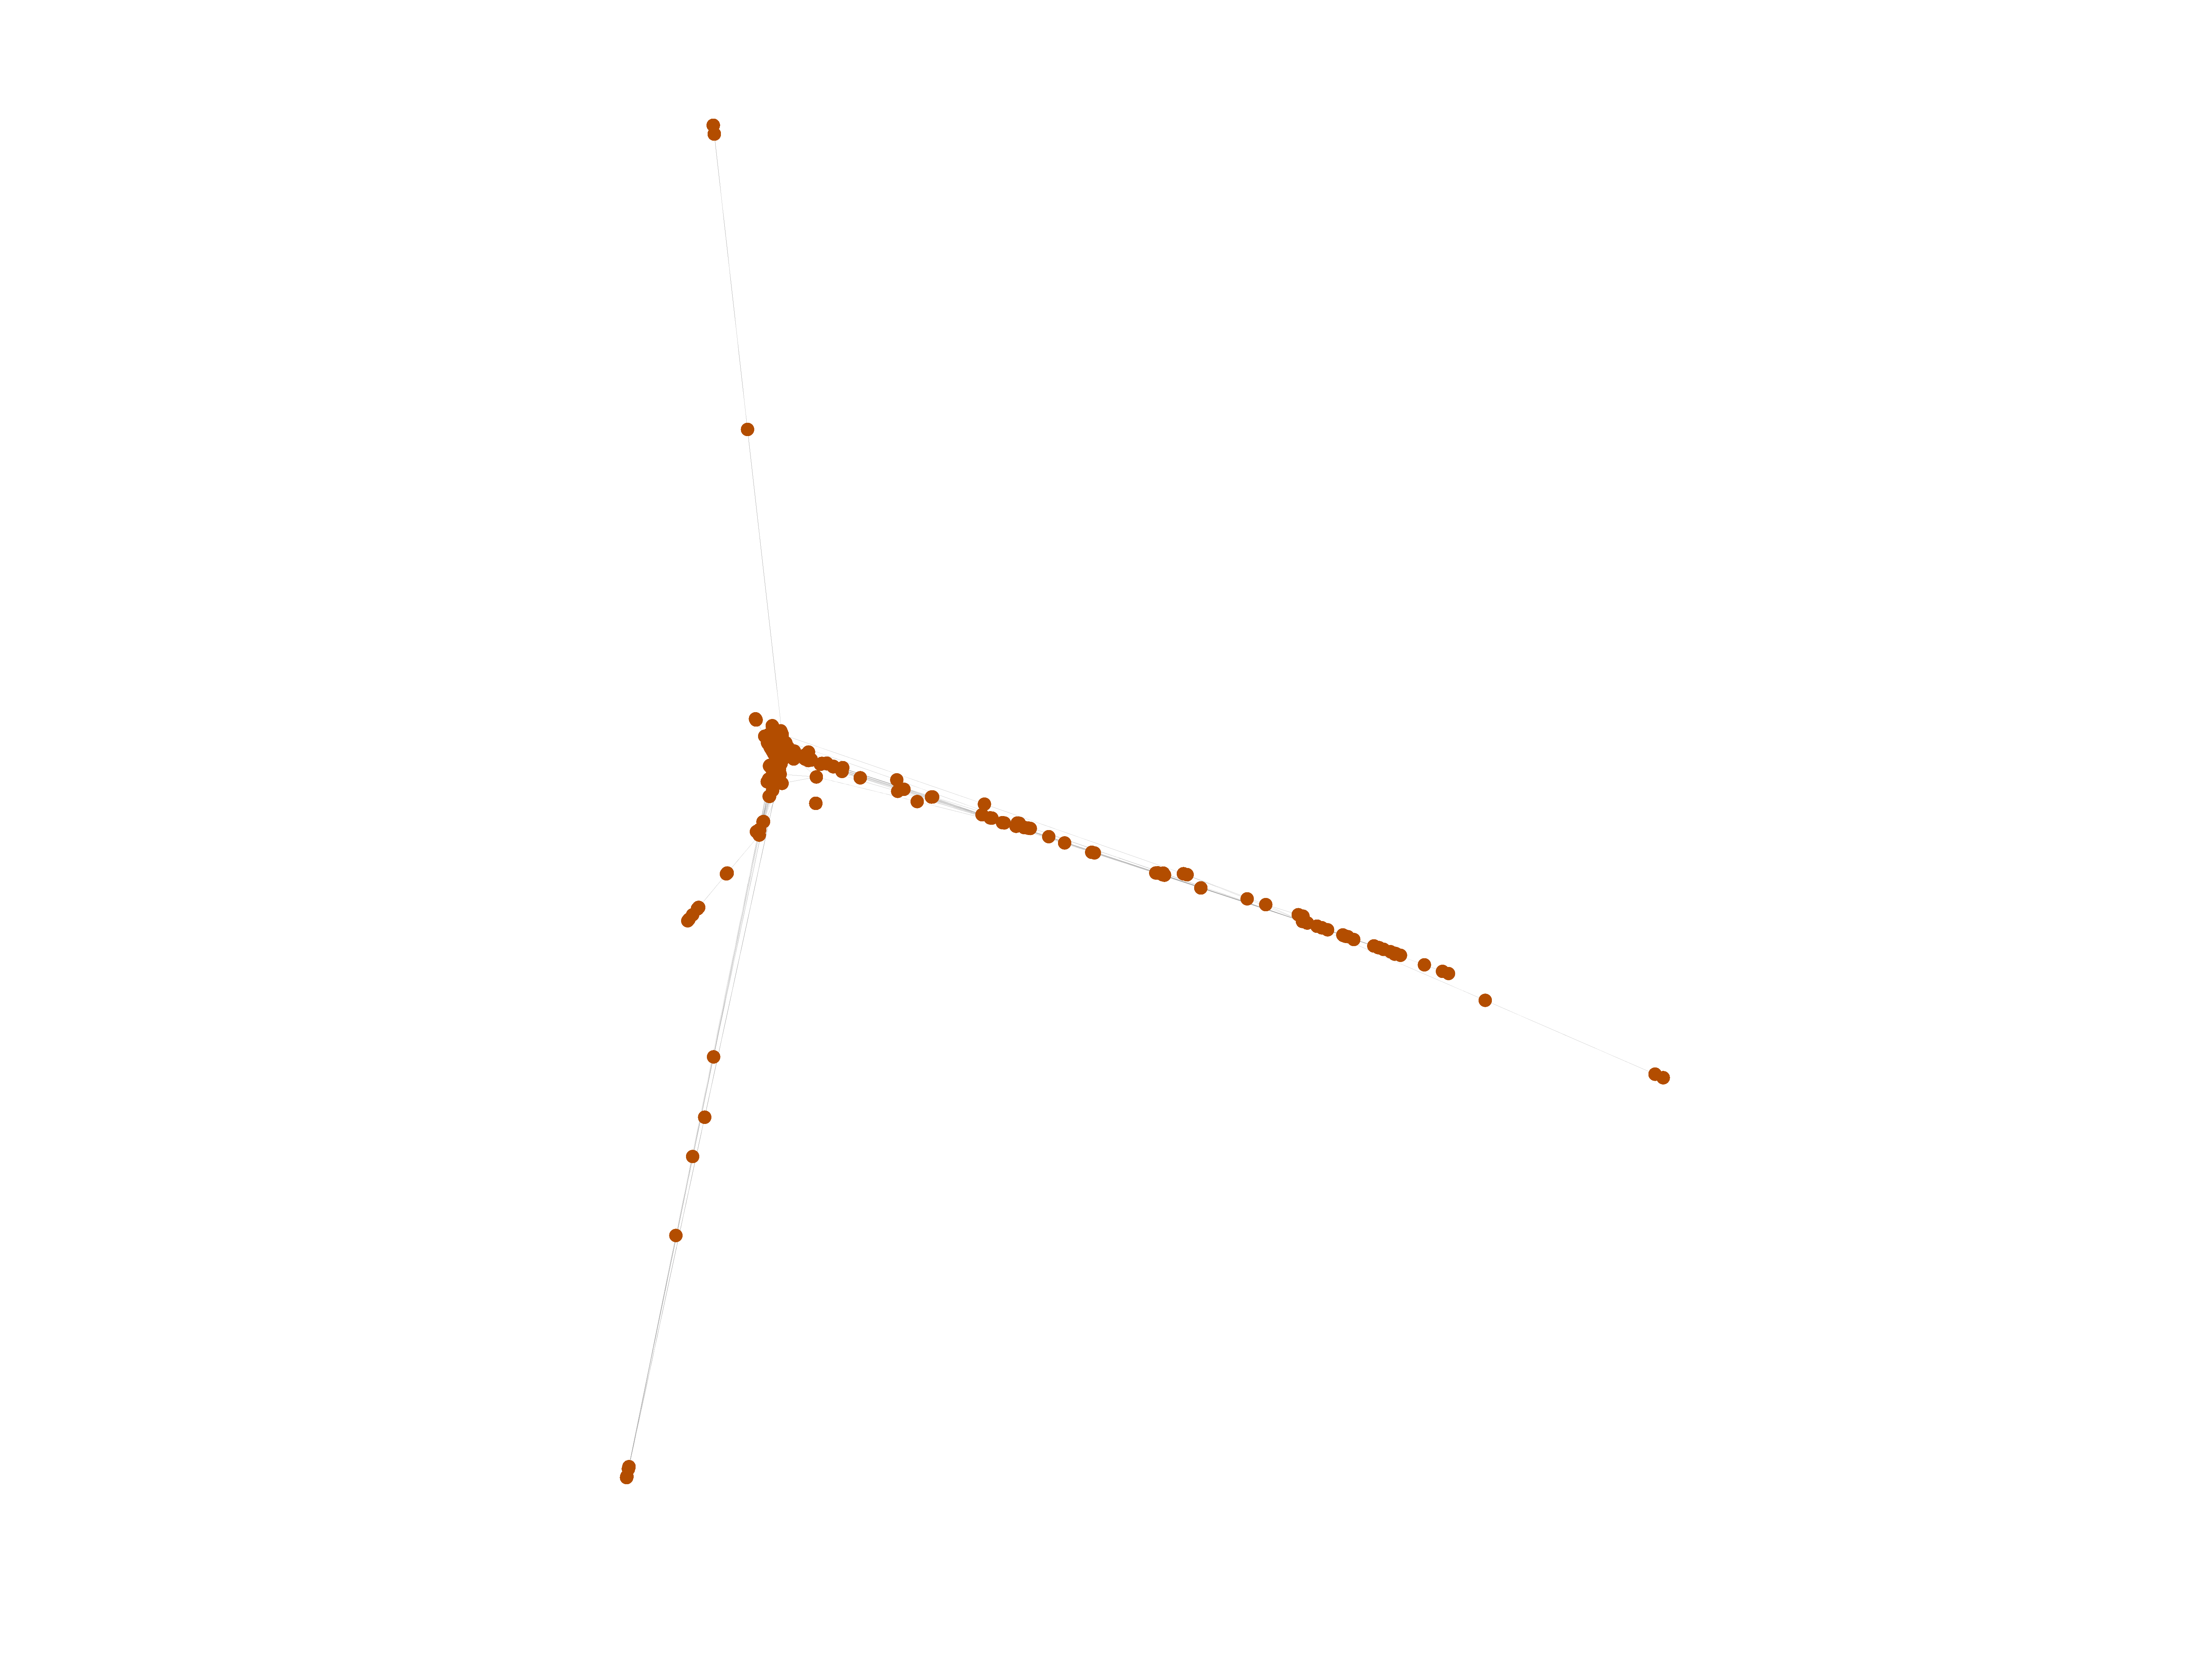
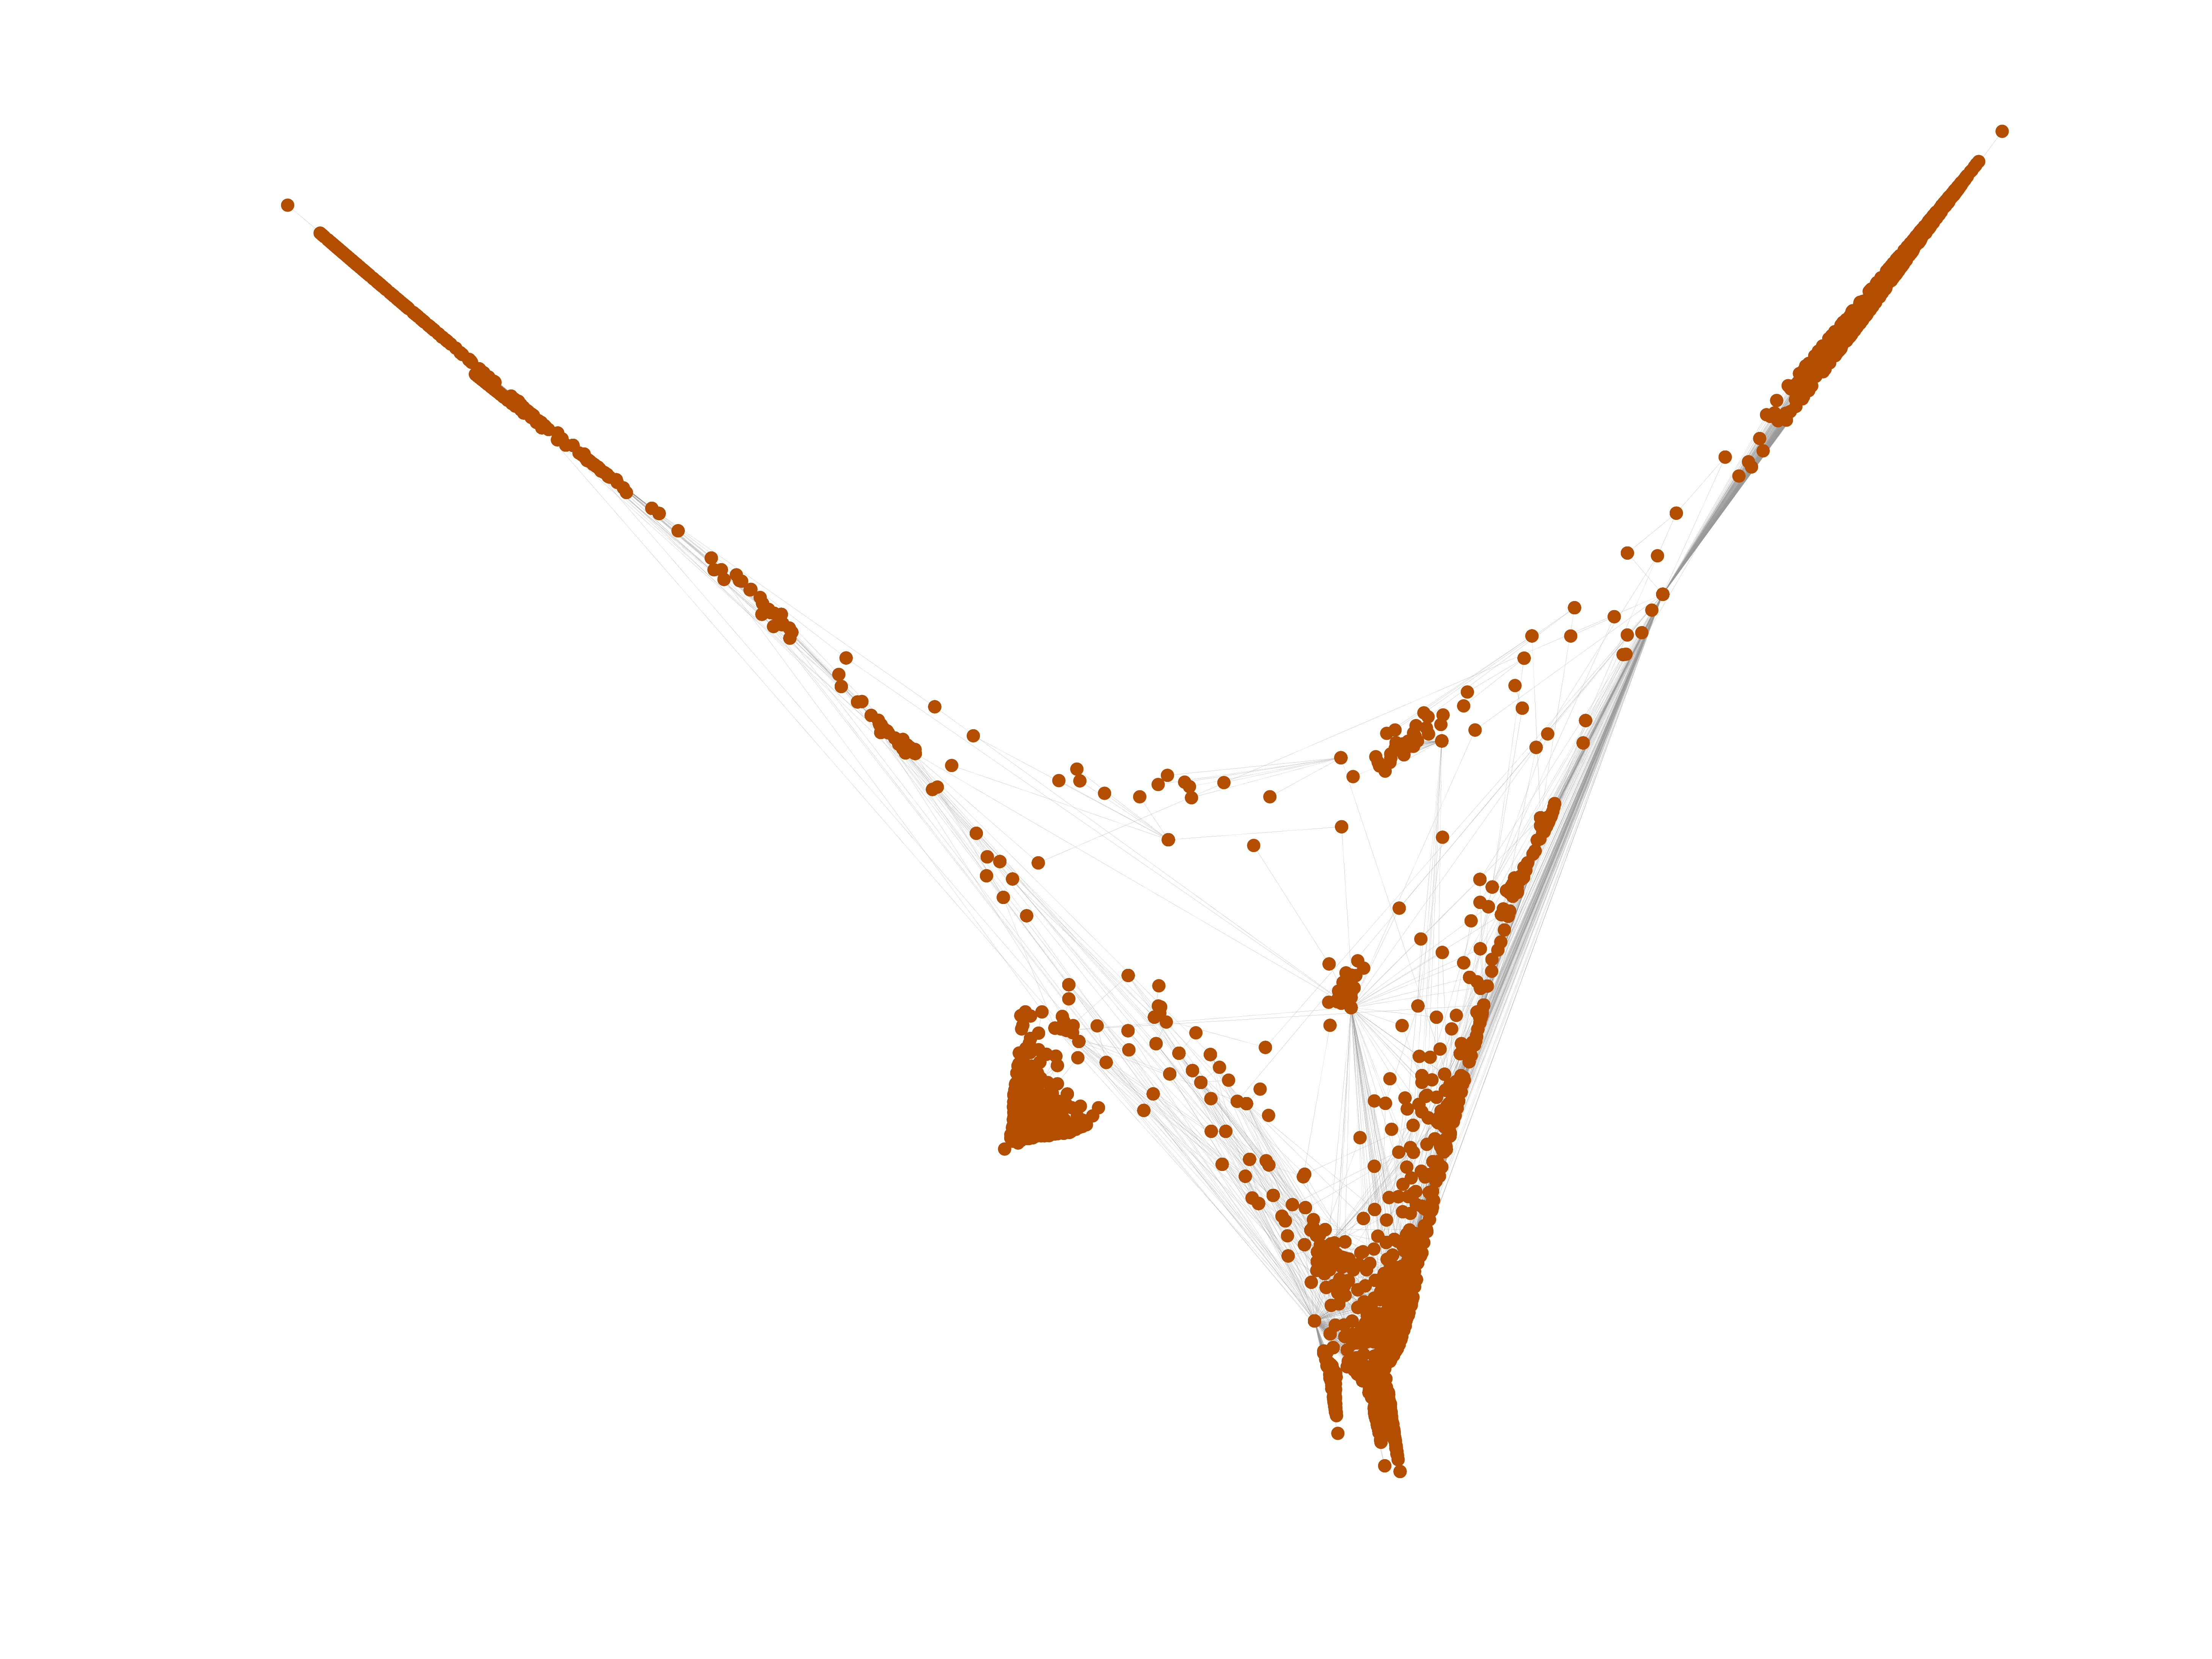
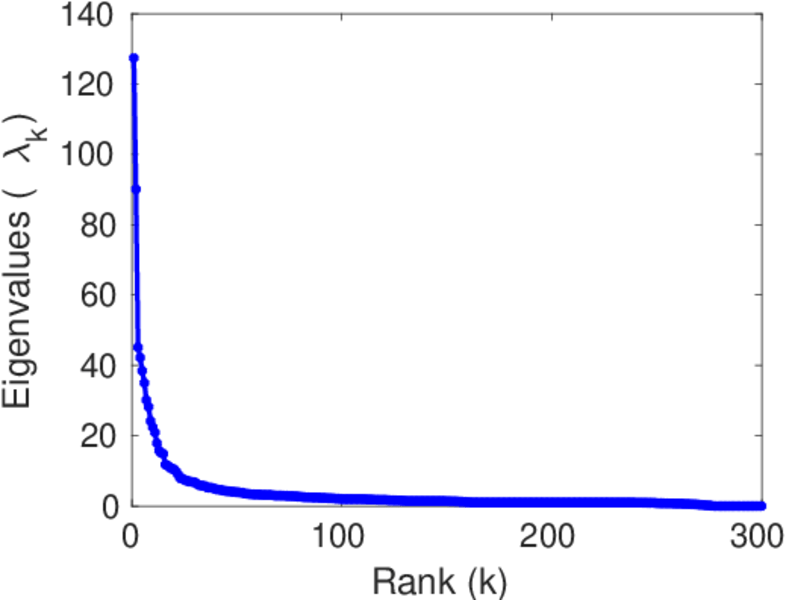
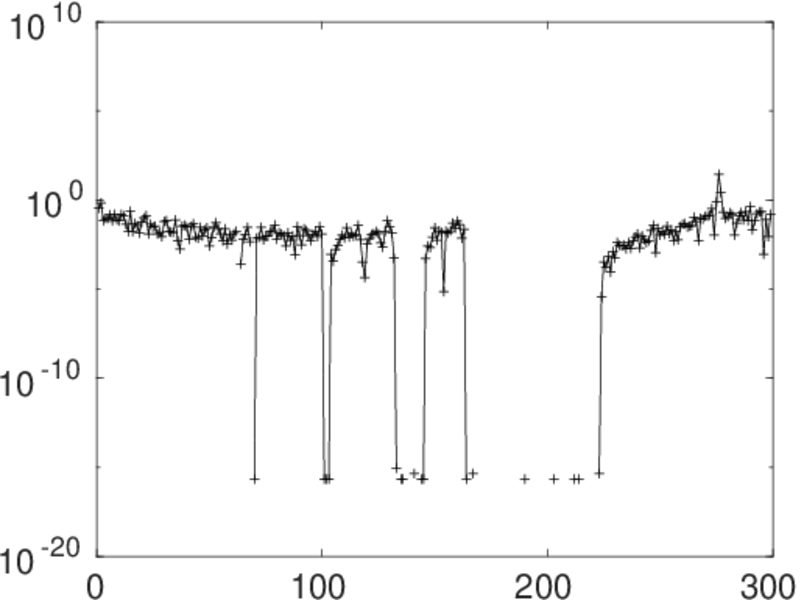
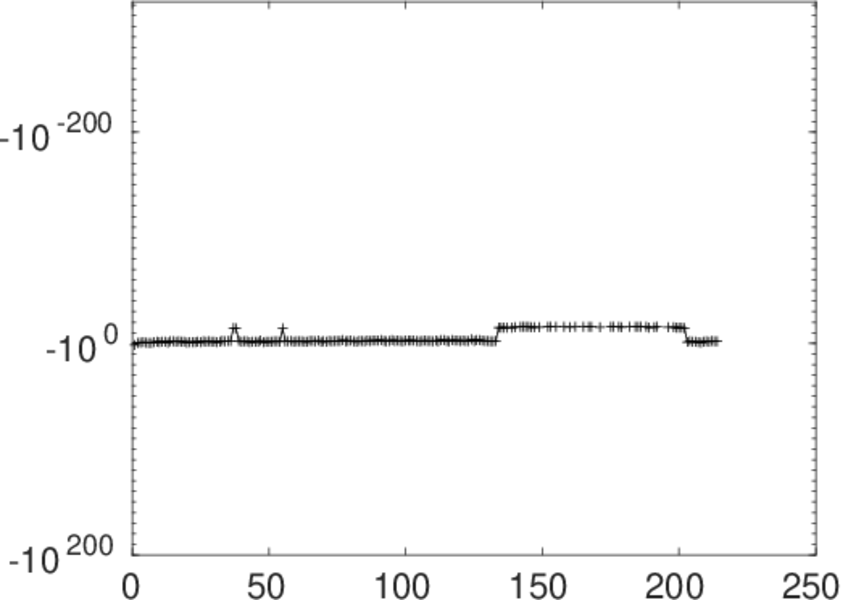
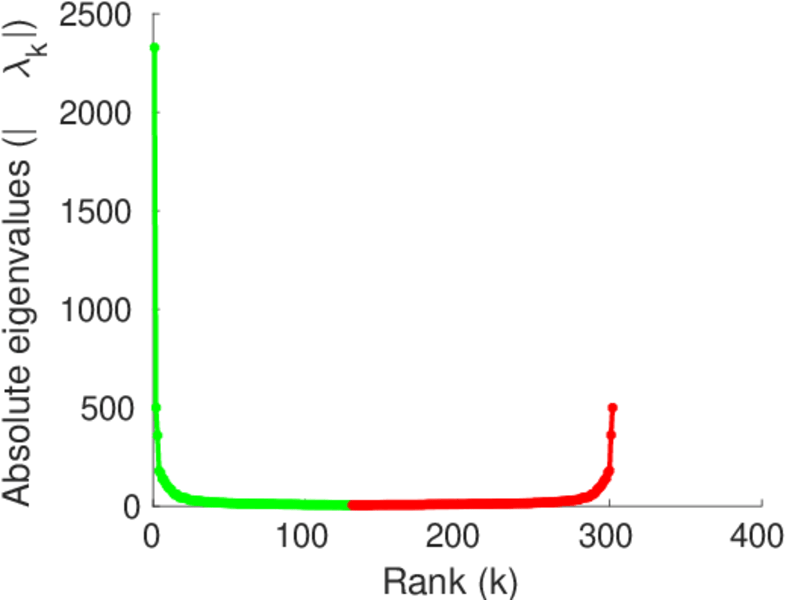
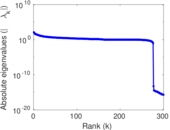
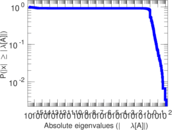
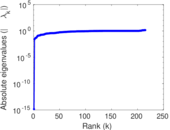
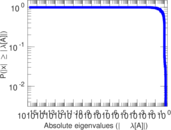
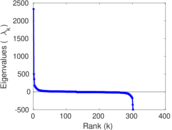
Matrix decompositions plots


Downloads
References
|
[1]
|
Jérôme Kunegis.
KONECT – The Koblenz Network Collection.
In Proc. Int. Conf. on World Wide Web Companion, pages
1343–1350, 2013.
[ http ]
|
|
[2]
|
Wikimedia Foundation.
Wikimedia downloads.
http://dumps.wikimedia.org/, January 2010.
|
 KONECT ‣ Networks ‣
Buy Me a Coffee
KONECT ‣ Networks ‣
Buy Me a Coffee