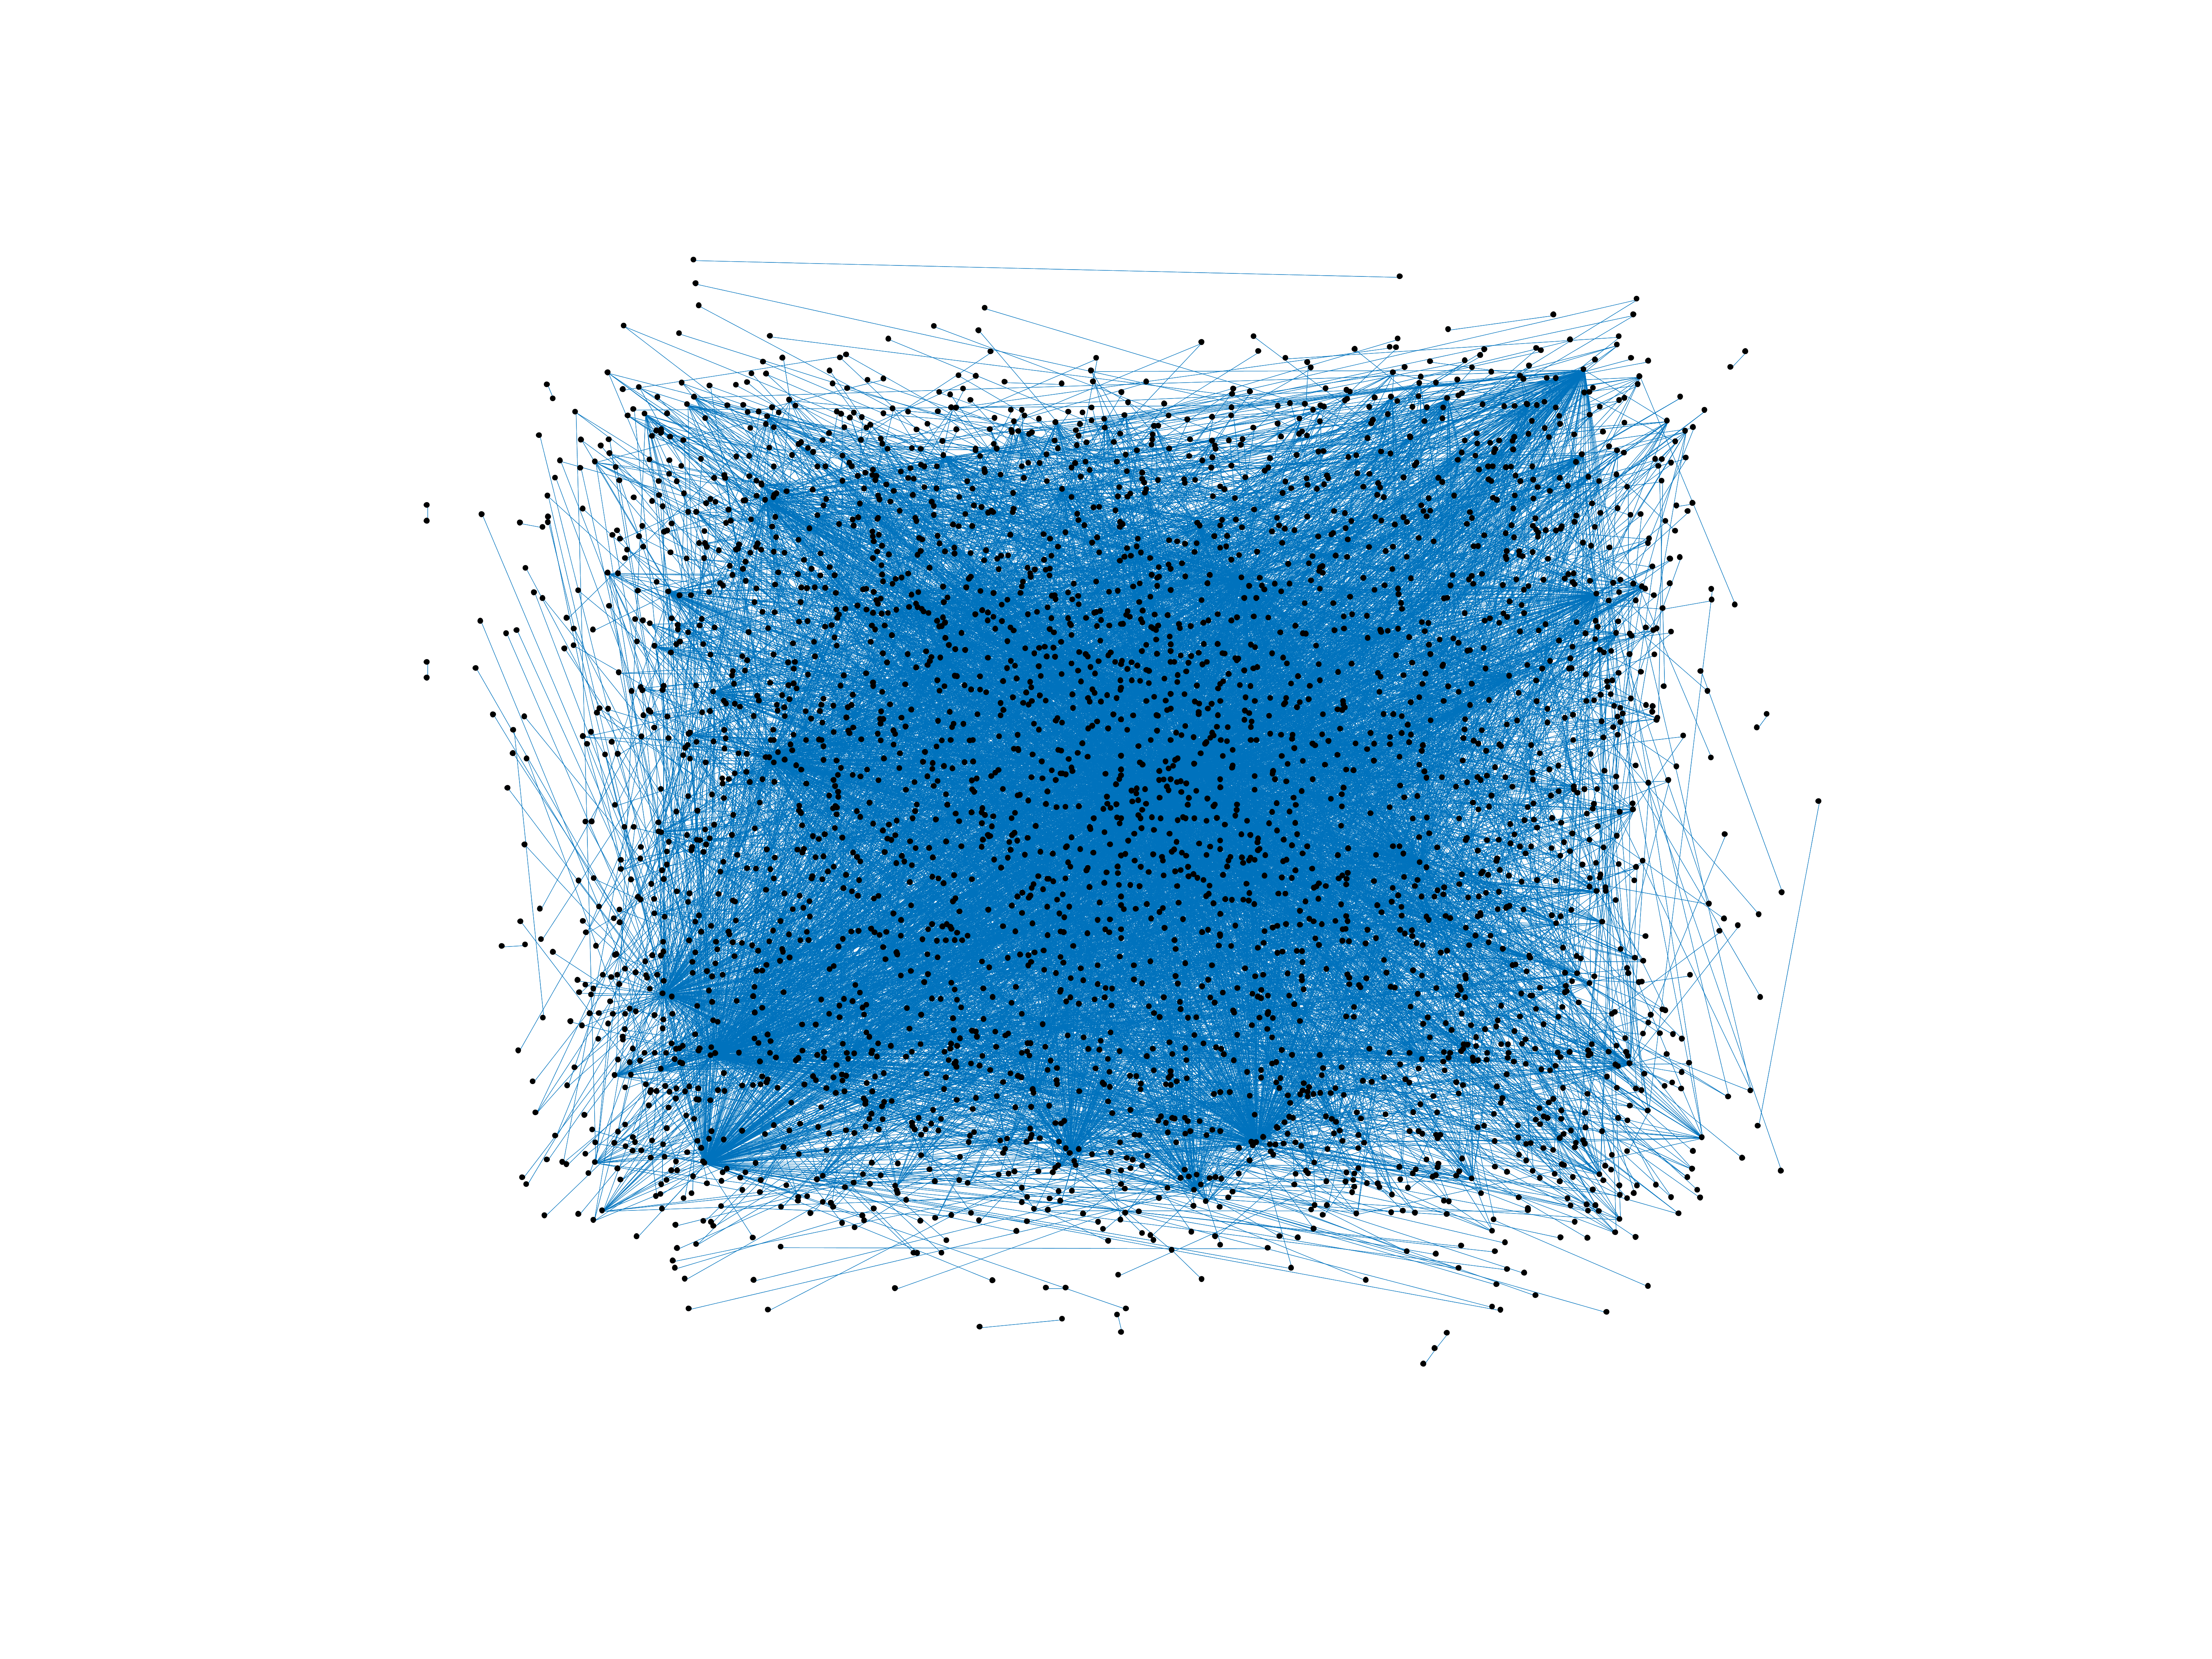
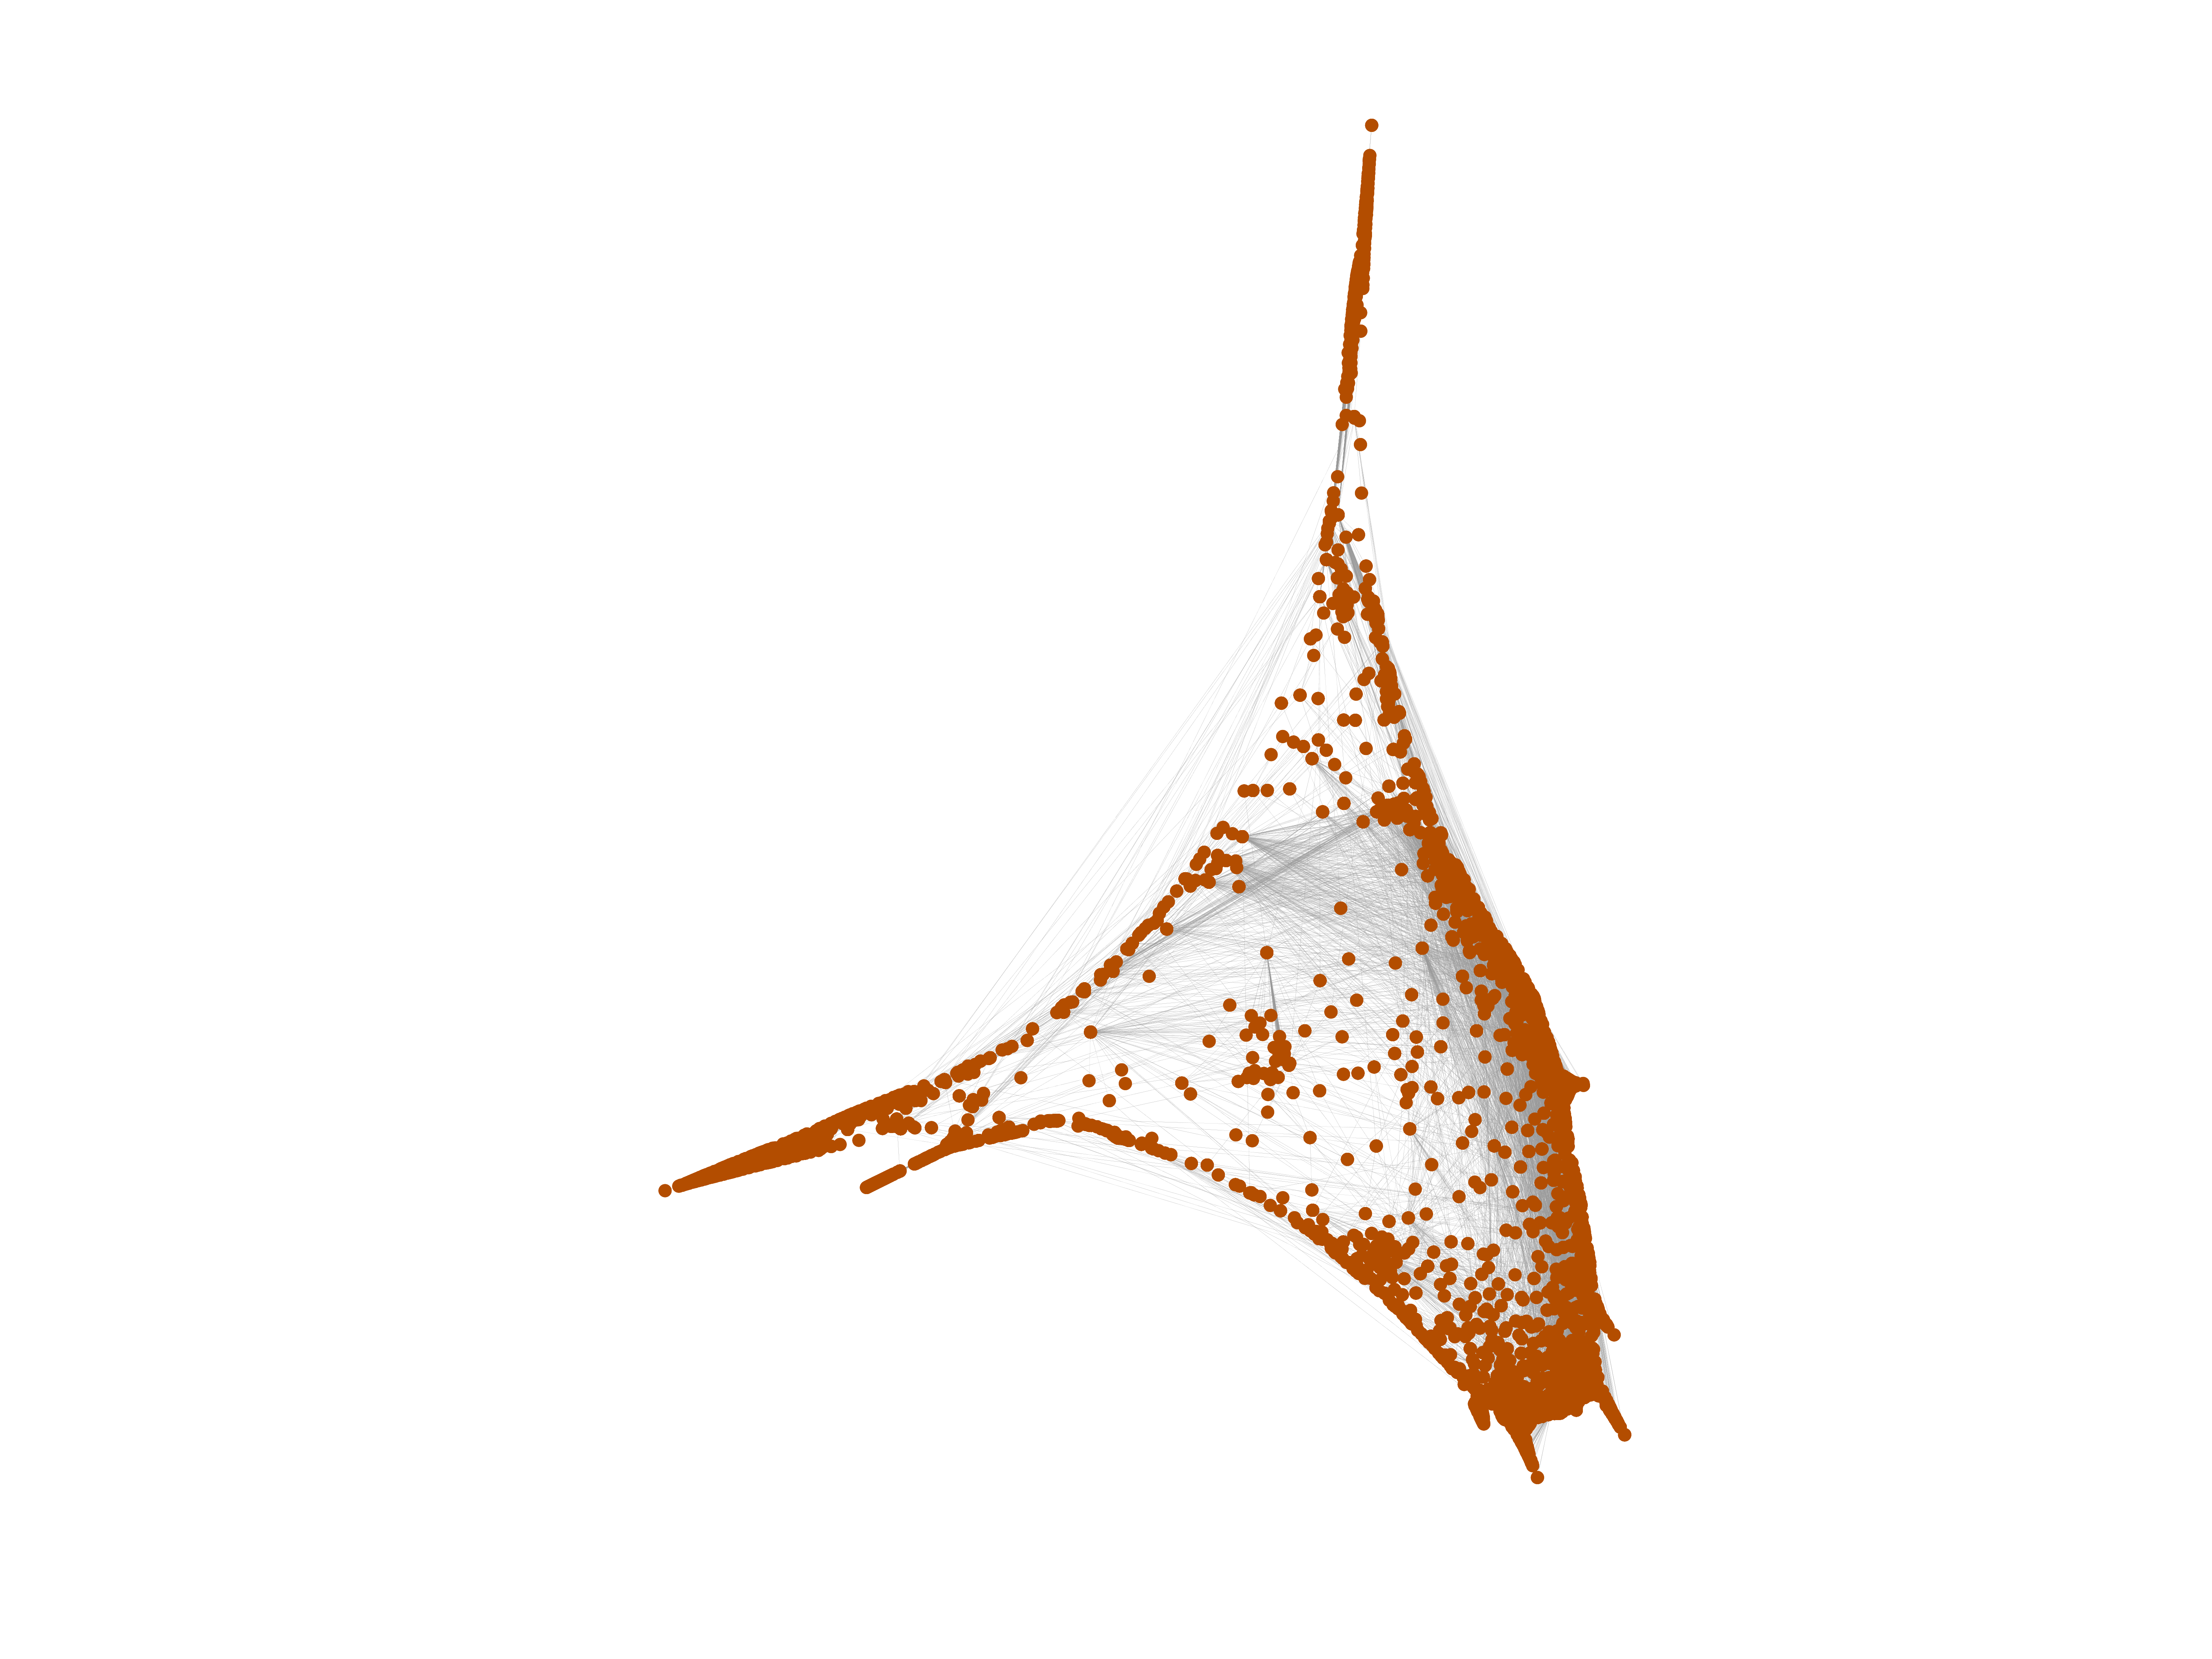
Wikipedia edits (tn)
This is the bipartite edit network of the Tswana Wikipedia. It contains users
and pages from the Tswana Wikipedia, connected by edit events. Each edge
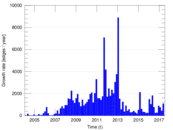
represents an edit. The dataset includes the timestamp of each edit.
Metadata
Statistics
| Size | n = | 3,345
|
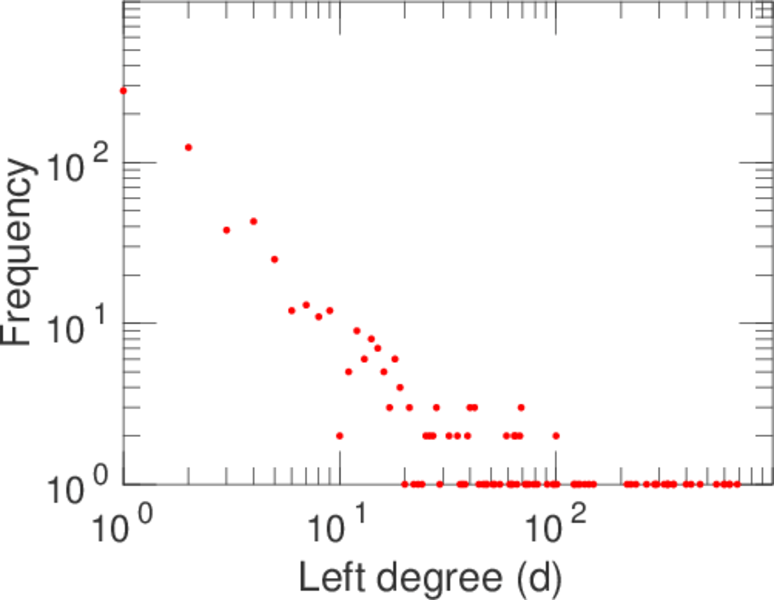
| Left size | n1 = | 706
|
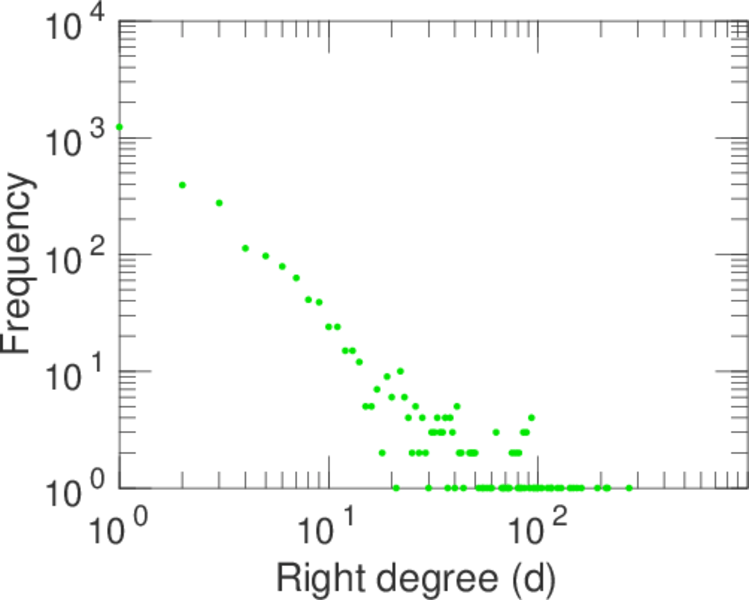
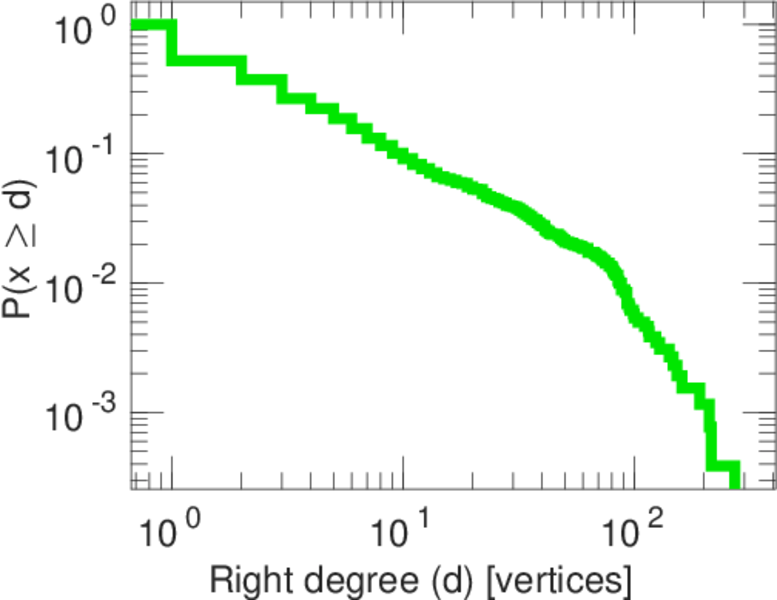
| Right size | n2 = | 2,639
|
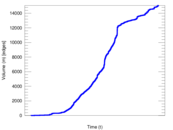
| Volume | m = | 15,071
|
| Unique edge count | m̿ = | 7,611
|
| Wedge count | s = | 522,409
|
| Claw count | z = | 43,364,372
|
| Cross count | x = | 3,815,476,183
|
| Square count | q = | 490,804
|
| 4-Tour count | T4 = | 6,033,898
|
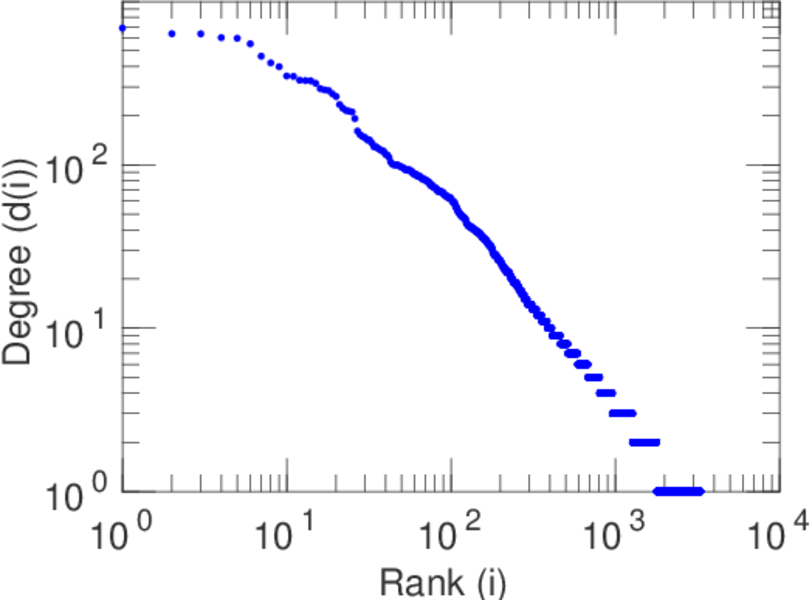
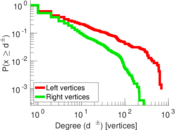
| Maximum degree | dmax = | 688
|
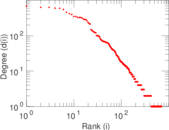
| Maximum left degree | d1max = | 688
|
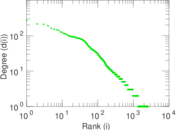
| Maximum right degree | d2max = | 272
|
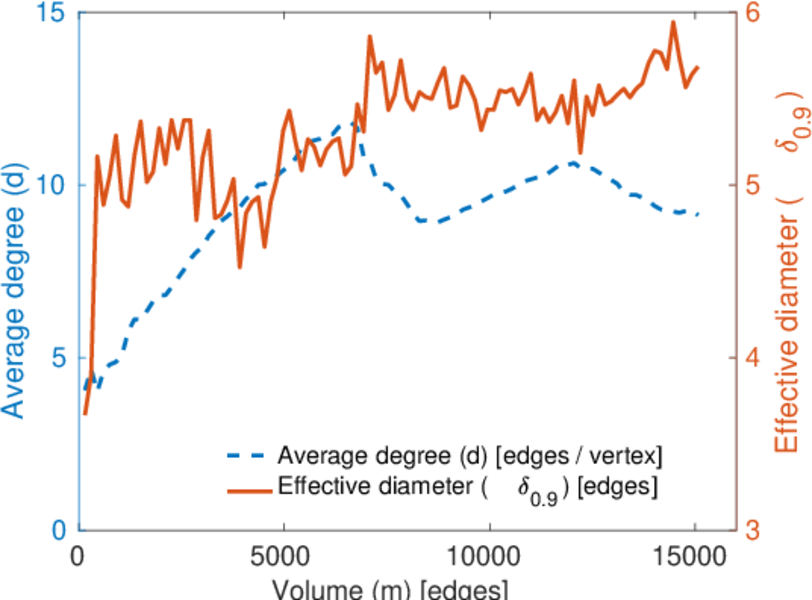
| Average degree | d = | 9.011 06
|
| Average left degree | d1 = | 21.347 0
|
| Average right degree | d2 = | 5.710 88
|
| Fill | p = | 0.004 085 05
|
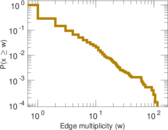
| Average edge multiplicity | m̃ = | 1.980 16
|
| Size of LCC | N = | 2,700
|
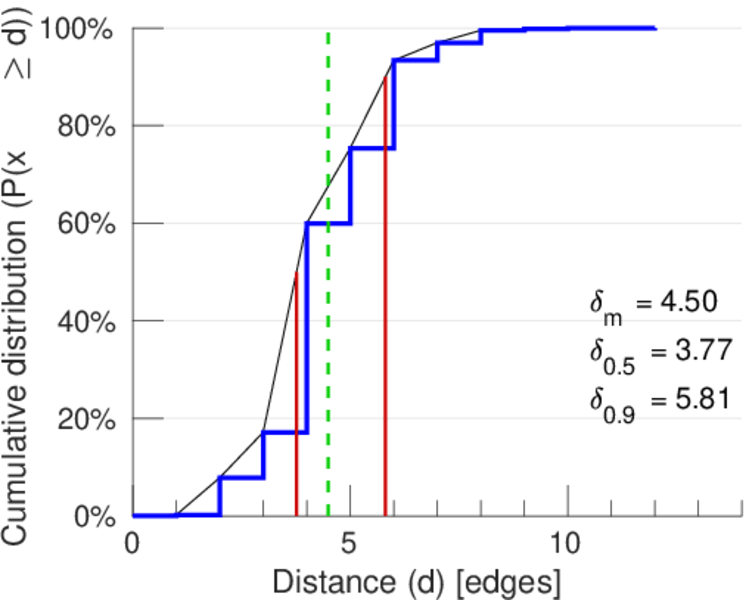
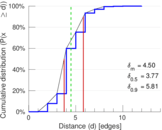
| Diameter | δ = | 14
|
| 50-Percentile effective diameter | δ0.5 = | 3.767 41
|
| 90-Percentile effective diameter | δ0.9 = | 5.813 25
|
| Median distance | δM = | 4
|
| Mean distance | δm = | 4.497 91
|
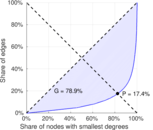
| Gini coefficient | G = | 0.792 435
|
| Balanced inequality ratio | P = | 0.173 081
|
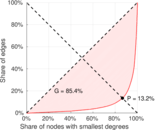
| Left balanced inequality ratio | P1 = | 0.132 440
|
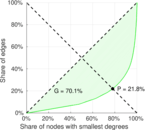
| Right balanced inequality ratio | P2 = | 0.217 968
|
| Relative edge distribution entropy | Her = | 0.833 296
|
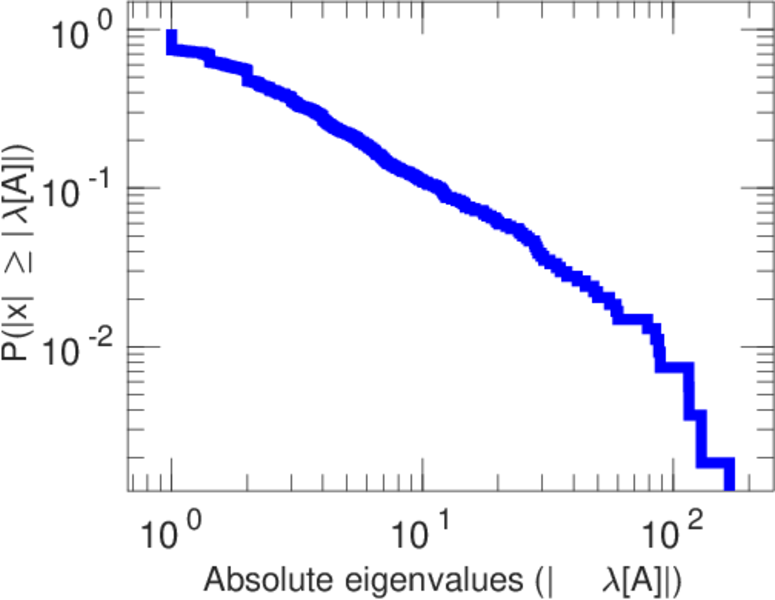
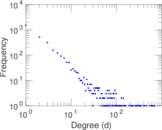
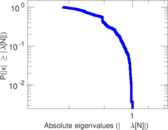
| Power law exponent | γ = | 2.561 12
|
| Tail power law exponent | γt = | 1.931 00
|
| Tail power law exponent with p | γ3 = | 1.931 00
|
| p-value | p = | 0.045 000 0
|
| Left tail power law exponent with p | γ3,1 = | 1.701 00
|
| Left p-value | p1 = | 0.015 000 0
|
| Right tail power law exponent with p | γ3,2 = | 2.011 00
|
| Right p-value | p2 = | 0.001 000 00
|
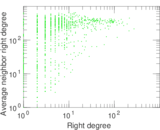
| Degree assortativity | ρ = | −0.151 102
|
| Degree assortativity p-value | pρ = | 4.149 51 × 10−40
|
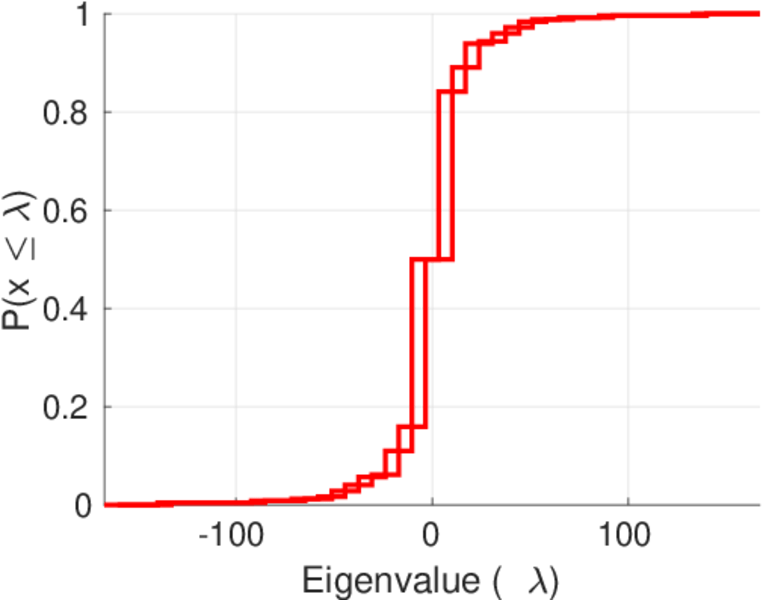
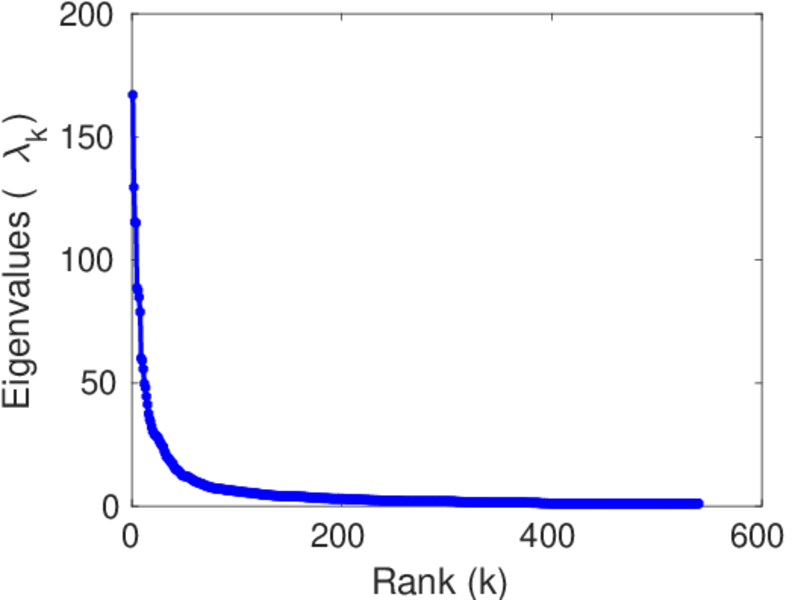
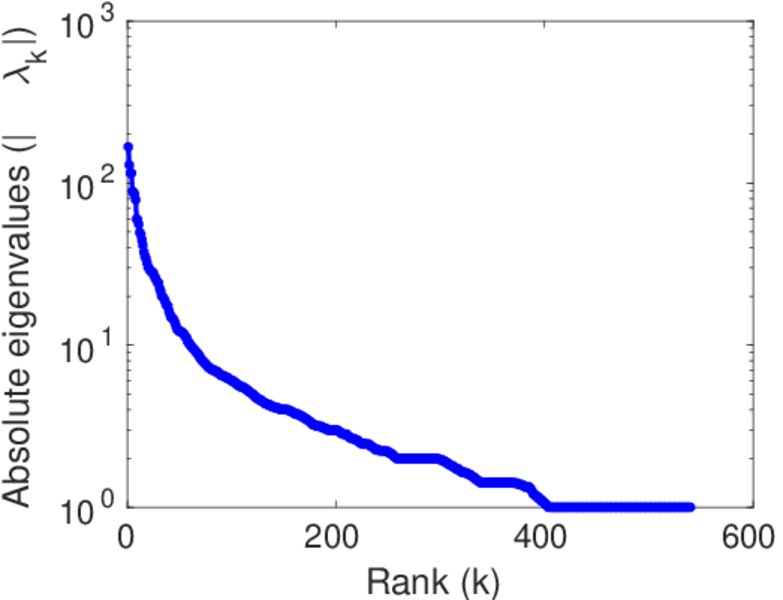
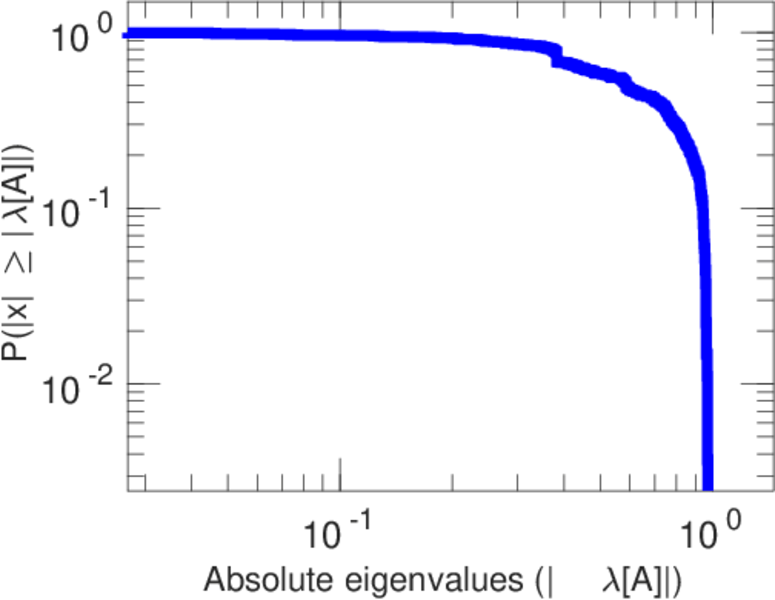
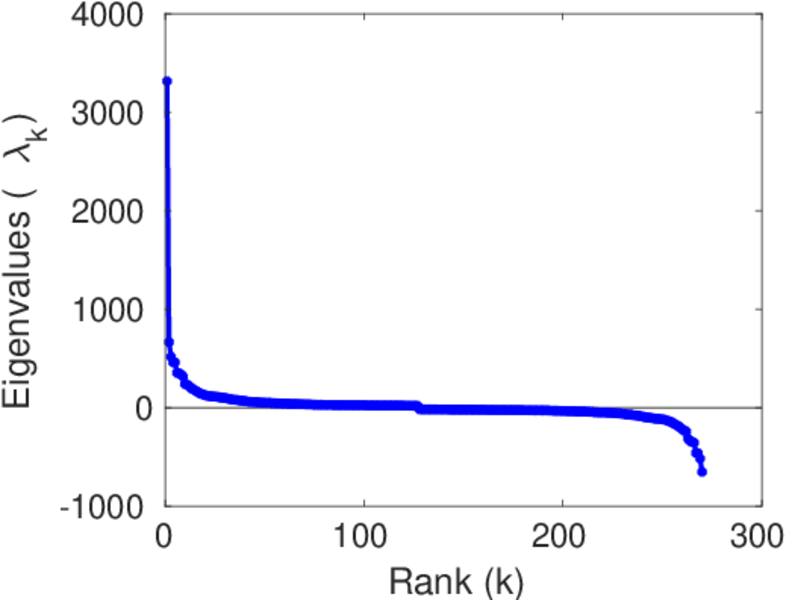
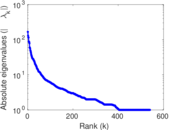
| Spectral norm | α = | 167.017
|
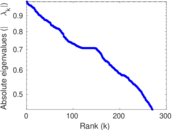
| Algebraic connectivity | a = | 0.026 929 2
|
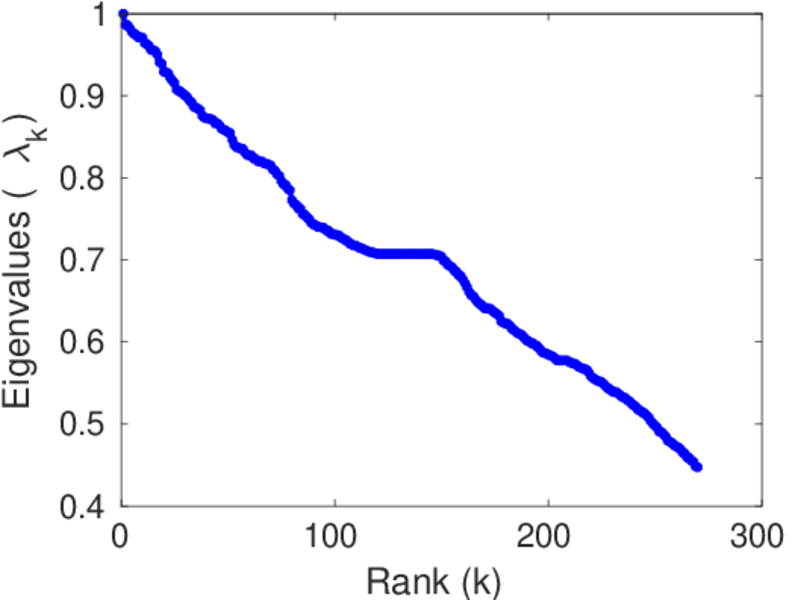
| Spectral separation | |λ1[A] / λ2[A]| = | 1.290 07
|
| Controllability | C = | 1,984
|
| Relative controllability | Cr = | 0.600 484
|
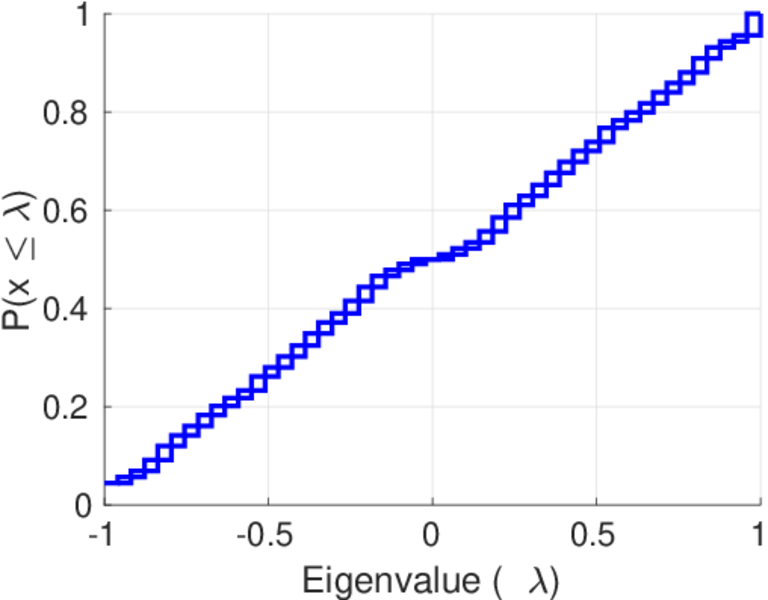
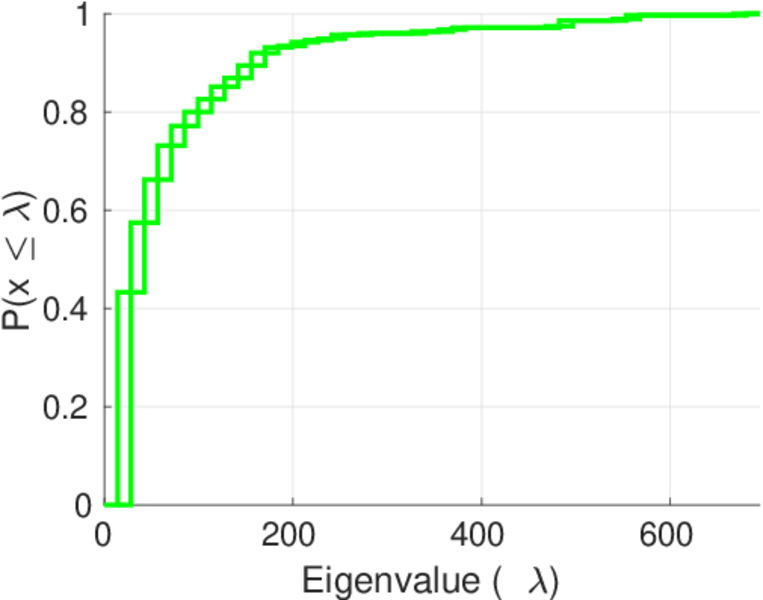
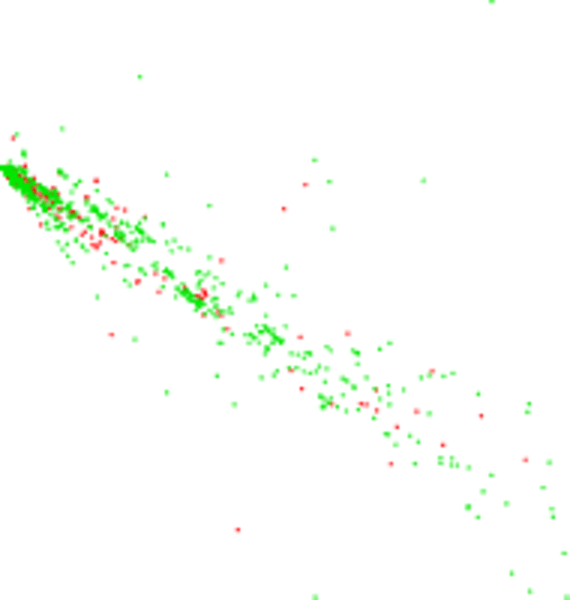
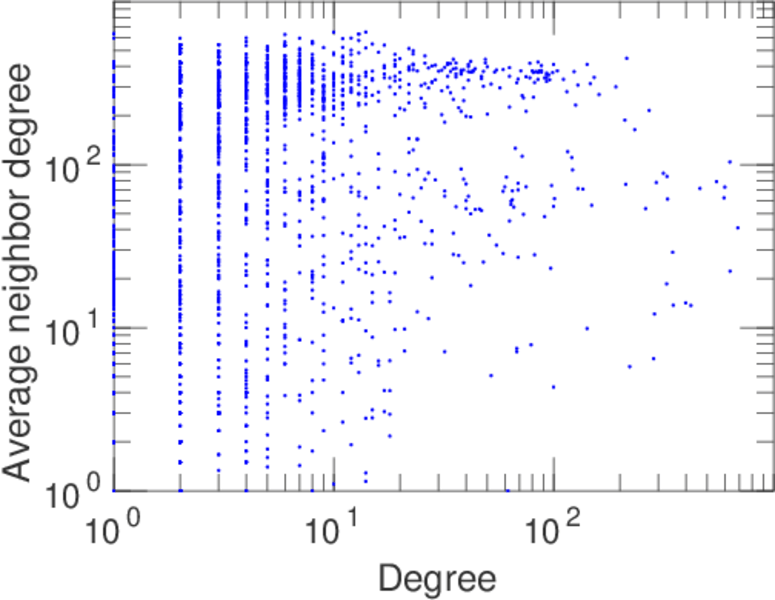
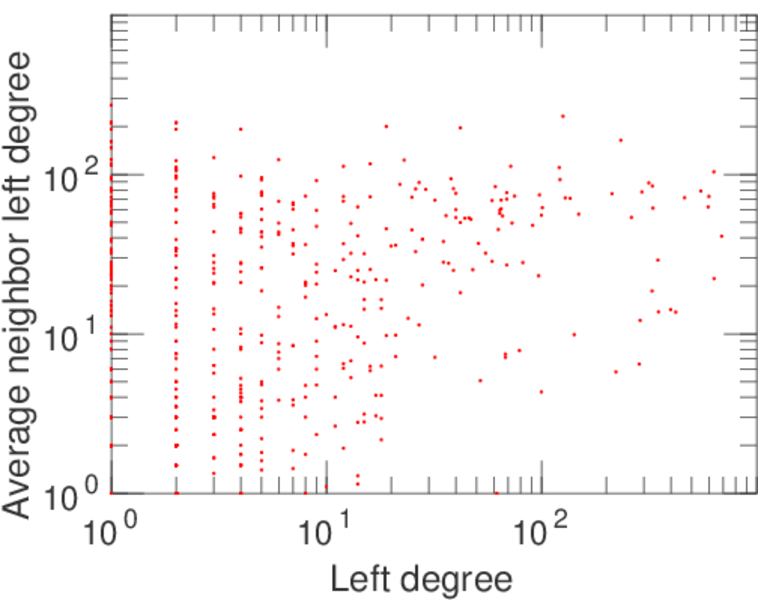
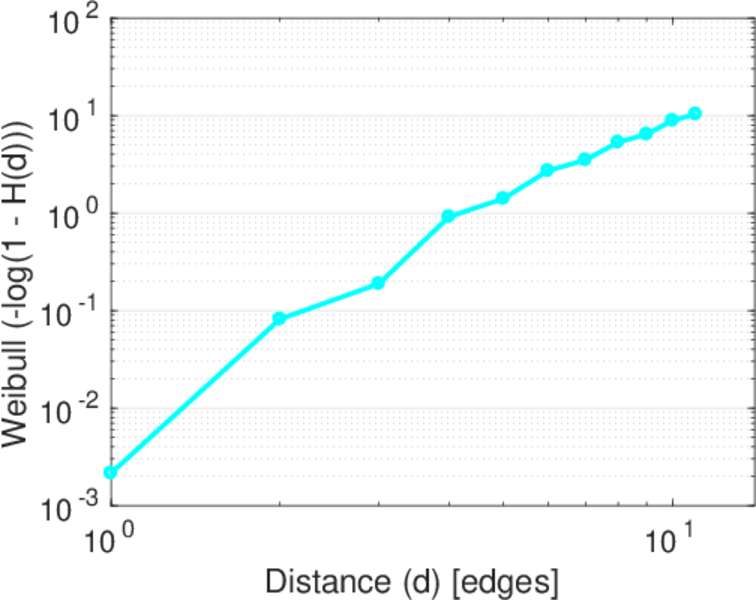
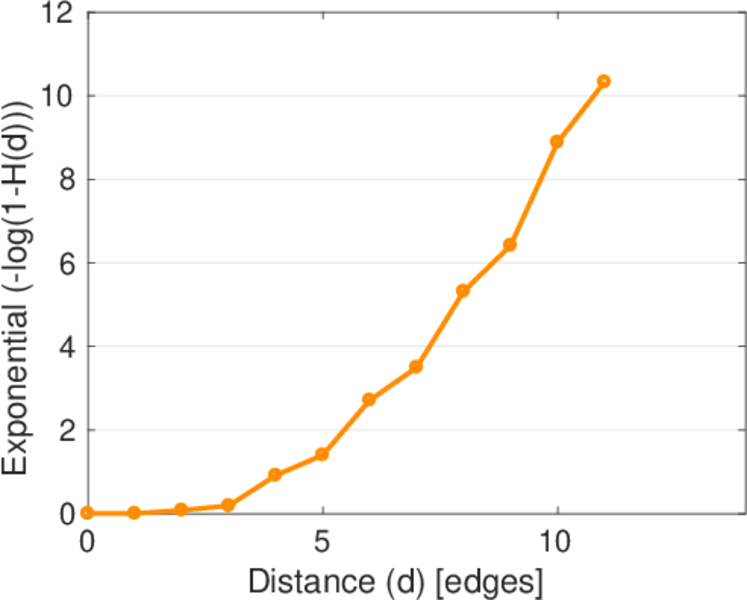
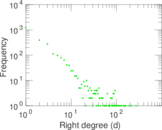
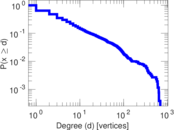
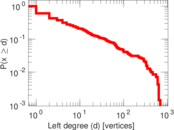
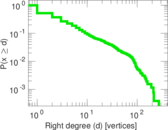
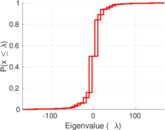
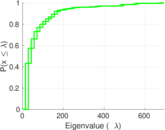
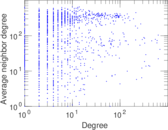
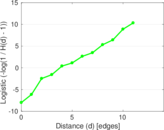
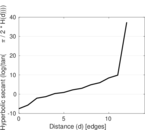
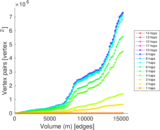
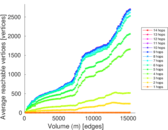
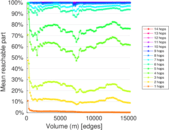
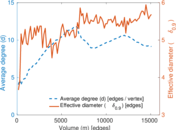
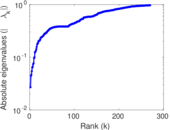
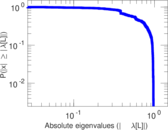
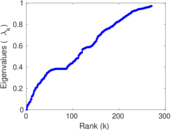
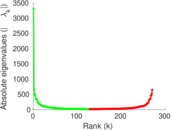
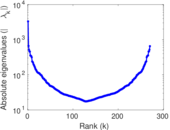
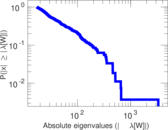
Plots


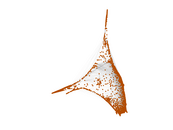


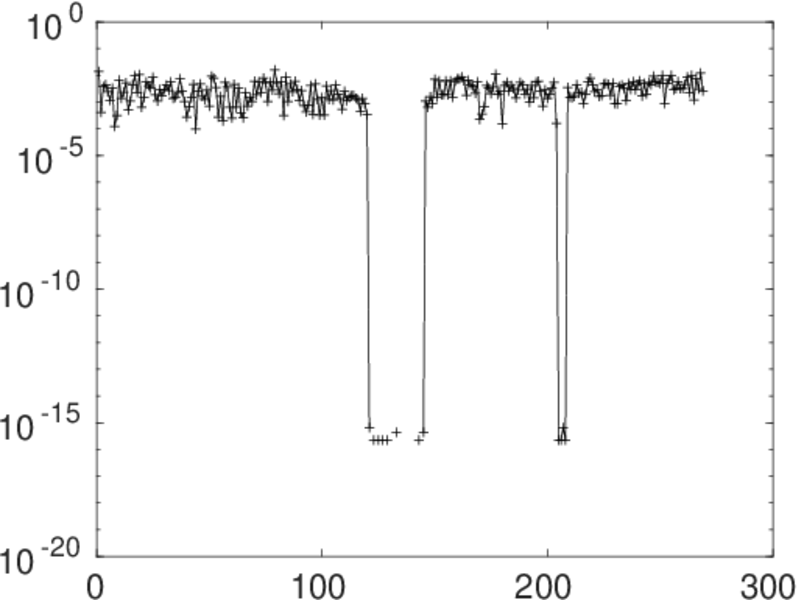
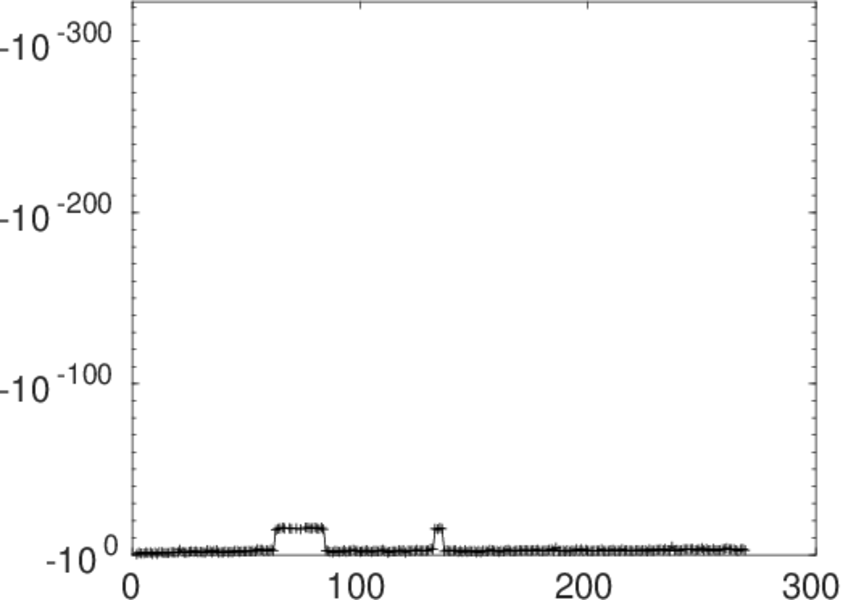
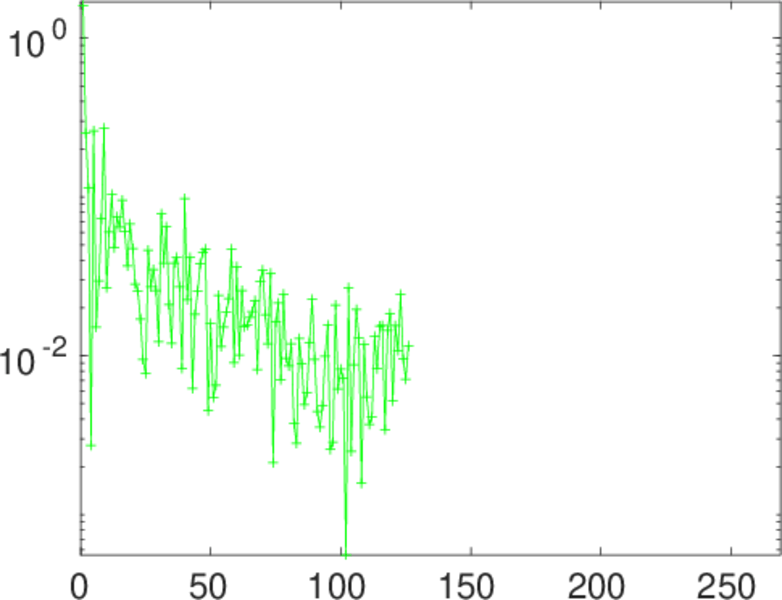
Matrix decompositions plots


Downloads
References
|
[1]
|
Jérôme Kunegis.
KONECT – The Koblenz Network Collection.
In Proc. Int. Conf. on World Wide Web Companion, pages
1343–1350, 2013.
[ http ]
|
|
[2]
|
Wikimedia Foundation.
Wikimedia downloads.
http://dumps.wikimedia.org/, January 2010.
|
 KONECT ‣ Networks ‣
Buy Me a Coffee
KONECT ‣ Networks ‣
Buy Me a Coffee